Article

Machine-Learning-Based Compact Modeling for Sub-3-nm-Node Emerging Transistors

College of Information and Communication Engineering, SungKyunKwan University, Suwon 16419, Korea
*
Authors to whom correspondence should be addressed.
Electronics 2022, 11(17), 2761; https://doi.org/10.3390/electronics11172761
Submission received: 27 July 2022 / Revised: 28 August 2022 / Accepted: 29 August 2022 / Published: 1 September 2022
(This article belongs to the Special Issue Advanced CMOS Devices and Applications)

Abstract

:
In this paper, we present an artificial neural network (ANN)-based compact model to evaluate the characteristics of a nanosheet field-effect transistor (NSFET), which has been highlighted as a next-generation nano-device. To extract data reflecting the accurate physical characteristics of NSFETs, the Sentaurus TCAD (technology computer-aided design) simulator was used. The proposed ANN model accurately and efficiently predicts currents and capacitances of devices using the five proposed key geometric parameters and two voltage biases. A variety of experiments were carried out in order to create a powerful ANN-based compact model using a large amount of data up to the sub-3-nm node. In addition, the activation function, physics-augmented loss function, ANN structure, and preprocessing methods were used for effective and efficient ANN learning. The proposed model was implemented in Verilog-A. Both a global device model and a single-device model were developed, and their accuracy and speed were compared to those of the existing compact model. The proposed ANN-based compact model simulates device characteristics and circuit performances with high accuracy and speed. This is the first time that a machine learning (ML)-based compact model has been demonstrated to be several times faster than the existing compact model.

1. Introduction

According to Moore’s Law, integrated circuits (ICs) have advanced rapidly over the last few decades in the semiconductor industry [1]. The difficulty and cost of improving performance are increasing as the transistors in ICs continue to scale down. To address these issues, new technologies have emerged for transistors (e.g., FinFETs, nanowire FETs (NWFETs), nanosheet FETs (NSFETs), and negative-capacitance FETs (NCFETs)). The iterative real fabrications and evaluations of new nano-transistors require a lot of time and money. Before producing the best transistor, it is crucial to quickly complete transistor modeling and IC simulation in an effort to save time and costs. In circuit simulation, the performance (e.g., power, delay) of a circuit created for a particular technology is assessed. Circuit simulation requires a compact model, which is crucial for effective design and analysis. The existing compact models (e.g., BSIM) are composed of mathematically and physically based device-characteristic equations [2]. However, developing a new compact model suitable for next-generation devices is very complicated, necessitating the involvement of numerous experts, as the development of a sophisticated compact model typically takes several years [3]. To address these shortcomings, researchers are working hard to develop new modeling methodologies for predicting the performance of new devices by using ML methods.

1.1. Related Work

J. Y. Lim et al. developed a model for predicting line edge roughness (LER)-induced performance variation of FinFETs using the ANN technique [4]. Q. Chen et al. employed an ANN technique with three hidden layers. As inputs, the terminal voltages (V g s , V d s ), gate width (W), and gate length (L) of a thin-film transistor were used to build a model that predicted I d s and C g s [5]. K. Ko et al. predicted process variation effects using a gate-all-around (GAA) vertical FET with three hidden layers and four key electrical parameters (work function variation (WFV), gate length (L g ), channel thickness (T c h ), and equivalent oxide thickness (EOT)) [6]. Prior studies have used ANN models to simulate an inverter after predicting the I-V characteristics. A simple NMOS resistive-load inverter was simulated or a CMOS inverter was simulated applying a static or simple voltage as input data [7,8]. Z. Zhang et al. used the ANN technique to predict the I-V curve of a tunnel FET and performed simulations for an inverter, 6T-SRAM, and 2-NAND. However, the simulation speed was not discussed [9]. K. Mehta et al. used ML with an autoencoder algorithm to predict the device characteristics of a small dataset. However, when the accuracy was measured using the R2 score, it was found to be inadequate [10]. F. Klemme et al. modeled the I-V characteristics of a negative-capacitance FinFET, an emerging device, using ML. The number of input data points was used to calculate simulation time and accuracy [3]. The number of neurons in each of the two hidden layers could reach 500, but the modeling error was around 5%. Although the I-V characteristics and process prediction of semiconductor devices have been actively pursued using ML techniques, there are very few studies that model the C-V characteristics properly. Y. Wang, et al. discussed the overall accuracy of ML models and circuit simulations in SPICE [11]. The SPICE simulation speed of the ML-based model was much slower than that of the existing compact model. The overall ML learning speed and SPICE simulation speed were improved using local fitting (a separate model for each device instance). However, because local fitting was learned using only one device, it had a limitation in terms of scalability. The global fitting method covered only 36 devices, but was about five times slower than the local fitting method.

1.2. Contributions

There are models that use ML algorithms, such as autoencoders and convolutional neural networks (CNNs), to reflect the I-V and C-V characteristics of devices [10,12]. An autoencoder allows modeling with less data, but requires many hidden layers and produces noisy predictions. CNN models are excellent in data generation. However, this method requires a large amount of data and is difficult to train, and it is difficult to compute convolutions. A disadvantage of these complex computational methods and many-step models is that the computation time for circuit simulation in SPICE becomes longer. The ANN method used in this paper has demonstrated validity and excellent performance when compared to other regression algorithms [13]. ANNs can accurately predict linear and nonlinear data relationships, allowing them to approximate the physical equations of devices. In addition, because the calculation process is simpler than those in other ML methods, it has the advantage of reducing circuit simulation time when used with SPICE. Therefore, in this paper, we propose a new, powerful ANN-based compact model that can predict the characteristics of an NSFET, which is spotlighted as next-generation sub-3-nm devices. We aggressively expand the device range to sub-3-nm nodes (i.e., gate length (L g ) = 11 nm, sheet thickness (T s h e e t ) = 4 nm, spacer length (L s p ) = 3 nm, and oxide thickness (T o x ) = 1 nm). Various experiments were carried out in order to create a compact model using ML. Instead of feature extraction work, five key geometric parameters that affect global variation and can be controlled by designers were carefully chosen from the existing NSFET research. The proposed modeling framework reduces the complexity of the ML-based model using smaller numbers of hidden layers and neurons, but predicts the I-V and C-V characteristics with high accuracy and speed. The accuracy and speed of the completed ANN-based compact model implemented in Verilog-A were compared to those of the existing compact model in an HSPICE simulation. To the best of our knowledge, this is the first time that a proposed ANN-based compact model has outperformed the recently developed compact model [2].

1.3. Paper Organization

This paper is organized as follows. In Section 2, we present the creation of a dataset for an NSFET device design and the training of the ANN model. Section 3 discusses the input data preprocessing and output data scaling for smooth learning, the structure and techniques of the ANN model, and the overall workflow. Section 4 describes the modeling of the device’s I-V and C-V characteristics. Section 5 shows the simulation results for the XOR, ring oscillator, and 6T-SRAM circuits using HSPICE compared with BSIM-CMG as the reference compact model [2]. Finally, Section 6 summarizes the conclusions of the paper and discusses future work.

2. Device Design and Dataset Generation

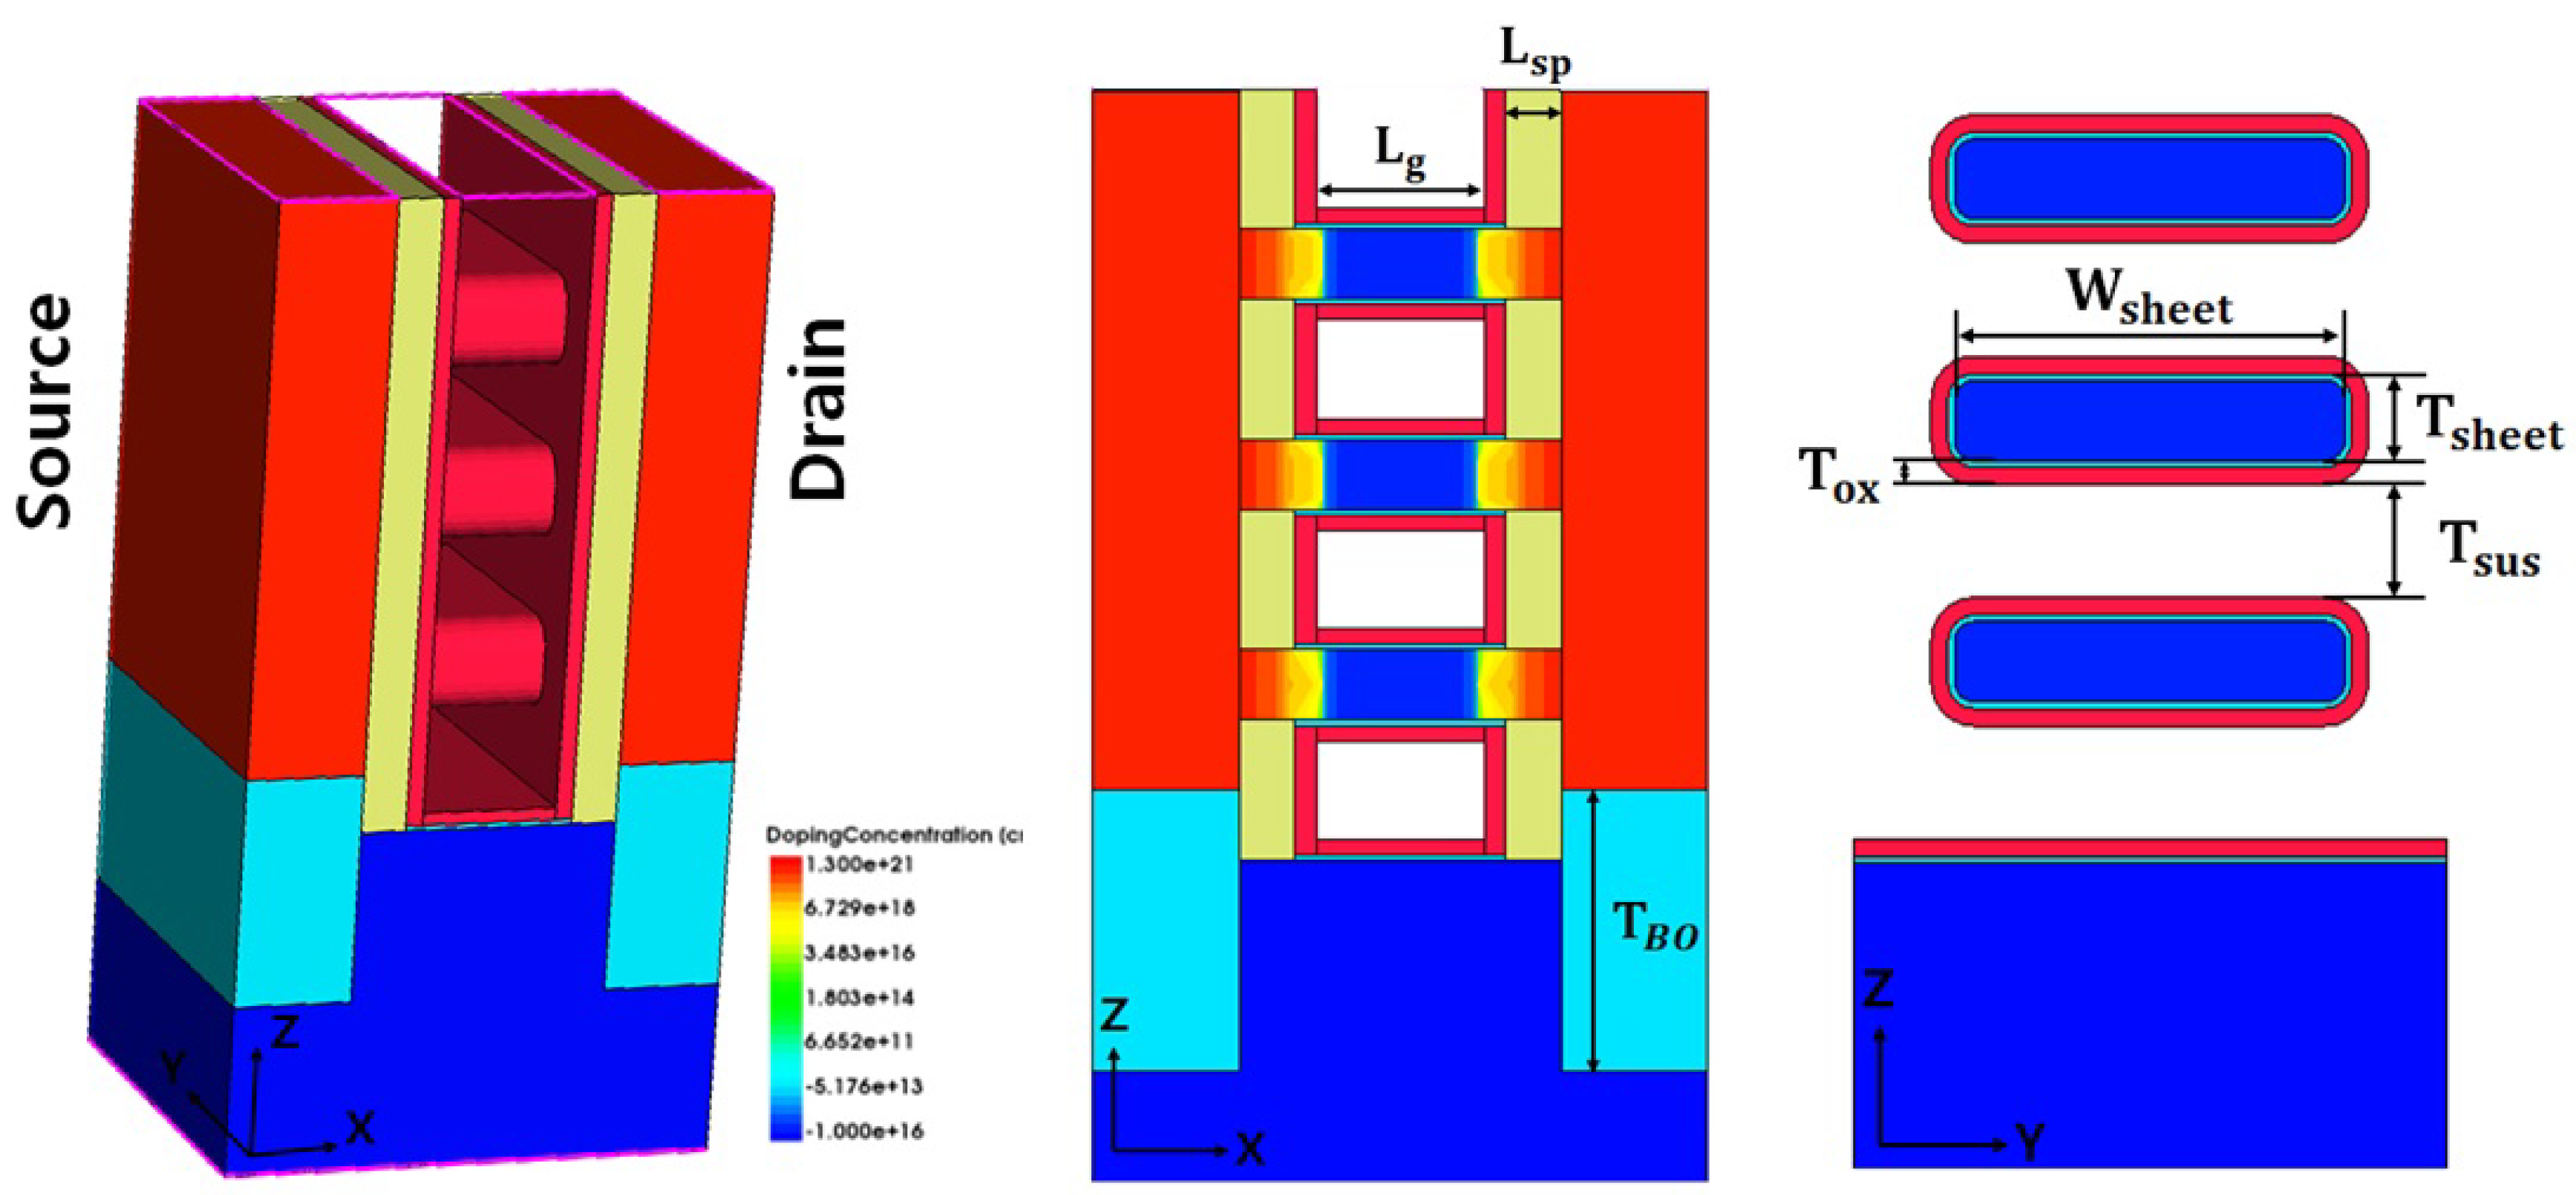
2.1. Process Flow of the Nanosheet FET (NSFET)

The actual NSFET process sequence is as follows. Si and SiGe are sequentially deposited on a wafer, followed by the formation of a dummy poly gate and gate space. In the next step, a dry etch process is performed for the first source/drain (S/D) recess to selectively remove Si/SiGe. A wet etch process is used to create an internal spacer. Then, a second S/D recess is performed to create a space for the bottom oxide to be filled. Chemical vapor deposition (CVD) is used to fill the space left over after the second S/D recess process. Subsequently, S/D growth and implantation are performed. Finally, HfO 2 /TiN formation is accomplished via dummy gate removal and atomic layer deposition (ALD), with stress engineering added to improve hole mobility in the case of PMOS. The contact and wiring processes are not described. In this paper, an NSFET with bottom oxide is designed with this process in mind, and the detailed process flow is described [14].

2.2. Construction of Device Datasets

Using the dataset of an NSFET, which was highlighted as a new device after the FinFET, a compact model based on ML was designed. Compared to a FinFET with a three-sided gate, the NSFET has higher gate control capabilities and a larger effective width at the same size due to its four-sided gate [15]. Figure 1 shows the three-dimensional structure and cross-sectional views of a sub-3-nm-node NSFET designed in accordance with International Technology for Devices and Systems (IRDS) 2021. A device of the sub-3-nm node was designed and simulated using Sentaurus TCAD [16].

2.3. Simulation Conditions

The quantum-potential model and Fermi model were used to study the quantum effects at the nanoscale. The movement of carriers in the low electric field along the short channel length were captured using a quasi-ballistic mobility model. For remote phonon and coulomb scattering effects, the Lombardi model was used, where the inversion and accumulation layer model was used to account for surface roughness caused by impurities and phonons in the thin layer. To account for bandgap changes caused by doping, the Slotboom bandgap narrowing model was applied to all regions of the semiconductor [17]. The Shockley–Read–Hall (SRH), Auger, and SurfaceSRH models were used as recombination models, and the band-to-band tunneling (BTBT) model was used to consider the tunneling and quantum confinement of small devices [18,19]. The stress-induced hole mobility in PMOS was studied using the h-multivalley model [16]. The sub-band model was used among the piezo models to apply the quasi-Fermi energy level based on doping, and the silicon <110> direction was used for the channel direction [20]. Each carrier valley change due to stress was calculated using the deformation potential model [21]. Calibration to the actual I-V data of IBM 3-nm NSFETs was performed to demonstrate the validity of the physical formula applied to TCAD. Figure 2 shows the calibration results [22]. Figure 3 shows the characteristics of the 3-nm NSFET generated using the physics formula after calibration. Figure 3a displays the I-V symmetry of N-type and P-type NSFETs, while Figure 3b shows the gate capacitance. Table 1 shows the electrical characteristics obtained using the TCAD simulation.

2.4. Construction of Device Datasets

The ranges of calibration and the data split were determined based on the IRDS roadmap organized down to the 1.5 nm node and actual data published by IBM, as shown in Table 2 [23]. Compared to previously reported 36 devices [11], 405 devices were created by selecting the five most important structural parameters in the NSFET and splitting them based on the application scope. The I-V and C-V characteristics were extracted to create datasets. Table 2 contains information about the created datasets. The TCAD simulator was used to create the dataset based on a temperature of 27 °C. Section 5 confirms that the five structural parameters chosen accurately represent the device characteristics. Existing papers were organized around typical values, but we conducted research on devices that had undergone sub-3-nm scaling (i.e., L g = 11 nm, T s h e e t = 4 nm, L s p = 3 nm, T o x = 1 nm). Because the device characteristics were nonlinearly dependent on structural parameters, it was difficult to predict the exact characteristics of the devices with different structural parameters when limited to a narrow range, as illustrated in Figure 4. The use of differently sized devices in one circuit, such as in an SRAM cell, is difficult to model. The global device modeling method presented in this paper, which covers multiple devices with a single model, is an approach that can foster collaboration between designers and process engineers. Furthermore, the proposed ANN model can reduce the use of TCAD data because it can predict with high accuracy the characteristics of devices with untrained structural parameters.

3. ANN Model Architecture and Methodology

3.1. The Architecture of the Proposed ANN Model

The proposed model architecture using the ANN structure is shown in Figure 5. The calculation method of the ANN model is formulated in Equation (1). As shown in Table 2, the model of the I-V characteristics of the 405 devices composed of a combination of 5 key parameters has one input layer, two hidden layers, and one output layer. The numbers of neurons in the hidden layers are 20 and 15, respectively. The C-V characteristics of the 405 devices are less complex than that of the I-V characteristics. One input layer, two hidden layers, and one output layer comprise the model of the C-V characteristics. We reduced the complexity of the ANN model using a model with 10 and 5 neurons in the hidden layers, respectively. As input values, five important geometric parameters of the NSFET were chosen, and two terminal voltage biases were used. The I-V and C-V characteristics of the 405 devices were used as output values. The five chosen key parameters had the advantage of being able to replace the dimension reduction processes, such as PCA (principal component analysis), used for many parameters of the traditional compact model, and they still accurately represent the I-V and C-V characteristics, as verified in Section 5.
Y = W 3 × g ( W 2 × g ( W 1 × X + B 1 ) + B 2 ) + B 3
In ML, the loss function is critical. When a model is trained, it learns in the direction of minimizing the loss function. The loss function of the proposed ANN model takes the device physics into account. α , β , and γ were multiplied by each operation region of the device to determine the loss. To reduce errors in the medium region and ON region, which are important in device operation, weights of α = 1, β = 2, and γ = 3 were multiplied (the value was adjusted so that the ON region’s error was less than 1%). The physics-augmented loss function had the advantage of being easily adjusted based on the operation region where the error is to be reduced. Equation (2) represents the physics-augmented loss function.
L o s s f u n c t i o n = 1 n i = 1 n ( α ( y t r u e , o f f y p r e d , o f f ) 2 + β ( y t r u e , m e d i u m y p r e d , m e d i u m ) 2 + γ ( y t r u e , h i g h y p r e d , h i g h ) 2 )
The ADAM optimizer was used in the learning process. A continuous and smooth activation function, the hyperbolic tangent function (tanh), was used. One of the hyperparameters that has a significant impact on learning outcomes is the learning rate. As a result, one of the learning rate scheduler methods, ReduceLROnPlateau Scheduler, was used. The ReduceLROnPlateau scheduler technique is one of several methods employed to reduce the learning rate and continue learning by multiplying the learning rate by a constant factor if the value of the valid loss remains constant for a certain period of time during training. Early stopping was also used to prevent overfitting, which is a major issue in ML.

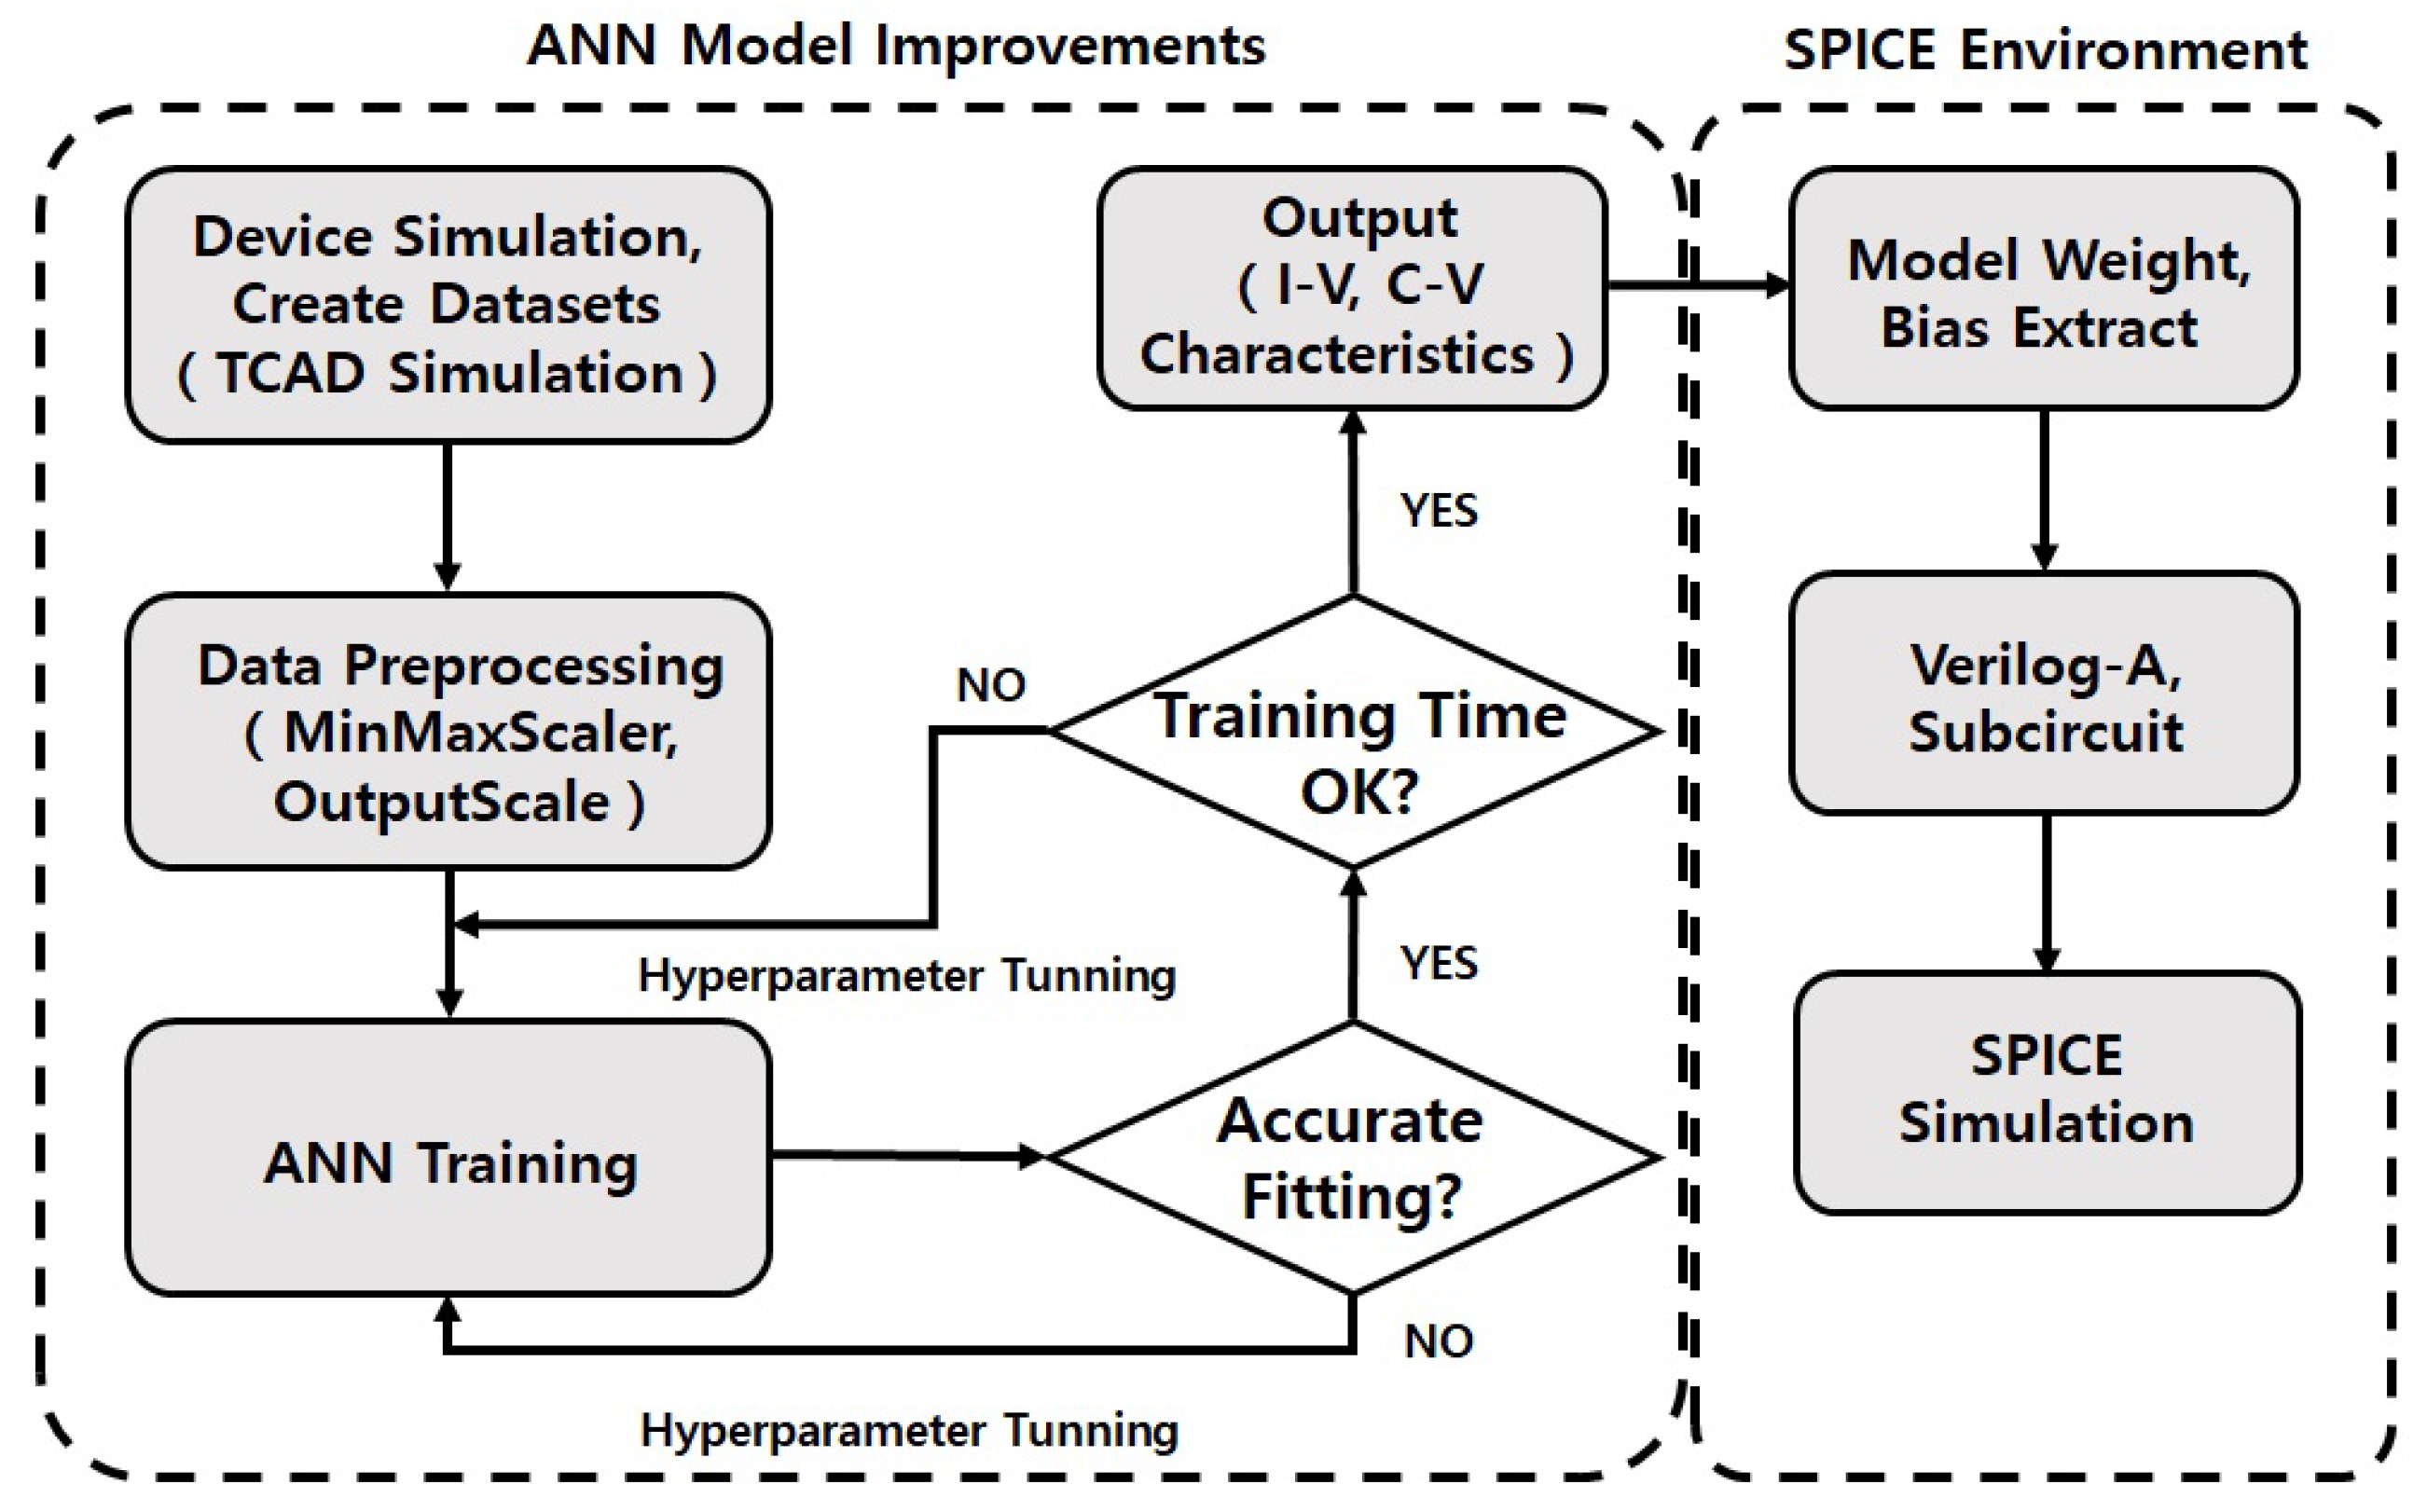
3.2. The Workflow of the ANN Model

Figure 6 shows the workflow for the ANN modeling and SPICE simulation. Following the selection of the devices and key parameters, datasets were created based on the split range. After the datasets were prepared, the data to be applied to the input and output were preprocessed. Learning is greatly influenced by data preprocessing. The interpolation process that converted the data generated by the error during the TCAD simulation to obtain original electrical characteristics was first performed in the data preprocessing. When input parameters (e.g., structures, terminal voltage parameters) and output parameters (e.g., electric characteristics) are applied directly to ANN model learning, there is a difference of several million units, which prevents smooth learning. Because the input parameters had different split ranges, the data distribution was standardized. For example, the oxide thickness range included 1, 1.5, and 2 nm with three split ranges, and the sheet width ranged from 21 to 29 nm with five split ranges. Minmaxscaler was used as a preprocessing method to rearrange the units of input parameters in the range of 0 to 1. The Minmaxscaler is formulated in Equation (3).
x i n e w = x i m i n ( x ) m a x ( x ) m i n ( x )
In the case of output parameters, there was a difference of several million units or more in the I-V characteristics between the ON and OFF regions. Thus, the prediction was made in an intermediate unit during learning. As a preprocessing method for the output parameters, logarithmic adjustment was used to convert a unit difference of millions or more into a unit difference of about 10. k was the scaling factor that was multiplied to convert the predicted y value into a positive number. The value of k was set to 10 14 . In addition, when V d s = 0, the simulation result of I d s = 0 was not produced in the TCAD simulation. Furthermore, the output parameters were changed in the same way as in Equation (4) to reflect that I d s = 0 when the drain and source were not specifically determined in the NSFET characteristics and V d s = 0 [11].
I d s = l o g 10 k × I d s V d s
After data preprocessing, the ANN model was trained. We adjusted the hyperparameters if the accuracy of the ANN model was poor or the training time was too long (e.g., the number of neurons in the hidden layer, activation function, learning rate). After the ANN model was trained, the weight and bias values were determined. After implementing the ANN model formula in Verilog-A, a model with the same effect as the trained ANN model was applied to HSPICE to perform circuit simulation. The circuit simulation portion will be covered in Section 5. Pandas and the Sklearn library were used for data preprocessing. The Pytorch library was used in the ANN model. All work was created using the Python programming language [24].

4. ANN Model Training and Results

The NSFET dataset used for training the ANN model was divided into 80% training data, 10% validation data, and 10% test data. The validation data were used to evaluate and optimize the updated model during training, and the test data were used to evaluate the model after training with 40 unseen devices chosen at random from a pool of 405 devices. Figure 7 and Figure 8 show a comparison of the TCAD simulation dataset and ANN prediction data. Figure 7 shows the results of the I-V characteristics, while Figure 8 displays the results of the C-V characteristics.
The errors of the I-V characteristics were 2.5%, 2.0%, and 1.0% for the OFF region (logarithmic scale of 0.2%, V g s = 0.0 to 0.2 Volt), medium V g s region (V g s = 0.2 to 0.5 Volt), and high V g s region (V g s = 0.5 to 0.7 Volt), respectively.
The errors of the C-V characteristics were 1.3% for C g g , 1.5% for C g d , and 1.5% for C g s . These findings indicate that the proposed ANN model is capable of high-accuracy global fitting. Existing compact models employ the binning method because it is difficult to achieve accuracy within 1–2% error using a single-model parameter set, even after parameter extraction through more than 10 complicated processes. The presented ANN model can form a global device model with a smaller error using a simpler process. Previously published ANN models of next-generation transistors have more complex structures, higher computational costs, and longer training times (hours to learn). However, the proposed ANN model reduces the computational cost and training time by using fewer hidden layers and neurons than existing ANN models while maintaining higher accuracy. Both the ANN I-V model and ANN C-V model used one million epochs, where the training times were about 1 h.

5. SPICE Simulation of Circuits Using the Developed ANN Models

The SPICE simulations using the developed ANN model are summarized in this section. Three circuits were simulated to validate the ANN-based compact model. The operation of the XOR circuit, which is one of the complex combinational logic gates, was verified, and the ring oscillator was chosen to verify the transient operation. Finally, the operation margins of the 6T-SRAM circuit with various structural parameters were simulated. HSPICE was chosen for circuit simulation using the ANN-based compact model. Verilog-A is a de facto standard modeling language that allows model developers to focus on modeling while significantly reducing the development time. There is a published example of how to efficiently write a compact model in Verilog-A [25]. After learning the ANN I-V and ANN C-V models, the ANN-based compact model was built in Verilog-A using the weights and biases of the ANN structure. The simulation time was reduced during the construction of the ANN-based compact model by removing unnecessary ‘for’ and ‘list’ statements. For accuracy verification, data extracted from BSIM-CMG were used and compared to those of the ANN-based compact model.

5.1. XOR, Ring Oscillator, and SRAM Simulation

Figure 9 shows a graph comparing XOR gate simulation between the ANN-based compact model and BSIM-CMG. For the XOR gate simulation, the first input voltage was 0.7 V with a period of 2 ns, and the second was 0.7 V with a period of 4.5 ns. Figure 10 shows a graph comparing the 17-stage ring oscillator simulation of the ANN-based compact model to that of BSIM-CMG. The initial voltage was set to 0 V, and the simulation was performed over a 1-ns transient period.
Figure 11 shows the 6T-SRAM simulation results for the hold, read, and write operation margins [26]. In the 6T-SRAM simulation, the device width was set to 1:a:b in order to account for the static noise margin (SNM) [27]. Table 3 shows the simulation results and errors between the ANN-based compact model and BSIM-CMG for each circuit. The proposed ANN-based compact model built in Verilog-A achieved a high accuracy of about 1% in all three circuit simulations, except for the SRAM read margin.

5.2. SPICE Simulation Performance Comparison

We compared the simulation speeds of the ANN-based compact model and BSIM-CMG in Verilog-A. Because the simulation of a small circuit was completed quickly, in order to clearly investigate the speed comparison, each simulation was completed with 1000 iterations using the Monte Carlo method in HSPICE. The simulation speed was measured while increasing the number of stages of the ring oscillator.

5.2.1. Global Device Model

Figure 12 shows the simulation time for the proposed ANN-based compact model and the BSIM-CMG Verilog-A version. The results demonstrate that the ANN-based compact model written in Verilog-A was more than twice as fast as BSIM-CMG. Because the ANN-based compact model primarily computes multiplication and activation functions and is simpler than BSIM-CMG, it is more than twice as fast [28].

5.2.2. Single-Device Model

A single-device model was built because it is much more efficient than the global device model when a circuit does not require separate device sizing. The amount of data in a single device is relatively small. The single I-V model, like the global device model, had two hidden layers, but with 15 and 10 fewer nodes, respectively. The C-V model had only one hidden layer with five nodes. The single-device model had fewer nodes than the global device model, but was faster and more accurate, with less than 0.3% prediction error. As shown in Figure 13, the speed of the single-device model was approximately twice as fast as the global device model due to its greater conciseness. Based on the experimental results shown in Figure 12 and Figure 13, if the ANN-based compact model is embedded in HSPICE using the C programming language, it is predicted to be several times faster than BSIM-CMG (blue dashed line), as shown by the red dashed line at the bottom of Figure 13. Table 4 compares the characteristics of the single-device and the global device models.

6. Conclusions

In this paper, an ANN-based compact model was developed to predict the I-V and C-V characteristics of 405 NSFETs, including all typical devices and sub-3-nm devices. This approach can be very useful when designers and process engineers work together. The ANN model was created by selecting five key geometric parameters. Even after using a large number of global device datasets (405), fewer neurons and hidden layers were used to reduce the complexity of the ANN model and accurately perform device modeling at a high speed. It was confirmed that the five geometric parameters chosen were able to represent more than 98% of the I-V and C-V characteristics. When tested on the datasets that were not included in training, the predicted values of the ANN model and TCAD simulations matched very closely. Additionally, the TCAD data usage was effectively reduced. The ANN-based compact model was implemented in Verilog-A. The modeling flow was automated using Python. The ANN-based compact model proposed in this work is approximately two times faster than the SPICE simulation of the existing compact model, and it can be further accelerated by 2–3 times by using a single-device model. The accuracy of the proposed ANN-based compact model was also demonstrated through simulations of XOR, ring oscillators, and SRAM circuits. In addition, the physics-augmented loss function can be used to reduce the error in the desired operation region. The developed ANN-based compact modeling framework is being expanded and applied to a negative-capacitance NSFET. In addition, ANN-based statistical analyses will be performed to reflect global and local variations.

Author Contributions

S.W., H.J. and J.C. contributed to the writing of this article. S.W. and H.J. contributed to the primary idea of this research. J.C. and H.C. performed the simulations. This research was planned and executed under the supervision of J.-T.K. and S.K. All authors have read and agreed to the submitted version of the manuscript.

Funding

This work was supported by an Institute of Information and Communications Technology Planning Evaluation (IITP) grant funded by the Korean government (MSIT) (No. 2021-0-00754, Software Systems for AI Semiconductor Design) and by a National Research Foundation of Korea grant funded by the Korean government (MISP) (NRF-2020R1A2C1011831, 2020R1A5A1019649).

Acknowledgments

The EDA tools were supported by the IC Design Education Center (IDEC), Korea.

Conflicts of Interest

The authors declare no conflict of interest.

References

  1. Root, D.E. Future Device Modeling Trends. IEEE Microw. Mag. 2012, 13, 45–59. [Google Scholar] [CrossRef]
  2. Dunga, M.V.; Lin, C.-H.; Niknejad, A.M.; Hu, C. BSIM-CMG: A Compact Model for Multi-Gate Transistors. In FinFETs and Other Multi-Gate Transistors; Springer: Berlin/Heidelberg, Germany, 2008; pp. 113–153. [Google Scholar]
  3. Klemme, F.; Prinz, J.; Santen, V.M.V.; Henkel, J.; Amrouch, H. Modeling Emerging Technologies Using Machine Learning: Challenges and Opportunities. In Proceedings of the 2020 International Conference on Computer-Aided Design, New York, NY, USA, 2–5 November 2020. [Google Scholar]
  4. Lim, J.H.; Shin, C.H. Machine Learning (ML)-Based Model to Characterize the Line Edge Roughness (LER)-Induced Random Variation in FinFET. IEEE Access 2020, 8, 158237–158242. [Google Scholar] [CrossRef]
  5. Chen, Q.; Chen, G. Artificial Neural Network Compact Model for TFTs. In Proceedings of the 2016 International Conference on Computer Aided Design for Thin-Film Transistor Technologies, Beijing, China, 26–28 October 2016. [Google Scholar]
  6. Ko, K.; Lee, J.K.; Kang, M.G.; Jeon, J.W.; Shin, H.C. Prediction of Process Variation Effect for Ultrascaled GAA Vertical FET Devices Using a Machine Learning Approach. IEEE Trans. Electron Devices 2019, 66, 4474–4477. [Google Scholar] [CrossRef]
  7. Lei, Y.; Huo, X.; Yan, B. Deep Neural Network for Device Modeling. In Proceedings of the 2018 IEEE Electron Devices Technology and Manufacturing Conference, Kobe, Japan, 13–16 March 2018. [Google Scholar]
  8. Zhang, L.; Chan, M. Artificial Neural Network Design for Compact Modeling of Generic Transistors. J. Comput. Electron. 2017, 16, 825–832. [Google Scholar] [CrossRef]
  9. Zhang, Z.; Wang, R.; Chen, C.; Huang, Q.; Wang, Y.; Hu, C.; Wu, D.; Wang, J.; Huang, R. New-Generation Design-Technology Co-Optimization (DTCO): Machine-Learning Assisted Modeling Framework. In Proceedings of the 2019 Silicon Nanoelectronics Workshop, Kyoto, Japan, 9–10 June 2019. [Google Scholar]
  10. Mehta, K.; Wong, H. Prediction of FinFET Current-Voltage and Capacitance-Voltage Curves Using Machine Learning with Autoencoder. IEEE Electron Device Lett. 2021, 42, 136–139. [Google Scholar] [CrossRef]
  11. Wang, J.; Kim, Y.H.; Ryu, J.S.; Jeong, C.W.; Choi, W.S.; Kim, D.S. Artificial Neural Network-Based Compact Modeling Methodology for Advanced Transistors. IEEE Trans. Electron Devices 2021, 68, 1318–1325. [Google Scholar] [CrossRef]
  12. Hirtz, T.; Huurman, S.; Tian, H.; Yang, Y.; Ren, T.-L. Framework for TCAD augmented machine learning on multi-I-V characteristics using convolutional neural network and multiprocessing. J. Semicond. 2021, 42, 124101. [Google Scholar] [CrossRef]
  13. Shirakawa, K.; Shimiz, M.; Okubo, N.; Daido, Y. A Large-Signal Characterization of an HEMT Using a Multilayered Neural Network. IEEE Trans. Microw. Theory Tech. 1997, 45, 1630–1633. [Google Scholar] [CrossRef]
  14. Yoo, S.; Kim, S. Leakage Optimization of the Buried Oxide Substrate of Nanosheet Field-Effect Transistors. IEEE Trans. Electron Devices 2022, 69, 4109–4114. [Google Scholar] [CrossRef]
  15. Kim, S.-D.; Guillorn, M.; Lauer, I.; Oldiges, P.; Hook, T.; Na, M.-H. Performance Trade-offs in FinFET and Gate-All-Around Device Architecture for 7nm-node and Beyond. In Proceedings of the 2015 SOI-3D-Subthreshold Microelectronics Technology Unified Conference, Rohnert Park, CA, USA, 5–8 October 2015. [Google Scholar]
  16. Synopsys Inc. Sentaurus Device, User Manual, Version Y-2019; Synopsys Inc.: Mountain View, CA, USA, 2019. [Google Scholar]
  17. Yoon, J.-S.; Jeong, J.; Lee, S.; Baek, R.-H. Optimization of nanosheet number and width of multi-stacked nanosheet FETs for sub-7-nm node system on chip applications. Jpn. J. Appl. Phys. 2019, 58, SBBA12. [Google Scholar] [CrossRef]
  18. Ryu, D.; Kim, M.; Yu, J.; Kim, S.; Lee, J.-H.; Park, B.-G. Investigation of Sidewall High-k Interfacial Layer Effect in Gata-All-Around Structure. IEEE Trans. Electron Devices 2020, 67, 1859–1863. [Google Scholar] [CrossRef]
  19. Yoon, J.-S.; Jeong, J.; Lee, S.; Baek, R.-H. Systematic DC/AC Performance Benchmarking of Sub-7-nm Node FinFETs and Nanosheet FETs. IEEE J. Electron Devices Soc. 2018, 6, 942–947. [Google Scholar] [CrossRef]
  20. Sun, Y.; Thompson, E.; Nishida, T. Physics of strain effect in semiconductors and metal-oxide-semiconductor field-effect transistors. J. Appl. Phys. 2007, 101, 104503. [Google Scholar] [CrossRef]
  21. Reboh, S.; Coquand, R.; Augendre, E.; Barraud, S.; Maitrejean, S.; Viner, M.; Faynot, O.; Loubet, N.; Guillorn, M.; Fetterolf, S.; et al. An analysis of stress evolution in stacked GAA transistors. In Proceedings of the IEEE Slilcon Nanoelectronics Workshop (SNW), Honolulu, HI, USA, 12–13 June 2016. [Google Scholar]
  22. Loubet, N.; Hook, T.; Montanini, P.; Yeung, C.-W.; Kanakasabapathy, S.; Guillom, M.; Yamashita, T.; Zhang, J.; Miao, X.; Wang, J.; et al. Stacked nanosheet gate-all-around transistor to enable scaling beyond FinFET. In Proceedings of the 2017 IEEE Symposium on VLSI Technology, Kyoto, Japan, 5–8 June 2017. [Google Scholar]
  23. Moore, M. International Roadmap for Devices and Systems (IRDS™) Edition. IEEE. 2021. Available online: https://irds.ieee.org/images/files/pdf/2021/2021IRDS_MM.pdf (accessed on 25 August 2022).
  24. Paszke, A.; Gross, S.; Massa, F.; Lerer, A.; Bradbury, J.; Chanan, G.; Killeen, T.; Lin, Z.; Gimelshein, N.; Antiga, L.; et al. PyTorch: An Imperative Style, High-Performance Deep Learning Library. In Proceedings of the Advances in Neural Information Processing Systems, Vancouver, BC, Canada, 8–14 December 2019; pp. 8024–8035. [Google Scholar]
  25. Mcandrew, C.C.; Coram, G.J.; Gullapalli, K.K.; Jones, J.R.; Nagel, L.W.; Roy, A.S.; Roychowdhury, J.; Scholten, A.J.; Smit, G.D.J.; Wang, X.; et al. Best Practices for Compact Modeling in Verilog-A. IEEE J. Electron Devices Soc. 2015, 3, 383–396. [Google Scholar] [CrossRef]
  26. Lim, W.; Chin, H.C.; Lim, C.S.; Tan, M.L.P. Performance Evaluation of 14nm FinFET-Based 6T SRAM Cell Functionality for DC and Transient Circuit Analysis. J. Nanomater. 2014, 2014, 105. [Google Scholar] [CrossRef]
  27. Song, T.; Jung, H.; Yang, G.; Tang, H.; Kim, H.; Seo, D.; Kim, H.; Rim, W.; Baek, S.; Baeck, S.; et al. 3nm Gate-All-Around (GAA) Design-Technology Co-Optimization (DTCO) for succeeding PPA by Technology. In Proceedings of the Custom Integrated Circuits Conference (CICC), Newport Beach, CA, USA, 24–27 April 2022. [Google Scholar]
  28. Kao, M.Y.; Kam, H.; Hu, C. Deep-Learning-Assisted Physics-Driven MOSFET Current-Voltage Modeling. IEEE Electron Device Lett. 2022, 43, 974–977. [Google Scholar] [CrossRef]
Figure 1. A schematic diagram of a 3D TCAD simulation of the NSFET.
Electronics 11 02761 g001
Figure 2. Calibrated I-V curve with the IBM measurement data.
Electronics 11 02761 g002
Figure 3. (a) I-V symmetry graph of an N-type NSFET and P-type NSFET. (b) Gate capacitance of an N-type NSFET and P-type NSFET.
Electronics 11 02761 g003
Figure 4. Nonlinear electrical characteristics of NSFETs.
Electronics 11 02761 g004
Figure 5. The proposed ANN model’s architecture.
Electronics 11 02761 g005
Figure 6. The workflow of the ANN model.
Electronics 11 02761 g006
Figure 7. Comparison of the ANN model and simulated I-V characteristics using TCAD for N-type and P-type NSFETs (gate length = 12 nm, sheet width = 25 nm, sheet thickness = 5 nm, spacer length = 4 nm, oxide thickness = 1.5 nm).
Electronics 11 02761 g007
Figure 8. Comparison of the ANN model and simulated C-V characteristics using TCAD for N-type and P-type NSFETs (gate length = 12 nm, sheet width = 25 nm, sheet thickness = 5 nm, spacer length = 4 nm, oxide thickness = 1.5 nm).
Electronics 11 02761 g008
Figure 9. Comparison of the ANN model and the BSIM-CMG model for the XOR simulation.
Electronics 11 02761 g009
Figure 10. Comparison of the ANN model and the BSIM-CMG model for the 17-stage ring oscillator simulation.
Electronics 11 02761 g010
Figure 11. Comparison of the ANN and BSIM models’ results for the 6T-SRAM simulation: (a) hold operation margin, (b) read operation margin, and (c) write operation margin.
Electronics 11 02761 g011
Figure 12. Time comparison of Monte Carlo simulations by stages of a ring oscillator using the global device model.
Electronics 11 02761 g012
Figure 13. Time comparison of Monte Carlo simulations by stages of a ring oscillator using the single-device model.
Electronics 11 02761 g013
Table 1. The electrical characteristics obtained using a TCAD simulation.
N-Type NSFETP-Type NSFET
V t h [mV]0.2180.220
I o f f [pA]98.0195.03
I o n [uA]91.1390.34
SS 1 [mV/dec]65.866.4
1 Sub-threshold swing.
Table 2. Key parameters of NSFETs for the TCAD simulation.
Tech Node3 [nm]2.1 [nm]1.5 [nm]3 [nm]Sub-3 [nm]
IRDSIBMOur Datasets
L g [nm]1614121211, 12, 13
W s h e e t [nm]3030305021, 23, 25, 27, 29
T s h e e t [nm]87654, 5, 6
L s p [nm]65453, 4, 5
T o x [nm]1.41.371.371.51, 1.5, 2
T s u s [nm]1010101010
S/D doping [cm 3 ]----6.5 × 10 20
Channel doping [cm 3 ]----1 × 10 16
Table 3. Circuit performance simulation results and errors between the ANN-based compact model and BSIM-CMG.
BSIM-CMGANN ModelErrors [%]
XORA to Y Delay [ps]11.9611.880.68
B to Y Delay [ps]5.945.871.13
17-RODelay [ps]79.5078.701.01
SRAM (Hold)Margin [mV]286.98285.880.39
SRAM (Read)Margin [mV]129.68126.012.91
SRAM (Write)Margin [mV]223.16221.720.65
Table 4. Characteristics of the single-device model and the global device model.
Single-Device ModelGlobal Device Model
ANN model sizesI-VC-VI-VC-V
(numbers of neurons in hidden layers)(5, 5)(5)(20, 15)(10, 5)
Simulation errors Off region: 2.5%C g g : 1.3%
0.3% or less0.3% or less(log scale: 0.2%)C g d : 1.5%
Medium region: 2.0%C g s : 1.5%
High region: 1.0%
I-V: (7 × 5) + (5 × 5) +(5 × 1) = 65I-V: (7 × 20) + (20 × 15) + (15 × 1) = 455
Simulation complexity 1C-V: (7 × 5) + (5 × 3) = 50C-V: (7 × 10) + (10 × 3) = 100
Activation function (tanh) calculation = 15Activation function (tanh) calculation = 50
Advantages 1. Different devices can be simulated By
1. The simulation speed is fastchanging the structural parameters of the circuit
2. The accuracy is very high2. The circuit specifications (e.g., power, delay) can
be evaluated based on the structural parameters
3. TCAD usage is reduced by predicting
values between structures
1 Complexity of the calculation of multiplication and activation functions in the ANN-based compact model.
Publisher’s Note: MDPI stays neutral with regard to jurisdictional claims in published maps and institutional affiliations.

