Article

Emulation of the Rician K-Factor of 5G Propagation in a Source Stirred Reverberation Chamber

Department of Information Engineering, Università Politecnica delle Marche, 60131 Ancona, Italy
*
Author to whom correspondence should be addressed.
Electronics 2023, 12(1), 58; https://doi.org/10.3390/electronics12010058
Submission received: 2 December 2022 / Revised: 20 December 2022 / Accepted: 21 December 2022 / Published: 23 December 2022
(This article belongs to the Special Issue EMC Analysis in Wireless Communication)

Abstract

:
This paper presents a novel algorithm to emulate the Rician K-factor of a wireless communication environment using a reverberation chamber. In particular, it was focused on the frequency bands used by 5G technology for data transmission. Unlike the current state of the art, the increase of the Rician K-factor is not achieved by inserting lossy material in the chamber, but through the proposed algorithm, which selects a subset of electromagnetic field realizations inside the chamber. The algorithm was first applied to the results of a simulation obtained by using an analytical model that predicts the main physical quantities inside a rectangular cavity where a multiple monopole source stirring action is implemented. Subsequently, the robustness of the algorithm and its applicability was tested on a set of data retrieved from experimental measurements. In all of the considered scenarios, the validity of the proposed method was demonstrated.

1. Introduction

The 5G network represents the fifth generation of cellular technology. It was designed to increase speed, reduce latency and improve the flexibility of wireless services. Currently, 5G technology has a theoretical peak speed of 20 Gbps, while the peak speed of 4G is only 1 Gbps [1].
The antenna system incorporates the Massive MIMO (multiple input, multiple output) concept, which allows multiple transmitters and receivers to transfer more data simultaneously and in different directions, increasing the complexity of the channel model.
Furthermore, 5G New Radio [2], the global standard for a more suitable 5G wireless air interface, covers spectrums not used in 4G. As an example, in Italy, the frequencies assigned to 5G are around 700 MHz, 3.5 GHz and 26 GHz. However, 5G technology is not limited to the New Radio spectrum. It is designed to support heterogeneous networks that combine both licensed and unlicensed wireless technologies. A complete overview of 5G technology can be found in [3,4,5,6].
Considering all the novelties introduced in 5G technology, the necessity arises to test these new and complex systems in a controlled environment that reproduces the propagation channels for these new frequencies.
The propagation channel of a wireless system is usually described through its statistical properties. The Rician K-factor is one of the main indicators used to describe the wireless channel. In fact, it represents the ratio of the signal power in the line-of sight (LOS) component over the scattered power. The K-factor is important for link budget calculations [7,8], or in optimizing the modulation and coding schemes of a given channel [9,10].
The 5G propagation environments [11] are characterized by very high values of the Rician K-factor in urban areas (82 according to [12]) and a lower value (3 to 9) for suburban, rural, and indoor environments [7,12,13].
Finally, it should be noted that other parameters can also be adopted to characterize a propagation channel emulated inside an RC, such as the time delay spread and the coherence bandwidth [14]. These parameters are typically tuned by adding absorbing materials [15], with a consequent effect on the K-factor. The possibility of tuning the K-factor regardless of other parameter settings represents an advantage in using the RC for testing wireless systems.
In order to perform a test on 5G equipment before their installation in a real scenario, preliminary tests can be performed in a more controlled test site, such as within Reverberation Chambers (RCs), which are able to provide multipath propagation conditions.
RCs are usually characterized by lower values of Rician K-factor [16,17]; in fact, a well stirred RC has a high value of stirred components of the electromagnetic field and low values of its unstirred ones. In order to increase the Rician K-factor to emulate wireless propagation environments, lossy elements are usually inserted. As a consequence, the quality factor of the RC decreases; this means that the strength of the electromagnetic fields become lower and, consequently, a higher amplification in the entrance to the chamber is needed. This implies a higher cost of hardware equipment.
The aim of this paper is to enhance the value of the Rician K-factor by properly selecting the field realizations inside the RC. In this way, the quality factor of the RC will not be reduced, since no further lossy elements are inserted.
The traditional methods available to increase the K-factor exhibit some complexity. In fact, the reduction of the RC quality factor surely acts on the K-factor [18] because the scattered waves are attenuated when they intercept the lossy objects located in the RC. As a consequence, the final effect might depend on the number and positioning of the absorbers with respect to the antennas and stirrers [19]. Furthermore, the direct component should not be affected by the absorber’s positioning, therefore, a pure line-of-sight positioning between the transmitting and the receiving antenna is required. Last, but not least, the amount of direct component also depends on the directivity of the antennas [20]; so, making the antenna orientation another important variable acting on the K-factor.
The proposed method is applicable to RCs where the field configurations are known a priori and repeatable, such as mechanical stirring using one or more metallic paddles in step mode, or the Oscillating Walls Stirred (OWS) RC [21], or, as in our case, to the Multiple Monopole Source Stirring RC. This particular implementation of a source stirring technique is achieved thanks to an array of monopole antennas mounted on the walls of the RC and, subsequently, fed to obtain the stirring action [22]. This technique was successfully compared to the more classical approach implementing both mechanical stirring and MMSS in the same chamber [23]. This paper presents an analytical and an experimental approach for demonstrating the validity of the proposed method.
The paper is organized as follows: Section 2 describes the scenario inside an RC to simulate an urban environment; Section 3 describes the rationale of our proposal and the corresponding algorithm; Section 4 shows the results; Section 5 deals with the discussion of the results and concludes the paper.

2. Scenario

The considered scenario is an RC where Multiple Monopole Source Stirring (MMSS) is implemented. The RC has dimensions of 800 mm × 900 mm × 1000 mm and is made of galvanized steel. The stirring technique is obtained using a certain number of monopoles placed on the chamber’s wall, however in our case, for practical reasons, the stirring of the chamber is performed by inserting a single monopole each time in one of the 120 holes present on the walls of the RC, 20 holes in each face. In this way, the reverberation effect is due to 120 different configurations of the electromagnetic field inside the cavity.
Owing to the reverberating characteristic of the RC, the field inside the chamber has statistical properties that, under proper preparation of the chamber, resembles the typical propagation channel of an urban environment. In particular, the environmental channel has statistical properties that follows a Rician distribution with a specific K-factor depending on several factors (antenna gain, elevation, etc.) [7,8,9,10].
Placing a dipole antenna inside the MMSS chamber, the insertion loss S 21 among each monopole on the walls and the dipole can be evaluated; hence, it is possible to predict the performance of the RC in terms of its statistical indicators, in particular, we focused on the Rician K-factor (K) and the quality factor (Q,).
The Rician K-factor of the chamber [16] can be computed according to (1):
K = ( | S 21 | ) 2 | S 21 S 21 | 2   ,  
where <∙> means averaging the operator over all the chamber field realizations.
The quality factor is computed according to (2) [24]:
Q = 16 π 2 V η T X η R X λ 3 | S 21 | 2 1 | S 11 | 2
where V is the chamber volume, λ is the wavelength (m), η T X and η R X are the total antenna efficiency factors for the transmit and receive antennas, respectively.
The same scenario inside the MMSS chamber can be modeled with an analytical approach [14], so that Equations (1) and (2) can be applied to a simulated S 21 parameter. The limitation of this approach is due to the presence of losses from different sources (walls, antennas, apertures, gaskets) that cannot be modelled as is. For this reason, a classical approach in RC chamber [22] modelling is used: the chamber’s walls are simulated with an equivalent conductivity that permits us to obtain a chamber with the same Q-factor as the real one, for each frequency [25]. In particular, in our chamber, in order to obtain the same Q-factor, the conductivity of the walls is modelled with a value that is reduced by a factor of 10 with respect to the σ of the galvanized steel.
If the RC is well stirred, looking at the scatter plot of S 21 obtained with simulations of the MMSS chamber, the points that represent the complex value of the field in a point inside the chamber, are almost distributed around the origin of the axis and almost uniformly distributed on the four quadrants (Figure 1, left). As a consequence, the K-factor is low because the numerator of Equation (1) is close to zero. In order to increase the K-factor, and consequently, obtain an environment similar to the urban environment, the traditional approach introduces losses into the RC. In this way, the Q factor decreases and the scatter plot of S 21 presents a more evident bias and, consequently, K also increases (Figure 1, right), and the strength of the electromagnetic field in the chamber decreases.

3. The Proposed Method

In order to increase the K-factor of the chamber, without reducing the Q-factor, a new approach is proposed. The idea is to select the proper field configurations inside the chamber that have an ensemble statistical property that follows the multipath fading urban environment property. For this reason, the method is applicable to a stirring technique that permits us to obtain repeatable and well controlled field configurations.
Figure 2 shows the idea. In Figure 2, the scatter plot of an ideal reverberation chamber is shown. In particular, the blue points represent the S 21   for 5000 field configurations inside an ideal chamber. The number of configurations is high in order to enhance the statistical properties and obtain a better visualization of the idea. It can be seen that the blue points are uniformly distributed around the center of the scatter plot and describe almost a perfect circle around it. In this case, the K-factor is almost zero, and the maximum radius of the circle is 1. This configuration does not have any bias and so cannot represent an urban environment well. However, by selecting the proper configurations, it is possible to obtain the desired statistical properties. This is explained in the selected coloring configuration of Figure 2 shown in yellow, purple or orange. The subintervals of the figures are represented by three different possible selections of field configurations. The yellow one is obtained by choosing samples that are within a circle of radius R = 0.3 centered in point C(−0.4, 0.4). The center of the circle represents the average values of the chosen samples (the numerator of Equation (1)), whereas R represents the maximum distance in the complex plane of the samples inside the circle and the average values of the circle (the distance of each sample represents the denominator of Equation (1) before averaging). For the other configurations, the orange one is chosen by selecting samples that have the same average values of the yellow one, but that are closer to the average value (R = 0.2, C(0.4, 0.4)). In this case, the K-factor is 16.13, greater than the yellow one that has K = 6.77. The purple one is chosen by selecting samples that have the same distance with their average value as the orange one, but have a lower average value (R = 0.2, C(0.2, −0.2)). In this case, K = 3.8.
This simple example demonstrates that in order to improve the K-factor, it is necessary both to increase the average value of the chosen samples and to reduce the distance between the samples and their average. However, in the example, a very large number of field configurations are available for the selection, so more than one selection ca be obtained with the same K-factor. On the other hand, in a real chamber environment, the number of samples are lower, and not uniformly distributed so well. For this reason, the implementation of the idea optimizes the selection in order to obtain a subinterval with the maximum number of field configurations.
In the following, the implementation of the idea applied to a real chamber is described. In particular, the MMSS chamber is used to demonstrate the feasibility of the method.
In order to make the selections, it is necessary to obtain all of the possible configurations inside the specific chamber. In particular, the S 21   paramater is measured using, for example, a Vector Network Analyzer, or is calculated analytically using the theoretical model [22]. Inside the MMSS chamber, the S 21 is evaluated between each monopole on the walls of the chamber.
The selection algorithm proposed is the following:
  • The desired Rician K-factor, K*, is chosen.
  • For each i-th S 21   sample, the normalized distance with all the others in the complex plane is computed:
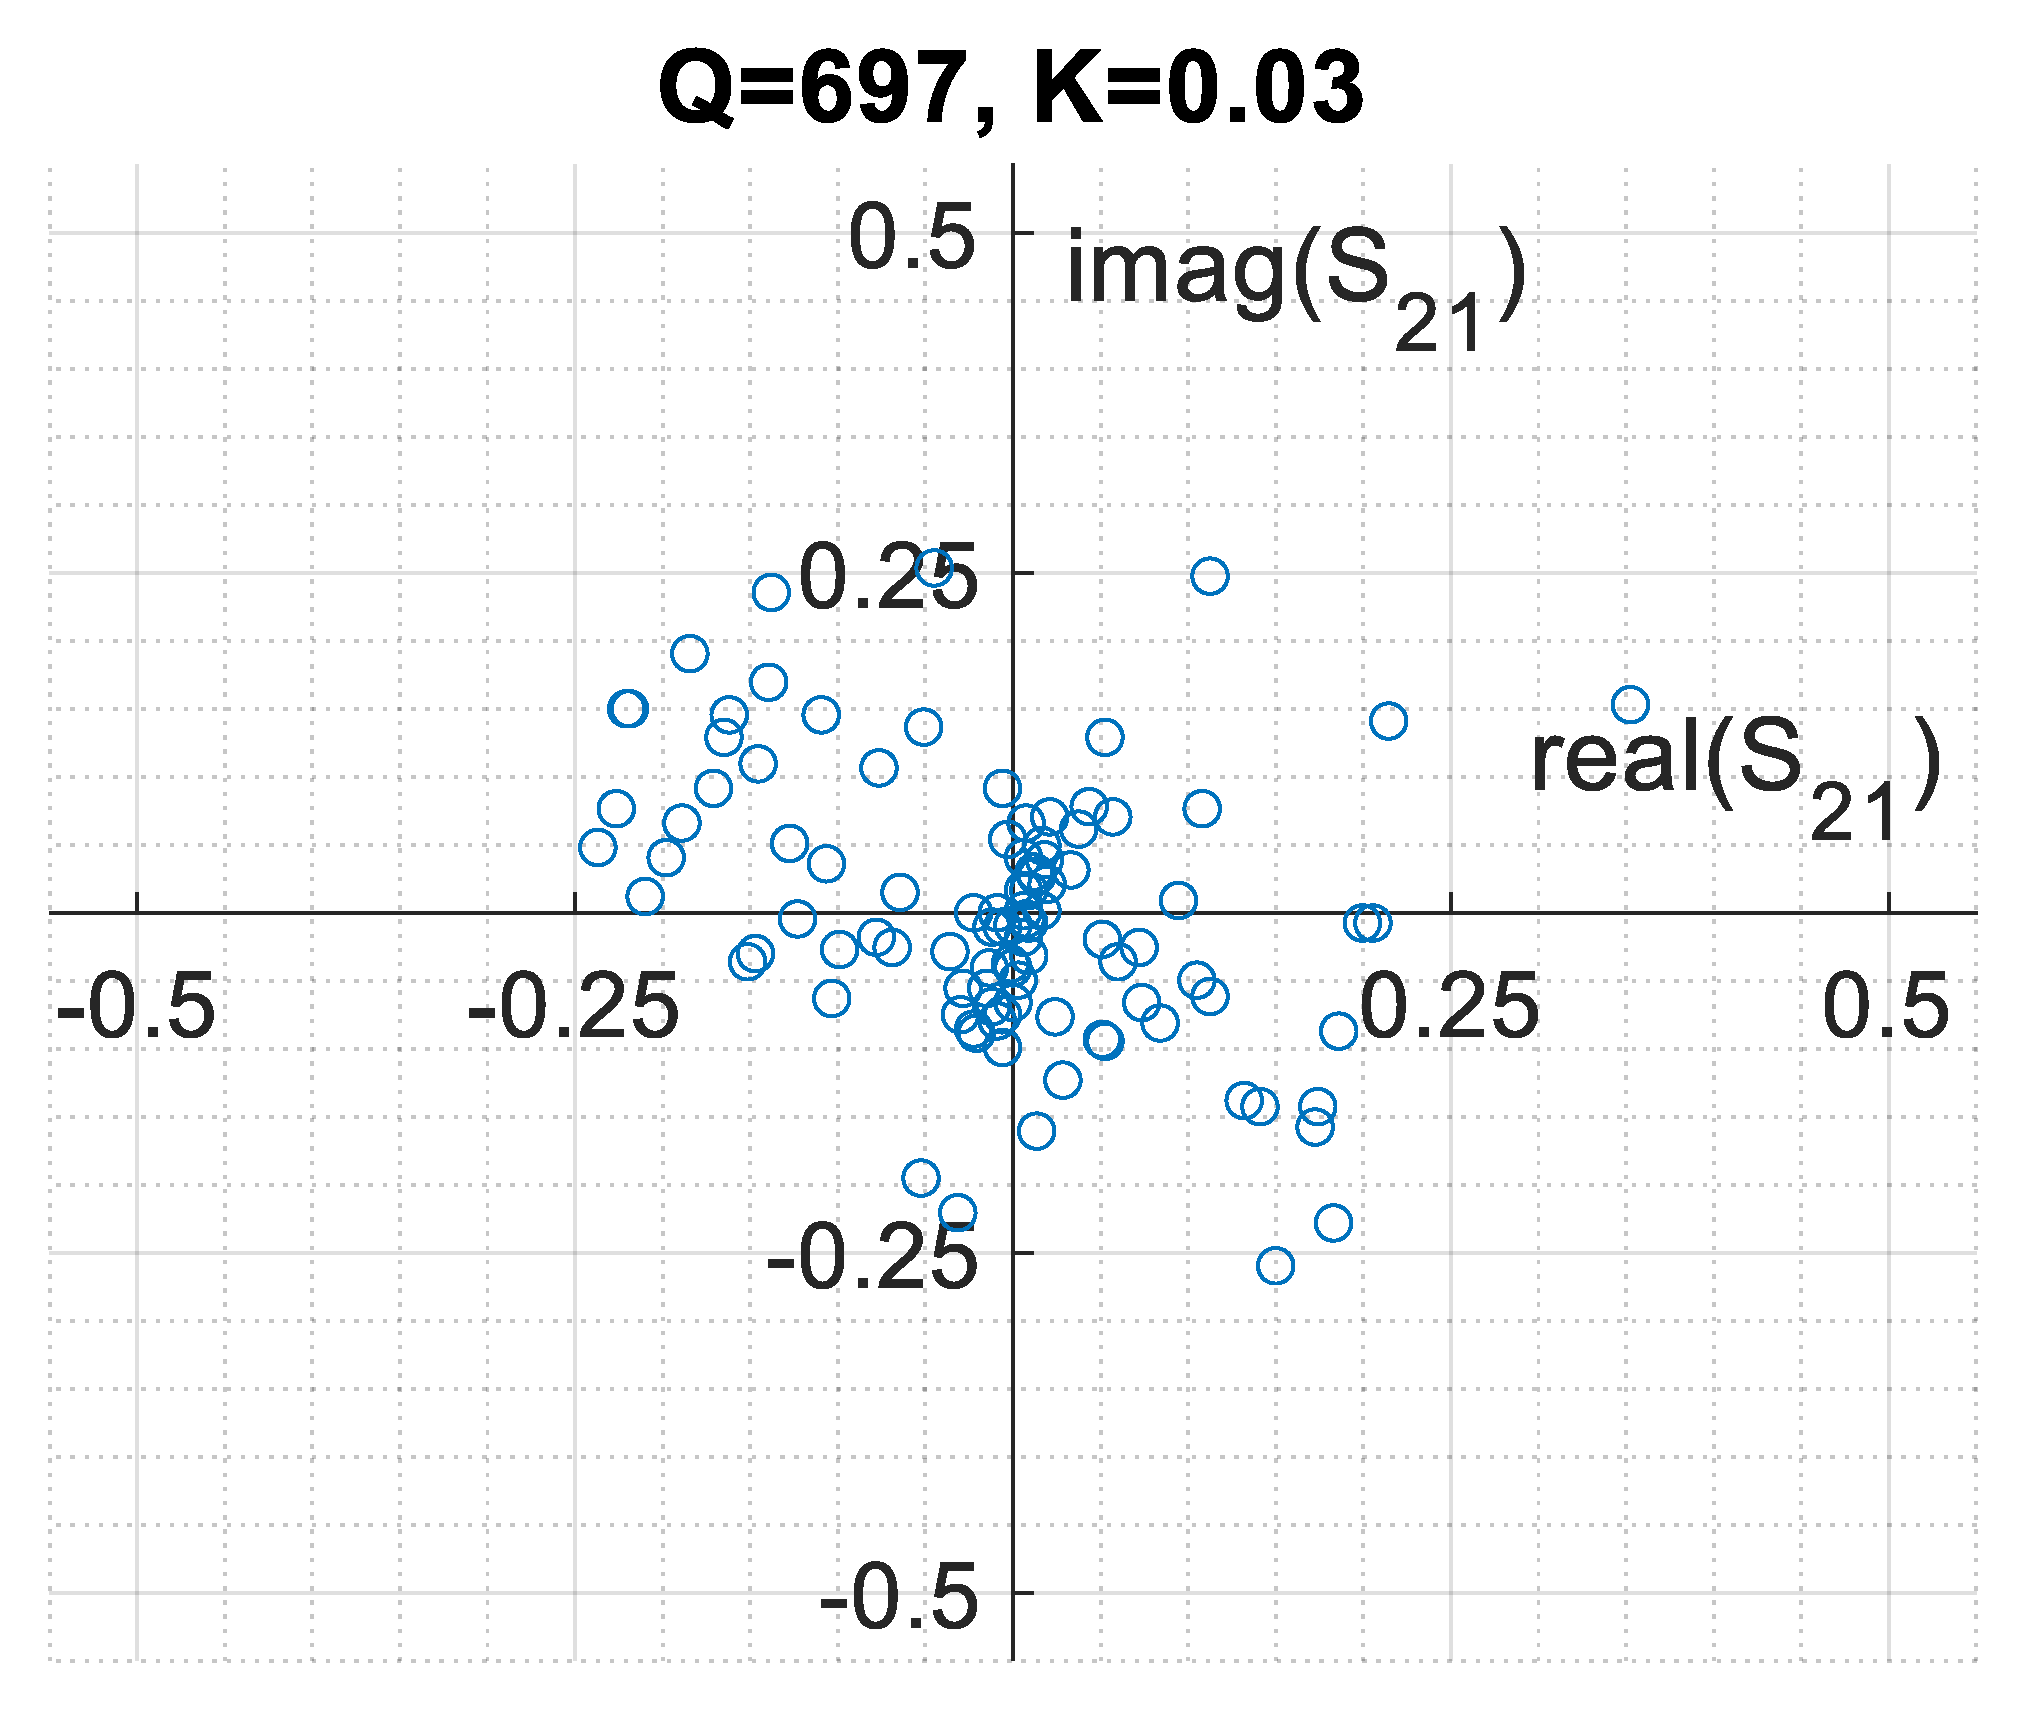
    d i s t ( i , k ) = | S 21 ( i ) | S 21 ( k ) | | | S 21 ( i ) |   ,
  • A threshold for d i s t called d i s t M A X is set to 1. This threshold corresponds in Figure 2 to the radius R of the selection normalized to the amplitude of the i-th S 21 .
  • For each i-th S 21   sample, all of the other S 21   that satisfies the condition d i s t ( i , k ) < d i s t M A X are selected This subinterval of samples represents the neighbors of i-th S 21   having normalized the distance to lower than d i s t M A X and can be indicated as S 21 _ n e a r ( i , d i s t M A X ) and their number of elements indicated as N d i s t M A X ( i ) .
  • Among all of the S 21 _ n e a r ( i , d i s t M A X ) subintervals, the one (i*) that has the largest number of element N d i s t M A X ( i ) is chosen, and the Rician K-factor related to this subset is computed, K(i*).
  • If K(i*) is lower than K* the algorithms reiterate from point 5, increasing d i s t M A X by 0.1 until the condition K(i*) > K* is reached.
  • Once the desired K-factor is obtained, the procedure stops, and the last subinterval identified is the selection sought.
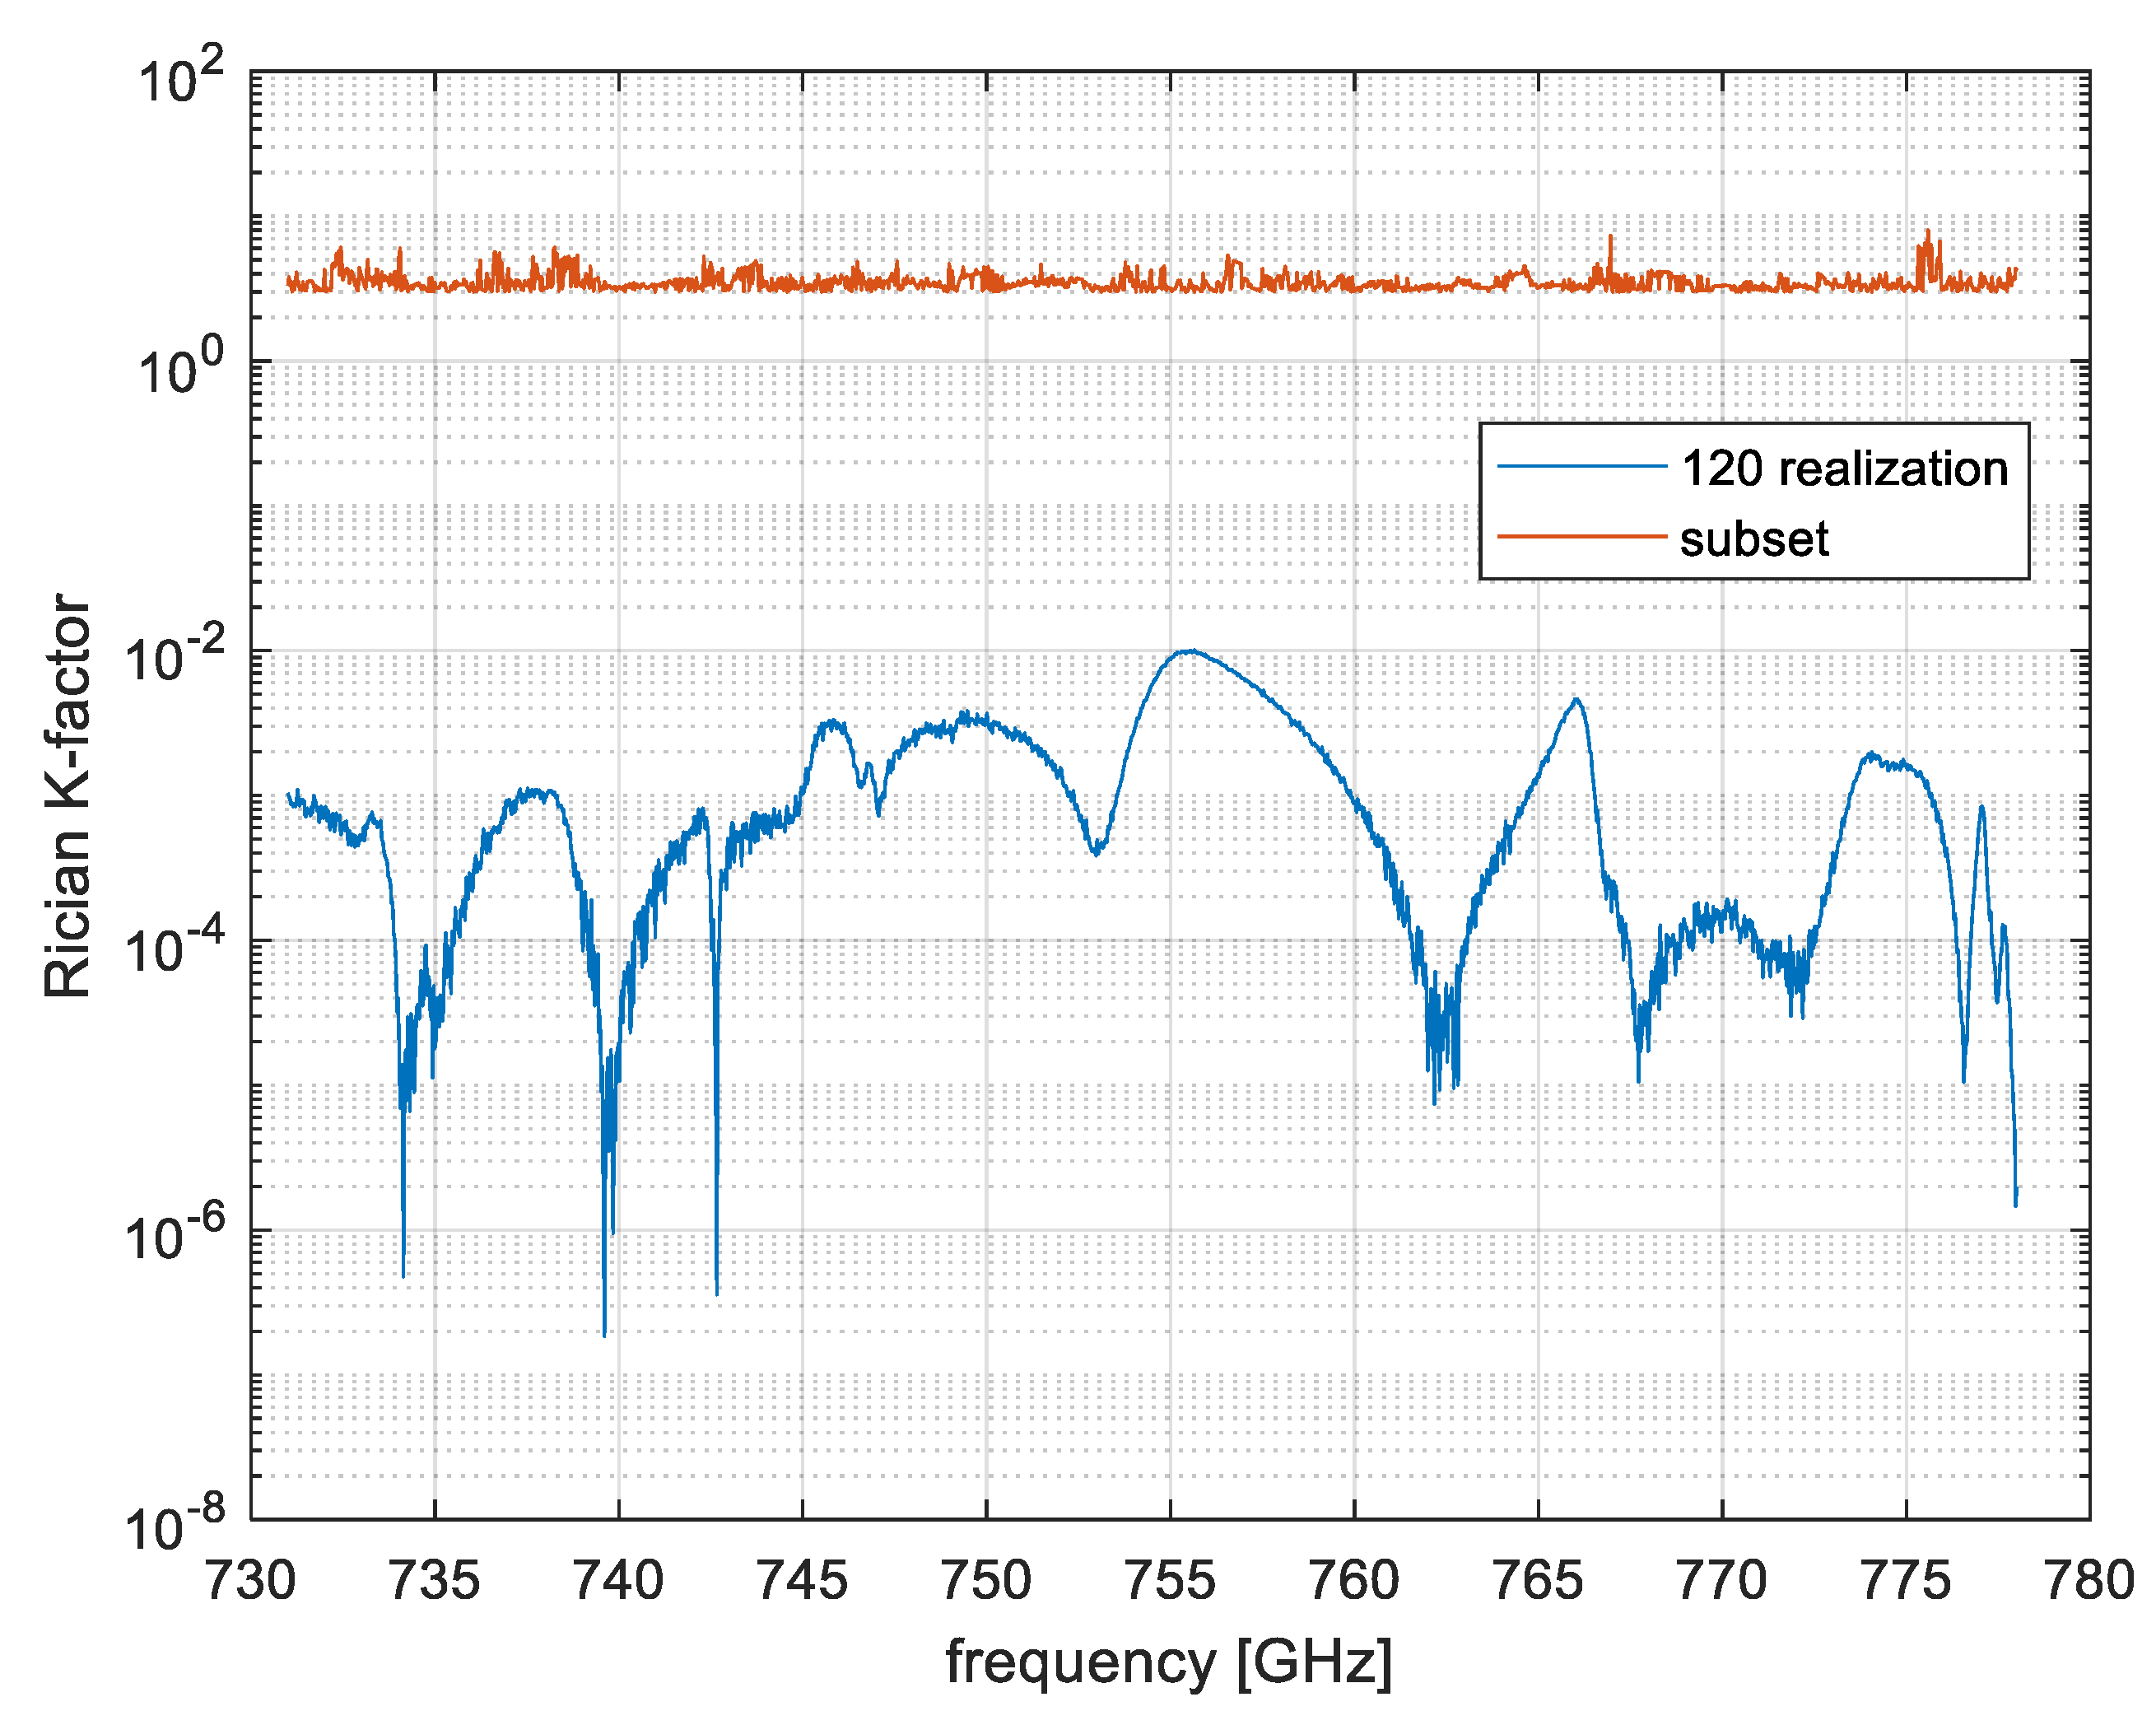
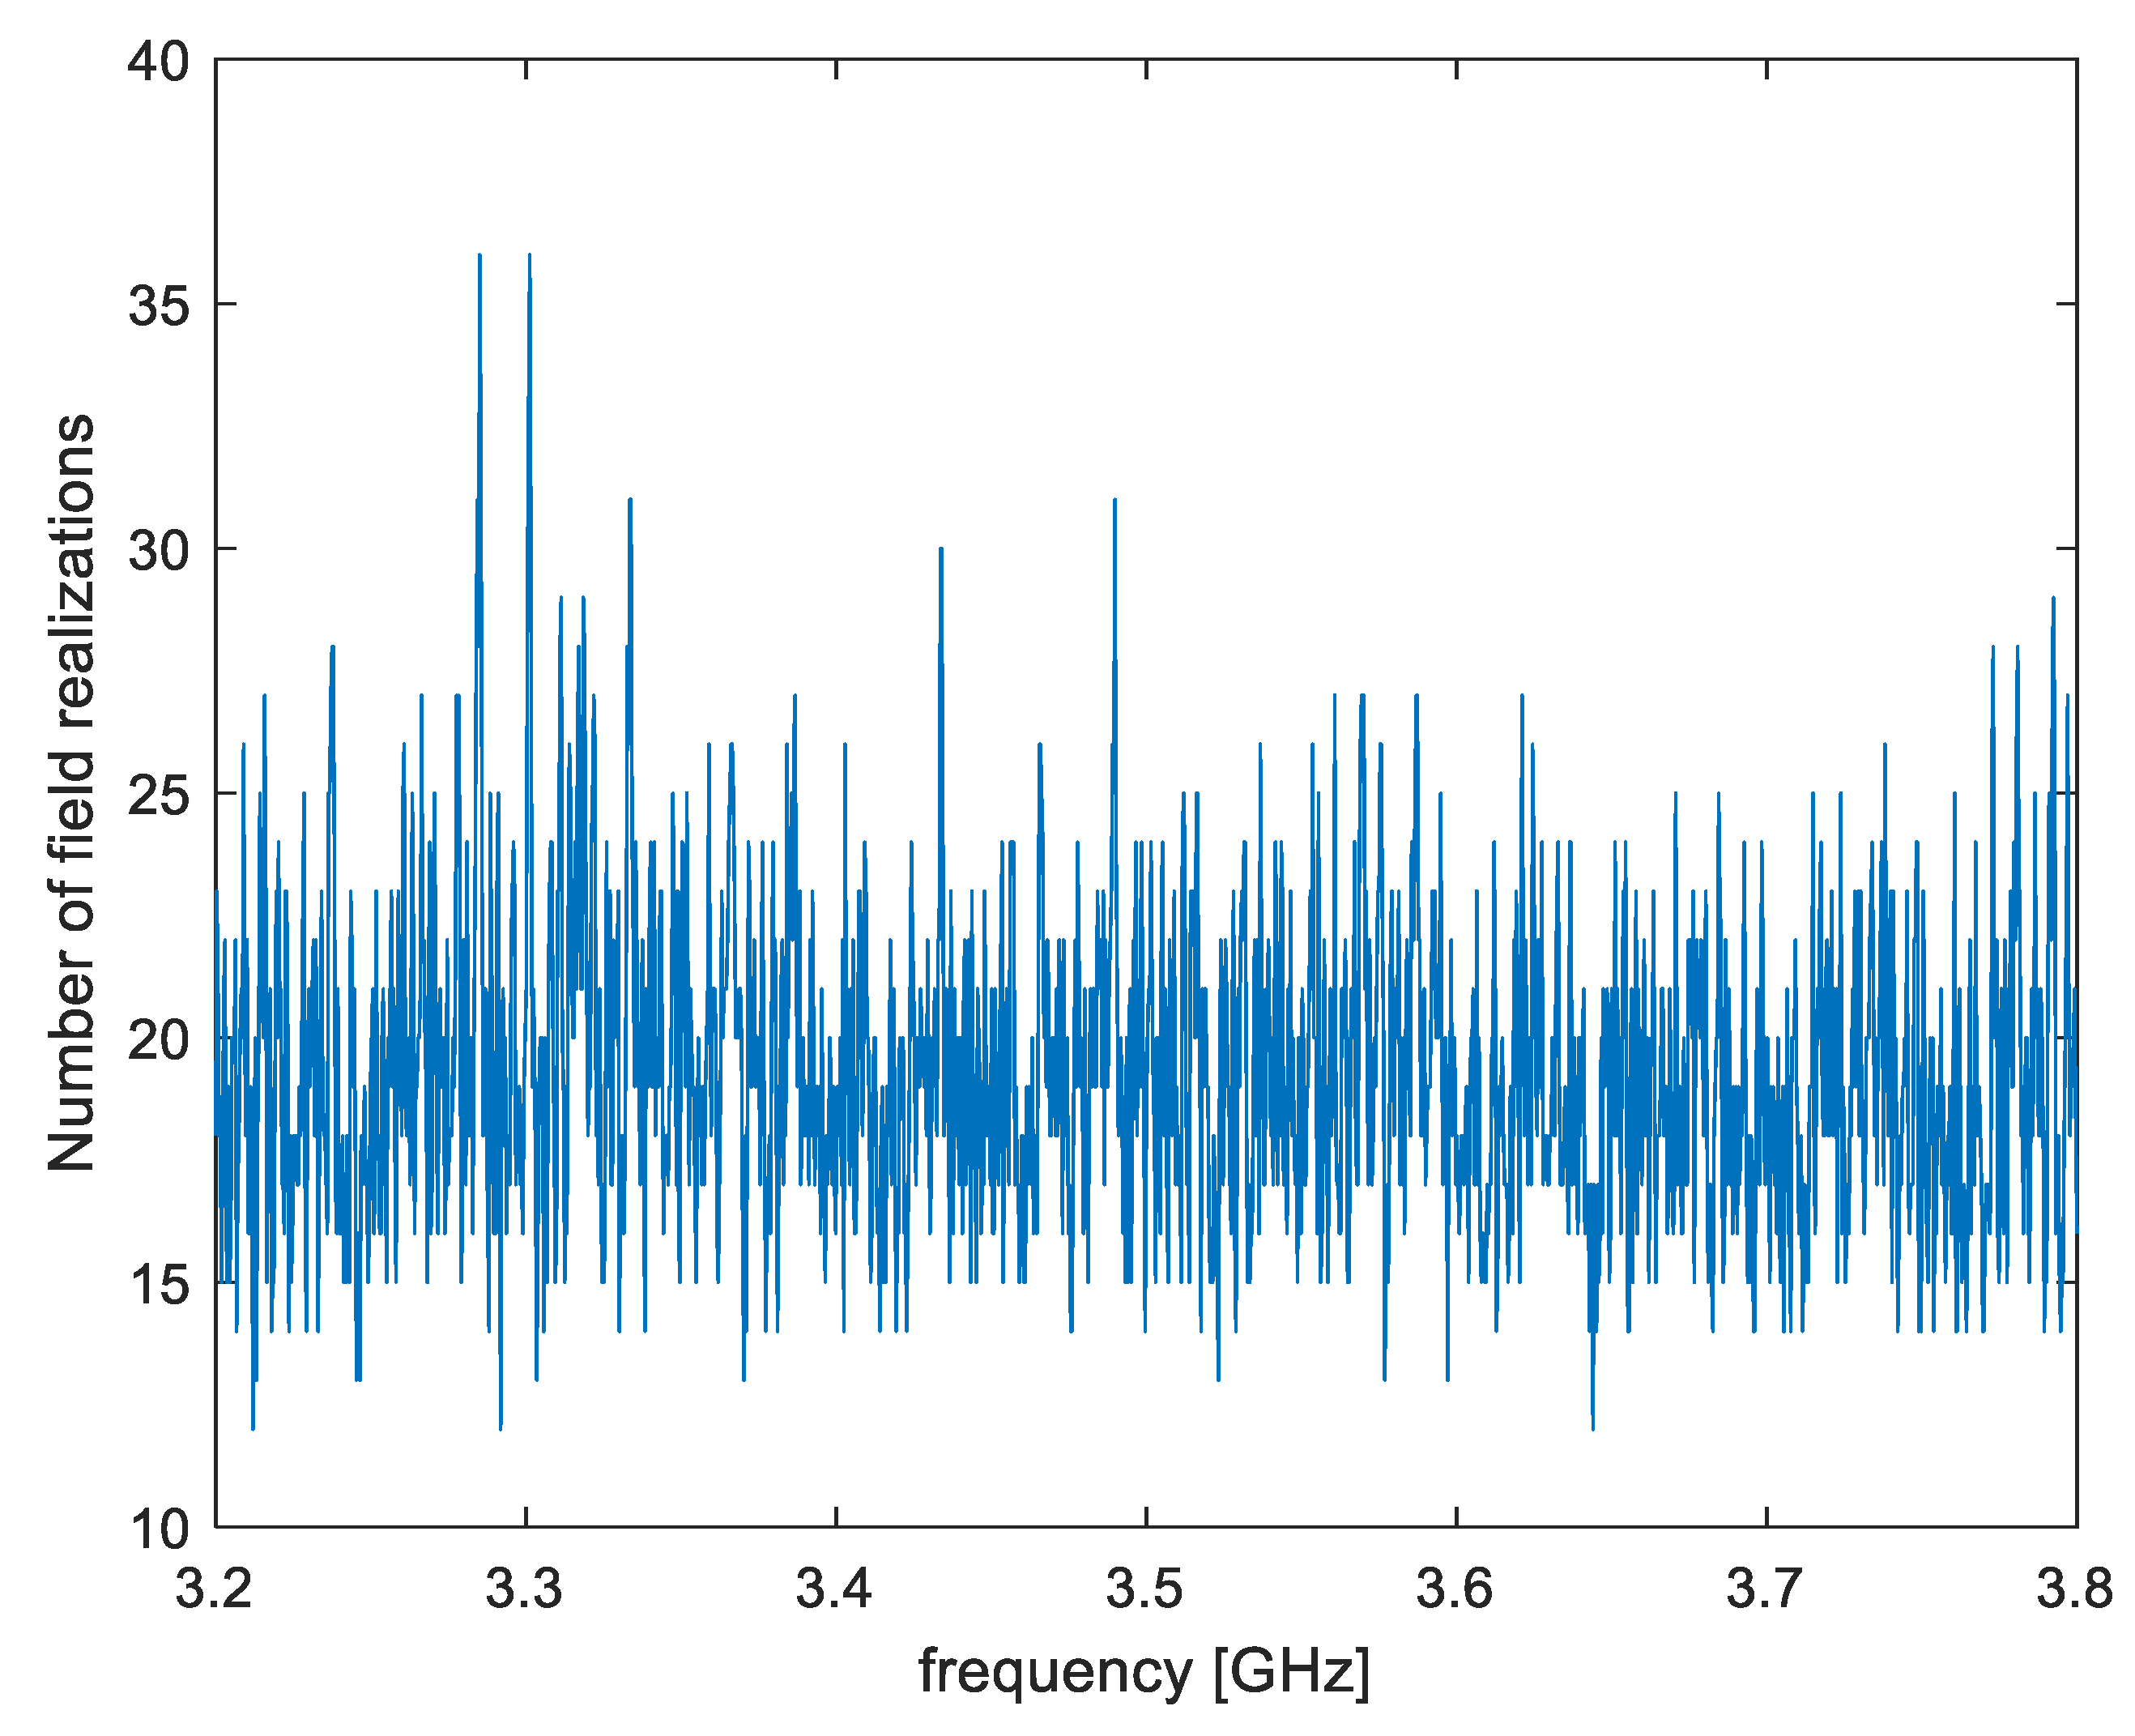
For a more immediate intelligibility, a flowchart describing the algorithm is given in Figure 3.
The proposed algorithm requires two considerations. The first one is that the greater the number of field configurations, the more efficient the proposed solution. This means that the more are the elements in the field realization subset that have the desired Rician K-factor, then the better are the statistics in terms of electromagnetic stirring.
The second consideration is that not all of the values of K* can be reached; however, the next section shows that by considering the values of K*, which represent wireless propagation environments according to the literature [8,9], the algorithm returns successful results.

4. Results

In this section, the application of the proposed algorithm is reported. In particular, Section 4.1 reports on the analytical simulations and Section 4.2 reports on the experimental data.

4.1. Analytical Results

Considering the MMSS chamber described in Section 2, the S 21 parameters between the dipole and the 120 monopoles on the walls are evaluated with the analytical model explained in [22]. The model is based on a modal approach and all of the possible 120 field configurations, corresponding to each monopole used as feeders of the chamber, are evaluated. Figure 4 shows the scatter plot of the S 21   computed at the frequency of 750 MHz; the corresponding value of the Rician K-factor is 0.18. As expected, the chamber is well stirred so the K-factor is low.
If we want to increase the Rician K-factor to a value of 7, to simulate a rural environment of wireless propagation, we can apply the proposed algorithm.
Starting from d i s t M A X = 1 , the iterative procedure lasts with a value of d i s t M A X = 2.7 . The procedure stops after obtaining the electromagnetic field realization subset that has a Rician K-factor value of 7.24, as shown in Figure 5.
The figure also shows the number of field configurations necessary to obtain the desired statistics: in this example, 19. It is important to highlight that the procedure is not limited to obtaining the number of field configurations, but it sets, exactly, which are the configurations to be used. In the MMSS chamber, this corresponds to setting which are the specific monopoles to switch on during the tests.

4.2. Experimental Results

The experimental validation of the proposed method is applied to the same chamber used for the simulations. In this case, two bands reserved to 5G data transmission are investigated. In particular, the band between 713 and 778 MHz and the one between 3.27 and 3.80 GHz are used in Italy for the data Frequency Division Duplex (FDD) uplink and downlink [26].
The MMSS RC used is shown in Figure 6. It is possible to note the holes used to insert the feeding monopoles each time. The figure also shows the transmitting 100 mm monopole and the receiving discone antenna: both antennas were designed and built in our laboratories.
Figure 7 shows the placement of the transmitting and the receiving antennas: the transmitting monopole is manually placed in all of the 120 holes present in the walls of the chamber. The receiving antenna is placed in the working volume of the RC, a subvolume spaced a quarter of a wavelength from the walls.
A VNA was used to measure the S 21   parameter in 1601 frequency points, equally spaced in both frequency ranges. The goal was to select, for each frequency, the subset of chamber field realizations that have a corresponding Rician K-factor greater than 3. Figure 8 shows the Rician K-factor frequency behavior, considering the whole number of possible configurations (120), and after having applied the algorithm.
Figure 9 shows the number of field realizations selected by the algorithm corresponding to the K-factor, shown in red in Figure 8, for each frequency in the considered frequency range.
The same procedure was applied to the higher frequency range, and the corresponding results are shown in Figure 10 and Figure 11. For the sake of demonstrating the applicability of the proposed method to different values of Rician K-factor, the goal for this frequency range was to have K equal to 5.

5. Discussion and Conclusions

The proposed method, used to tune the Rician K-factor by selecting a subset of electromagnetic field realizations, is useful for emulating the statistical properties of the propagation environment for 5G wireless communications. The method was applied to a reverberation chamber where the multiple monopole source stirring technique was implemented, but in the theory, it can be used for any chamber where the field configurations are uniquely determinable, such as mechanical stirring in tuned mode or OWS RCs.
Its reliability and robustness were demonstrated by using both the prediction of an analytical model and the data retrieved from experimental measurements, using different values of the Rician K-factor as a target. Future work will focus on the use and programming of an electronic switch to manage the feeding monopoles in order to automatize the procedure, which in the current state of the art is manually managed, thus reducing the testing time.

Author Contributions

A.D.L., P.R. and V.M.P. were involved in conceptualization, methodology, software, validation, investigation, writing, reviewing and editing. All authors have read and agreed to the published version of the manuscript.

Funding

This research received no external funding.

Data Availability Statement

No data available.

Conflicts of Interest

The authors declare no conflict of interest.

References

  1. Greenwood, D.; Hanzo, L. Characterization of mobile radio channels. In Mobile Radio Communications; Steele, R., Ed.; Pentech: London, UK, 1992; pp. 92–185. [Google Scholar]
  2. Keating, R.; Säily, M.; Hulkkonen, J.; Karjalainen, J. Overview of Positioning in 5G New Radio. In Proceedings of the 16th International Symposium on Wireless Communication Systems (ISWCS), Oulu, Finland, 27–30 August 2019; pp. 320–324. [Google Scholar] [CrossRef]
  3. Adebusola, J.A.; Ariyo, A.A.; Elisha, O.A.; Olubunmi, A.M.; Julius, O.O. An Overview of 5G Technology. In Proceedings of the International Conference in Mathematics, Computer Engineering and Computer Science (ICMCECS), Ayobo, Nigeria, 18–21 March 2020; pp. 1–4. [Google Scholar] [CrossRef]
  4. Gupta, A.; Jha, K.R. A Survey of 5G Network: Architecture and Emerging Technologies. IEEE Access 2015, 3, 1206–1232. [Google Scholar] [CrossRef]
  5. Gawas, A.U. An Overview on Evolution of Mobile Wireless Communication Networks: 1G–6G. Int. J. Recent Innov. Trends Comput. Commun. 2015, 3, 3130–3133. [Google Scholar]
  6. Lee, W.; Suh, E.S.; Kwak, W.Y.; Han, H. Comparative Analysis of 5G Mobile Communication Network Architectures. Appl. Sci. 2020, 10, 2478. [Google Scholar] [CrossRef] [Green Version]
  7. Medawar, S.; Händel, P.; Zetterberg, P. Ricean K-factor estimation and investigation of urban wireless measurements. In Proceedings of the IEEE International Conference on Wireless Information Technology and Systems (ICWITS), Maui, HI, USA, 11–16 November 2012; pp. 1–4. [Google Scholar] [CrossRef]
  8. Doukas, A.; Kalivas, G. Rician K factor estimation for wireless communication systems. In Proceedings of the International Conference on Wireless and Mobile Communications, Bucharest, Romania, 29–31 July 2006. [Google Scholar]
  9. Abdi, A.; Dobre, O.A.; Choudhry, R.; Bar, Y.-N.; Su, W. Modulation classification in fading channels using antenna arrays. In Proceedings of the IEEE MILCOM Military Communications Conference, Monterey, CA, USA, 31 October—3 November 2004; pp. 211–277. [Google Scholar]
  10. 5G—Fifth Generation of Mobile Technologies. Available online: https://www.itu.int/en/mediacentre/backgrounders/Pages/5G-fifth-generation-of-mobile-technologies.aspx (accessed on 28 October 2022).
  11. Medbo, J.; Kyosti, P.; Kusume, K.; Raschkowski, L.; Haneda, K.; Jamsa, T.; Nurmela, V.; Roivainen, A.; Meinila, J. Radio propagation modeling for 5G mobile and wireless communications. IEEE Commun. Mag. 2016, 54, 144–151. [Google Scholar] [CrossRef]
  12. Zhu, S.; Ghazaany, T.S.; Jones, S.M.; Abd-Alhameed, R.A.; Noras, J.M.; Van Buren, T.; Marker, S. Probability Distribution of Rician K-Factor in Urban, Suburban and Rural Areas Using Real-World Captured Data. IEEE Trans. Antennas Propag. 2014, 62, 3835–3839. [Google Scholar] [CrossRef] [Green Version]
  13. Chen, X.; Kildal, P.S.; Orlenius, C.; Carlsson, J. Channel Sounding of Loaded Reverberation Chamber for Over-the-Air Testing of Wireless Devices: Coherence Bandwidth Versus Average Mode Bandwidth and Delay Spread. IEEE Antennas Wirel. Propag. Lett. 2009, 8, 678–681. [Google Scholar] [CrossRef] [Green Version]
  14. Holloway, C.L.; Shah, H.A.; Pirkl, R.J.; Remley, K.A.; Hill, D.A.; Ladbury, J. Early Time Behavior in Reverberation Chambers and Its Effect on the Relationships Between Coherence Bandwidth, Chamber Decay Time, RMS Delay Spread, and the Chamber Buildup Time. IEEE Trans. Electromagn. Compat. 2012, 54, 714–725. [Google Scholar] [CrossRef]
  15. Mukherjee, S.; Das, S.S.; Chatterjee, A.; Chatterjee, S. Analytical Calculation of Rician K-Factor for Indoor Wireless Channel Models. IEEE Access 2017, 5, 19194–19212. [Google Scholar] [CrossRef]
  16. Holloway, L.C.; Hill, D.A.; Ladbury, J.M.; Wilson, P.F.; Koepke, G.; Coder, J. On the Use of Reverberation Chambers to Simulate a Rician Radio Environment for the Testing of Wireless Devices. IEEE Trans. Antennas Propag. 2006, 54, 3167–3177. [Google Scholar] [CrossRef]
  17. Coder, J.B.; Ladbury, J.; Holloway, C.; Remley, K.A. Examining the true effectiveness of loading a reverberation chamber: How to get your chamber consistently loaded. In Proceedings of the 2010 IEEE International Symposium on Electromagnetic Compatibility, Fort Lauderdale, FL, USA, 25–30 July 2010; pp. 530–535. [Google Scholar] [CrossRef] [Green Version]
  18. Burger, C.W.T.; Holloway, C.L.; Remley, A.K. Proximity and orientation influence on q-factor with respect to large-form-factor loads in a reverberation chamber. In Proceedings of the 2013 International Symposium on Electromagnetic Compatibility, Denver, CO, USA, 5–9 August 2013; pp. 369–374. [Google Scholar]
  19. Lemoine, C.; Amador, E.; Besnier, P.; Floc’h, J.-M.; Laisné, A. Antenna Directivity Measurement in Reverberation Chamber from Rician K-Factor Estimation. IEEE Trans. Antennas Propag. 2013, 61, 5307–5310. [Google Scholar] [CrossRef]
  20. Lemoine, C.; Amador, E.; Besnier, P. On the K-Factor Estimation for Rician Channel Simulated in Reverberation Chamber. IEEE Trans. Antennas Propag. 2011, 59, 1003–1012. [Google Scholar] [CrossRef]
  21. Barakos, D.; Serra, R. Performance characterization of the oscillating wall stirrer. In Proceedings of the International Symposium on Electromagnetic Compatibility—EMC Europe, Angers, France, 4–7 September 2017; pp. 1–4. [Google Scholar] [CrossRef]
  22. De Leo, A.; Primiani, V.M.; Russo, P.; Cerri, G. Low-Frequency Theoretical Analysis of a Source-Stirred Reverberation Chamber. IEEE Trans. Electromagn. Compat. 2017, 59, 315–324. [Google Scholar] [CrossRef]
  23. De Leo, A.; Cerri, G.; Russo, P.; Mariani Primiani, V. Experimental Comparison Between Source Stirring and Mechanical Stirring in a Reverberation Chamber by Analyzing the Antenna Transmission Coefficient. In Proceedings of the International Symposium on Electromagnetic Compatibility (EMC Europe), Amsterdam, The Netherlands, 27–30 August 2018; pp. 677–682. [Google Scholar] [CrossRef]
  24. Std 61 000-4-21; Reverberation Chamber Test Methods. International Electrotechnical Commission (IEC): Geneva, Switzerland, 2011.
  25. De Leo, A.; Primiani, V.M.; Russo, P.; Cerri, G. Numerical analysis of a reverberation chamber: Comparison between mechanical and source stirring techniques. In Proceedings of the International Symposium on Electromagnetic Compatibility—EMC Europe, Angers, France, 4–7 September 2017; pp. 1–6. [Google Scholar] [CrossRef]
  26. 5G Regulation and Laws in Italy, CMS Expert Guides. Available online: https://cms.law/en/int/expert-guides/cms-expert-guide-to-5g-regulation-and-law/italy (accessed on 28 October 2022).
Figure 1. Scatter plot of S 21 and an indication of the Q and K parameters related to an empty RC (up) and the same RC with the insertion of lossy elements (down).
Electronics 12 00058 g001aElectronics 12 00058 g001b
Figure 2. Scatter plot of the S 21 in an ideal reverberation chamber. The blue point represents all of the possible configurations of the field. The yellow, orange and purple points represent the selected configurations for different values of R and C, giving a different value of K-factor.
Electronics 12 00058 g002
Figure 3. Flowchart describing the proposed algorithm.
Electronics 12 00058 g003
Figure 4. Scatter plot of S 21   relative at a 120 electromagnetic field realization, simulated at 750 MHz. The corresponding value of the Rician K-factor is 0.18.
Electronics 12 00058 g004
Figure 5. Scatter plot of S 21   relative at the subset of 19 electromagnetic field realizations simulated at 750 MHz. The corresponding value of the Rician K-factor is 7.24.
Electronics 12 00058 g005
Figure 6. Experimental Setup: on the left, the reverberation chamber, and on the right, the discone and monopole antennas.
Electronics 12 00058 g006
Figure 7. Insertion of the transmitting monopole (left) and the location of the receiving antenna (right) inside the RC. Each hole, clearly visible from the inner view, is subsequently used to insert the transmitting monopole toward the chamber inside.
Electronics 12 00058 g007
Figure 8. Rician K-factor frequency behavior with the 120 field configurations and after having applied the algorithm in the frequency band 711–778 MHz.
Electronics 12 00058 g008
Figure 9. Number of field realizations selected by the algorithm in the frequency band 711–778 MHz.
Electronics 12 00058 g009
Figure 10. Rician K-factor frequency behavior with the 120 field configurations and after having applied the algorithm in the frequency band 3.27–3.80 GHz.
Electronics 12 00058 g010
Figure 11. Number of field realizations selected by the algorithm in the frequency band 3.27–3.80 GHz.
Electronics 12 00058 g011
Disclaimer/Publisher’s Note: The statements, opinions and data contained in all publications are solely those of the individual author(s) and contributor(s) and not of MDPI and/or the editor(s). MDPI and/or the editor(s) disclaim responsibility for any injury to people or property resulting from any ideas, methods, instructions or products referred to in the content.

