Abstract
In response to the problem of robots needing to perform bin-picking in many industries, a small robot system was developed with a workpiece-position-detection system based on Field-Programmable Gate Array (FPGA) technology. The system integrated object detection and feature matching techniques, bolstered by optimization methods, to enhance its functionality on the FPGA platform. Furthermore, a two-wire control bus was designed specifically for reliable operation in environments characterized by strong interference, drawing inspiration from the Controller Area Network (CAN) bus. The experimental results demonstrated that the system’s performance was comparable to that of the point-cloud-algorithm-based bin-picking system, while also exhibiting greater stability. Notably, the cost of the controller was significantly reduced, and the embedded hardware and software design ensured stability and adaptability for deployment in demanding settings, such as small-scale heavy industry factories.
1. Introduction
The continuous advancement of production technology has led to a growing trend in heavy industries, such as hot forging, where robots gradually replace manual labor. However, several challenges still hinder the widespread adoption of robots in these industries. Firstly, industrial environments often involve the use of current chopping devices such a medium-frequency furnaces and high-power motor drives, as well as the presence of conductive materials such as graphite powder release agents. These factors can interfere with the normal operation of the visual system’s signal transmission and visual processing computers. Secondly, object detection remains a challenging task in the field of machine vision, as it requires accurately distinguishing the target object from the background in images. Thirdly, the current generation of robots in the forging industry is typically programmed to operate within fixed positions, which limits their flexibility in adapting to different scenarios. This becomes particularly evident in tasks such as retrieving large raw materials from bins, which often require manual assistance using hooks. Such manual intervention is not only inconvenient, but also poses significant hazards due to the harsh working conditions. Furthermore, the existing emergency response capabilities of robots are relatively weak, relying solely on manual stopping by pressing an emergency stop button. These factors will lead to significant safety risks in unexpected situations. While industrial robots excel at repetitive tasks, their ability to handle unsorted workpieces and make informed judgments about their environment is challenging. Utilizing a machine vision system presents a promising solution to tackle these challenges effectively.
As an important branch of robotics technology, machine vision equips machines with “eyes” to give robots a visual system similar to that of humans. By perceiving objects and transmitting information to a computer for processing, the computer can issue commands to the robot for relevant operations. Equipment for screening using machine vision appeared as early as the beginning of the 21st Century [1]. Object detection has consistently been recognized as a challenging task within the field of computer vision. It involves the separation of objects from their background. With the continuous development of science and technology, object detection has transitioned from traditional methods to deep-learning-based methods [2,3]. However, these systems have strict requirements for the operating environment, which can cause failures in harsh environments, and most of them cannot achieve ideal results in tasks such as bin-picking. At present, some relevant references [4,5] have introduced a visual bin-picking system based on the utilization of 3D structured light and point cloud data processing. Nonetheless, these approaches have predominantly remained at the laboratory stage or constrained to expensive custom solutions, hindering their extensive implementation. In the presence of strong interference and conductive dust scenes such as hot forging plants, the application of the above visual bin-picking system based on 3D structured light and point cloud data processing is limited.
Object detection involves intricate convolutional operations that extract features and classify images [6]. The entire network contains millions of neurons and connections, resulting in massive computation. CPUs are versatile, but have low performance, while GPUs have better performance, but require excellent heat dissipation facilities and are unsuitable for deployment in harsh environments [7]. Currently, mainstream embedded ARM platforms have insufficient efficiency [8] and cannot achieve real-time detection, while the NVIDIA Jetson platform with high efficiency [9] is expensive, fragile, and not suitable for industrial use. FPGAs have achieved a good balance between energy efficiency, performance, reconfigurability, and cost and have attracted increasing attention [10]. Xilinx has launched the ZYNQ series System on a Chip (SoC), which provides heterogeneous computing functions. One part is the Programmable Logic (PL) part, consisting of an FPGA, suitable for parallel computing, and the other part is the Processing System (PS) part, consisting of a general-purpose ARM processor, suitable for serial computing. The combination of the versatility of a CPU and the speed an FPGA is suitable for image-processing applications [11]. This SoC offers various temperature endurance grades, and its documentation is open and easily accessible for integrated development. Moreover, it is reasonably priced and has a sufficient supply in the market.
Since 2015, there has been an increasing amount of research on target detection accelerator IP cores based on these series of SoCs [12]. Many scholars have proposed excellent deep learning accelerator solutions [13,14]. However, most of these solutions involve directly implementing the network on an FPGA or designing only one acceleration IP core without providing a comprehensive development process. Subsequently, Deephi Technology developed the Deep Neural Network Development Kit (DNNDK) based on ZYNQ SoCs which Xilinx acquired in 2018 [15]. DNNDK was the first accelerator core provided to users for free and offered a comprehensive set of pre-optimized models and a powerful automatic quantizer, enabling easy deployment on Xilinx devices [16]. However, these accelerator cores are not open-source and are tied to expensive development boards. In summary, it remains challenging for users to deploy their own neural network accelerators.
The algorithms or systems mentioned above were generally incomplete and did not perfectly meet the requirements for bin-picking in harsh environments. Commercial solutions exhibited relatively low integration levels and struggled to maintain stable performance in the presence of strong interference.
For the sake of overcoming the limitations of robot grasping, an integrated workpiece position detection system was developed in this study. The system was based on FPGA technology and specifically designed to combat Electromagnetic Interference (EMI). In order to acquire the coordinates of the target object for grasping, the system employed a hardware-based object detection algorithm that utilized deep learning techniques. To address the hardware-intensive nature of traditional deep-learning-based object detection algorithms, the optimized object detection was deployed on a dedicated FPGA, which offers strong specialization. The optimization process included two main aspects: first, the depth of the feature extraction network was reduced by removing less influential layers from the detection network; second, the trained model was pruned to reduce parameter complexity and improve speed. Additionally, the Winograd fast convolutional algorithm was applied to the FPGA to further enhance computational speed.
For the hardware implementation, the Xilinx ZYNQ SoC was utilized to handle image input/output and perform object detection, eliminating the necessity for bulky visual controllers. The system achieves a recognition speed of nearly two frames per second (FPS) with a power consumption of less than five watts, eliminating the need for cooling fans. The visual controller and camera are integrated and sealed within an aluminum alloy housing to prevent the adverse effects of high-temperature airflow and conductive dust. Given the severe electromagnetic interference in industrial environments, the traditional CAN industrial field bus was improved by adding transmission driver circuits and receiving filtering circuits to enhance the data transmission’s anti-interference performance. On the condition of dim lighting, where workpieces were placed randomly in bins, the proposed system accurately identified the position and orientation of the workpieces and guided the robot in grasping operations.
2. Software and Hardware Design for the Improved System
2.1. System Overview
In software, the process of the vision-based robot grasping system consisted of four main steps: target object localization, object pose estimation, grasp detection, and grasp planning [17]. Once the robot has completed initialization and the main Programmable Logic Controller (PLC) issues the instruction for material loading preparation, the robot will move to a fixed position for capturing an image. The captured image is then processed through our developed object detection module. After obtaining the target class and relative coordinates from the object detection outputs, the original image undergoes pruning and enhancement. The processed image undergoes a comparison with a set of standard images stored in the system. This comparison is performed using a sliding window detection technique and Feature-Based Matching (FBM). This enables the accurate determination of the workpiece’s position and orientation. Finally, the angle and coordinates of the workpiece will be written into the robot’s internal holding register through the Modbus TCP. When the main control PLC issues a grasp command, the robot will grasp according to the previously input workpiece position. If the robot detects that the grasp has failed, it will rerun the process. The flowchart is shown in Figure 1.
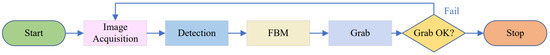
Figure 1.
System flowchart.
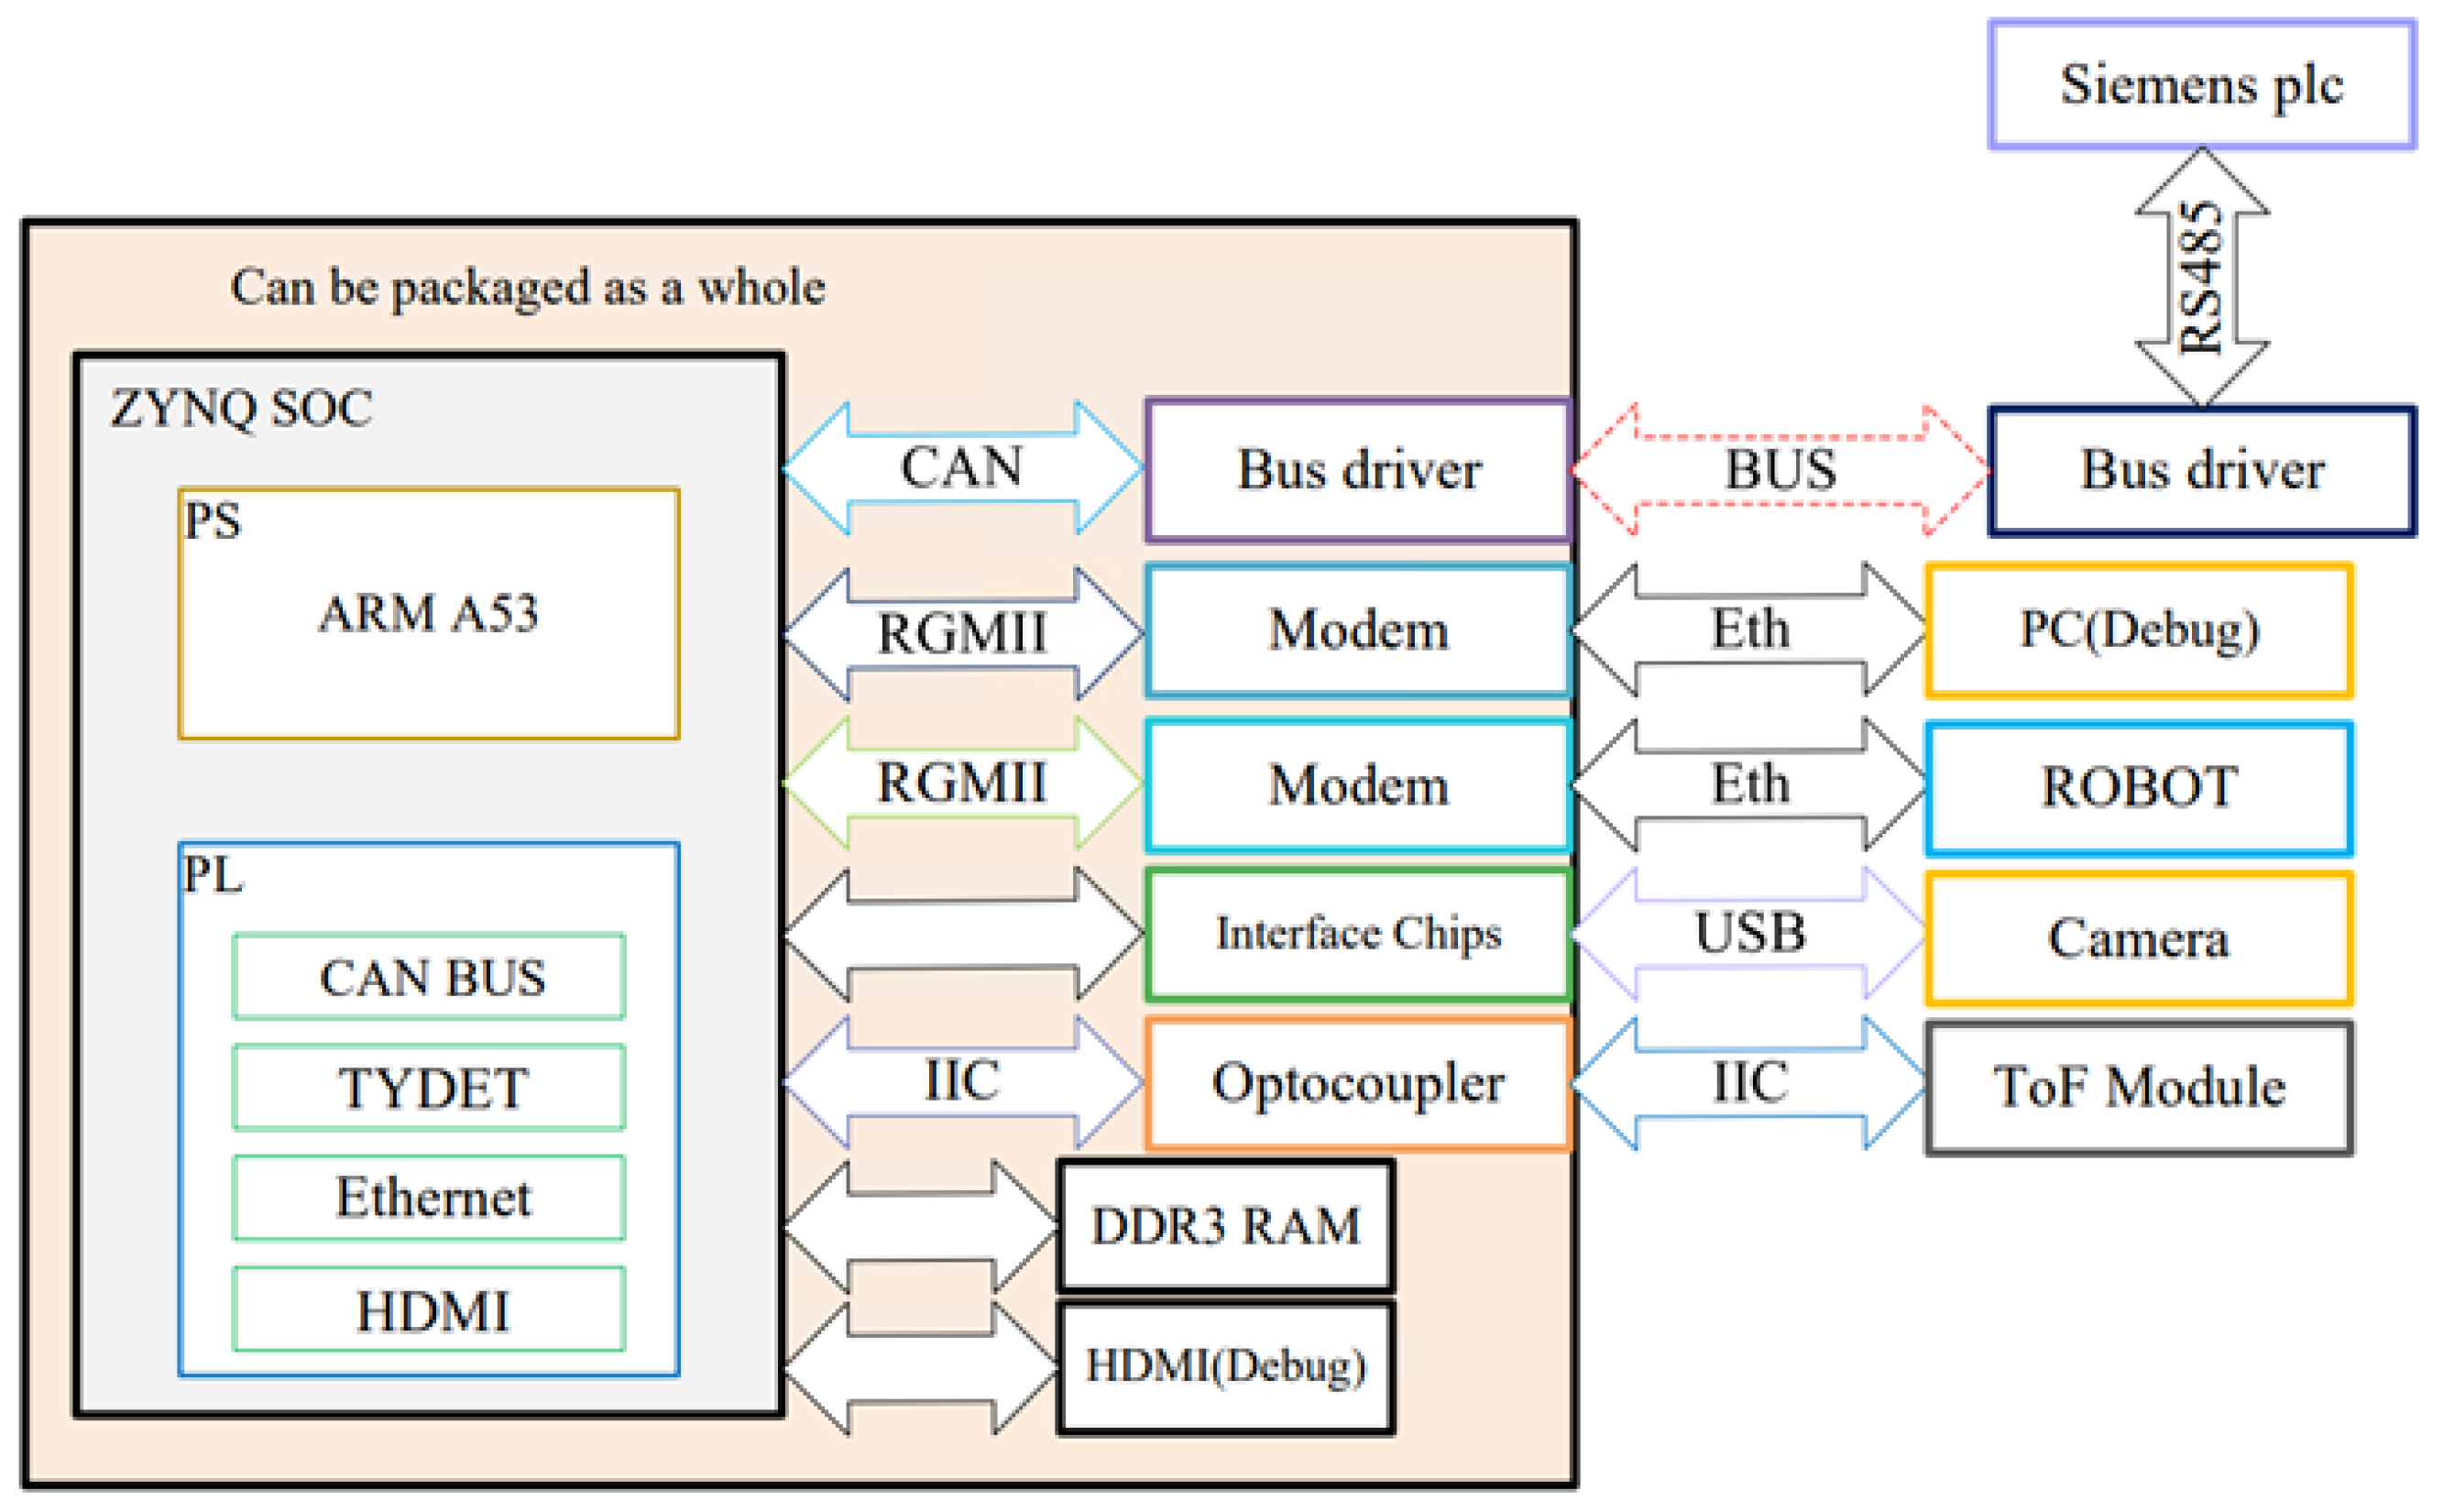
On the hardware side, the PL section incorporates several modules, including the CAN bus driver module, the TYDET acceleration module for the target detection algorithm, the Ethernet bus driver module, the Time of Flight (ToF) height measurement module, and the debugging HDMI interface. The PS section handles the input/output scheduling and sends the image from the camera to the PL. The two parts are interconnected through the built-in AXI-4 bus. The design in this paper can provide basic and sufficient performance on a low-end ZYNQ SoC. The hardware block diagram of the system is shown in Figure 2.
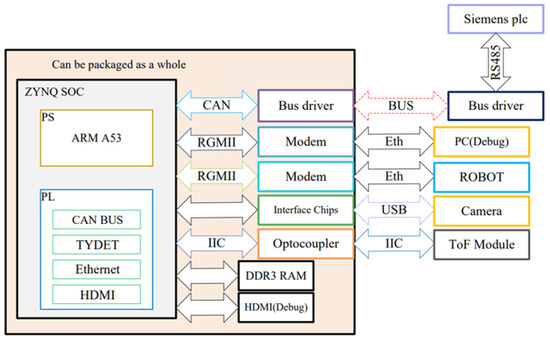
Figure 2.
The block diagram of the system’s hardware.
The target detection process obtains rough x and y coordinates of the workpiece position relative to the origin, referred to as the base coordinates’ one. Therefore, sending the position data directly to the robot was not feasible, and additional modules were needed to obtain more-accurate information. A laser ToF sensor needs to be involved on account of the lack of information about the relative height and angle of the object. A laser sensor was selected due to the potential significant changes in the field environment at different times. If ultrasonic sensors were employed, they would be vulnerable to the interference caused by fluctuations in the sound velocity at varying temperatures, potentially resulting in significant measurement errors. Furthermore, the need for frequent calibration imposed an additional workload. Conversely, the height sensor served two primary functions: firstly, it facilitated capturing images from a specific height during camera operations to accommodate the limitations of the degraded target detection network and ensure precise target identification; secondly, it enabled the acquisition of the relative height of the workpiece, thereby facilitating accurate 3D positioning.
The most-commonly used method for grasp detection is sliding window detection. The sliding window detection method employs feature-based matching to obtain more accurate position information. The processed image is compared with a set of pre-stored images captured at fixed angles in the system. By finding the image with the highest similarity, the corresponding angle can be determined as the actual orientation of the workpiece. Additionally, by calculating the difference between the edges of two images, another offset address (corrected address) is obtained. Add the base address and the correction address to obtain a more accurate workpiece position.
Due to the requirements of status monitoring and linkage control, the system requires connection with the master PLC. However, the field device interference poses a significant challenge, as conventional Ethernet or CAN bus communication may experience packet loss, consequently compromising the system’s real-time performance and safety. To address this issue, a fieldbus drive circuit based on the CAN bus is proposed. In the sending phase, operational amplifiers are employed for add-drive processing to enhance the drive capability. On the receiving end, devices such as common-mode inductive and transient suppression diodes are utilized to mitigate interference and ensure stable operation. At the transmission end of the workpiece position detection system, the protocol could be implemented on the PS to enhance integration and reduce costs.
This section provided a brief overview of the software and hardware architecture, as well as the operational flow of the vision-based robot bin-picking system. In the following sections, the detailed design of the object detection module and the improvements made to the Fieldbus communication will be discussed for further research.
2.2. Development of Target Detection Algorithm
Before selecting a target-detection algorithm, several factors need to be considered due to the need to design the FPGA’s internal logic structure based on the actual application. There are many types of target detection algorithms, such as Faster-RCNN [18] and SSD [19], but these algorithms have complex network structures, too many parameters, and high computational complexity. Although they have relatively good performance, their performance will be limited on low-power SoC platforms, and they are not very suitable from both a speed and design optimization perspective. Therefore, it was necessary to analyze common target detection algorithms and consider the limitations of hardware performance, speed, and accuracy to ultimately choose the algorithm suitable for this project. The proposed algorithm was based on the adoption of the You Only Look Once (YOLO) series. Although the YOLO series has been upgraded to Version 7, the structure of the new version is complex, which leads to slow speed. The YOLOv3-Tiny [20] algorithm had the most-significant feature of fast speed and a simple structure, which made it highly suitable for use in this project. It leveraged the lightweight Darknet framework as its feature extraction backbone network, implemented in the C language. After trimming the network, it can be easily ported using High-Level Synthesis (HLS).
Darknet [21] is an open-source deep learning framework primarily used for computer vision such as object detection and image recognition. It is known for its small memory footprint and computational resource requirements, making it suitable for running on embedded devices and edge computing platforms. Darknet incorporates meticulously optimized code, resulting in exceptional inference speeds. It is founded upon the YOLO algorithm, which empowers real-time object detection through a single forward pass. In the context of designing a convolutional accelerator using HLS, this study referenced certain aspects of Darknet’s logic.
In this study, the Labelme annotation software was used to annotate the dataset captured on-site, identifying the parts that needed to be recognized. These parts included the workpiece and human body parts. Then, the label format conversion script provided by Darknet was used to convert the annotations into a text file format that the system could recognize. Finally, Darknet was launched to train the model, resulting in obtaining the weights after training.
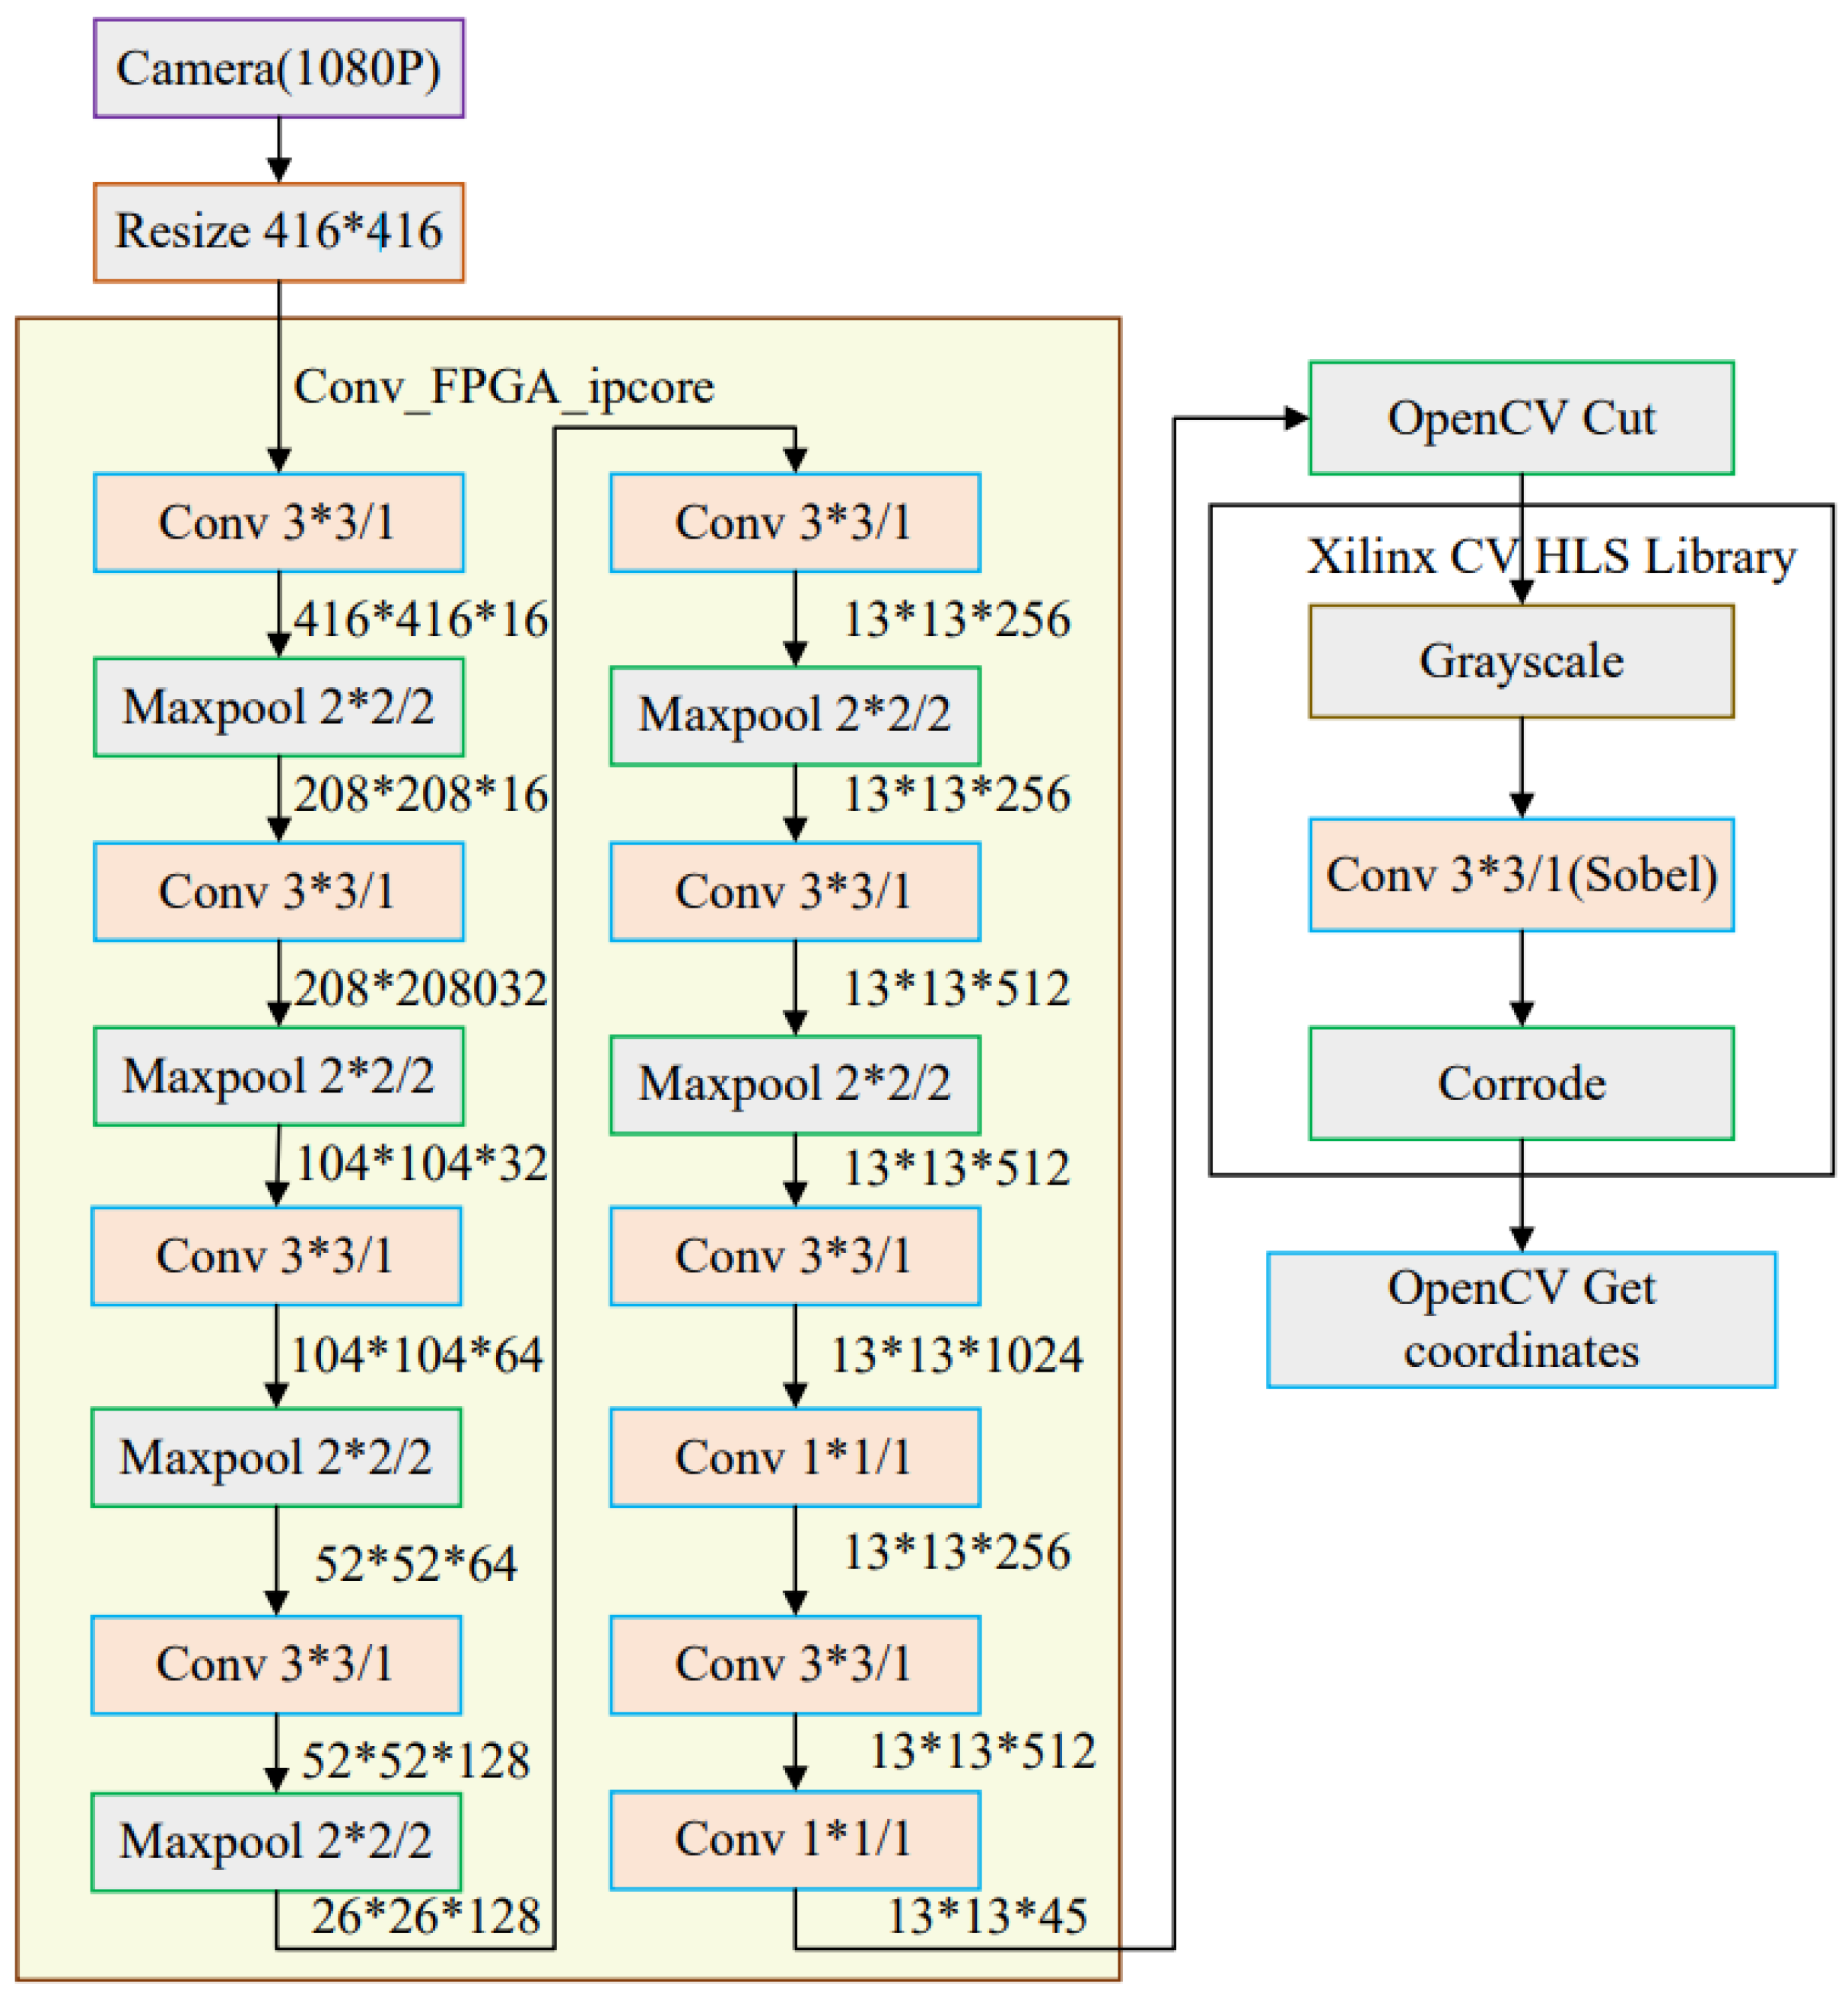
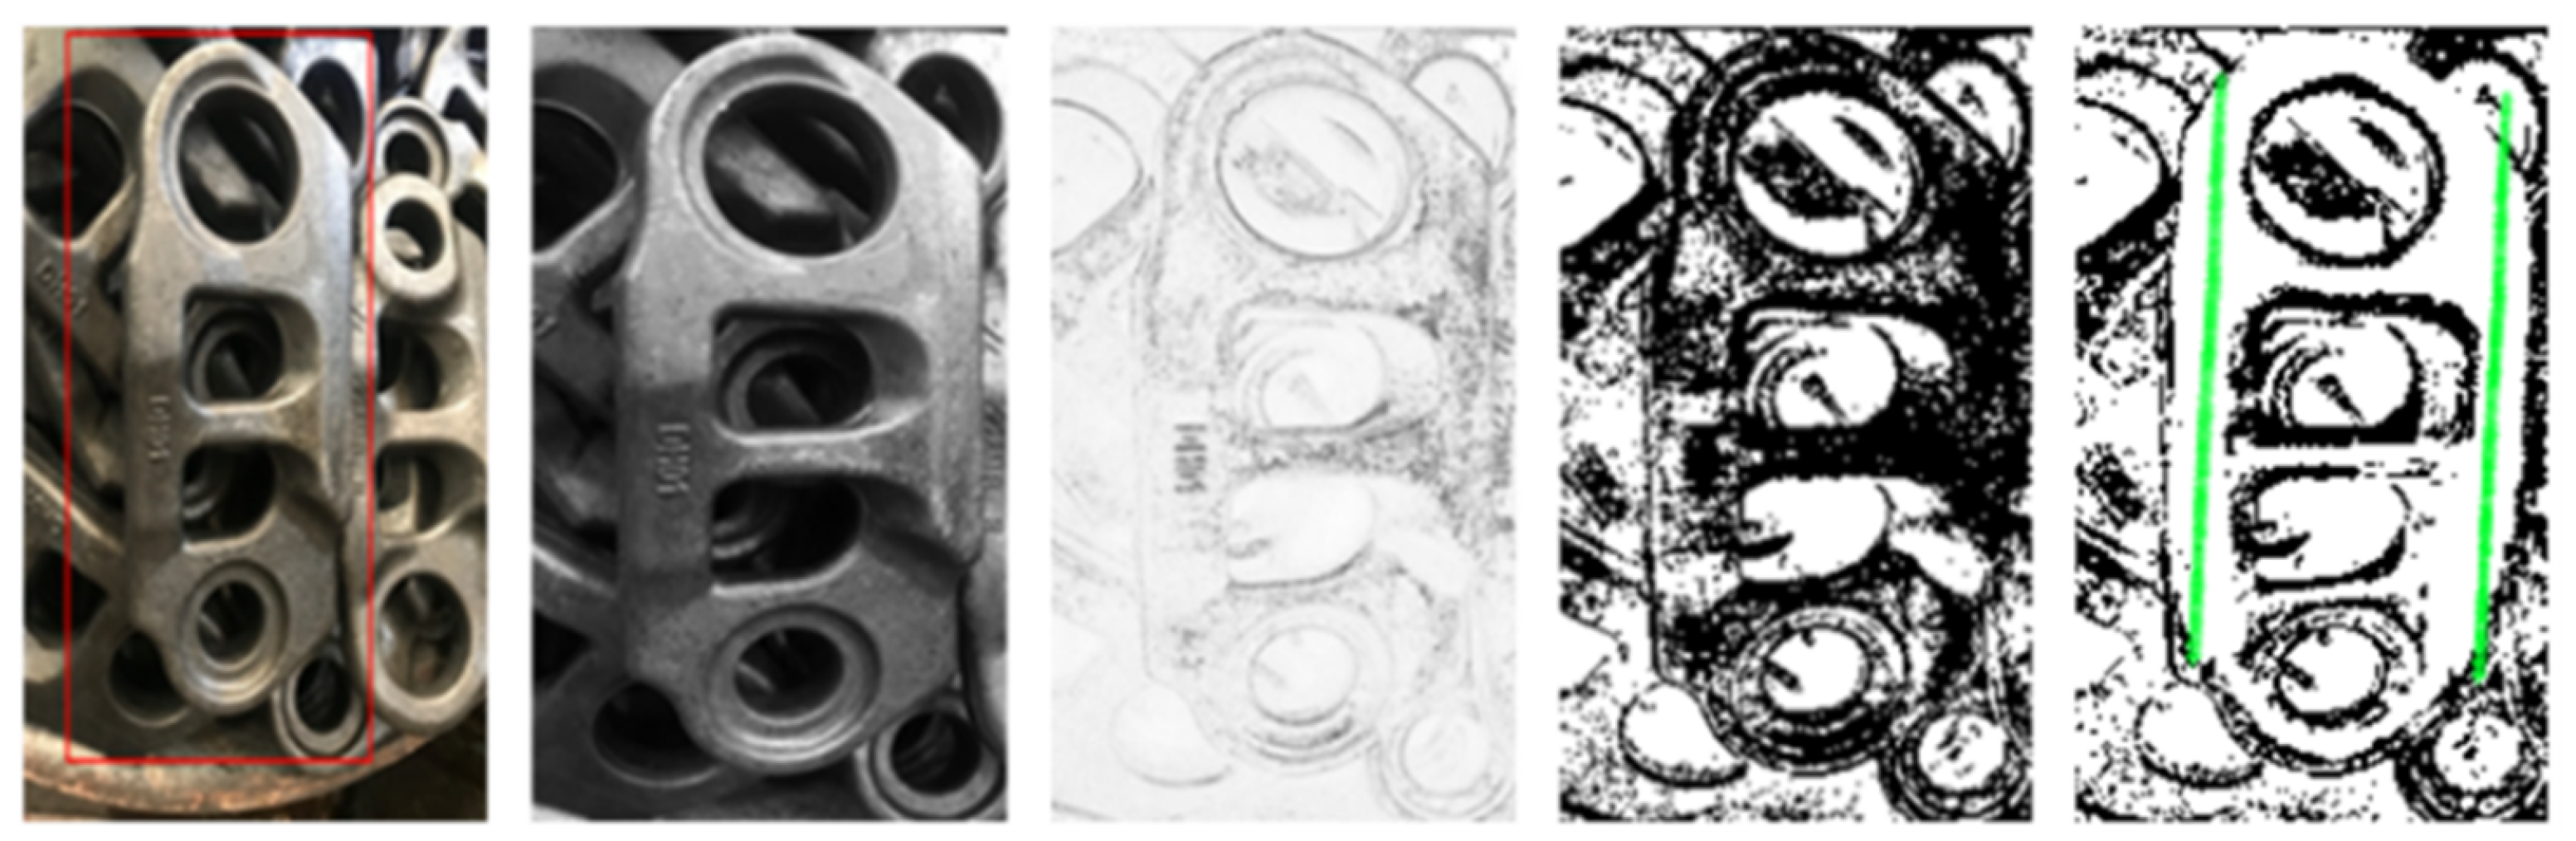
While this series of algorithms demonstrates strong performance in the realm of object detection, it is important to note that they may not be universally applicable to all detection scenarios. For the specific case of forged part position detection, it is necessary to design suitable methods and structures by simplifying and adjusting YOLOv3-Thiy. The network consists of 19 convolutional layers, and the default input image pixel is 416 × 416. Feature extraction is performed through convolutional layers; data reduction is performed through max-pooling layers; finally, a prediction feature map is generated. In YOLOv3-Tiny, two different pixel prediction layers, 13 × 13 and 26 × 26, were employed to detect large and small targets in the image. The experiments were conducted on the performance of the target detection network in the scenario described in this article. The results, as presented in Table 1, indicated that the small-scale output layers were completely redundant for the workpiece-position-detection task. After participating in fusion, they actually lowered the Mean Average Precision (MAP). The actual output layer that worked was the large-scale prediction layer. To enhance the detection speed, the 26 × 26 prediction layer was removed. This also facilitated memory management and pipeline optimization, shortening the software development cycle. Industrial cameras typically output 1080P-sized videos, and this paper’s detection only required low-resolution single images, so downsampling was necessary. In order to adhere to the input specifications of the neural network, the video signal was subjected to compression and caching processes using a video-processing Intellectual Property (IP) core developed by Xilinx. Figure 3 illustrates the architecture of the CNN grasp predictor. Figure 4 presents the results of the image processing. The red box represents the position of the workpiece after target detection, and the green line represents the angle of the workpiece obtained by feature matching.

Table 1.
Contribution of the prediction layer.
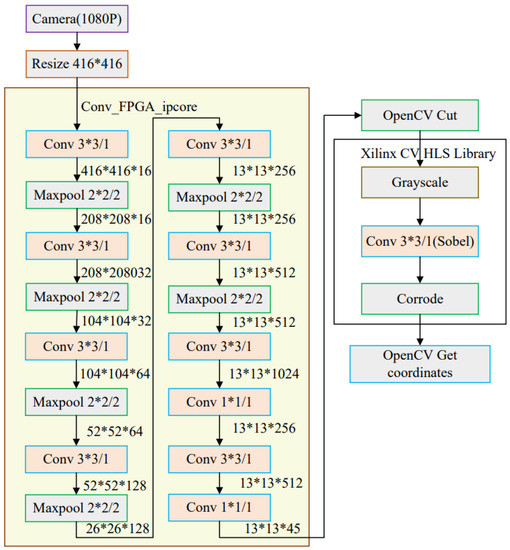
Figure 3.
The architecture of the CNN grasp predictor.

Figure 4.
The results of image processing.
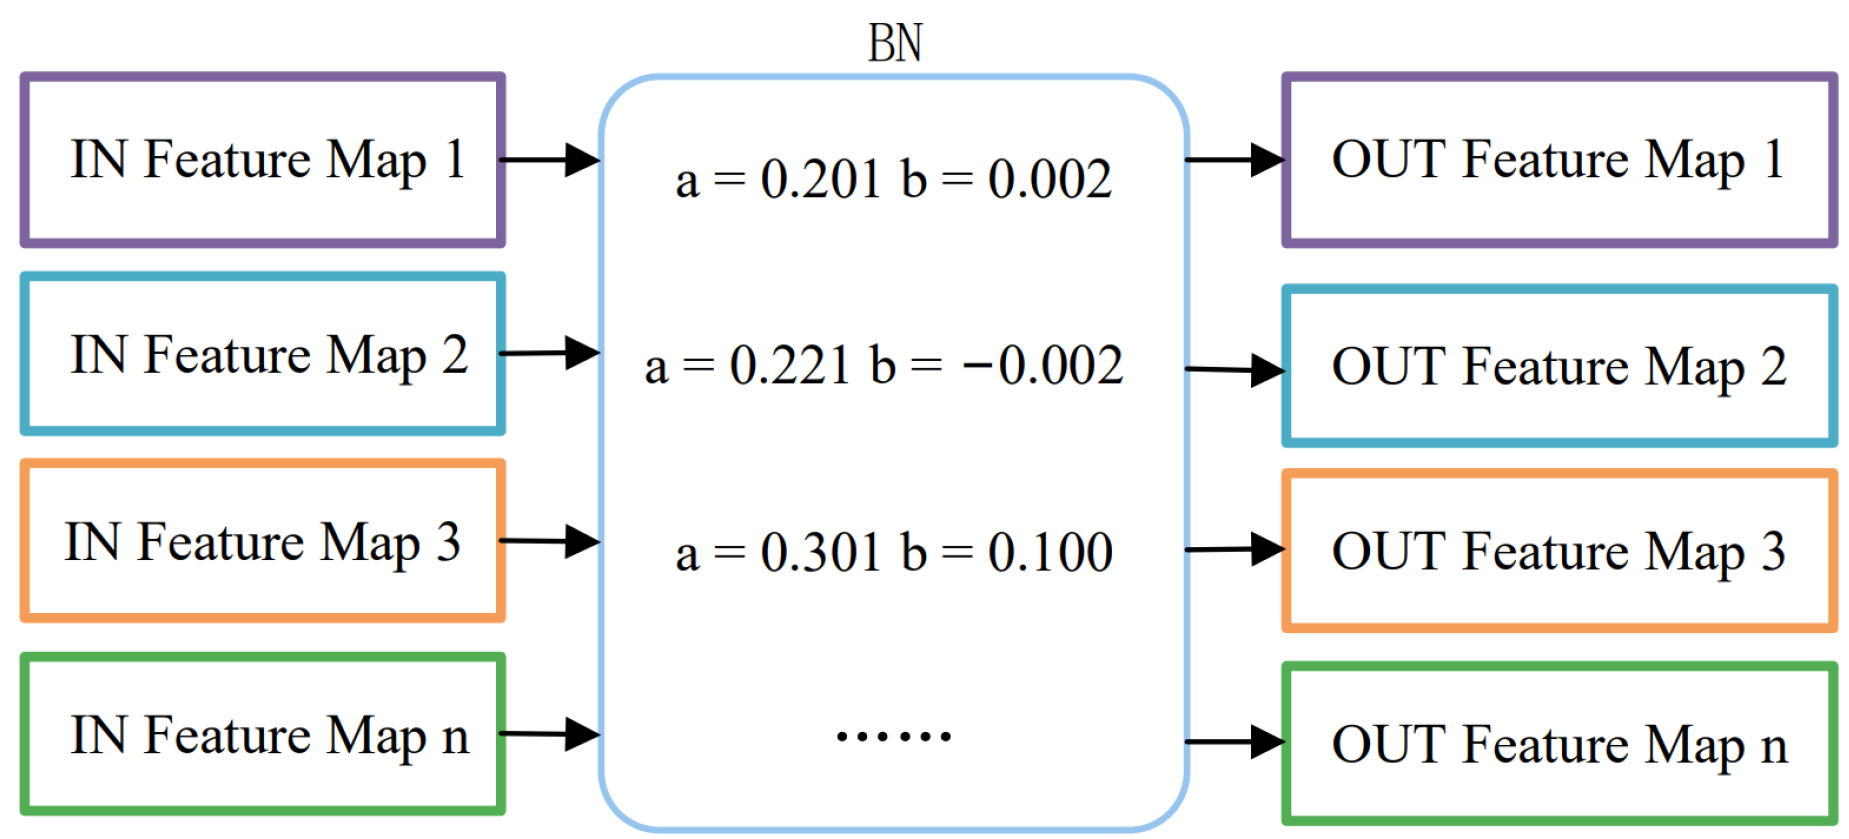
Standard model weight files contain many data parameters. Due to the limited performance of the ZYNQ platform, it was necessary to prune the model to compress the detection network [22] and enable faster execution on the platform. Different parameters contribute differently to the overall network, and some parameters have minimal or even zero contributions. Pruning the model can further reduce the parameter count and accelerate the computational speed. L1-norm pruning and Batch-Normalization (BN)-layer-based pruning can be employed for pruning. BN layers are commonly used in modern neural networks. In this paper, we propose a pruning algorithm based on the BN layer parameters, namely a and b. Here, a and b are two parameters used to determine whether the network needs to be pruned. Assuming the output values of the convolutional kernel layer are X, the output values of the BN layer can be calculated as follows:
where and are the scaling factor and shift parameter of the BN layer, and are the mean and variance of the shift parameter, and is a small constant added to the denominator to avoid division by zero. The output values are then passed through the Leaky ReLU activation function and propagated to the next layer. When the output is small, it becomes close to zero after the Leaky ReLU activation, indicating a minimal contribution to the network. Pruning based on a is more precise than pruning based on alone. This approach helps avoid excessive pruning when a is very small and b is very large.
The threshold values of this pruning algorithm need to be dynamically set based on the size of each convolutional layer. Since the size of each convolutional layer varies, using a fixed threshold would result in different contributions from parameters even if the parameter a is relatively small. If a parameter with a significant contribution is pruned due to an excessively small parameter a value, it can negatively impact the model’s accuracy. Therefore, in this pruning algorithm, the threshold value for parameter a is determined based on the number of input and output channels (C) and the width (W) and height (H) of each convolutional layer. The threshold for parameter a was set to , and parameter b was set to a fixed value of 0.0001. If the calculated value based on the formula was below the threshold, the corresponding channel in the current layer and its corresponding input channel in the next layer were considered low-contribution channels and were pruned. Figure 5 depicts the schematic diagram illustrating the pruning of the BN layer, specifically the pruning of the connection of Feature Map 3.
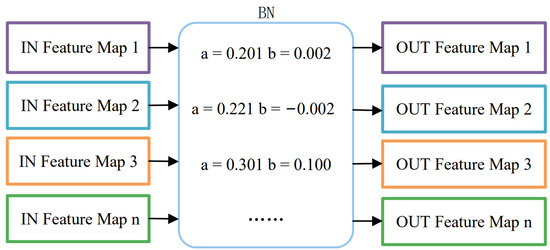
Figure 5.
The pruning network model.
In the standard model weight file, the data accuracy was high and occupied more space and bandwidth, and the CNN had low sensitivity to the accuracy of the parameters, so the bit width of the data can be reduced to reduce the pressure of data transmission and storage. In this paper, the parameters were quantized using a quantization method similar to that used in [23,24]. The dynamic fixed-point quantization was divided into input–output feature map quantization and intermediate result quantization. The number of fixed points can be expressed by the following equation:
where denotes the bit width of the fixed-point number and exp denotes the order code. The fixed-point number is represented by a complementary code, and the highest bit is the sign bit.
The principle is similar: first, find the weight order of each layer.
In the above equation, represents the floating-point value of the original weights in a layer, while represents the fixed-point value of after quantization with a given bit width bw and exponent , then converted back to floating-point format . This equation can be used to determine the optimal exponent for quantizing the weights and biases to minimize the error between the quantized and original weights and biases. The quantization of input/output feature maps and intermediate results for each layer is similar, but not described in detail here.
In this section, a concise introduction was provided for the model acquisition and data annotation methods. During the model processing phase, model quantization, a widely adopted technique, was employed to reduce its size. Furthermore, a novel model pruning method based on BN layer parameters was proposed, aiming to alleviate the excessive pruning commonly observed in weight-based pruning approaches. This method effectively reduced the parameter count while maintaining the model’s performance. After these optimizations, the resulting object detection module, running on the FPGA, is referred to as TYDET.
2.3. IP Core Design
In the YOLO algorithm, the convolutional layer and the max-pooling layer are known to impose significant computational demands. As a result, these two components are typically computed on the PL to leverage its parallel processing capabilities, while the remaining computations are performed on the (PS). The convolutional layer plays a pivotal role in feature extraction throughout the object detection system. To enhance the parallel computing speed of the convolutions, an array tiling technique was implemented, facilitating the convolution operation on smaller blocks of input data. By loading only one data block at a time, the utilization of Block RAM (BRAM) resources was significantly reduced. Furthermore, the Winograd fast convolutional algorithm was incorporated and adapted for FPGA deployment. This algorithm effectively reduces the number of required multiplications, thereby reducing the overall computational complexity. The integration of the Winograd algorithm on FPGAs optimized the convolutional operation and enhances the computational efficiency of the system.
For one-dimensional convolution process (where m is the output matrix size and r is the convolution kernel size), each time the Winograd algorithm is called, a matrix of size is simultaneously generated. The formula for calculating the output matrix Y is , where G is the convolution kernel transformation matrix, A and B are the input transformation matrices, g is the convolutional kernel, d is the input vector, and Y is the output transformation matrix.
For two-dimensional convolution , a matrix of size is simultaneously generated each time this algorithm is called. The formula for calculating the output matrix Y is . The Winograd fast convolutional algorithm can transform the input feature map and convolution kernel into matrices of the same dimension. The transformed matrices are then convolved by the dot product. For the sliding window convolution calculation of F(2,3), six multiplications and four additions are required. Indeed, the Winograd convolutional algorithm reduces the number of multiplications required compared to traditional convolution methods. However, it introduces additional additions. Fortunately, FPGA devices have a significantly faster speed for performing additions compared to multiplications. This characteristic allows for reduced computational latency and efficient utilization of chip resources. By leveraging the speed advantage of FPGA-based additions, the Winograd convolutional algorithm effectively optimizes the computation and frees up resources for parallel optimization, leading to improved overall performance and resource utilization in the system.
The max-pooling layer is usually placed right after the convolutional layer, and its function is to downsample the feature map and reduce its size. Since the sliding pattern of the output window in Winograd convolution is completely identical to that of the pooling window, the calculation of max-pooling and convolution can be fused. The fusion process corresponds to the writeOutputBufMaxPool function module of Algorithm 1, which first performs activation and then obtains the final result of fused convolution and pooling through three comparators, to minimize latency. The pseudocode of the convolutional layer for Winograd fast convolution is as follows.
| Algorithm 1 Winograd fast convolutional algorithm. |
| Require: , , , , , , , |
| Ensure: |
| Set: input feature map buffer, InputPixelBuffer[Tcin][Txin][Tyin]; bias buffer, BiasBuffer[Tcout]; |
| convolution kernel buffer, WgihtBuffer[Tcout][Tcin][K][K]; K is generally 3; output feature map |
| buffer, OutputPixelBuffer[Tcout][Txout][Tyout]. |
| for to by 2 do |
| for to by 2 do |
| for to by 2 do |
| for to by 2 do |
| getInput() |
| BTdB() |
| getWeight() |
| GgGT() |
| ATelementMulA() |
| writeMaxPoolbuffer() |
During program execution, the 4 × 4 feature map is read from the InputPixelBuffer and the 3 × 3 weights are read from the WeightBuffer simultaneously. TransInput and TransWeight are the transformed input feature map and weights, which are processed by four parallel matrix calculation modules. The resulting output feature map is obtained through an addition tree structure and stored in the MaxPoolbuffer, ready for the next layer to call.
Following the design of the IP core, meticulous optimization of the layout and routing becomes imperative. This optimization process entailed leveraging pipeline design, array partitioning, and loop unrolling techniques to maximize resource utilization. Initially, the Array_partition optimization directive was applied to enable efficient array partitioning. This technique facilitates concurrent data reading between different rows, promoting data throughput and enhancing overall performance. Moreover, judicious conversion of several temporary arrays employed in calculations to register types helps curtail the utilization of the BRAM. By reducing reliance on the BRAM and minimizing latency during pipeline execution, this approach contributes to improved efficiency. The Loop_unroll directive represents another crucial optimization strategy in the design process. By fully unrolling the for loops, parallel execution of loop iterations is realized. This strategic utilization of resources ensures optimal utilization and accelerates computation. Additionally, the pipeline directive plays a pivotal role in pipeline optimization. By unfolding tasks, it enables the overlap of computations, effectively reducing the overall computation time. Notably, pipeline optimization often yields significant performance enhancements, sometimes achieving several-fold or even dozens-fold improvements.
By incorporating these optimization directives, the layout and routing of the IP core underwent meticulous refinement, resulting in improved performance and optimal utilization of system resources. The resultant improvements manifested as enhanced computational efficiency and overall system performance.
In this section, the convolutional algorithm from YOLOv3-Tiny was implemented and optimized on an FPGA. Through testing, it was determined that the optimized implementation yielded a significant reduction in computational latency of approximately 7%, while effectively maintaining the desired level of parallelism. Additionally, there was a 17% reduction in DSP resource usage and approximately a two-times reduction in the FF and LUT utilization rates. This subsection provides valuable ideas for optimizing performance in IP core design.
2.4. Anti-Interference Bus Design
Due to the significant electromagnetic interference generated by industrial equipment such as medium-frequency furnaces, the noise voltage produced can exceed the voltage levels of traditional field buses. This situation leads to valuable signals being obscured by the noise, even when utilizing differential buses, which can result in data loss or even bus failure.
Therefore, in this study, the CAN bus signals were regenerated by adding drivers to increase the voltage level from approximately 2.5 V to approximately 6 V to counteract electromagnetic interference. The higher voltage level helps suppress some noise, increasing the current on the bus to ensure a more stable transmission. Additionally, a receiving filtering circuit was implemented to enhance the Signal-to-Noise Ratio (SNR) of the received signals and reduce the impact of common-mode and differential-mode interference on system operation.
The bus control module was equipped with an STMicroelectronics microcontroller as the main control chip, which was directly connected to the CAN transceiver TJA1050 and two analog switches. To ensure scalability and enhance the reliability of the bus module, the microcontroller software is structured into two layers: the system layer and the application layer. In the system layer, the FreeRTOS embedded operating system oversees three essential tasks. Task 1 involves an enhanced CAN bus driver responsible for device connectivity, while Task 2 manages the RS485 serial port driver, enabling communication with the main control PLC. Task 3 handles the analog switch driver and bus status monitoring. The synchronization of the data and control commands among these tasks was achieved through the utilization of semaphores. The bus operated in a half-duplex mode, eliminating the need for a microcontroller and CAN transceiver chip at the transmission end, as this functionality was integrated into the PL portion of the ZYNQ system. However, a microcontroller and CAN transceiver chip were essential at the PLC end. To enhance reliability, the nodes were interconnected in a ring topology, as depicted in Figure 6.
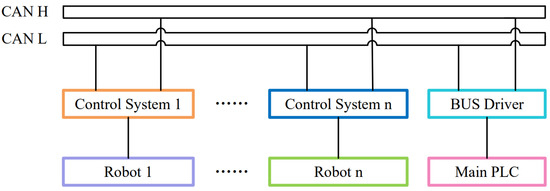
Figure 6.
Bus connection block diagram.
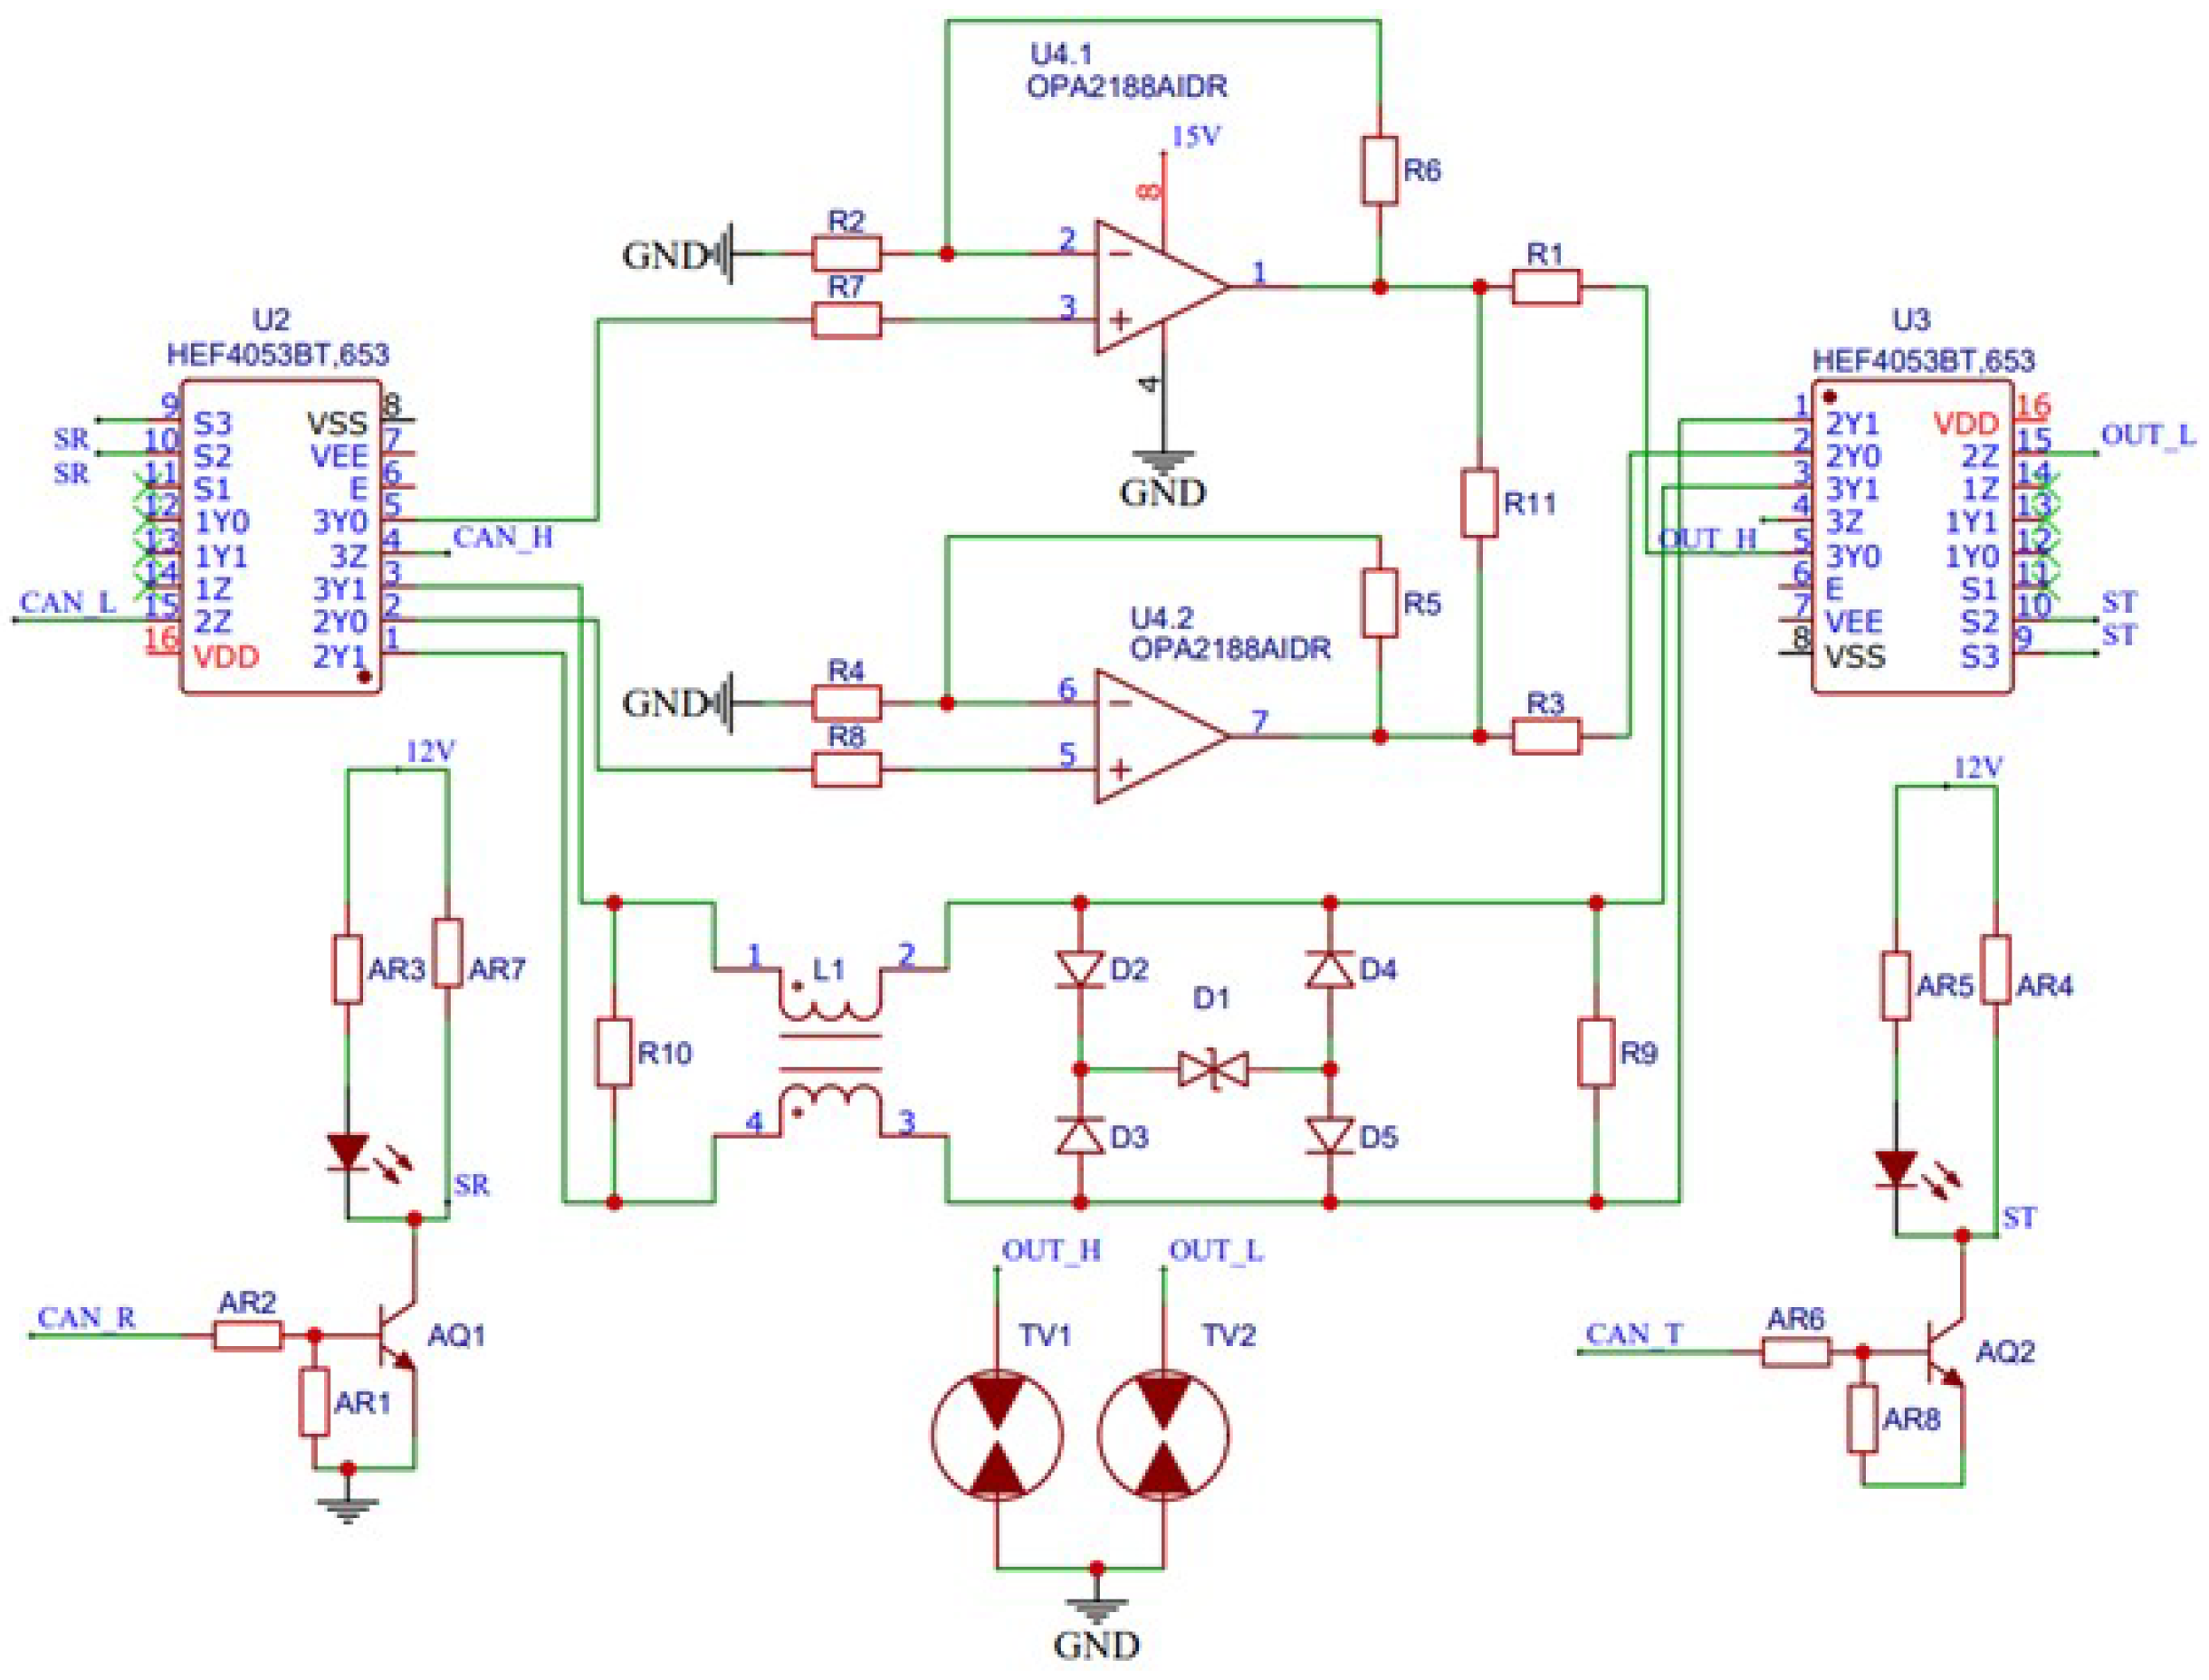
The bus driving circuit consists of a transmission section and a reception section. The sending circuit consists of the first analog switch, the amplification circuit, and the No2 analog switch, while the receiving circuit is composed of the second analog switch, the filtering circuit, attenuation circuit, and the No1 analog switch. The amplification circuit utilizes the precision operational amplifier ICs, which were OPA2188AIDR, which feature zero-drift and rail-to-rail characteristics. The analog switches employed in the circuit were HEF4053BT. When in data-sending mode, the operational amplifier amplifies the low-voltage small-current signal from the transceiver chip to a high-voltage high-current driving signal, which is then transmitted to the bus through the second analog switch. The bus should use a shielded twisted pair wire with a cross-sectional area of no less than 0.2 . For the system diagram, refer to Figure 7.
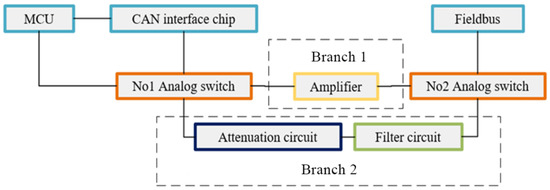
Figure 7.
Block diagram of bus driver circuit.
If data transmission is required, the microcontroller or ZYNQ establishes the transmission mode by connecting through Branch 1. The operational amplifier then processes the signal through amplification and driving operations. Conversely, when the node is not transmitting, it enters the receiving mode by enabling Branch 2, allowing continuous monitoring of signals on the bus. The receiving node’s serial port can be connected to devices such as the PLC for monitoring the operational status of each robot’s object detection system and handling emergency stop signals triggered by detected hazards.
The receiving filter circuit is shown in the lower part of Figure 8, which includes a common-mode inductor and a full-bridge rectifier circuit. When common-mode interference occurs, because the current of the common-mode interference has the same direction, a magnetic field with the same direction is generated in the coil of the common-mode inductor L1, which increases the inductive impedance of the coil. The coil exhibits a high impedance, producing a strong common-mode interference damping effect. When differential-mode interference occurs, the diodes within the full-bridge rectifier circuit conduct in an alternating manner. This process converts the energy of the differential-mode interference into direct current, which is then dissipated through the transient suppression diode connected to the DC output end of the rectifier bridge. Because the signal received by the receiving end is the signal sent by the sending end superimposed with interference during the transmission process, a voltage regulator diode D2, and a resistor R10 are provided to reduce the voltage of the input analog switch and the CAN bus transceiver chip. In addition, the high-level signals are trimmed to remove any uneven portions. This trimming process ensures that the signals received by the input bus transceiver chips comply with their respective input voltage requirements. This measure was taken to prevent damage to the bus interface transceiver chips. In this section, the working principles of the CAN bus improvement scheme and the specific component models used in the system were elucidated.
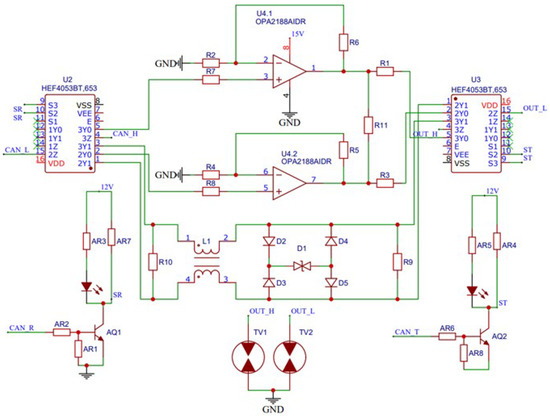
Figure 8.
Bus driver circuit diagram.
3. Experimental Results
3.1. Target Detection Part Experiment
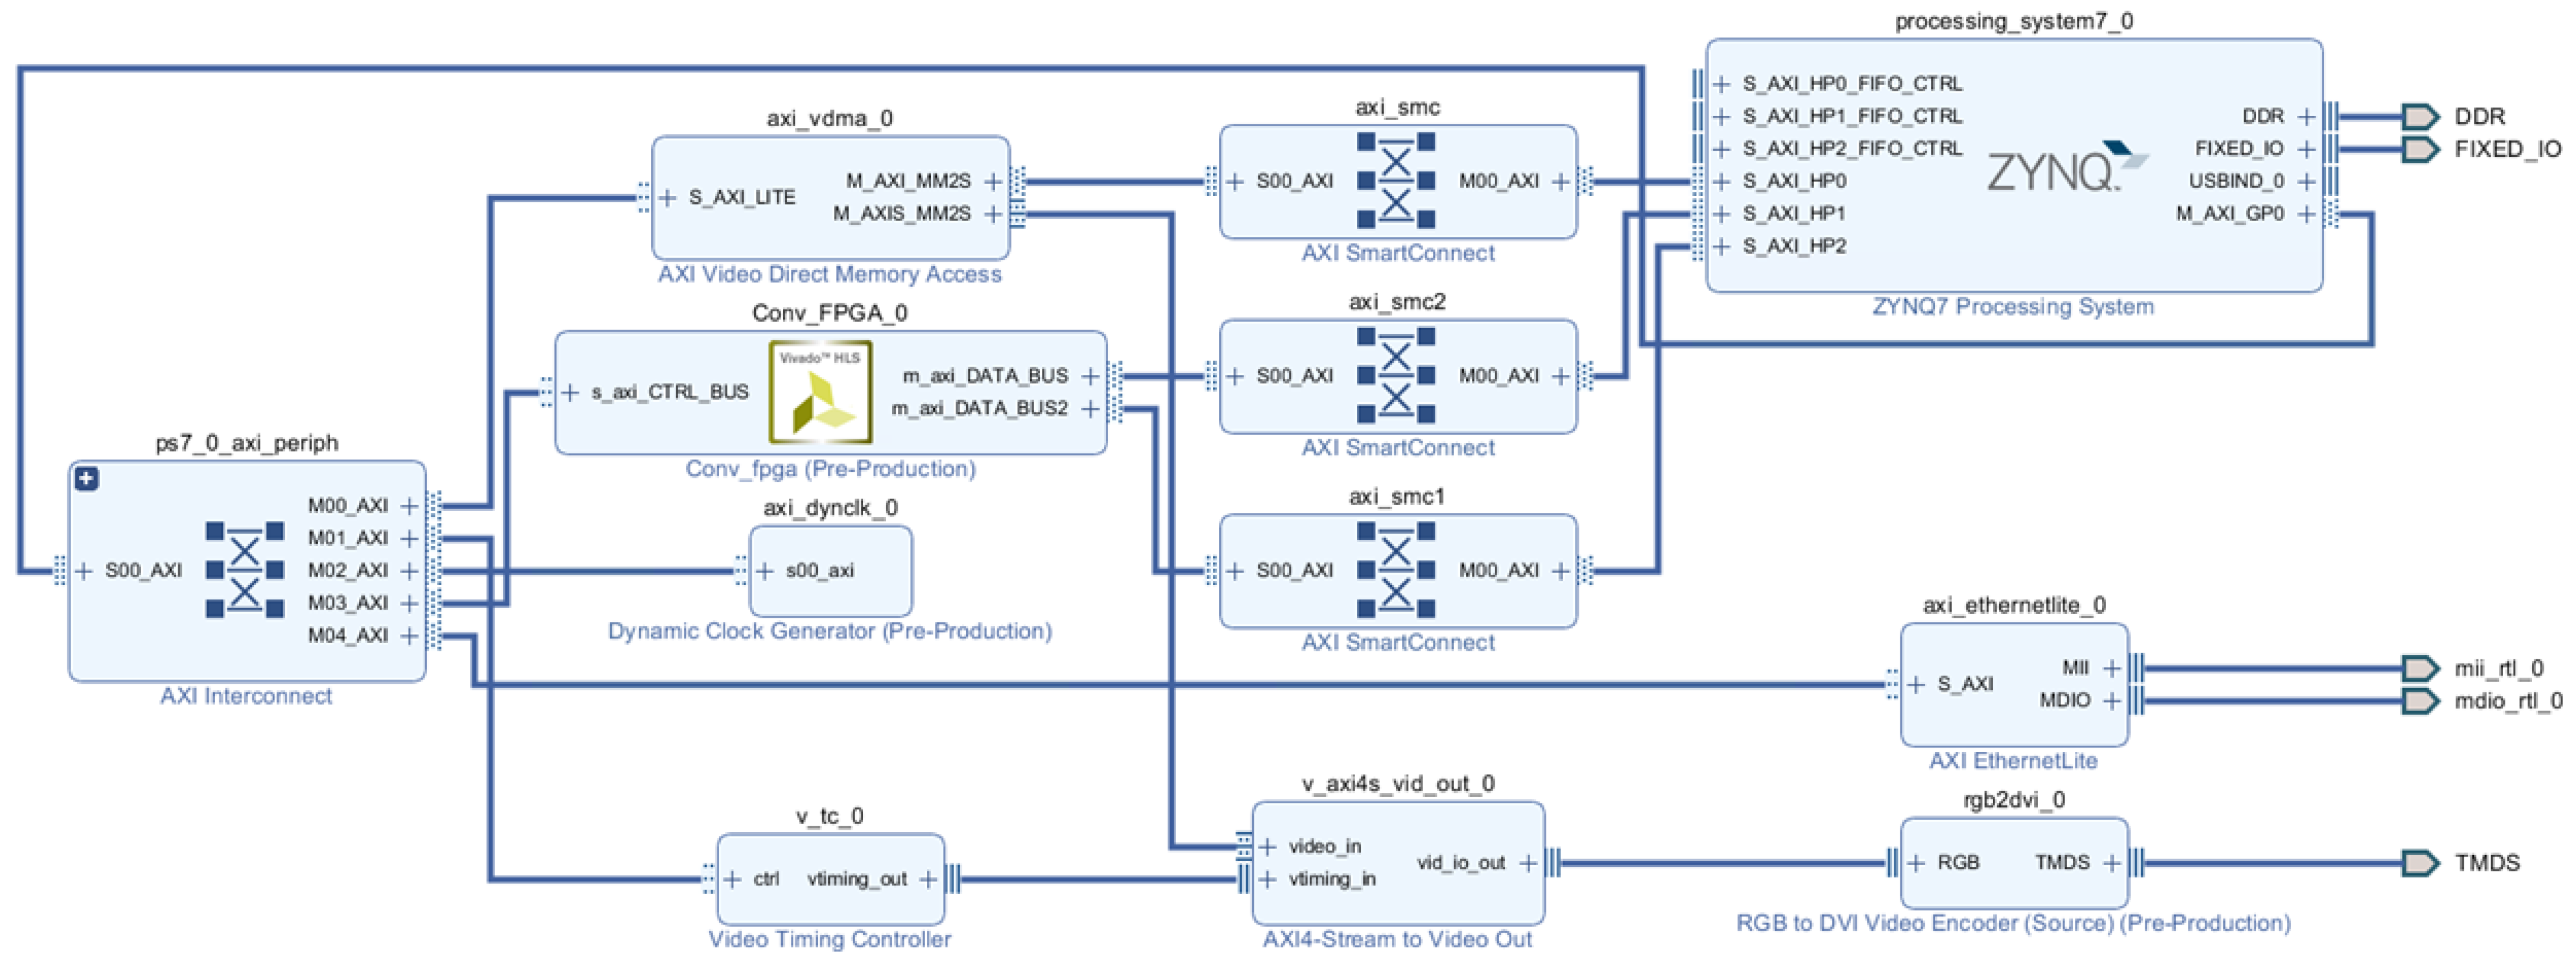
The target detection and verification platform used the Xilinx ZYNQ XC7Z020-1CLG 400C. The PL part contained 53,200 lookup tables and 630 KB BRAM, while the PS part was equipped with a dual-core Cortex-A9 processor and 1 GB DDR3 memory (512 MB 16 bit 2 chips). The hardware part was designed using Vitis HLS 2022.1. After generating the IP cores, the Vivado 2022.1 was used to combine with other modules for layout and wiring, and the connection between the modules is shown in Figure 9. Table 2 shows the logic resource usage of this design. Due to the pursuit of speed, the multiplication and addition operations were expanded to the maximum, and a large amount of on-chip resources was consumed due to the usage by other input and output modules.

Figure 9.
Module connection diagram.
Table 2.
Resource consumption of the FPGA part.
In the context of this paper’s scenario, the network degradation led to a reduction of approximately 8% in the number of parameters, resulting in faster operation. When evaluated on the dataset used in this paper, the Mean Average Precision (MAP) value decreased from 0.86 before degradation to 0.75. Despite a marginal decline in the MAP value, the training speed witnessed a substantial enhancement. Figure 10a portrays the loss reduction curve of the initial network, while Figure 10b visualizes the loss alteration curve subsequent to degradation.
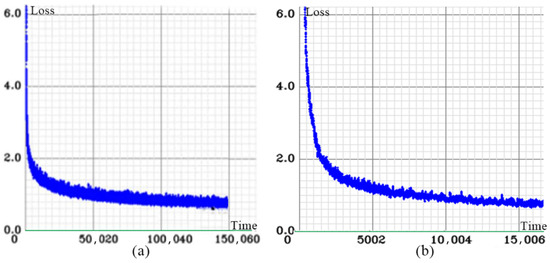
Figure 10.
Two network loss drop graphs.
By applying pruning, the model achieved a further reduction in parameter count, resulting in a lighter object-detection model. Table 3 presents the pruning results for each convolutional layer in the degraded network, indicating a reduction of approximately 24% in parameter size with only a 0.04 decrease in the MAP. The combined optimization measures led to a 30% decrease in parameter size compared to the original YOLOv3-Tiny model. Additionally, the utilization of the Winograd fast convolution contributed to a reduction in chip resource usage. Table 4 provides a speed comparison between our optimized network (TYDET) and the original network (YOLOv3-Tiny) running directly on the ZYNQ platform. To ensure a fair evaluation of the optimization effects, the operating frequency was controlled and the resource consumption was similar for both approaches. The significant speed improvement outweighed the slight decrease in the MAP, making it a valuable trade-off.
Table 3.
The amount of pruning per convolutional layer.
Table 4.
Performance comparison with other devices.
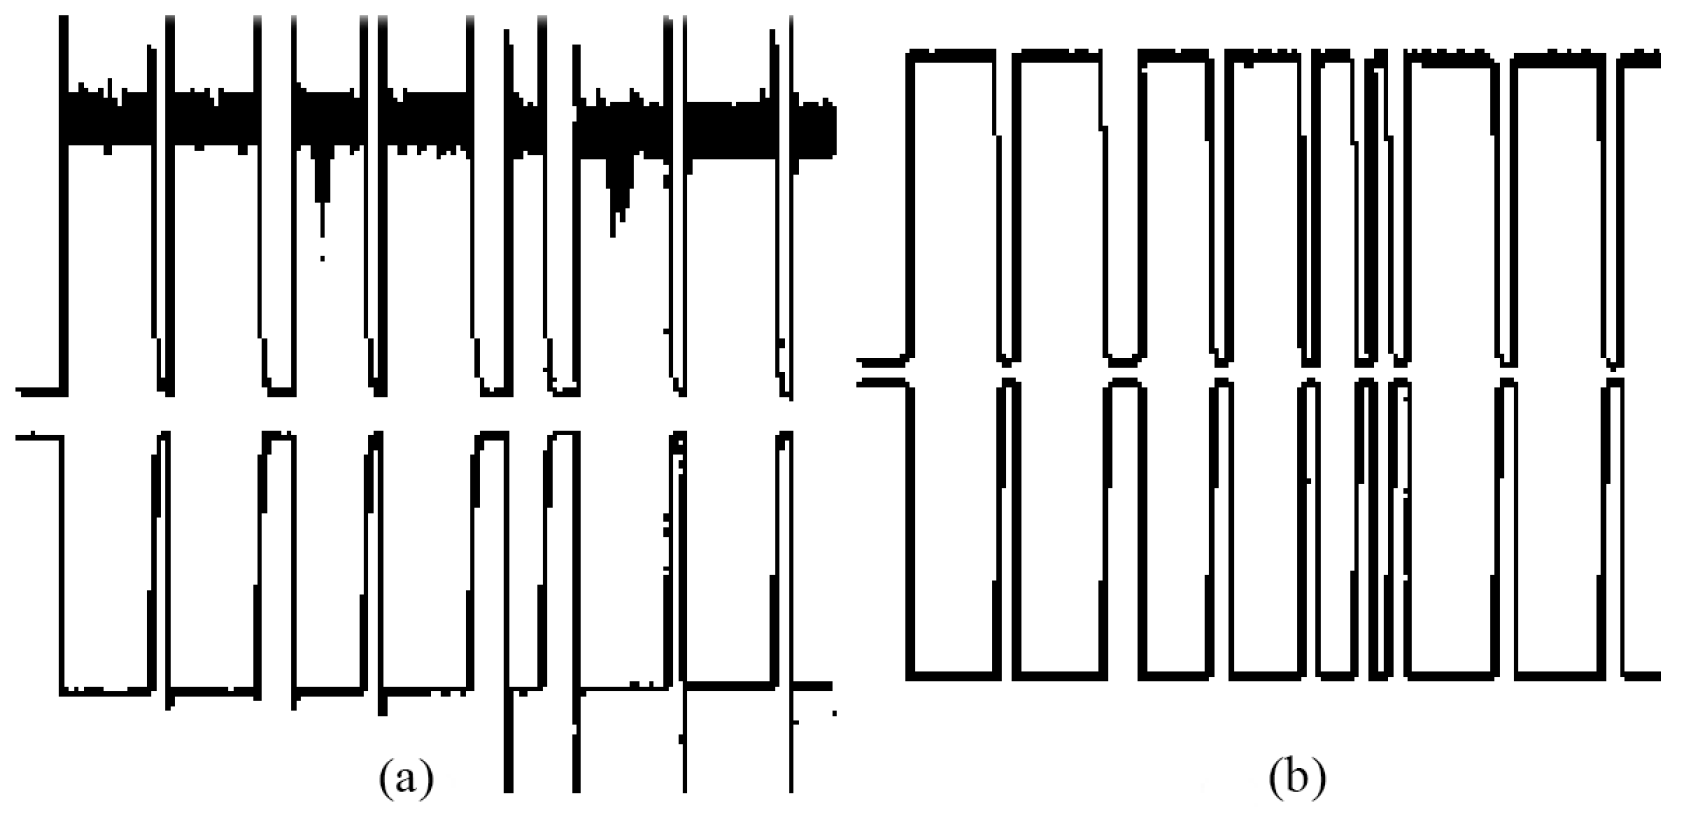
A signal generator was used to generate Gaussian noise with a center frequency of 300 Hz, simulating the interference typically found in industrial environments. A signal injection transformer injected the noise signal into the improved CAN bus. In the testing phase, data transmission was conducted at a baud rate of 36 K. It was observed that the validated data quantity increased by approximately 10% compared to the original bus, demonstrating the significant effectiveness of the applied regeneration and filtering techniques in mitigating electromagnetic interference on the bus. The comparison of the waveforms received by the receiver before (a) and after (b) regeneration is shown in Figure 11, indicating that some interference was suppressed.
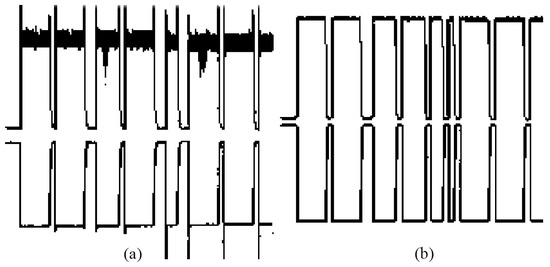
Figure 11.
Comparison of received waveforms before and after regeneration.
3.2. Overall Effect Evaluation
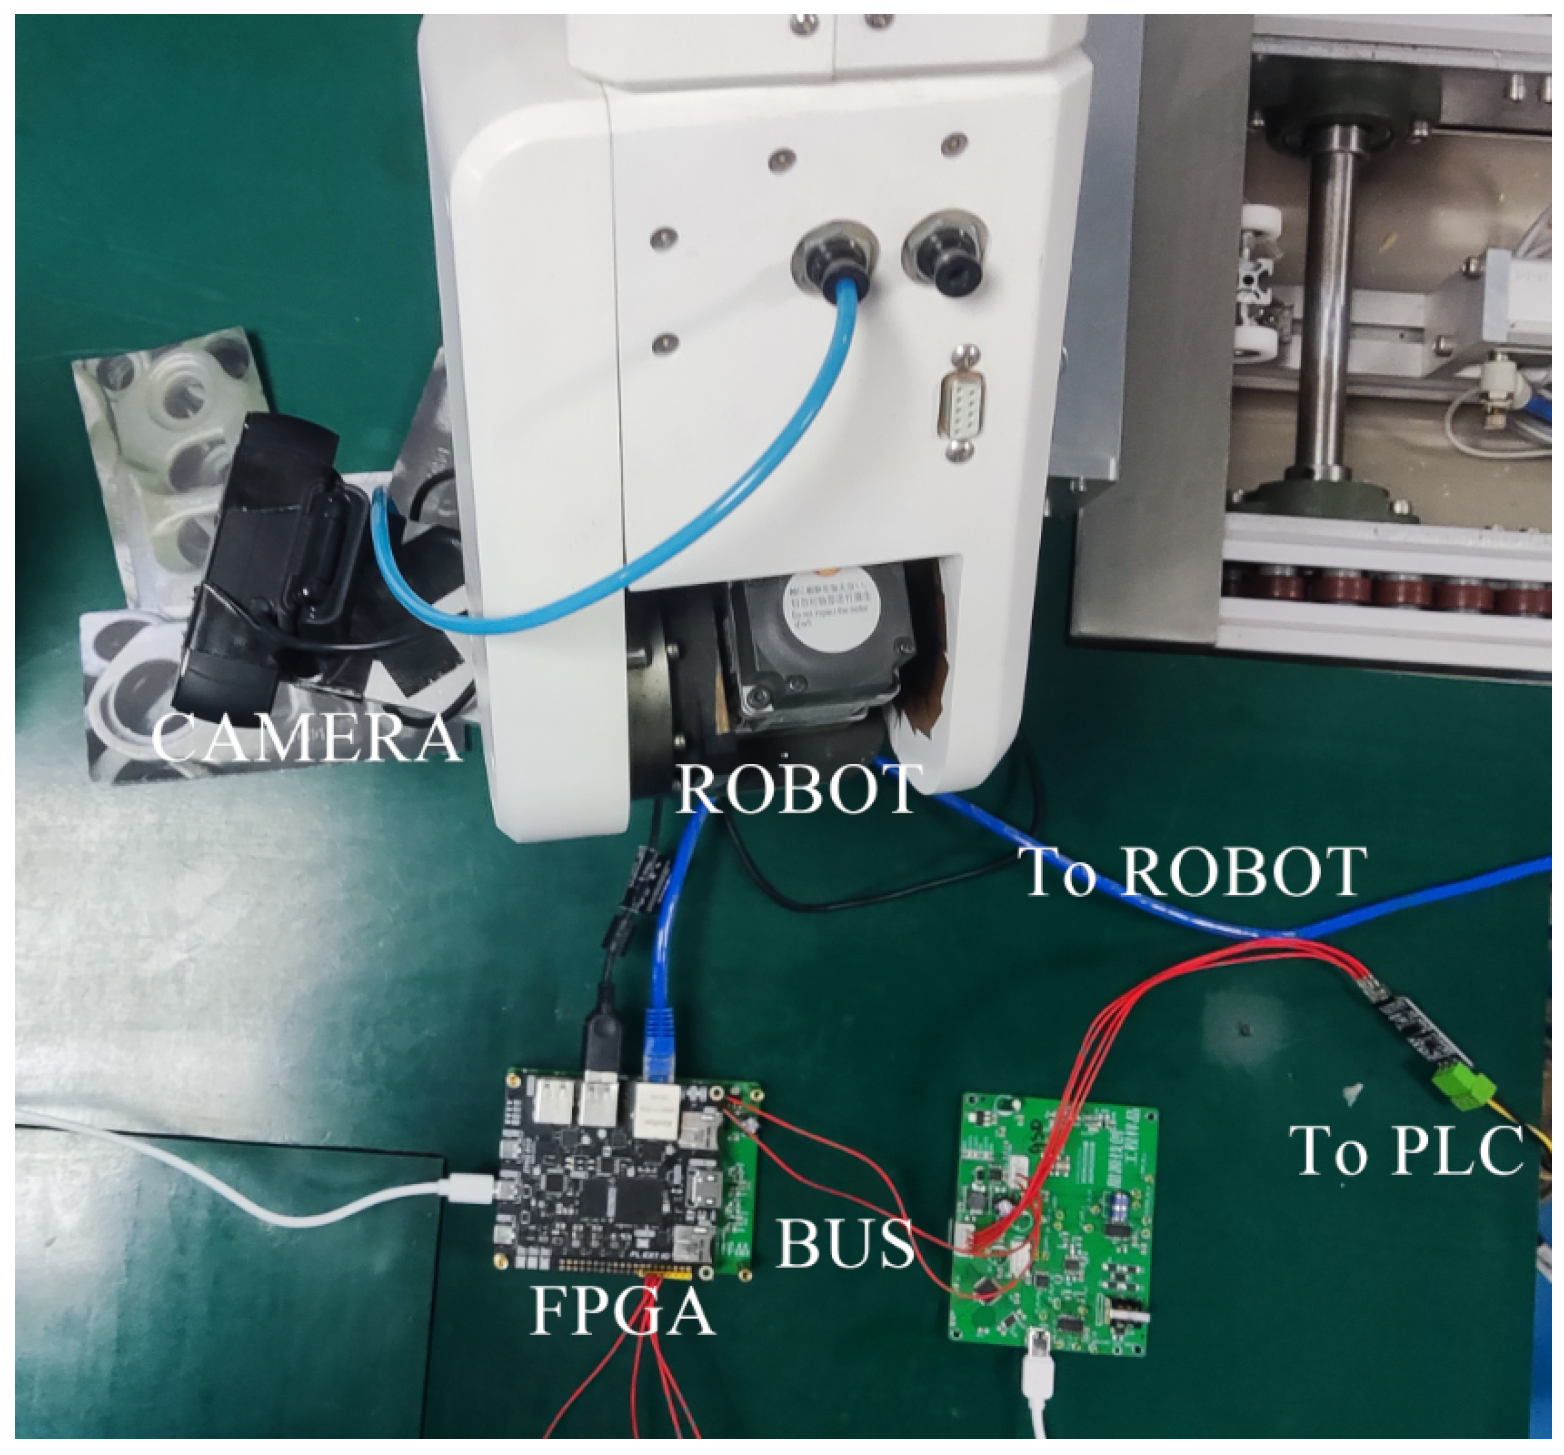
The test used the DOBOT DT-DB-SC160-00I robot. In the actual production environment, electromagnets are used for gripping. However, due to the limited load-bearing capacity of the laboratory robot, it was not possible to bring the workpieces from the production environment to the laboratory for testing. Therefore, the laboratory tests used printed pictures of workpieces and vacuum nozzles for the gripping tests. The camera was fixed at the end of the robot, and the coordinates were calculated according to the aforementioned logic run; the coordinates obtained from the system detection were sent to the robot using Ethernet, and the detection status was sent from the bus to the PLC. Then, the PLC sent a start signal to the robot and controlled the robot to grasp the target object. Figure 12 shows a photograph of the test site, where the debugging network port was not connected during the field debugging.
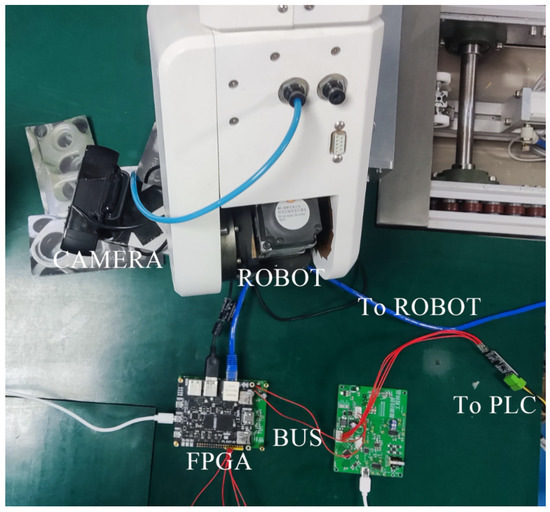
Figure 12.
On-site testing.
The effectiveness of the overall testing is depicted in Table 5, illustrating that this system’s performance rivaled that of bin-picking systems utilizing point cloud algorithms. Moreover, its higher integration, lower power consumption, and reduced heat generation make it more suitable for operation in harsh environments, effectively resolving the issue of unstable operation encountered by other solutions. As the workpieces manufactured in such environments are typically very large, the decrease in precision had a minimal impact on accurate grasping. Furthermore, the affordability of this system contributes to the widespread adoption of machine vision in small forging factories.
Table 5.
Speed comparison of the two implementations.
4. Discussion
This study focused on a disorderly bin-picking system designed for robots and explored three optimization methods for deploying neural networks on FPGAs. These methods demonstrated substantial advancements over existing approaches and enabled the calculation of workpiece positions on embedded platforms, providing guidance to robot operations in bin-picking tasks. The experimental results, as presented in Table 5, demonstrated that, with the exception of accuracy, all other parameters outperformed the PowerPICK3D system, which relied on point cloud computation. This highlighted the effectiveness of the proposed target-detection and feature-matching methods for bin-picking large objects using robots. High accuracy is not a critical requirement in manufacturing environments where workpieces are predominantly of large volume. Furthermore, our system implementation cost was approximately one-tenth of the PowerPICK3D system. Additionally, we developed an interference-resistant bus design that not only reduced the number of connection wires, but also simplified the installation and decreased the failure rates.
In future developments, the integration of the camera and data-processing components into a sealed system is planned to enhance system stability. This will be achieved by connecting different modules through Ethernet cables, offering advantages over other position-detection systems. This bin-picking system is ideally suited for demanding and cost-sensitive work environments, such as small forging plants. The field bus design in this paper showed good interference resistance. However, to prevent waveform distortion at higher baud rates, it is crucial to consider factors such as operational amplifier bandwidth and distributed line capacitance. Therefore, the bus processing method proposed in this paper is more suitable for long-distance low-speed transmission. To enhance detection robustness, one can investigate the utilization of higher-capacity chips and the incorporation of deep learning techniques for angle determination instead of relying solely on feature matching. Additionally, optimizing the bus driver board by adopting devices with higher bandwidth will contribute to further increasing the transmission speed.
Author Contributions
Conceptualization, T.Z. and B.S.; methodology, T.Z. and B.S.; software, T.Z.; validation, T.Z.; investigation, T.Z.; writing—original draft preparation, X.Y.; writing—review and editing, T.Z., B.S., H.L. and C.C.; supervision, B.S.; project administration, B.S. All authors have read and agreed to the published version of the manuscript.
Funding
This research received no external funding.
Data Availability Statement
The data presented in this study are available on request from the corresponding author. The data are not publicly available due to privacy or ethical.
Conflicts of Interest
The authors declare no conflict of interest.
References
- Moltó, E.; Aleixos, N.; Blasco, J.; Navarrón, F. Low-Cost, Real-Time Inspection of Oranges Using Machine Vision. IFAC Proc. Vol. 2000, 33, 291–296. [Google Scholar] [CrossRef]
- Zou, Z.; Chen, K.; Shi, Z.; Guo, Y.; Ye, J. Object Detection in 20 Years: A Survey. Proc. IEEE 2023, 111, 257–276. [Google Scholar] [CrossRef]
- Redmon, J.; Angelova, A. Real-Time Grasp Detection Using Convolutional Neural Networks. In Proceedings of the 2015 IEEE International Conference on Robotics and Automation (ICRA), Seattle, WA, USA, 26–30 May 2015; pp. 1316–1322. [Google Scholar]
- Song, Z.; Chung, R.; Zhang, X.-T. An Accurate and Robust Strip-Edge-Based Structured Light Means for Shiny Surface Micromeasurement in 3-D. IEEE Trans. Ind. Electron. 2013, 60, 1023–1032. [Google Scholar] [CrossRef]
- Connolly, C. A New Integrated Robot Vision System from FANUC Robotics. Ind. Robot. Int. J. 2007, 34, 103–106. [Google Scholar] [CrossRef]
- He, K.; Zhang, X.; Ren, S.; Sun, J. Deep Residual Learning for Image Recognition. In Proceedings of the IEEE Conference on Computer Vision and Pattern Recognition (CVPR), Las Vegas, NV, USA, 27–30 June 2016; pp. 770–778. [Google Scholar]
- Yu, J.; Guo, K.; Hu, Y.; Ning, X.; Qiu, J.; Mao, H.; Yao, S.; Tang, T.; Li, B.; Wang, Y.; et al. Real-Time Object Detection towards High Power Efficiency. In Proceedings of the 2018 Design, Automation & Test in Europe Conference & Exhibition (DATE), Dresden, Germany, 19–23 March 2018. [Google Scholar]
- Maolanon, P.; Sukvichai, K. Development of a Wearable Household Objects Finder and Localizer Device Using CNNs on Raspberry Pi 3. In Proceedings of the 2018 IEEE International WIE Conference on Electrical and Computer Engineering (WIECON-ECE), Chonburi, Thailand, 14–16 December 2018; pp. 25–28. [Google Scholar]
- Montoya-Cavero, L.-E.; Díaz de León Torres, R.; Gómez-Espinosa, A.; Escobedo Cabello, J.A. Vision Systems for Harvesting Robots: Produce Detection and Localization. Comput. Electron. Agric. 2022, 192, 106562. [Google Scholar] [CrossRef]
- Chao, X.; Zhang, L. Few-Shot Imbalanced Classification Based on Data Augmentation. Multimed. Syst. 2021. [Google Scholar] [CrossRef]
- Mani, V.R.S.; Saravanaselvan, A.; Arumugam, N. Performance Comparison of CNN, QNN and BNN Deep Neural Networks for Real-Time Object Detection Using ZYNQ FPGA Node. Microelectron. J. 2022, 119, 105319. [Google Scholar] [CrossRef]
- Li, S.; Yu, C.; Xie, T.; Feng, W. A power-efficient optimizing framework FPGA accelerator for YOLO. In Proceedings of the International Congress on Image and Signal Processing, BioMedical Engineering and Informatics (CISP-BMEI), Beijing, China, 5–7 November 2022; pp. 1–6. [Google Scholar]
- Luo, Y.; Cai, X.; Qi, J.; Guo, D.; Che, W. FPGA—Accelerated CNN for Real-Time Plant Disease Identification. Comput. Electron. Agric. 2023, 207, 107715. [Google Scholar] [CrossRef]
- Jin, Y.; Wan, Q.; Wu, X.; Fu, X.; Chen, J. FPGA-Accelerated Deep Neural Network for Real-Time Inversion of Geosteering Data. Geoenergy Sci. Eng. 2023, 224, 211610. [Google Scholar] [CrossRef]
- Guo, K.; Sui, L.; Qiu, J.; Yao, S.; Han, S.; Wang, Y.; Yang, H. From Model to FPGA: Software-Hardware Co-Design for Efficient Neural Network Acceleration. In Proceedings of the 2016 IEEE Hot Chips 28 Symposium (HCS), Cupertino, CA, USA, 21–23 August 2016; pp. 1–27. [Google Scholar]
- Wang, Z.; Li, H.; Yue, X.; Meng, L. Briefly Analysis about CNN Accelerator Based on FPGA. Procedia Comput. Sci. 2022, 202, 277–282. [Google Scholar] [CrossRef]
- Du, G.; Wang, K.; Lian, S.; Zhao, K. Vision-Based Robotic Grasping From Object Localization, Object Pose Estimation to Grasp Estimation for Parallel Grippers: A Review. Artif. Intell. Rev. 2021, 54, 1677–1734. [Google Scholar] [CrossRef]
- Wang, C.; Peng, Z. Design and Implementation of an Object Detection System Using Faster R-CNN. In Proceedings of the 2019 International Conference on Robots & Intelligent System (ICRIS), Haikou, China, 15–16 June 2019; pp. 204–206. [Google Scholar]
- Liu, W.; Anguelov, D.; Erhan, D.; Szegedy, C.; Reed, S.; Fu, C.-Y.; Berg, A.C. SSD: Single Shot MultiBox Detector. In Proceedings of the Computer Vision—ECCV 2016, Amsterdam, The Netherlands, 11–14 October 2016; Leibe, B., Matas, J., Sebe, N., Welling, M., Eds.; Lecture Notes in Computer Science. Springer International Publishing: Cham, Switzerland, 2016; pp. 21–37. [Google Scholar]
- Redmon, J.; Divvala, S.; Girshick, R.; Farhadi, A. You Only Look Once: Unified, Real-Time Object Detection. In Proceedings of the 2016 IEEE Conference on Computer Vision and Pattern Recognition (CVPR), Las Vegas, NV, USA, 27–30 June 2016; pp. 779–788. [Google Scholar]
- Darknet: Open Source Neural Networks in C. Available online: https://pjreddie.com/darknet/ (accessed on 30 May 2023).
- Ioffe, S.; Szegedy, C. Batch Normalization: Accelerating Deep Network Training by Reducing Internal Covariate Shift. In Proceedings of the 32nd International Conference on Machine Learning, Lille, France, 6–11 July 2015. [Google Scholar]
- Qiu, J.; Wang, J.; Yao, S.; Guo, K.; Li, B.; Zhou, E.; Yu, J.; Tang, T.; Xu, N.; Song, S.; et al. Going Deeper with Embedded FPGA Platform for Convolutional Neural Network. In Proceedings of the 2016 ACM/SIGDA International Symposium on Field-Programmable Gate Arrays; FPGA’16, Monterey, CA, USA, 21–23 February 2016; Association for Computing Machinery: New York, NY, USA, 2016; pp. 26–35. [Google Scholar]
- Shan, L.; Zhang, M.; Deng, L.; Gong, G. A Dynamic Multi-precision Fixed-Point Data Quantization Strategy for Convolutional Neural Network. In Proceedings of the National Council for Continuing Education and Training NCCET, Xi’an, China, 10–12 August 2016; Springer: Singapore, 2016; Volume 666. [Google Scholar]


Disclaimer/Publisher’s Note: The statements, opinions and data contained in all publications are solely those of the individual author(s) and contributor(s) and not of MDPI and/or the editor(s). MDPI and/or the editor(s) disclaim responsibility for any injury to people or property resulting from any ideas, methods, instructions or products referred to in the content. |
© 2023 by the authors. Licensee MDPI, Basel, Switzerland. This article is an open access article distributed under the terms and conditions of the Creative Commons Attribution (CC BY) license (https://creativecommons.org/licenses/by/4.0/).