Article

A Lifetime Improvement Active Thermal Control Strategy for Wind Turbine Parallel Converters Based on Reactive Circulating Current

College of Automation and Information Engineering, Xi’an University of Technology, Xi’an 710048, China
*
Author to whom correspondence should be addressed.
Electronics 2023, 12(14), 3125; https://doi.org/10.3390/electronics12143125
Submission received: 26 June 2023 / Revised: 12 July 2023 / Accepted: 13 July 2023 / Published: 18 July 2023
(This article belongs to the Section Power Electronics)

Abstract

:
When the wind turbine operates under frequently fluctuating mission profiles, the power semiconductors of its converter will generate low-frequency junction temperature fluctuations, resulting in accumulation of damage to the devices and affecting the converter’s lifetime. To address the above issues, an active thermal control (ATC) strategy based on reactive circulating current for the parallel converter of permanent magnet synchronous generator wind power system was proposed in this paper, by introducing reactive circulating current during sudden wind speed drops, the thermal cycle of the power semiconductor can be effectively smoothed. On the other hand, considering the impact of the proposed strategy on the voltage vector and modulation index of the converter, both the machine-side converter (MSC) and the grid-side converter (GSC) during the control process will be analyzed in detail, then the reactive current of GSC will be limited to prevent excessive modulation index and maintain system stability without reducing the filter size. Finally, a 2 MW wind power system is utilized as a benchmark, and both short-term simulation analysis and long-term numerical results reveal the effectiveness of the control strategy proposed in this paper.

1. Introduction

Renewable energy generation technology has developed rapidly in recent years, especially wind power generation, which is widely used in distribution networks [1]. The power semiconductor is one of the most crucial and valuable components of a wind power generation system (WPGS), due to the fast growth of individual wind turbine power capacity and the widespread application of offshore wind power generation, the cost of maintenance and replacement is much higher now than it was, accounts for a great proportion of the full lifecycle cost [2]. According to [3], the power semiconductor causes 13% of the failure rate and 18.4% of the downtime rate for overall WPGS, which has a significant impact on the reliability of the system. As a result, a reliability improvement control strategy for power semiconductors is of greater concern than in the past.
Power semiconductors contain different layers of the copper and ceramic substrate, which have different thermal expansion coefficients [4], as shown in Figure 1. Therefore, when the temperature inside the power semiconductor, i.e., the junction temperature, fluctuates frequently, the thermomechanical strain will be induced at the material interface [5]. This continuous heating and cooling process is the fundamental cause of damage and failure of the power semiconductor, known as the thermal cycle [6,7,8]. For preventing extra damage to power semiconductors caused by excessive thermal cycles and extending the converter lifetime, active thermal control (ATC) has been proposed. Since power loss is a direct factor affecting the junction temperature, most ATC methods control certain electrical parameters within the WPGS and then manipulate the loss dissipation of power semiconductors. For example, in [9] the lifetime of WPGS has been improved through a thermal management strategy based on switching frequency ATC, by adjusting the switching frequency, the switching losses can be reduced for limiting the maximum junction temperature, however, limited by the design of converter and harmonic instabilities of the control system, the switching frequency cannot be reduced arbitrary [10]. Another typically used method in the area of ATC is the manipulation of the modulation process, in [11], a discontinuous modulation strategy for WPGS has been proposed for thermal stress alleviation, the principle is to clamp the converter output voltage to the dc bus, the clamping angle can be controlled to affecting the switching losses, it is worth noting that in a parallel converter system, the ripple current of one converter can be compensated by another, then the impact of the modulation control can be minimized, but the thermal cycle of the converter used for compensation cannot be controlled in this situation. Therefore, this method is mainly used to balance the lifetime of parallel converters and reduce the frequency of system maintenance.
In recent years, a new concept of ATC based on reactive circulating current in WPGS with a parallel converter has been proposed [12,13,14,15]. By utilizing reactive power, the thermal fluctuation of the power semiconductor during wind speed variations can be smoothed. In [12], the thermal cycles of the power semiconductor in the grid-side converter (GSC) are controlled, and the cooling process of junction temperature is suppressed through reactive circulating current whenever there is a sudden dip in the wind speed. Consequently, the low-frequency thermal cycles have been significantly restrained. However, there are still many problems, as the real-time junction temperature data is adopted as feedback and reference in the PI-feedback regulator, temperature measurement has become a tricky problem. Since the temperature of the power semiconductor is normally hard to access, a wide range of junction temperature sensing technologies have been developed in recent years [16], however, due to the limitations of the nacelle size in wind turbines and the installation difficulty, the cost-intensive junction temperature sensor is hard to apply in practical engineering. Another effective method is the thermal estimator [17], which establishes an electrothermal model to estimate junction temperature, by correctly fitting the parameters, the accuracy of the estimated result can be achieved. However, due to the thermal coupling characteristics of some semiconductor parameters, repetitive iterative processes are required to calculate junction temperature [18,19]. Therefore, when the thermal control process includes a thermal estimator, it will significantly increase the complexity of the controller. In this work, an ATC method based on the current control system of WPGS is proposed, the junction temperature data will no longer be used in the control process, but only used to evaluate the accumulation damage of the converter, avoiding problems such as overshoot in the control process and the calculation burden of the computer, whether on the GSC or the machine-side converter (MSC). On the other hand, due to the influence of reactive circulating current on the converter modulation index, in [14], the size of the grid-side filter is limited to prevent system instability. However, given the important suppression effect of the filter on the harmonics of the grid-connected current, it is difficult to make a trade-off. To better address the above issue, this article takes a further exploration of the impact of ATC on the WPGS, proposes another more effective solution, the reactive circulating current will be explicitly limited to restrict the modulation index and avoid system instability, making the reactive circulating current ATC strategy can be easy to apply in any circumstance.
The calculation method for junction temperature and accumulation damage of power semiconductors is presented in Section 2, which will be used to analyze the results and verify the effectiveness of the proposed strategy. In Section 3, the double closed-loop control system of the parallel converter is described, and then presents the vector diagram of the parallel converter with reactive circulating current injection. Section 4 introduces the application of the proposed control strategy in the GSC and MSC. To verify the effectiveness of the control strategy, simulation analysis, and numerical results are shown in Section 5. Finally, Section 6 provides a conclusion to this paper.

2. Thermal and Failure Model of Power Semiconductors

2.1. Power Loss Calculation

Due to some inherent characteristics of semiconductor materials, power semiconductors are not ideal switching devices, which can generate power losses and cause chip junction temperature to rise during the operation of WPGS. The power loss consists of the conduction loss caused by the internal resistance and threshold voltage drop of the semiconductor under a steady conduction state, as well as the switching loss resulting from the asynchronous voltage and current during the dynamical switching action [20]. For space vector pulse width modulation (SVPWM) three-phase converters, within one switching cycle, the average conduction losses of IGBT and diode are respectively presented as follows [21]:
P con _ T = 1 2 π   ±   M cos φ 4 3 V CE 0 T Tj I c + 1 8   ±   2 M cos φ 3 3 π     M cos 3 φ 45 3 π r CE T Tj I c 2
P con _ D = 1 2 π     M cos φ 4 3 V F 0 T Dj I c + 1 8     2 M cos φ 3 3 π   ±   M cos 3 φ 45 3 π r F T Dj I c 2
where Ic is the peak amplitude of the power semiconductor load current; M is the modulation index of the converter; φ is the phase angle between modulated voltage and current; the upper sign of ± and ∓ is used for GSC and the bottom one for MSC. VCE0, VF0 are the threshold voltage for the on-state characteristic of IGBT and diode, and rCE, rF are the equivalent resistance of IGBT and diode, both of which are related to junction temperature and can be fitted as polynomial equations:
  V CE 0 T Tj = a Tc T Tj + b Tc   r CE T Tj = c Tc T Tj + d Tc
  V F 0 T Dj = a Dc T Dj + b Dc   r F T Dj = c Dc T Dj + d Dc
TTj, TDj represents the junction temperature of the IGBT and diode, respectively. Considering the influence of junction temperature, the average switching losses of IGBT and diode can be calculated by:
  P sw _ T = f sw π U dc U dcN E on + off I c 1 + T C Tsw T Tj   T jN   E on + off I c = a Ts I c 3 + b Ts I c 2 + c Ts I c + d Ts
  P sw _ D = f sw π U dc U dcN E rec I c 1 + T C Dsw T Dj   T jN   E rec I c = a Ds I c 3 + b Ds I c 2 + c Ds I c + d Ds
where fsw is the switching frequency; Udc is the dc bus voltage of the converter; Eon and Eoff are the turn-on energy and the turn-off energy dissipated by the IGBT; Erec is the reverse recovery energy dissipated by the diode; TCTsw, TCDsw are temperature coefficients of IGBT and diode; TjN and UdcN are reference values of the switching loss measurements taken from the datasheet. The power loss coefficients for (3)–(6) are listed in Table 1. which can be obtained from the datasheet for IGBT module FF900R12IE4 [22].
Since the Udc usually remains unchanged in the WPGS, and the impact of parameters M and φ on power loss can be almost negligible, at a constant switching frequency fsw, the load current Ic turn into the most significant factor affecting power semiconductor losses. Therefore, thermal control can be indirectly achieved through the current control, which is also the main focus of this article.
The total average losses PT and PD of IGBT and diode are the sum of conduction loss and switching loss, it can be seen as follows:
P T = P con _ T + P sw _ T
P D = P con _ D + P sw _ D

2.2. Junction Temperature Calculation

The power semiconductor contains multiple layers of physical structures, which have different thermodynamic properties during heat conduction and exhibit different thermal resistance and capacitance characteristics. Therefore, electrical methods can be used to analyze the relationship between power loss and junction temperature, the power loss is used as the excitation current source in a thermal model, the thermal impedance of different materials can be equivalent to electrical impedance. The thermal network model of the power semiconductor is shown in Figure 2, which is modeled as the one-dimensional Foster RC network. The upper panel denotes the Foster model of IGBT and the lower panel that of the Diode chip. The power semiconductor is directly installed on a heat sink with a thermal interface material (TIM), the junction to case thermal network, Power Module, can be molded as a fourth-order Foster model [19], the case to heat sink and the heat sink to ambient thermal network is described by a first-order Foster model, Ta is the ambient temperature.
The parameters of thermal resistance and time constant for the Foster RC network are shown in Table 2, and those of the heatsinks are provided by IPOSIM [23], the pre-defined typical air-cooling heatsink is selected.

2.3. Accumulation Damage Calculation

The thermal stress mechanical fatigue caused by thermal cycles is an important reason for the aging and damage of power semiconductors. Due to the different expansion coefficients of physical materials inside the power semiconductor, the binding line will undergo reciprocating deformation during the junction temperature fluctuation process, leading to solder joint detachment. At the same time, the chip solder layer will gradually crack, ultimately leading to thermal fatigue accumulation and failure after a certain number of thermal cycles. The Coffin-Manson model is a well-known approach for quantifying the impact of thermal cycles on power semiconductors, by fitting the curve of the power cycle test, the relationship between the number of cycles to failure Nf, the amplitude of thermal cycles ΔTj and the average temperature Tjm can be obtained, it can be expressed as (9).
N f T jm ,   Δ T j = k 1 Δ T j   k 2 exp E a   /   k B T jm
where k1, k2 are special constants that depends on the power semiconductor; Ea is the active energy constant; kB is the Boltzmann constant [24]. As can be seen from (9), both ΔTj and Tjm have an impact on the performance and lifetime of the semiconductor, and the influence of ΔTj is more significant.
After using the rain flow counting algorithm to obtain information about the thermal cycle of power semiconductors, assuming that they are linearly superimposing with each other, the accumulation damage can be calculated using Miner’s rule [25]. It can be expressed as (10).
  D = i = 1 n N i N f i
Nf(i) is the number of cycles to failure at the ith level and N(i) is the corresponding number of the ith thermal cycle. D represents the accumulation damage of the device, and when D reaches 1, the accumulation damage of the power semiconductor reaches its maximum, ultimately leading to failure.

3. Reactive Circulating Current in Paralleled Wind Power Converters

This section presents the control structure of the WPGS with two parallel converters, which can decouple active and reactive currents in each converter. For this reason, the reactive circulating current can be generated within the converter system. And in the subsequent content, the vector diagram of GSC and MSC under reactive circulating current will be analyzed, then it can conclude that the output voltage vectors of parallel converters will change with the increase of reactive circulating current and affect the modulation index of the converter and system stability.

3.1. Control System of the Parallel Converter

For large-capacity WPGS, the power semiconductor of the converter needs to withstand high currents. However, due to the limitations of the rated current of the power semiconductors, parallel converters are usually used to satisfy the demand of high-power generation systems [26], as shown in Figure 3. The back-to-back two-level PWM converter in series with inductance filter, which has an equivalent inductance and equivalent resistance. Here, the output current of the generator stator is Is, which is divided into Im1 and Im2 and rectified by the MSC. After passing through the dc bus, it is then inverted by the GSC to output the currents Ig1 and Ig2, and finally merged into the grid, the grid current is Igrid.
Each converter has its own independent double closed-loop active and reactive power decoupling control system, which controls the output current and power factor of the converter, as shown in Figure 4, Here, Udcref is the dc bus voltage reference value; Igdref, Imqref are the reference value of active current on grid side and machine side getting from the dc bus voltage control and maximum power point tracking (MPPT) algorithm; K is the active power allocation coefficient of the parallel converter; igdrefk, igqrefk (imqrefk, imdrefk) (k = 1,2) are the reference value of active and reactive current of grid-side (machine-side) kth converter; igak, igbk, igck (imak, imbk, imck) (k = 1,2) are the three-phase current on ac side of the grid-side (machine-side) kth converter; igdk, igqk (imqk, imdk) (k = 1,2) are the active and reactive current of the three-phase current of the grid-side (machine-side) kth converter after coordinating transformation.
The active current of the MSC and GSC is mainly determined by the generator speed, dc bus voltage, and the working mode of the parallel converter, that is, the amount of wind energy captured by the wind turbine and the power allocation coefficient K. In general, the equal power-sharing mode is adopted, where K takes a fixed value of 0.5.
In a single converter system, on the grid side, the reactive power Q into the power grid is adjusted by controlling the reactive current output by the converter, the maximum reactive power achieved by the GSC has to be restrained in a certain range according to the grid standards. As shown in Figure 5, the ratio of reactive power Q to active power P is limited, from variant 1, it can be seen that overexcited reactive power cannot exceed 48% of active power, and underexcited reactive power cannot exceed 23% of active power, which means that the output reactive current by the converter in the single converter system is limited by the grid [27], thus the reactive current ATC method is an inconvenience and cannot be adjusted in an arbitrary manner.
In the parallel converter system, by making the converter’s output reactive current of equal magnitude and opposite direction, the reactive circulating current is generated inside the parallel converter, and the reactive power of the grid will not be affected, at the same time, it will not influence the power factor of the generator output current on the machine side, as can be seen from the red line in Figure 3.

3.2. Reactive Circulating Current

Taking the GSC as an example, under unit power factor, the active current is divided equally by two converters, and the output current of the two converters are the same as the d-axis current igd1 and igd2, both fixed on the d-axis and in phase. When the output reactive current is zero, as shown by the yellow line in Figure 6a, the output voltage of the converter Ug is the sum of the grid phase to ground voltage peak Ugrid and the filter inductance voltage, which includes the equivalent resistance voltage UgR and the inductance voltage UgL. When a reactive circulating current is introduced, the output voltage of the overexcited operation converter Ug1 will increase as a result of the voltage change across the filter inductance, while the output voltage of the underexcited operation converter Ug2 will decrease.
The relationship between the output currents of each GSC is shown in (11), where Igd, Igq are the active and reactive components of the grid current. Each of the following variables is an absolute value.
  I g 1 = i gd 1 2 + i gq 1 2 = i gd 2 2 + i gq 2 2 = i g 2   I gd = i gd 1 + i gd 2   I gq = i gq 1   i gq 2 = 0   I grid = I gd 2 + I gq 2 = I gd
The relations between each voltage vector at the grid side can be expressed as (12), where fg represents the fundamental frequency of the grid-side current.
  U gRk = R g I gk   U gLk = 2 π f g L g I gk   U gk = U gird cos θ g + U gRk 2 + U gird sin θ g   ±   U gRk 2         k = 1 , 2
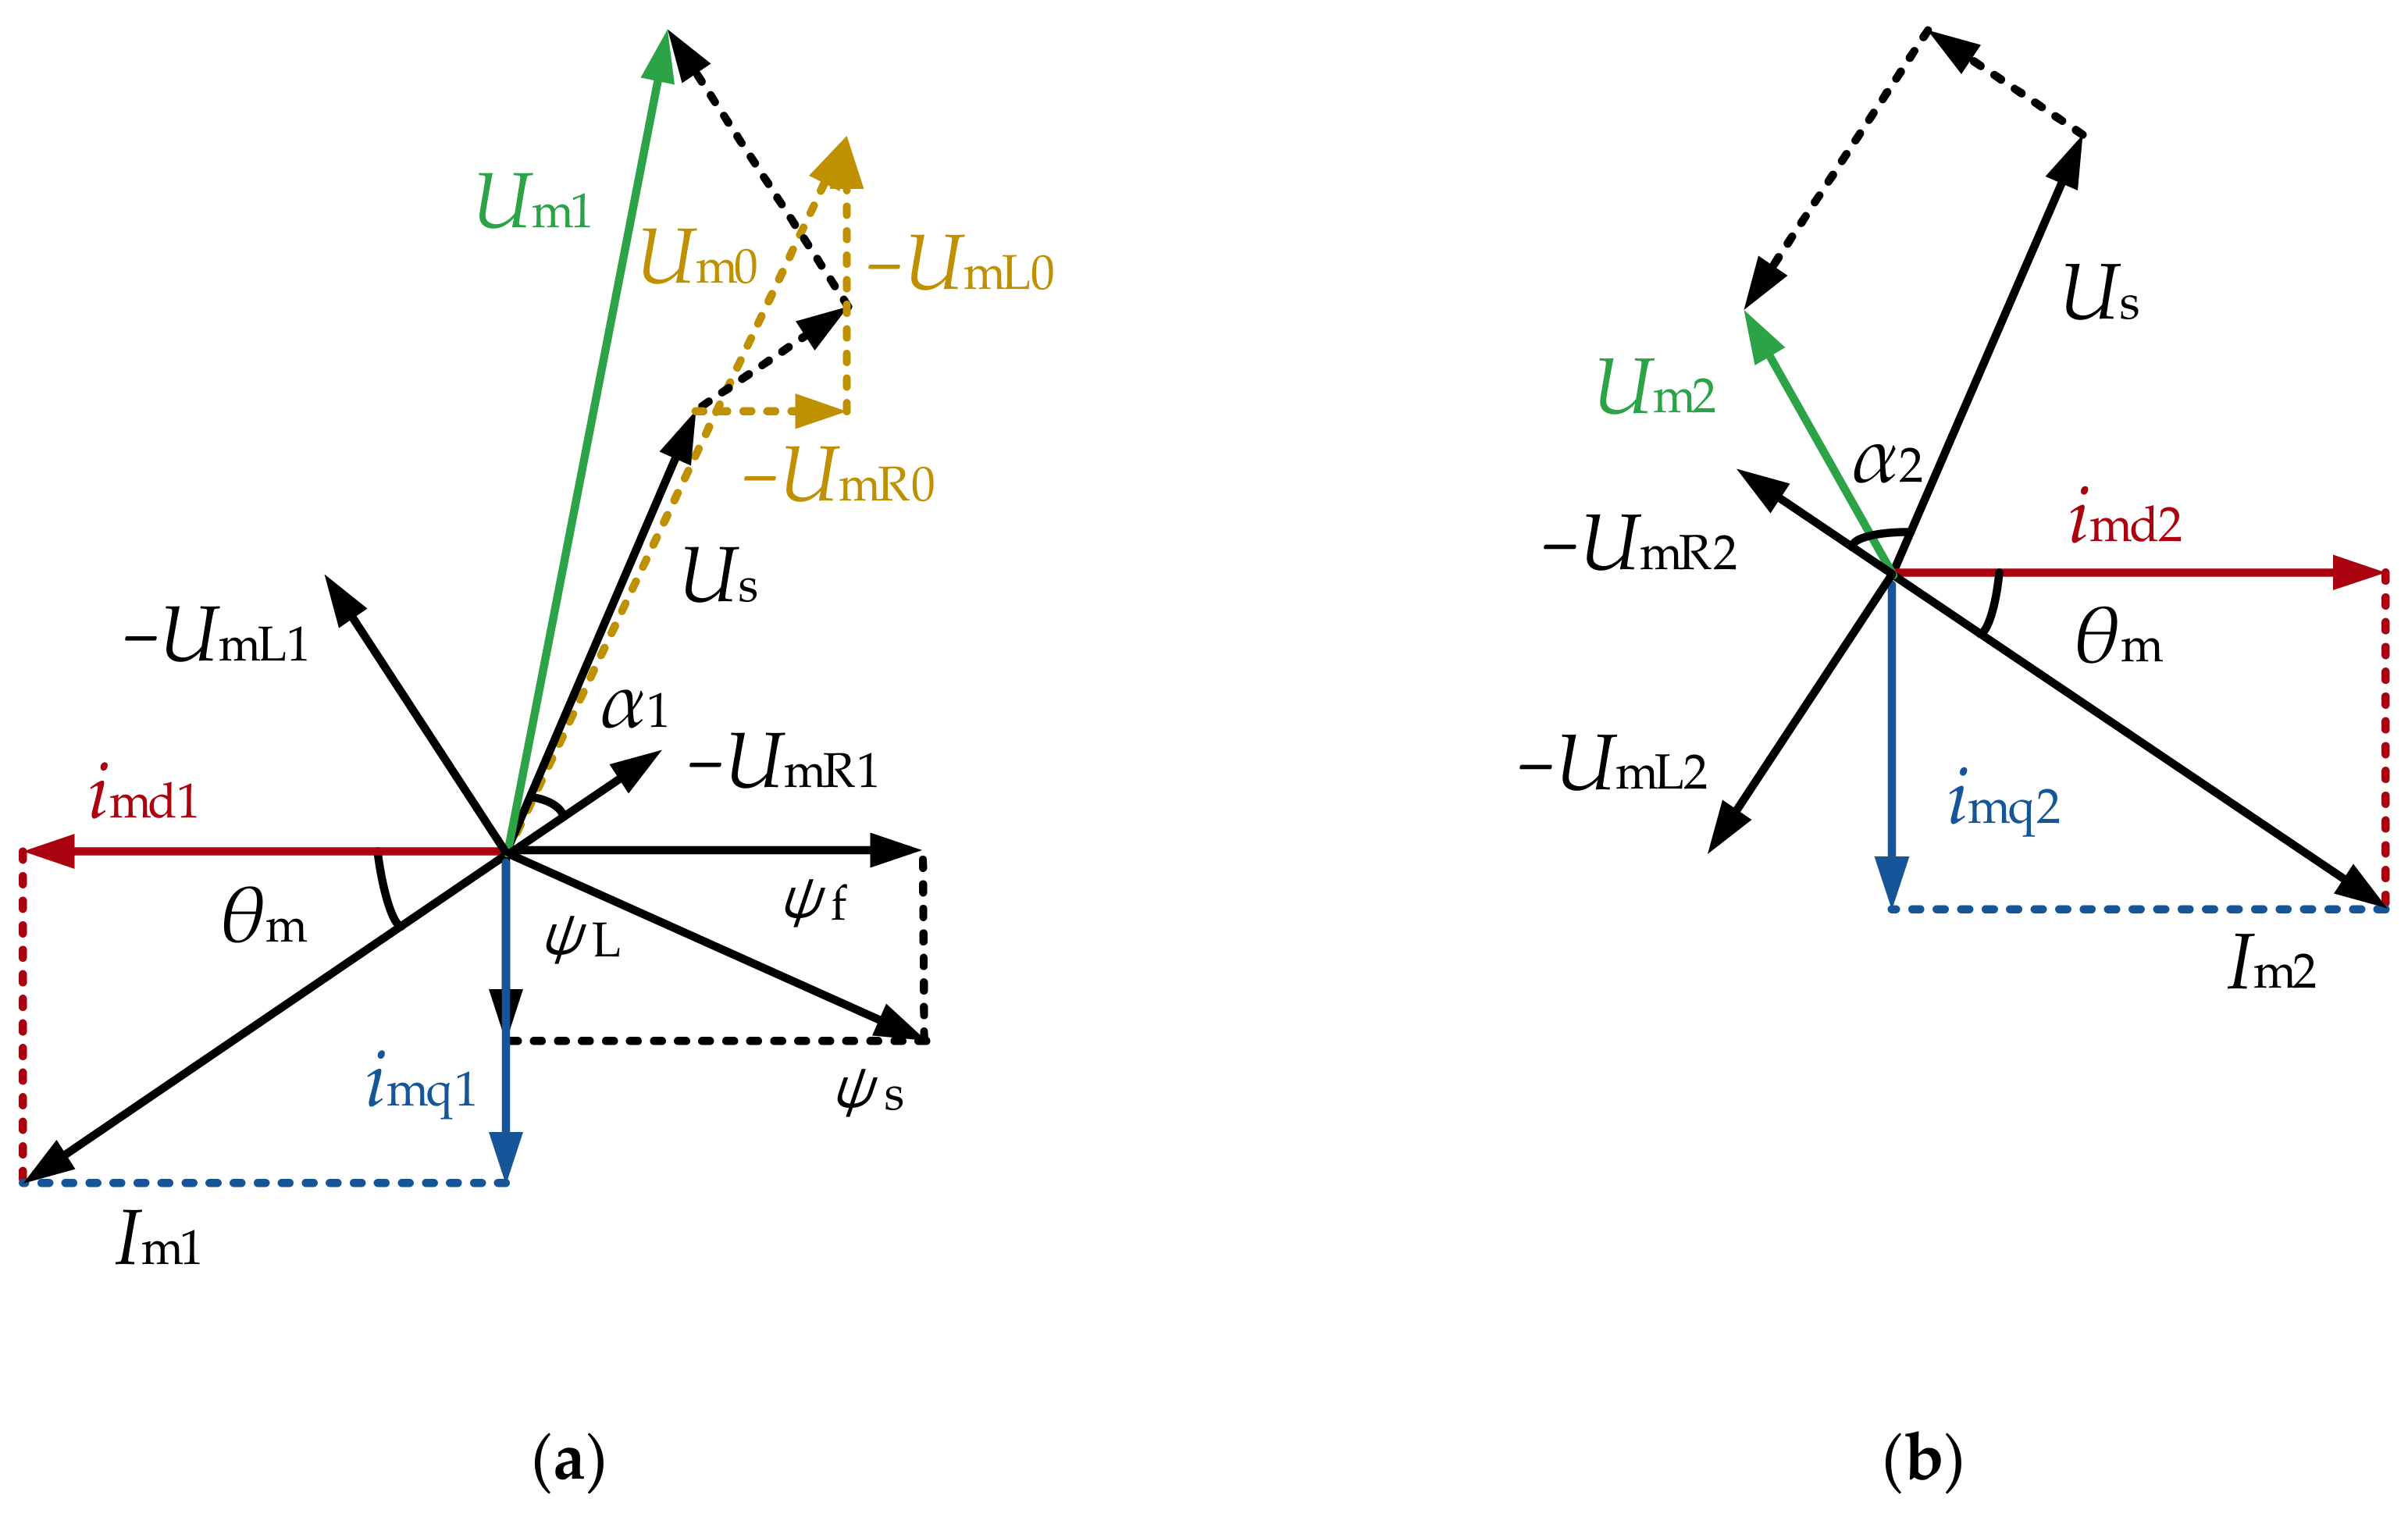
Figure 7 shows the vector diagram of MSC, similarly, assuming operation at unit power factor, the output voltage of the permanent magnet synchronous generator, Us, is generated by the synthetic magnetic flux ψs, which is composed of the rotor permanent magnetic flux vector ψf fixed on the d-axis and the magnetic flux ψL generated by the stator q-axis equivalent inductance. Um1 and Um2 are the input voltages on the ac side of the MSC, which are obtained by subtracting the filter inductance voltage from Us. UmL and UmR are the equivalent inductance and equivalent resistance voltage of the machine-side filter inductance. In similar cases, the Um1 increases and Um2 decreases with the increase of reactive current.
The relationship between the output currents of each MSC is shown in (13), where Imq, Imd are the active and reactive components of the stator output current.
  I m 1 = i md 1 2 + i mq 1 2 = i md 2 2 + i mq 2 2 = I m 2   I mq = i mq 1 + i mq 2   I md = i md 1   i md 2 = 0   I s = I md 2 + I mq 2 = I mq
The relations between each voltage vector at the machine side can be expressed as (14).
  U s = ω e L q I mq 2 + ψ f 2 + R s I mq   U mR k = R m I m k   U mL k = 2 π f m L m I m k = ω e L m I m k   U m k = U s cos α k + U mR k 2 + U s sin α k   ±   U mL k 2         k = 1 , 2
fm is the frequency of the machine-side current, which is proportional to the generator speed; ωe is the rotor electrical angular velocity; Lq is the equivalent inductance of the stator q-axis; Rs is the stator resistance; αk can be calculated by (15).
α k = π 2   θ m     arctan L q I mq ψ f         k = 1 , 2
From the above analysis, it can be seen that the introduction of reactive circulating current into the parallel converter will lead to changes in the output voltage vector, thus affecting the modulation index of the converter. In SVPWM, the modulation index of each converter on the grid side and machine side are calculated as follows:
  M g k = 3 U g k U dc   M m k = 3 U m k U dc         k = 1 , 2
When M exceeds 1, nonlinear components will occur in the modulation process, which may affect the system’s stability.
In the following, an ATC strategy based on reactive circulating current is proposed for achieving a reduction of the thermal cycle amplitude for the power semiconductors caused by the mission profile and consequently decrease the accumulation damage. On the basis of the mentioned analysis, this strategy has also been improved to maintain system stability.

4. Active Thermal Control in Paralleled Wind Power Converters

From the analysis of Section 3, it can be concluded that the reactive circulating current can change the output current of the converter without affecting the power factor, thereby increasing the flowing current of power semiconductors and suppressing thermal cycles when the load suddenly drops. In Figure 8, a complete simplified block diagram of the proposed ATC scheme is illustrated.
Taking the grid side as an example, the active current reference signal Igdref is obtained through the dc bus voltage PI controller and input to the adaptive low pass filter, the cut-off frequency of the filter is fc. The filtered value Igref is combined with Igdref and the power allocation coefficient K to calculate the reactive current reference value, so that the output current Igk (k = 1,2) of the GSC tracks Igref when the wind speed drops suddenly. Igqref can be calculated by (17).
I gqref = K I gref 2 K I gdref 2 = K I gref 2   I gdref 2
On the machine side, the method for obtaining the reference value of reactive current is similar to that on the grid side. By using the MPPT algorithm, the active current reference Imqref can be obtained, then calculate the reference value of reactive current with K and Imref after the filter, similar to (17), Imdref is calculated as follows:
I mdref = K I mref 2 K I mqref 2 = K I mref 2   I mqref 2
Using the above algorithm, the control variable of reactive current can be calculated timely during the system operation, and there is no need for a complex junction temperature calculation process. At the same time, the modulation index for the overexcited operation converter would increase with the increase of reactive current, which may lead to the instability of the system. Figure 9 identifies the modulation index of the overexcited operation converter changing with the current. As shown in Figure 9a, the reactive current igq1 seriously affects the modulation index Mg1. When igq1 changes from 0 to 50% of igd1, the Mg1 is increased from 0.93 to 1.07 in case of rated active current and from 0.89 to 1.02 even when the active current igd1 is very small. Even if reactive current igq1 is only applied when wind speed drops, it is still necessary to limit its increase to prevent Mg1 from being too high.
From (12) and (16), we can know that the dc bus voltage Udc and the size of the filter are key factors affecting Mg1 and thermal control performance, but in WPGS, the Udc usually does not change, and a decrease in filter size can lead to increased harmonics and circulation problems, thus the M restriction reactive current limit algorithm is proposed for the grid side, as it can be seen in Figure 8, Mlim is the upper limit value of the modulation index. During the control process, the limit amplitude of reactive current igqmax is calculated in real-time to ensure that the modulation index of the overexcited operation converter is less than Mlim, and maintain the stability of the system, igqmax can be calculated as follows:
i gqmax = M lim U dc 2 3   U grid 2   Z g 2 i gd 1 2   2 U grid R g i gd 1 + U grid 2 X gL 2 Z g 2 Z g U grid X gL Z g 2
where XgL and Zg are the inductive reactance and reactance of the grid-side filter inductance respectively:
  X gL = 2 π f g L g   Z g = R g 2 + X gL 2
The effect of the machine-side overexcited operation converter output current is evaluated in Figure 9b. The influence of reactive current imd1 on modulation index Mm1 decreases rapidly with the reduction of active current imq1. Excessive Mm1 will only occur when the active current is rated and the reactive current is high enough, since this situation is impossible in the reactive current ATC, and when imq1 suddenly drops, the increase in imd1 is insufficient to cause Mm1 to show an upward trend, thus it is no required to limit the reactive current in the control strategy on the machine side.

5. Case Study

This section presents the short-term (100 s) simulation and long-term (1-day) numerical results of a WPGS with two parallel converters to validate the performance of the proposed control strategy. A simulation model based on MATLAB/Simulink was built for a 2 MW permanent magnet synchronous WPGS. Table 3 represents the parameters of the system.
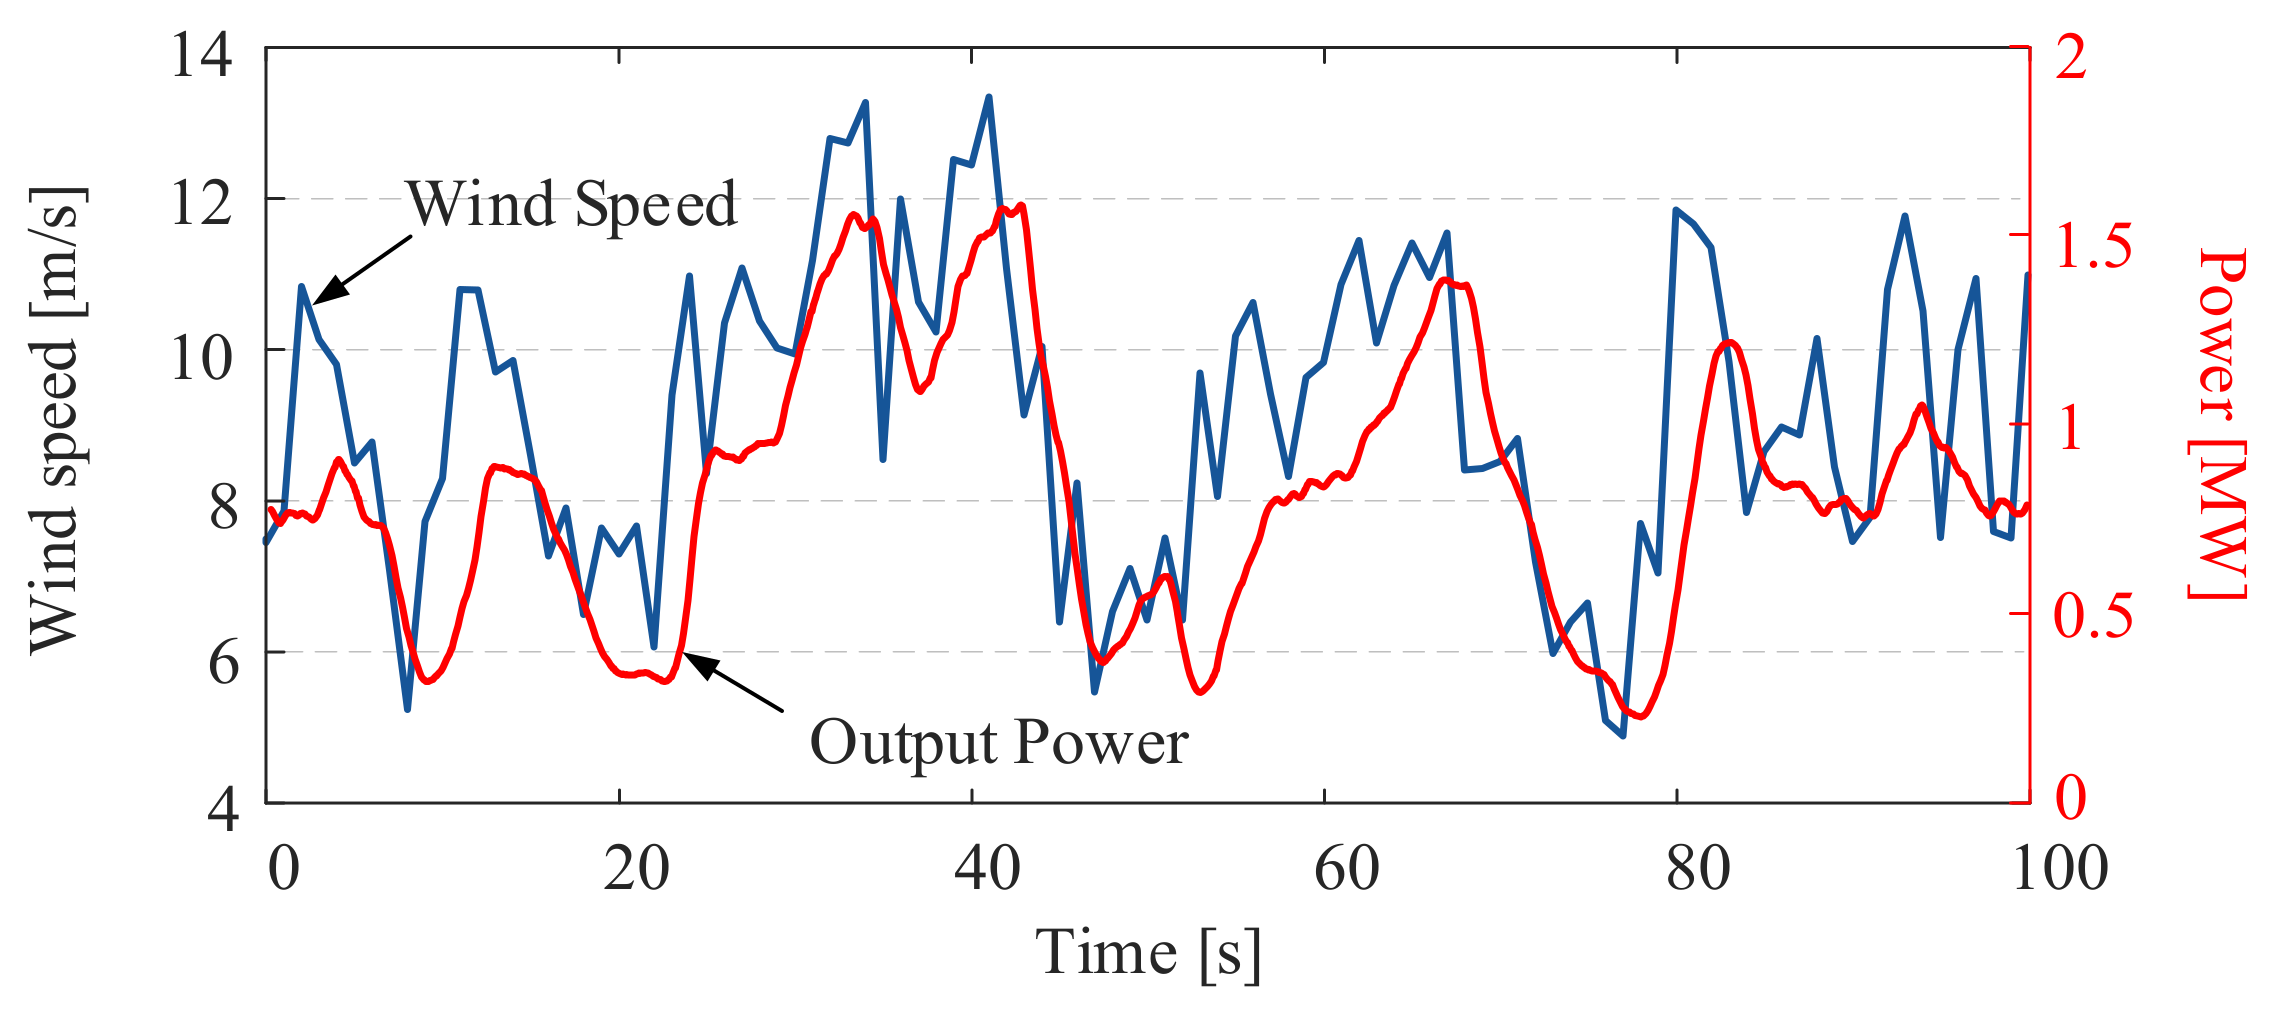
The short-term wind speed profile and corresponding output power is shown in Figure 10, which will be used in the following simulation analysis.

5.1. Analysis of the Suppression Effect of Junction Temperature Fluctuation in Short Term

Figure 11 shows the junction temperature of the GSC IGBT and MSC diode with and without the ATC strategy. It can be seen that both the temperature descents due to the sudden drop of wind speed in the time periods of 6–10 s, 17–22 s, 42–58 s, and 68–78 s, and generated significant low-frequency thermal cycles without ATC. It is noteworthy that the junction temperature of the diode on the MSC is higher, as shown in Figure 11b, under the same load conditions, the MSC diode needs to withstand a larger thermal stress than all other power semiconductors [28], resulting in bigger low-frequency thermal cycles when the wind speed drops, therefore, thermal control of the MSC is also particularly important.
At the same time, the high-frequency thermal cycles caused by current frequency also exist in power semiconductors. The control strategy would increase the amplitude of high-frequency thermal cycles while suppressing low-frequency thermal cycles. However, its amplitude is smaller and has little impact on the lifetime of converter power semiconductors. Therefore, when ATC is applied to the process of decreasing junction temperature during the aforementioned time period, the accumulation damage will still decrease. The damage estimation will be analyzed in the following chapters with a time length of 1-day.
The current of the GSC and MSC with ATC is shown in Figure 12. Since the equal power-sharing mode is adopted, the active current of two parallel converters is identical, and the amplitude of the reactive current is the same and the direction is opposite, the power factor that flows into the grid and output from the generator will not be affected.

5.2. Analysis of the Limitation Effect of Overexcited Operation Converter Modulation Index

Figure 13a shows the reference reactive current and its limit amplitude calculated by (19) on the grid side, the modulation index of GSC with ATC is shown in Figure 13b. It can be seen that when the reactive current is zero, the modulation index of two parallel converters are the same and in proportion to the active current. When a reactive current is given, the modulation index of the overexcited operation converter Mg1 increases, and the modulation index of the underexcited operation converter Mg2 decreases. Considering the influence of current ripple, taking Mlim as 0.98, within the time periods of 45–55 s and 70–80 s, the reference value of reactive current Igqref is limited to igqmax and the Mg1 is limited to 0.98, which verifies the effectiveness of the strategy proposed in this paper in ensuring system stability.
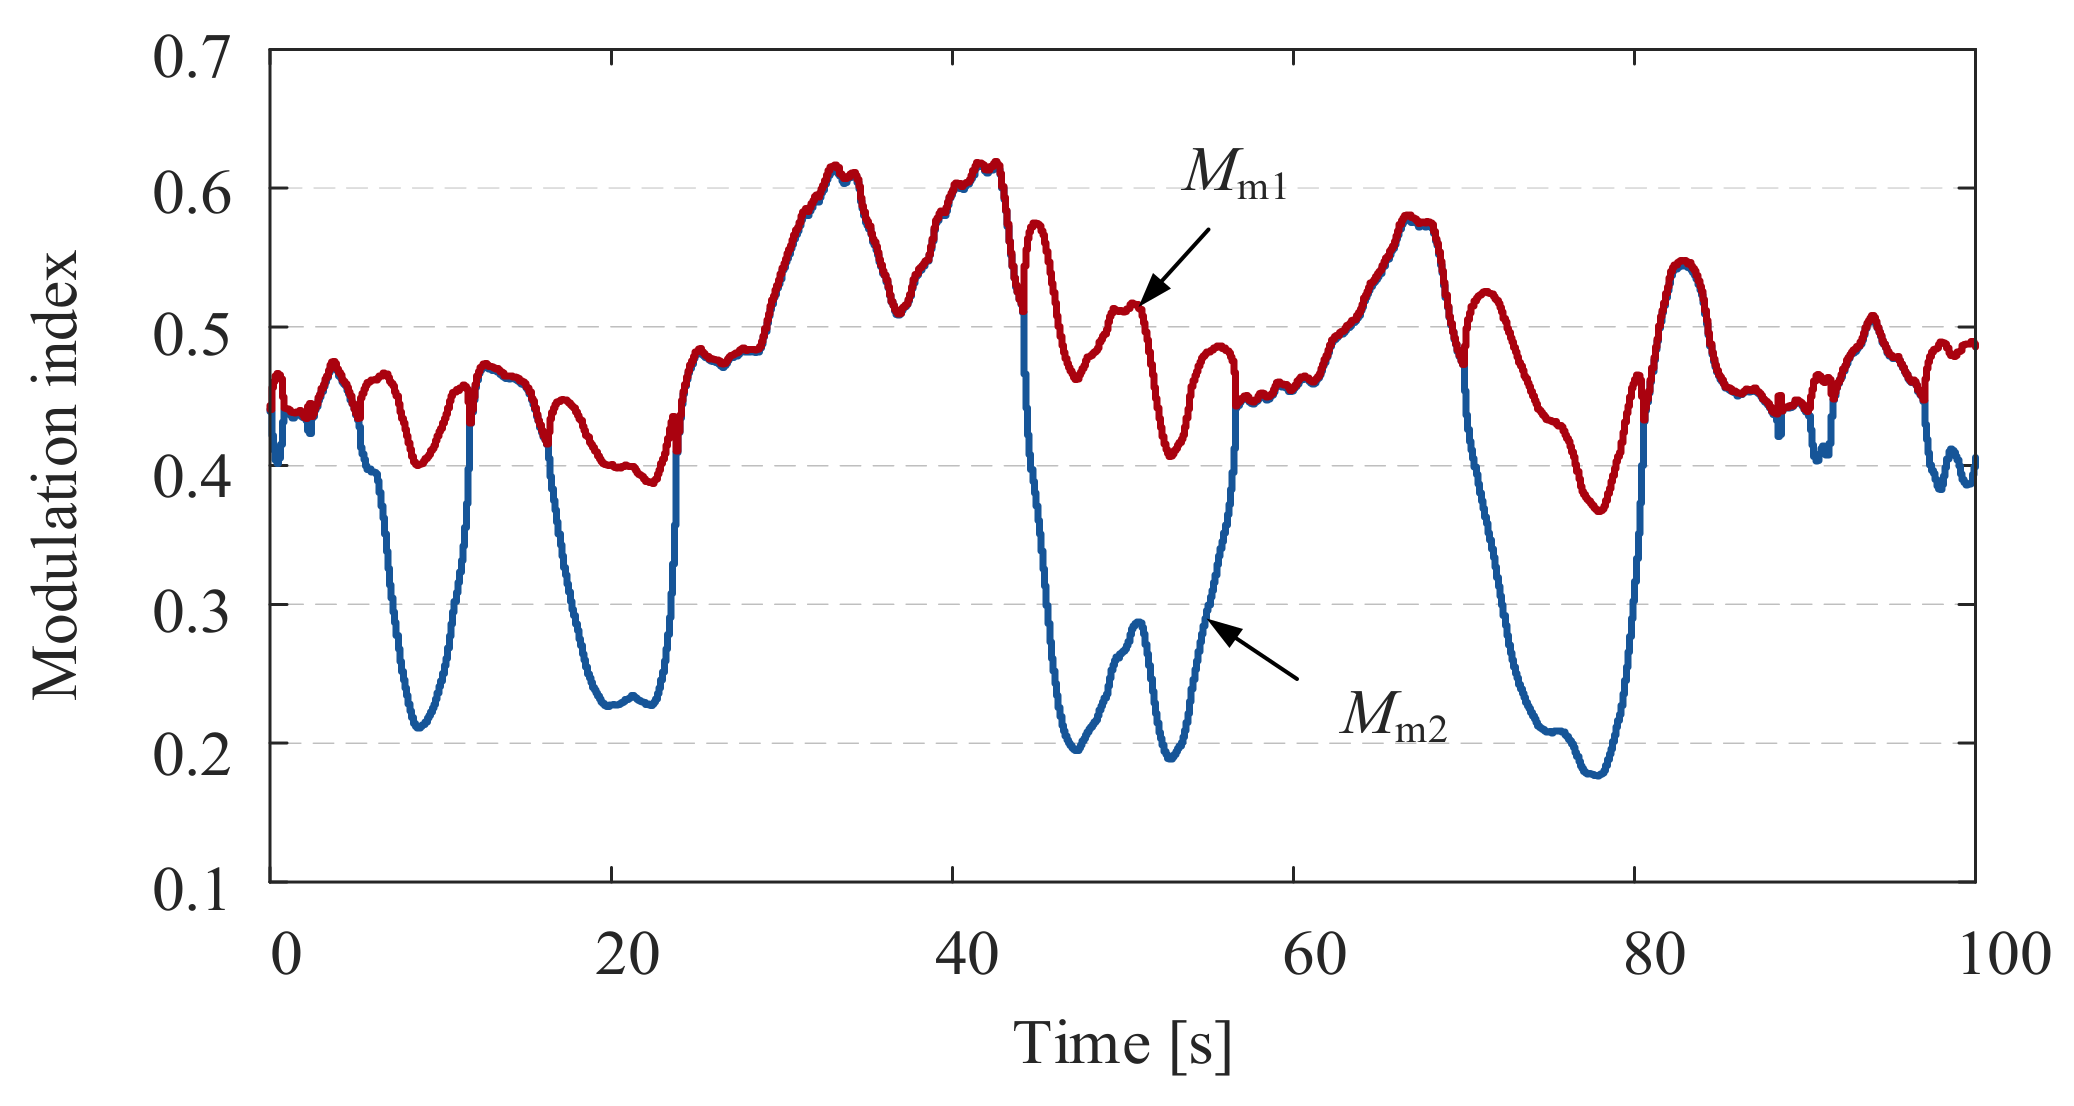
Figure 14 shows the variation curve of the converter modulation index with ATC of the MSC. During the time period when the reactive circulating current is introduced, the modulation index of the overexcited operation converter Mm1 and the underexcited operation converter Mm2 have both decreased compared to before without ATC, consistent with the previous analysis.

5.3. Analysis of the Reduction Effect of Accumulation Damage in Long Term

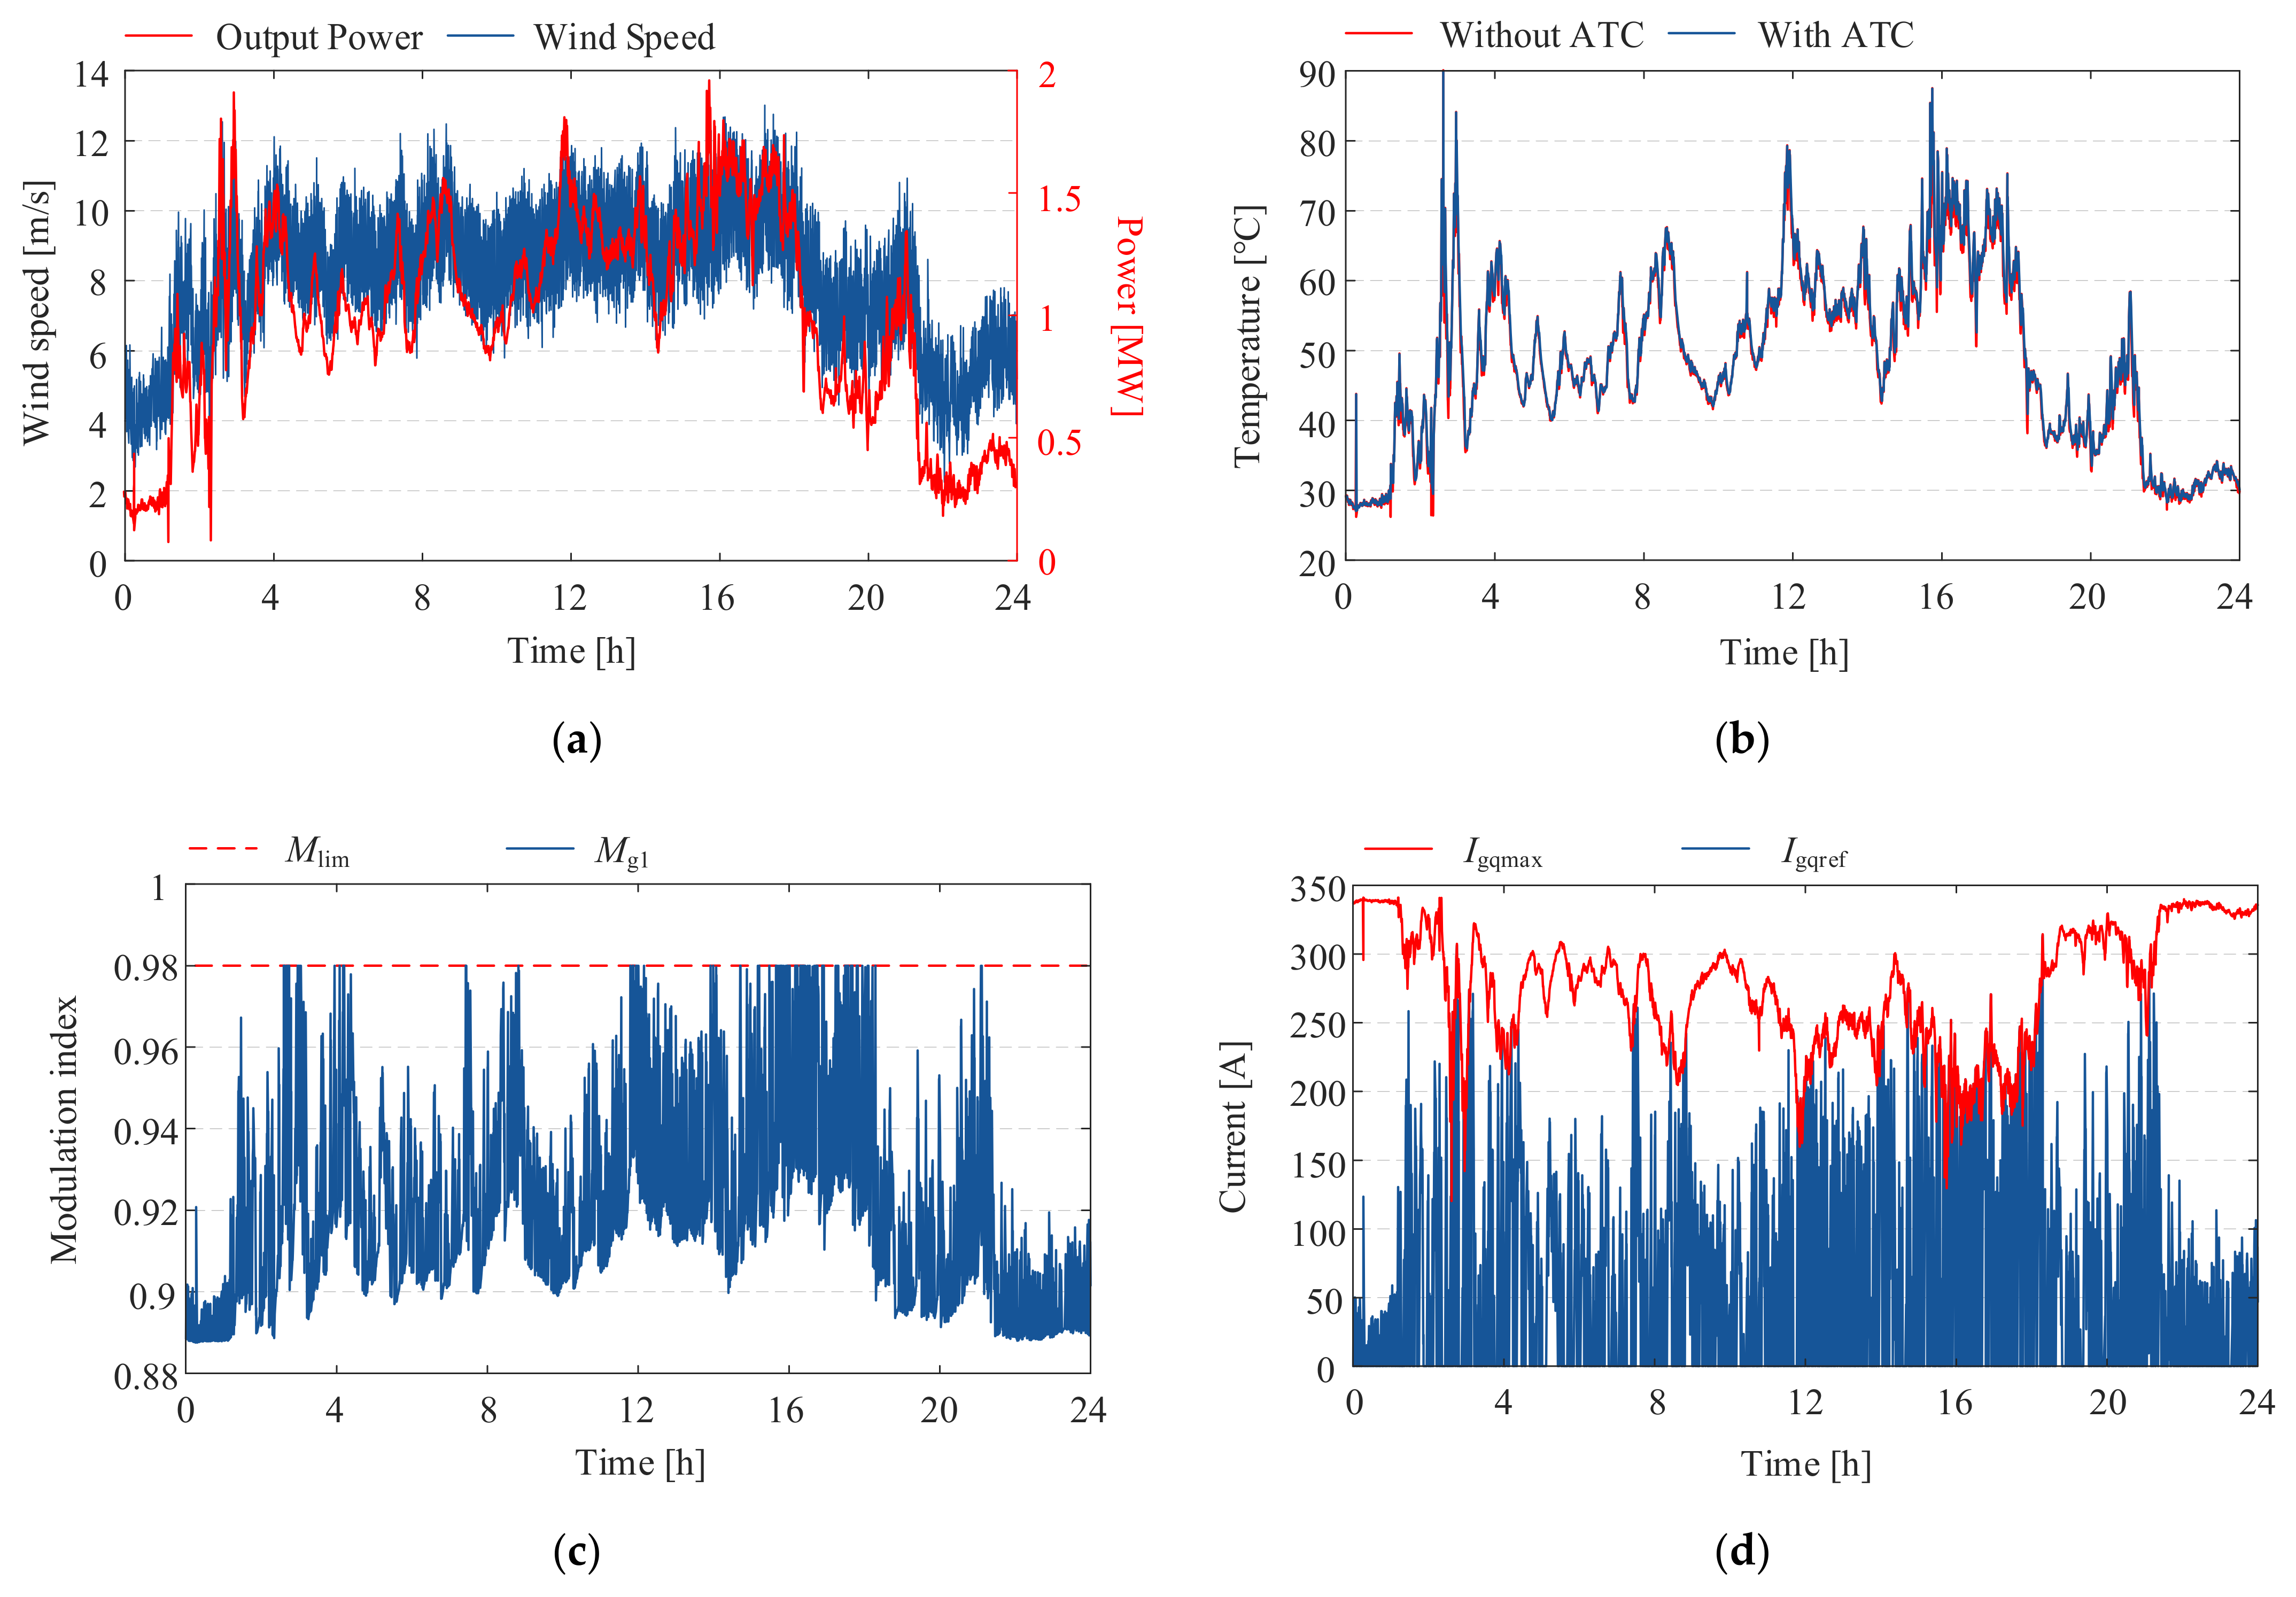
Figure 15 shows the numerical results based on the actual wind speed in Texas, USA on 12 June 2022. The statistics analysis was performed with the rain flow counting algorithm for the junction temperature fluctuations in Figure 15b,e, then calculate the accumulation damage according to (9) and (10), the results are shown in Table 4, neglecting thermal cycles with fluctuation amplitudes less than 0.1 °C, both the number of thermal cycles and the accumulation damage are reduced with the ATC, therefore, the lifetime of power semiconductors has been improved, and increasing the reliability of the system. When the fluctuation of the mission profile is more frequent and the amplitude is greater, the proposed ATC is able to perform better for the alleviation of thermal stress.

6. Conclusions

This paper has proposed an improved ATC strategy based on the reactive circulating current for parallel converters in WPGS, which can be applied not only on the grid side but also on the machine side. By modifying the double closed-loop current control system in the parallel converter WPGS, reactive current can be correctly calculated according to the change of active current when the load drops suddenly, avoiding the difficulty of obtaining junction temperature data during the ATC process. This paper also provides a detailed analysis of the GSC and MSC vector changes under the injection of reactive circulating current and explains the impact of reactive current changes on the converter modulation index with ATC, then a reactive current limiting model of GSC has been established to ensure the stability of the system without a reduction of filter size. Finally, the effectiveness of the proposed method is verified by a 2 MW WPGS, the junction temperature of the GSC IGBT and MSC diode have been analyzed, and the results show that under a random wind speed of 1 day, the number of thermal cycles of IGBT on the grid side has been reduced from 13,984 to 7768 and that of diode on the machine side is reduced from 23,735 to 14,750. At the same time, the amplitude of thermal cycle has also been suppressed, thus the accumulation damage is reduced. The accumulation damage of IGBT on the grid side decreased from 1.2304 × 10⁻⁶ to 1.9779 × 10⁻⁷, and that of diode on the machine side decreased from 7.2315 × 10⁻⁶ to 6.096 × 10⁻⁶. While the modulation index of the GSC is limited to below 0.98, the stability of the system is guaranteed.
Future research will focus on the combination of power routing algorithms for parallel converters and reactive circulating current ATC. Power routing is a new concept in recent years which effectively reduces system maintenance costs by sharing unequal power between parallel converter modules [29], it can be combined with ATC to achieve maximum optimization results. Therefore, the control strategy proposed in this article under equal power sharing mode needs to be further studied and improved to better enhance system reliability.

Author Contributions

Conceptualization, Q.W. and J.L.; methodology, Q.W.; software, P.W.; validation, X.Q.; formal analysis, Q.W. and J.L.; investigation, Q.W. and J.L.; resources, P.W.; data curation, X.Q.; writing—original draft preparation, Q.W.; writing—review and editing, J.L.; visualization, Q.W. and P.W.; supervision, J.L.; project administration, J.L. All authors have read and agreed to the published version of the manuscript.

Funding

This research received no external funding.

Data Availability Statement

Not applicable.

Conflicts of Interest

The authors declare no conflict of interest.

References

  1. Blaabjerg, F.; Liserre, M.; Ma, K. Power Electronics Converters for Wind Turbine Systems. IEEE Trans. Ind. Appl. 2011, 48, 708–719. [Google Scholar] [CrossRef] [Green Version]
  2. Chen, Y.; Wang, L.; Liu, S.; Wang, G. A Health-Oriented Power Control Strategy of Direct Drive Wind Turbine. IEEE Trans. Power Deliv. 2021, 37, 1324–1335. [Google Scholar] [CrossRef]
  3. Wang, H.; Blaabjerg, F.; Ma, K.; Wu, R. Design for reliability in power electronics in renewable energy systems—status and future. In Proceedings of the 4th International conference on Power Engineering, Energy and Electrical Drives, Istanbul, Turkey, 13–17 May 2013; pp. 1846–1851. [Google Scholar] [CrossRef] [Green Version]
  4. Andresen, M.; Ma, K.; Buticchi, G.; Falck, J.; Blaabjerg, F.; Liserre, M. Junction Temperature Control for More Reliable Power Electronics. IEEE Trans. Power Electron. 2017, 33, 765–776. [Google Scholar] [CrossRef] [Green Version]
  5. Kuprat, J.; van der Broeck, C.H.; Andresen, M.; Kalker, S.; Liserre, M.; De Doncker, R.W. Research on Active Thermal Control: Actual Status and Future Trends. IEEE J. Emerg. Sel. Top. Power Electron. 2021, 9, 6494–6506. [Google Scholar] [CrossRef]
  6. Van der Broeck, C.H.; Ruppert, L.A.; Lorenz, R.D.; De Doncker, R.W. Methodology for Active Thermal Cycle Reduction of Power Electronic Modules. IEEE Trans. Power Electron. 2018, 34, 8213–8229. [Google Scholar] [CrossRef]
  7. Van der Broeck, C.H.; Ruppert, L.A.; Lorenz, R.D.; De Doncker, R.W. Active thermal cycle reduction of power modules via gate resistance manipulation. In Proceedings of the 2018 IEEE Applied Power Electronics Conference and Exposition (APEC), San Antonio, TX, USA, 4–8 March 2018. [Google Scholar]
  8. Kaczorowski, D.; Michalak, B.; Mertens, A. A novel thermal management algorithm for improved lifetime and overload capabilities of traction converters. In Proceedings of the 2015 17th European Conference on Power Electronics and Applications (EPE’15 ECCE-Europe), Geneva, Switzerland, 8–10 September 2015. [Google Scholar]
  9. Zhang, J.; Du, X.; Qian, C. Lifetime improvement for wind power generation system based on optimal effectiveness of thermal management. Appl. Energ. 2021, 286, 116476. [Google Scholar] [CrossRef]
  10. Korompili, A.; Wu, Q.; Zhao, H. Review of VSC HVDC connection for offshore wind power integration. Renew. Sust. Energ. Rev. 2016, 59, 1405–1414. [Google Scholar] [CrossRef] [Green Version]
  11. Ko, Y.; Andresen, M.; Buticchi, G.; Liserre, M. Discontinuous-Modulation-Based Active Thermal Control of Power Electronic Modules in Wind Farms. IEEE Trans. Power Electron. 2018, 34, 301–310. [Google Scholar] [CrossRef]
  12. Ma, K.; Liserre, M.; Blaabjerg, F. Reactive power influence on the thermal cycling of multi-MW wind power inverter. In Proceedings of the 2012 Twenty-Seventh Annual IEEE Applied Power Electronics Conference and Exposition (APEC), Orlando, FL, USA, 5–9 February 2012. [Google Scholar]
  13. Zhang, J.; Li, Y.; Wang, H.; Cai, X.; Igarashi, S.; Wang, Z. Thermal smooth control based on orthogonal circulating current for multi-MW parallel wind power converter. In Proceedings of the 2014 International Power Electronics and Application Conference and Exposition, Shanghai, China, 5–8 November 2014; pp. 146–151. [Google Scholar] [CrossRef]
  14. Zhang, J.; Wang, J.; Cai, X. Active Thermal Control-Based Anticondensation Strategy in Paralleled Wind Power Converters by Adjusting Reactive Circulating Current. IEEE J. Emerg. Sel. Top. Power Electron. 2017, 6, 277–291. [Google Scholar] [CrossRef]
  15. Bakhshizadeh, M.K.; Ma, K.; Loh, P.C.; Blaabjerg, F. Indirect thermal control for improved reliability of Modular Multilevel Converter by utilizing circulating current. In Proceedings of the 2015 IEEE Applied Power Electronics Conference and Exposition (APEC), Charlotte, NC, USA, 15–19 March 2015; pp. 2167–2173. [Google Scholar] [CrossRef]
  16. Niu, H.; Lorenz, R.D. Evaluating Different Implementations of Online Junction Temperature Sensing for Switching Power Semiconductors. IEEE Trans. Ind. Appl. 2016, 53, 391–401. [Google Scholar] [CrossRef]
  17. Wang, B.; Cai, J.; Du, X.; Zhou, L. Review of power semiconductor device reliability for power converters. CPSS TPEA 2017, 2, 101–117. [Google Scholar] [CrossRef]
  18. Wang, H.; Khambadkone, A.M.; Yu, X. Control of Parallel Connected Power Converters for Low Voltage Microgrid—Part II: Dynamic Electrothermal Modeling. IEEE Trans. Power Electron. 2010, 25, 2971–2980. [Google Scholar] [CrossRef]
  19. Li, G.; Du, X.; Sun, P.; Zhou, L.; Tai, H.M. Numerical IGBT junction temperature calculation method for lifetime estimation of power semiconductors in the wind power converters. In Proceedings of the 2014 International Power Electronics and Application Conference and Exposition, Shanghai, China, 5–8 November 2014. [Google Scholar]
  20. Ma, K.; Bahman, A.S.; Beczkowski, S.; Blaabjerg, F. Complete Loss and Thermal Model of Power Semiconductors Including Device Rating Information. IEEE Trans. Power Electron. 2014, 30, 2556–2569. [Google Scholar] [CrossRef]
  21. Alhmoud, L. Reliability Improvement for a High-Power IGBT in Wind Energy Applications. IEEE Trans. Ind. Electron. 2018, 65, 7129–7137. [Google Scholar] [CrossRef]
  22. Website of Infineon, Infineon IGBT Module Datasheet (FF900R12IE4). Available online: http://www.infineon.com (accessed on 12 June 2023).
  23. Website of Infineon, Infineon Power Module Selector and Simulator (IPOSIM). Available online: http://iposim.infineon.com (accessed on 12 June 2023).
  24. Li, H.; Liu, S.; Li, Y.; Hu, Y.; Qin, X.; Ran, L. Power cycling capabilities assessment of IGBT modules in wind power converter considering the wind turbulence effects. In Proceedings of the 2014 International Power Electronics and Application Conference and Exposition, Shanghai, China, 5–8 November 2014; pp. 30–34. [Google Scholar] [CrossRef]
  25. Huang, H.; Mawby, P.A. A Lifetime Estimation Technique for Voltage Source Inverters. IEEE Trans. Power Electron. 2012, 28, 4113–4119. [Google Scholar] [CrossRef]
  26. Porkia, H.A.; Adabi, J.; Zare, F. Reduction of Zero-Sequence and Differential-Mode Circulating Currents and Common-Mode Voltage in Parallel PWM Converters. IEEE Trans. Ind. Electron. 2022, 70, 4038–4047. [Google Scholar] [CrossRef]
  27. Altın, M.; Göksu, Ö.; Teodorescu, R.; Rodriguez, P.; Jensen, B.B.; Helle, L. Overview of recent grid codes for wind power integration. In Proceedings of the 2010 12th International Conference on Optimization of Electrical and Electronic Equipment, Brasov, Romania, 20–22 May 2010. [Google Scholar]
  28. Baygildina, E.; Peltoniemi, P.; Pyrhönen, O.; Ma, K.; Blaabjerg, F. Thermal loading of wind power converter considering dynamics of wind speed. In Proceedings of the IECON 2013—39th Annual Conference of the IEEE Industrial Electronics Society, Vienna, Austria, 10–13 November 2013. [Google Scholar]
  29. Liserre, M.; Buticchi, G.; Leon, J.I.; Alcaide, A.M.; Raveendran, V.; Ko, Y.; Andresen, M.; Monopoli, V.G.; Franquelo, L. Power Routing: A New Paradigm for Maintenance Scheduling. IEEE Ind. Electron. Mag. 2020, 14, 33–45. [Google Scholar] [CrossRef]
Figure 1. Internal structure of power semiconductor.
Electronics 12 03125 g001
Figure 2. Thermal network model of converter power semiconductor.
Electronics 12 03125 g002
Figure 3. Wind power system with parallel converter.
Electronics 12 03125 g003
Figure 4. Control system of the two parallel converters: (a) on the grid side and (b) on the machine side.
Electronics 12 03125 g004
Figure 5. Three variants of the P, Q ranges defined by Germany grid code.
Electronics 12 03125 g005
Figure 6. The vector diagram of GSC by introducing reactive circulating current: (a) indicates the converter which receives overexcited reactive power and (b) generates underexcited reactive power.
Electronics 12 03125 g006
Figure 7. The vector diagram of MSC by introducing reactive circulating current: (a) is the overexcited operation converter and (b) is the underexcited operation converter.
Electronics 12 03125 g007
Figure 8. Proposed ATC strategy block diagram.
Electronics 12 03125 g008
Figure 9. The modulation index of the overexcited operation converter changing with the current: (a) on the grid side and (b) on the machine side.
Electronics 12 03125 g009
Figure 10. Short-term wind speed mission profile and corresponding output power (1 Samples/s).
Electronics 12 03125 g010
Figure 11. Junction temperature with and without ATC: (a) is the IGBT on the grid side and (b) is the Diode on the machine side.
Electronics 12 03125 g011
Figure 12. Current curve with ATC: (a) on the grid side and (b) on the machine side.
Electronics 12 03125 g012
Figure 13. Reactive current reference value and modulation index of GSC with ATC: (a) is the reactive current reference value and its limit amplitude and (b) is the modulation index of GSC.
Electronics 12 03125 g013
Figure 14. Modulation index of MSC with ATC.
Electronics 12 03125 g014
Figure 15. Long-term numerical results: (a) represents wind speed and wind turbine output power; (b) is the junction temperature of grid-side IGBT; (c) is the modulation index of grid-side overexcited converter; (d) represents reactive current reference value and its limit amplitude; (e) is the junction temperature of machine-side diode; (f) is the modulation index of machine-side overexcited converter (1 Samples/s).
Electronics 12 03125 g015aElectronics 12 03125 g015b
Table 1. Loss parameters of FF900R12IE4.
CategoryIGBTCategoryDiode
aTc−1.4971 × 10⁻³aDc−2.1134 × 10⁻³
bTc1.0267bDc1.2328
cTc4.3304 × 10−6cDc1.2326 × 10−6
dTc7.3411 × 10−4dDc7.0473 × 10−4
aTs2.4367 × 10−8aDs1.4228 × 10−8
bTs−1.0826 × 10⁻⁵bDs−6.4718 × 10⁻⁵
cTs0.1905cDs0.1218
dTs14.3531dDs12.0828
TCTsw0.00315TCDsw0.0044
Table 2. Thermal parameters of FF900R12IE4.
CategoryIGBTDiodeCategoryIGBTDiode
Rjci(K/kW)1.24.5τjci(s)0.0008
612.70.013
2035.40.05
2.30.90.6
Rch(K/kW)1425.5τch(s)1
Rha(K/W)0.078τha(s)30
Table 3. 2 MW WPGS parameters.
ParameterValue
Rated output active power2 MW
Switching frequency, fsw2 kHz
DC bus voltage, Udc1100 V
Grid voltage, line-to-line690 V
Grid-side filter equivalent inductance, Lg0.55 mH
Grid-side filter equivalent resistance, Rg5 mOhm
Stator resistance, Rs15 mOhm
Stator q-axis equivalent inductance, Lq0.35 mH
Rotor permanent magnet flux linkage, ψf3.33 Wb
Machine-side filter equivalent inductance, Lm0.96 mH
Machine-side filter equivalent resistance, Rm8 mOhm
Table 4. The cycle number and accumulation damage of power semiconductors with and without ATC.
Categorywithout ATCwith ATC
GSC IGBTNumber of cycles13,9847768
Accumulation damage1.2304 × 10−61.9779 × 10⁻⁷
MSC diodeNumber of cycles23,73514,750
Accumulation damage7.2315 × 10−66.096 × 10⁻⁶
Disclaimer/Publisher’s Note: The statements, opinions and data contained in all publications are solely those of the individual author(s) and contributor(s) and not of MDPI and/or the editor(s). MDPI and/or the editor(s) disclaim responsibility for any injury to people or property resulting from any ideas, methods, instructions or products referred to in the content.