Article

Insu-YOLO: An Insulator Defect Detection Algorithm Based on Multiscale Feature Fusion

School of Mechanical and Electrical Engineering, China Jiliang University, Hangzhou 310018, China
*
Author to whom correspondence should be addressed.
Electronics 2023, 12(15), 3210; https://doi.org/10.3390/electronics12153210
Submission received: 22 June 2023 / Revised: 14 July 2023 / Accepted: 21 July 2023 / Published: 25 July 2023

Abstract

:
To keep the balance of precision and speed of unmanned aerial vehicles (UAVs) in detecting insulator defects during power inspection, an improved insulator defect identification algorithm, Insu-YOLO, which is based on the latest YOLOv8 network, is proposed in this paper. Firstly, to lower the computational complexity of the network, the GSConv module is introduced in the backbone and neck network. In the neck network, a lightweight content-aware reassembly of features (CARAFE) structure is adopted to better utilize the feature information for upsampling, which enhances the feature fusion capability of Insu-YOLO. Additionally, Insu-YOLO enhances the fusion between shallow and deep feature maps by adding an extra object detection layer, thereby increasing the accuracy for detecting small targets. The experimental results indicate that the mean average precision of Insu-YOLO reaches 95.9%, which is 3.95% higher than the YOLOv8n baseline model, with a memory usage of 9.2 MB. Moreover, the detection speed of Insu-YOLO is 87 frames/s which achieves the purpose of real-time identification of insulator defects.

1. Introduction

Insulators, which serve as insulating controls on power towers, play an important role in supporting and separating electrical conductivity during power transmission. However, with the problem of long time exposure of transmission lines to the changing outdoor environment, various unknown natural factors may lead to insulator problems, such as flashover damage and self-explosion. Therefore, insulator defect detection has become one of the significant steps in ensuring the safe operation of transmission lines. The traditional manual power inspection methods require a lot of labor and time, resulting in low inspection efficiency and also a certain risk for the inspectors. In recent years, the popularity of drone inspection technology in the power industry has greatly alleviated the burden on inspection personnel and gradually replaced manual inspection. By obtaining a large number of power inspection images or videos using high-resolution cameras mounted on drones, insulator defects can be detected, thus improving the efficiency and quality of electric power inspection.
The issue of insulator defect identification in aerial images captured by drones is worth discussing. Traditional machine learning methods commonly adopt Hough transformation, canny edge extraction, ant-colony clustering, and other algorithms. However, these traditional methods are generally suitable for cases where insulator defects present distinctive features and simple backgrounds for inspection images. In fact, the aerial images are often affected by various types of noise and their background is complex. Furthermore, inconsistent insulator defect characteristics make it difficult for traditional algorithms to identify insulator defects. Nowadays, deep-learning-based object detection methods have become the current research focus in insulator defect detection, as they have addressed the problems of the poor robustness of feature extraction and low real-time detection to some extent.
Deep-learning-based methods for insulator defect detection can be broadly categorized into one-stage and two-stage object detection algorithms. Typically, one-stage methods are efficient detection frameworks that offer higher frames per second (FPS), while two-stage methods tend to have higher computational complexity but provide higher detection accuracy. Recently, the emergence of transformer-based detection methods [1,2,3,4] has provided an end-to-end solution for traditional detection methods. It is undeniable that transformer-based detection methods exhibit better performance in terms of detection accuracy, but the high computational complexity and memory requirements of transformer-based methods make it challenging to deploy them effectively on edge computing devices such as Jetson Nano.
For the specific task of insulator defect detection addressed in this paper, where the platform is an edge computing device mounted on a UAV, the inference speed of the detection algorithm is of the utmost importance. In this scenario, a desirable requirement is typically an FPS greater than 40. In previous research, in order to obtain higher detection accuracy, more attention has been paid to the optimization of the two-stage detection methods. Lu et al. [5] adopted GIoU as the bounding box loss function in Faster RCNN to overcome sensitivity to multiscale insulator detection. Moreover, Soft-NMS is used during the post-processing stage to avoid detection failures posed by insulator overlapping. Zhao et al. [6] improved the feature pyramid network and applied it to Faster RCNN, resulting in better detection of insulator defects such as breakage or detachment. Zhou et al. [7] enhanced the Mask RCNN model by incorporating an attention mechanism into the backbone network, allowing the model to focus more on small objects for improved localization. Additionally, a rotation mechanism was introduced in the loss function to accurately determine the location of defects by considering various rotation angles. Although these methods achieved remarkable performance in terms of detection accuracy, their inference speed remains a significant challenge.
To address the aforementioned issue, one-stage algorithms have been introduced. Yang et al. [8] modified the feature pyramid network of YOLOv3 from unidirectional feature fusion to bidirectional fusion with the aim of improving the detection accuracy for small targets. Hao et al. [9] introduced the cross-stage partial and residual split attention networks in the backbone network of YOLOv4, which demonstrated enhanced feature extraction capability. They also employed a bidirectional feature pyramid network with a simple attention mechanism to improve the accuracy of insulator defect detection in aerial images with complex background interference. However, although they improved the one-stage detection algorithm to address the detection of small objects and challenging cases, it led to significant increases in algorithm memory consumption and computational complexity. Xu et al. [10] replaced the backbone network of YOLOv4 with the lighter Mobilenet-V1 architecture. They introduced the spatial and channel squeeze and channel excitation (scSE) attention mechanism module to enhance the feature extraction capability of the model. Additionally, they incorporated depth-wise separable convolution to reduce the overall number of network parameters. Guo et al. [11] proposed MSFT-YOLO based on YOLOv5 for detecting small target defects on the surface of steel. They enhanced the model by introducing a transformer-based TRANS module in both the backbone and the neck network, which effectively fused global information from the feature maps. Additionally, they incorporated a weighted bidirectional feature pyramid network to enable information fusion at different scales. To improve the accuracy and speed of detecting insulator defects during UAV power inspections, Han et al. [12] enhanced the backbone network of YOLOv4 by designing the D-CSPDarknet53 network, which reduced both the model’s parameters and computational complexity. Additionally, they incorporated SA-Net (shuffle attention neural networks) into the feature fusion network to enhance the model’s attention to target features. Furthermore, they introduced multi-head outputs to improve the detection accuracy of small target insulator defects. Although the improved model effectively enhances detection accuracy and speed, there is still room for optimization in terms of the algorithm’s memory consumption and computational complexity.
In aerial inspection images, insulators usually occupy a large area, while defects only account for a small portion, as shown in Figure 1. To address the aforementioned issues, this paper proposes an improved network, Insu-YOLO, based on YOLOv8n. The contribution of the proposed method can be summarized as follows.
  • The GSConv modules are adopted in the backbone and neck networks of the Insu-YOLO model, which can reduce the number of parameters and complexity of our model.
  • The original upsampling modules in Insu-YOLO are replaced with a content-aware reassembly of features (CARAFE) structure, which ensures that the model retains the ability to extract information from small targets without losing corresponding detailed features due to interpolation-based upsampling Additionally, the previous SPPF module is replaced with the SimCSPSPPF structure to further enhance the representational power of the model.
  • To enhance the detection capability of the model for challenging cases such as small targets and larger variance of aspect ratios, an additional object detection layer is added in Insu-YOLO, which can fuse shallow feature maps with deeper ones to optimize the detection performance of insulator defects.

2. Realted Work

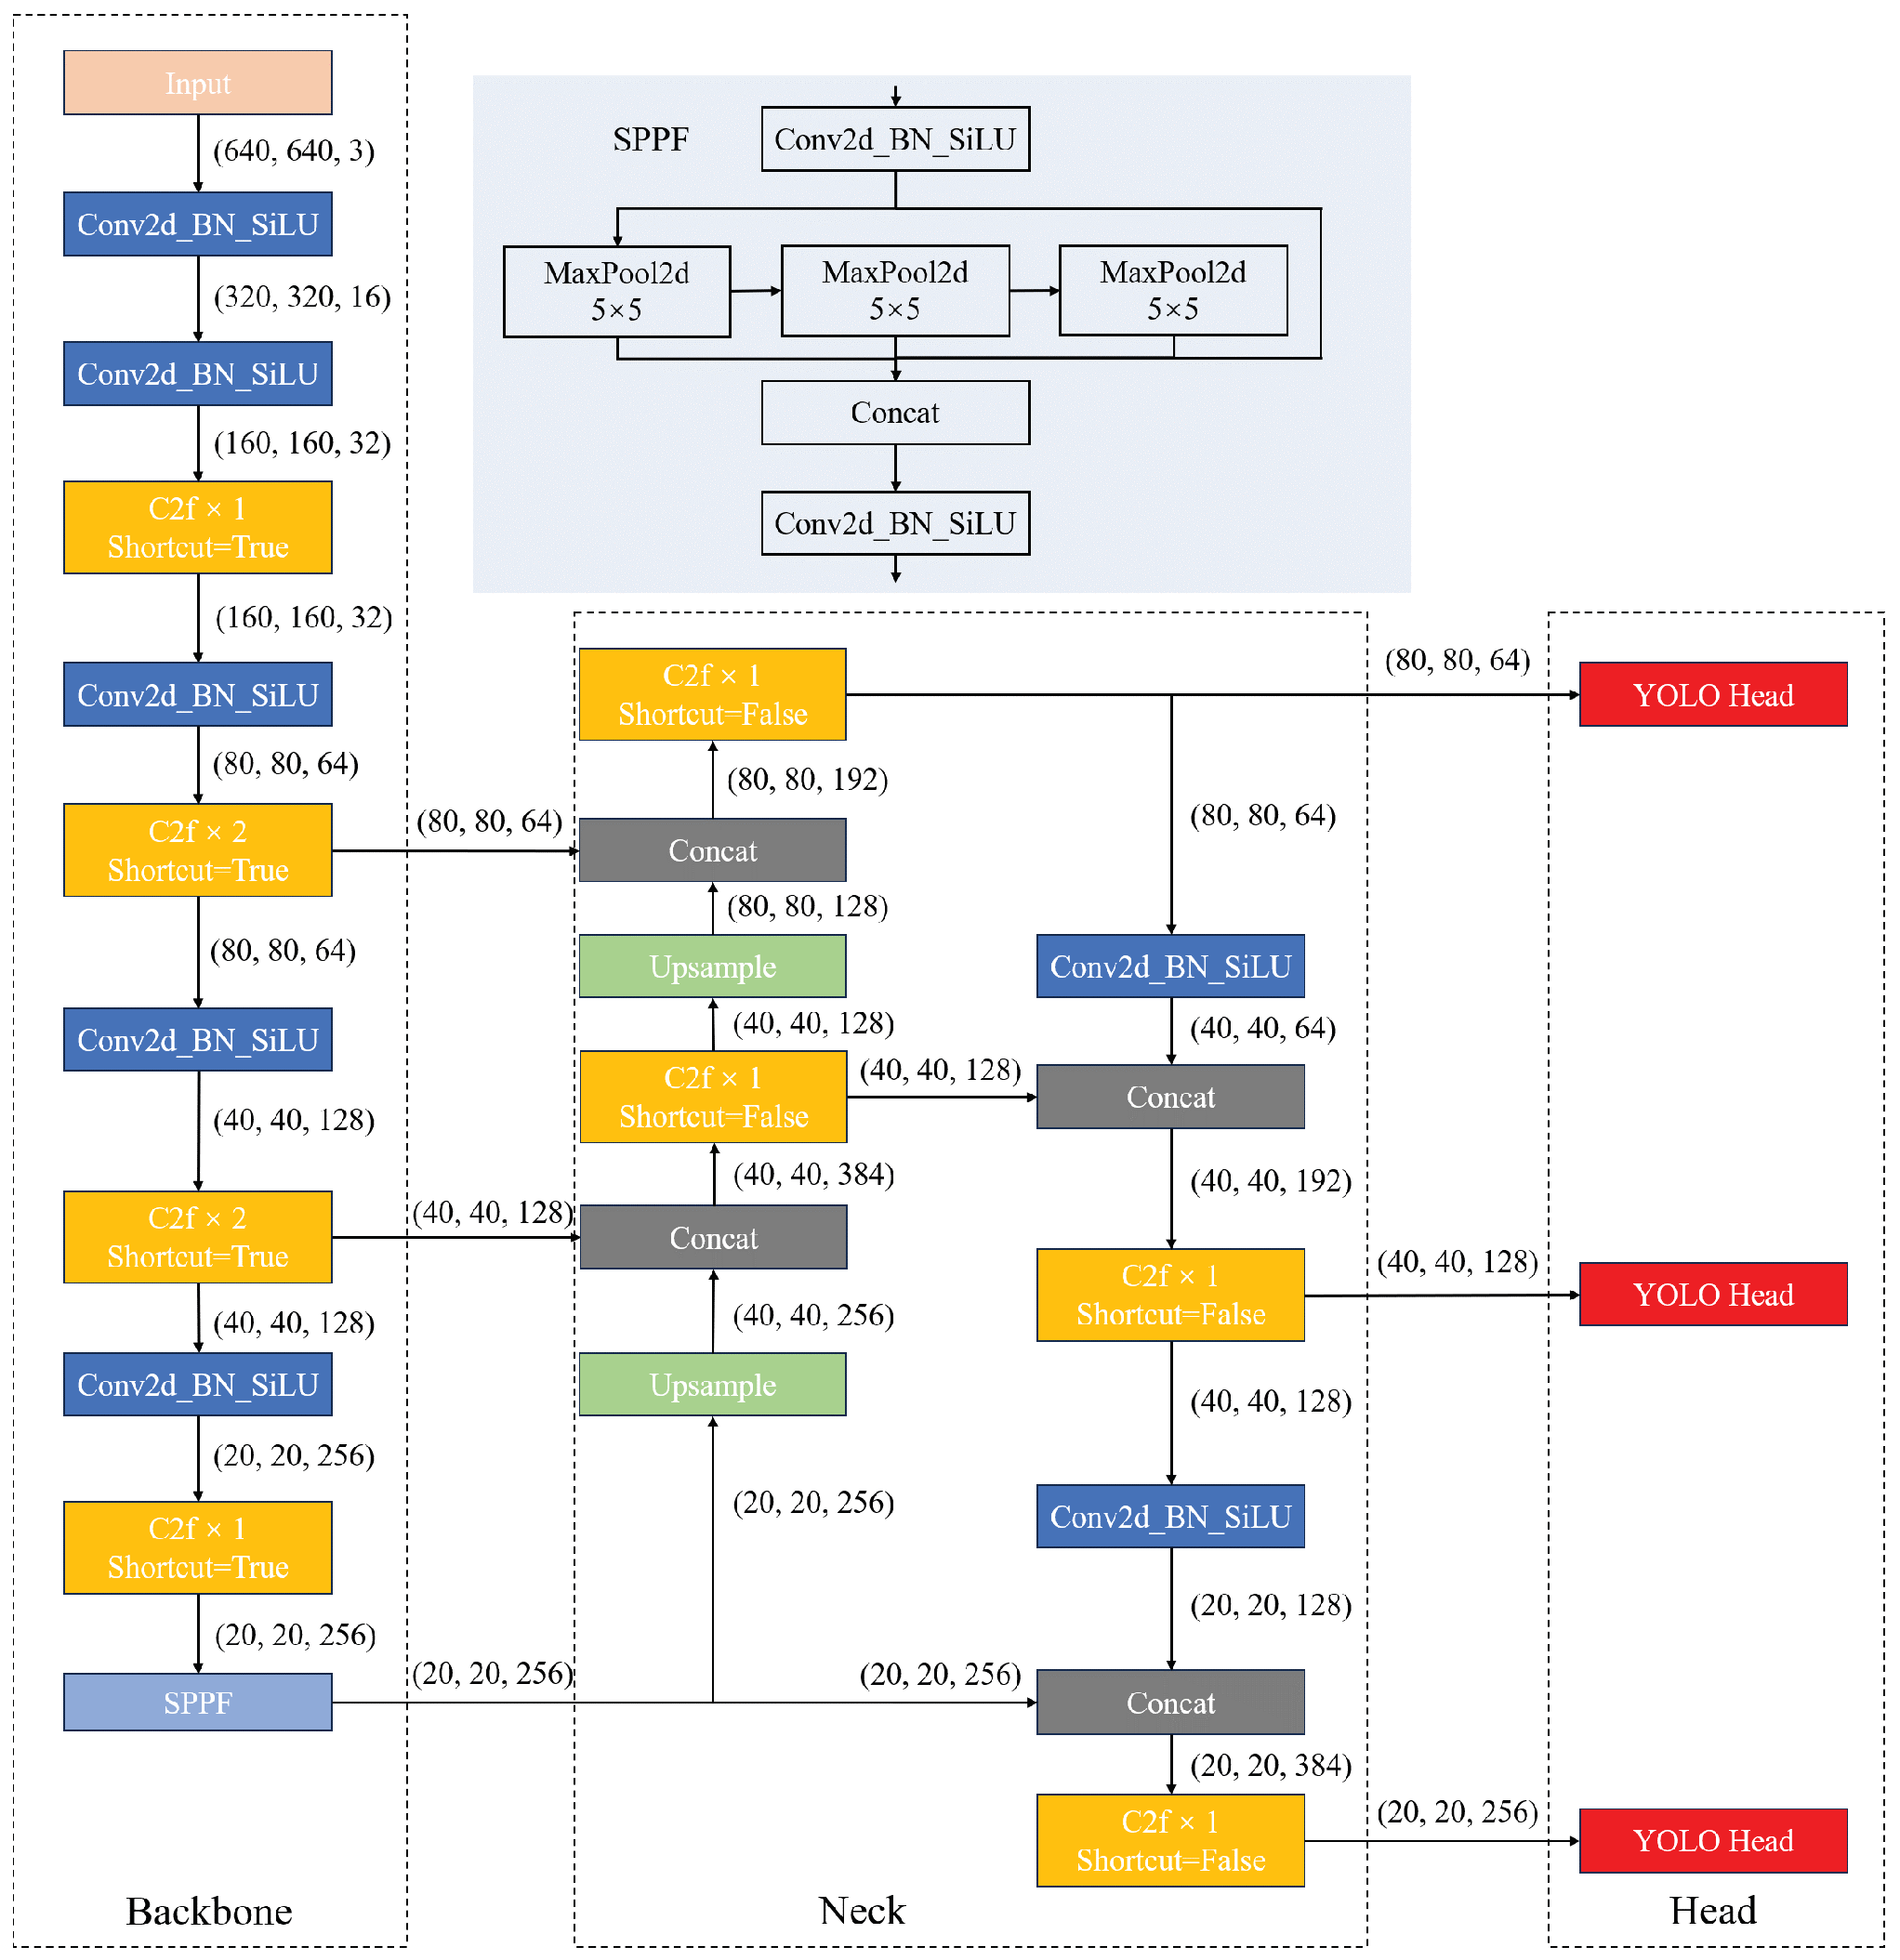
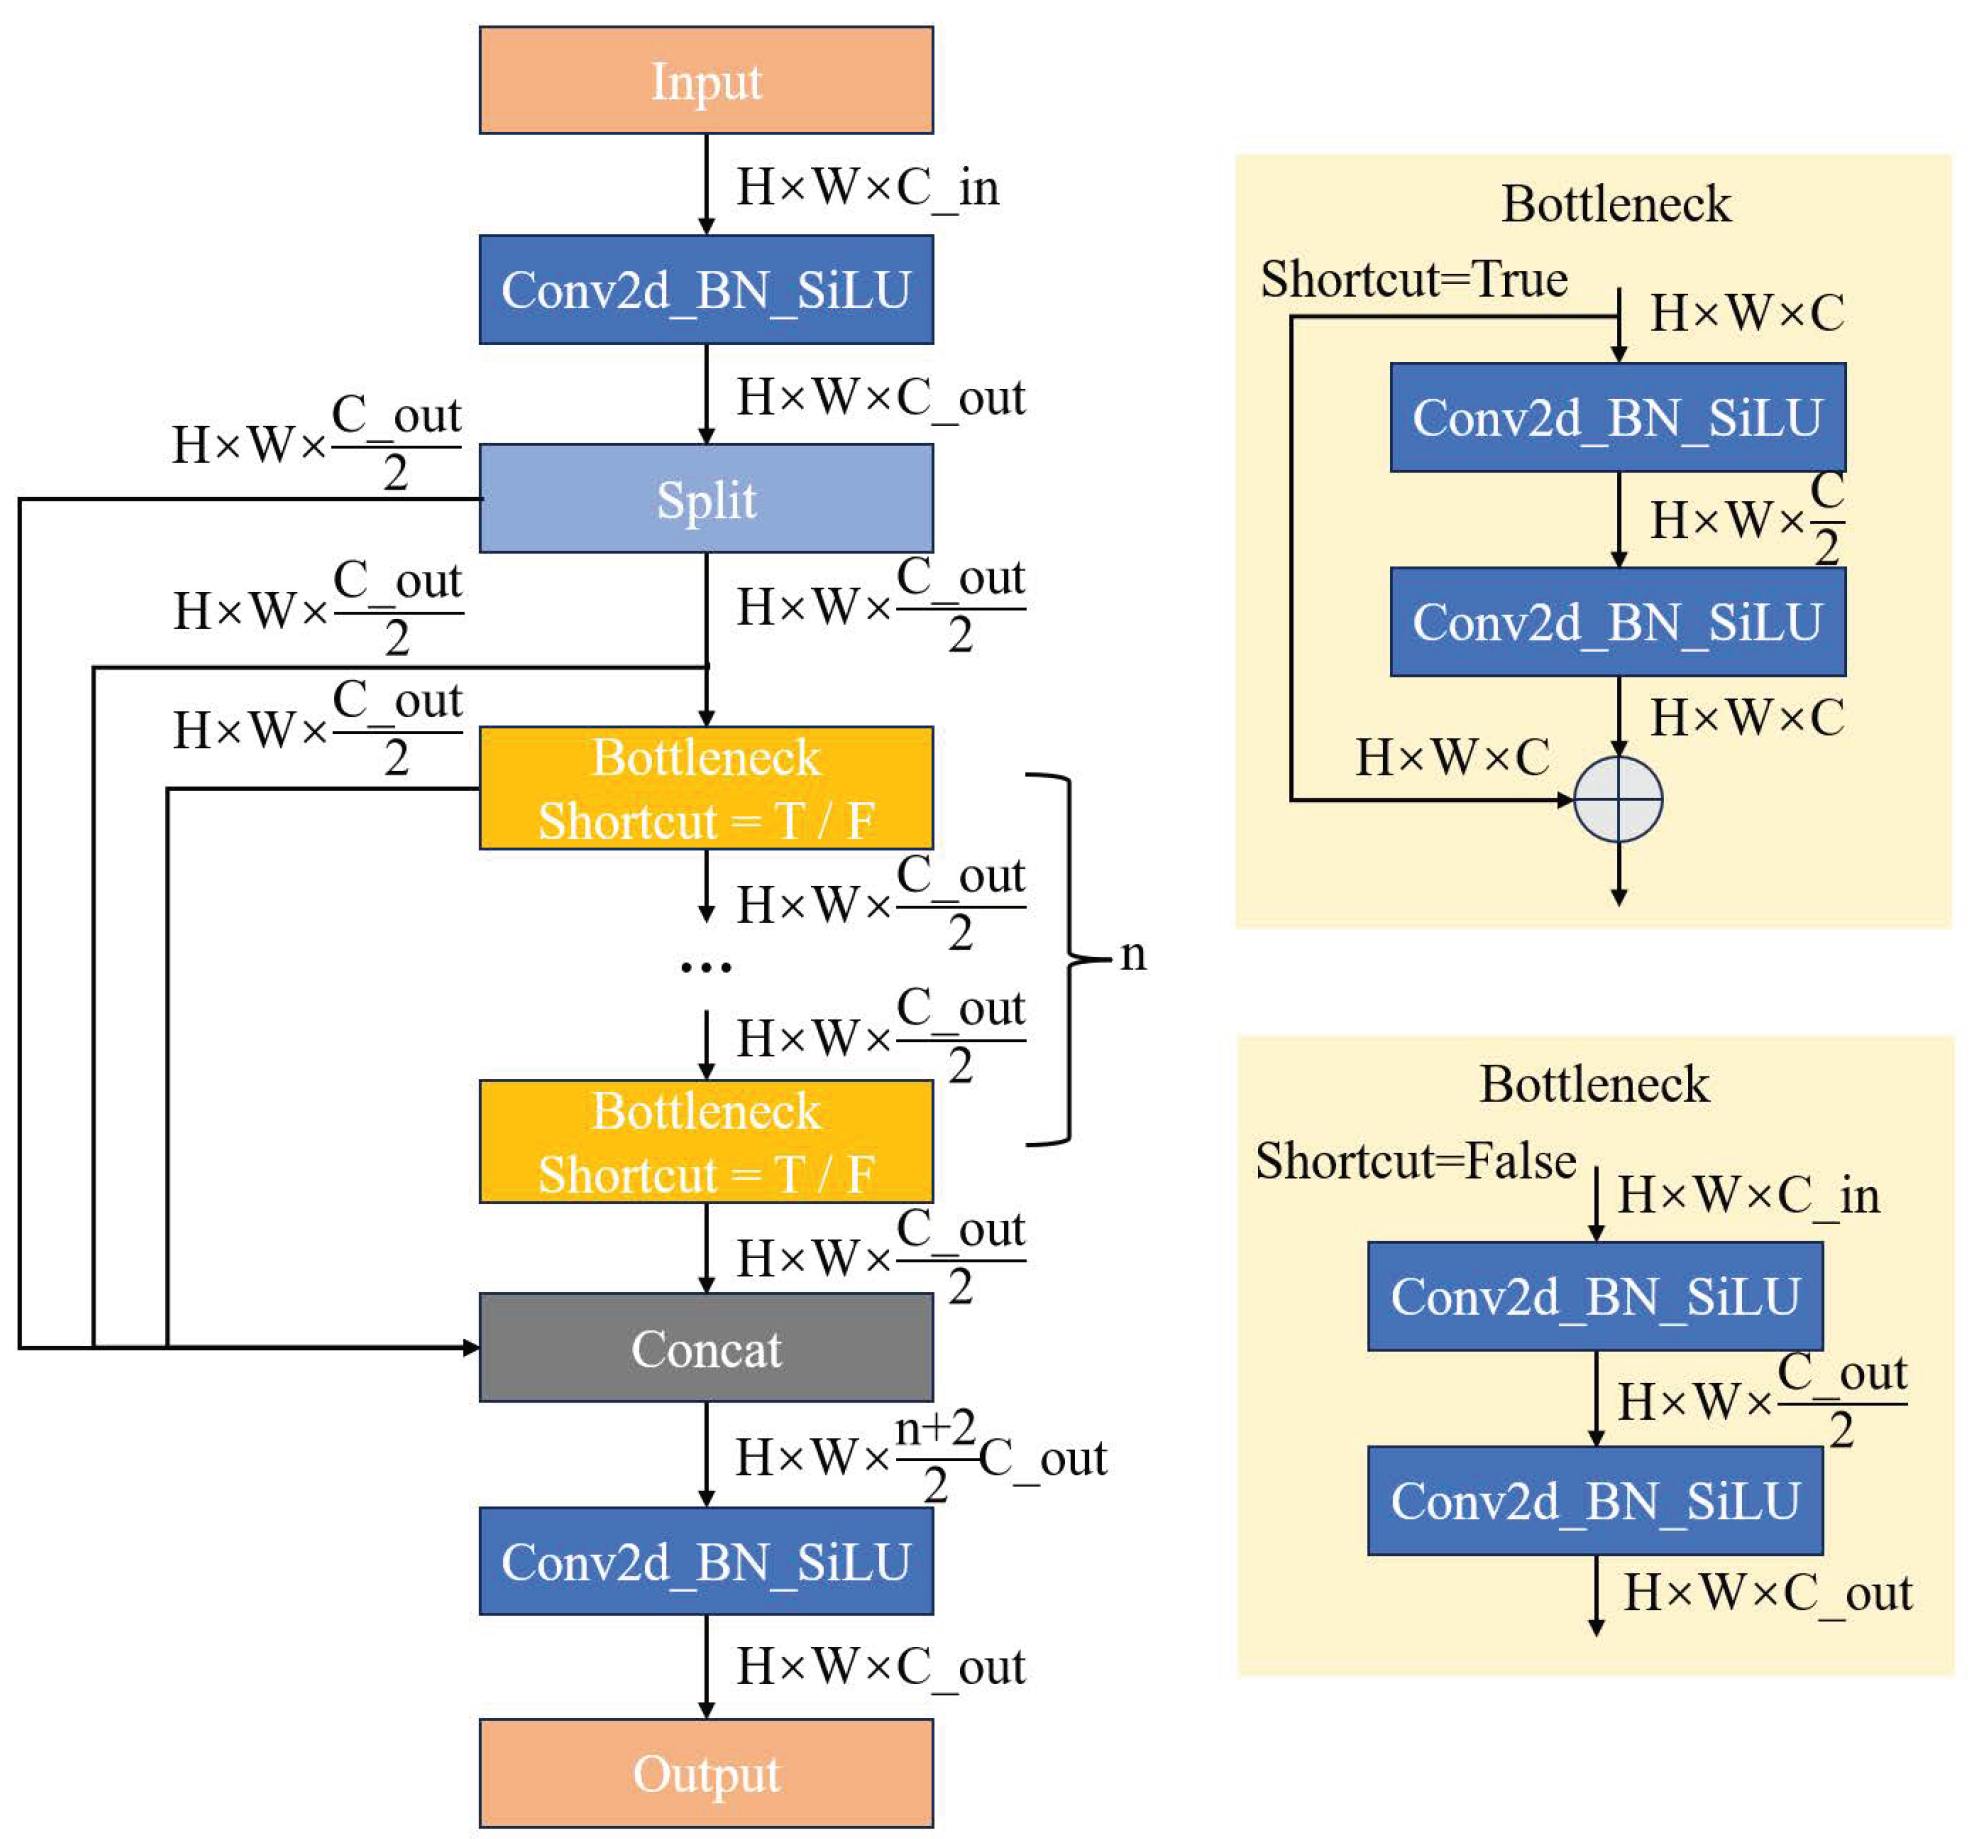
2.1. YOLOv8 Basic Model

YOLOv8 is the latest object detection framework proposed by the Ultralytics company, in early 2023. Compared with the previous versions of YOLO models, YOLOv8 has achieved state-of-the-art results in basic tasks such as object detection, semantic segmentation, and image classification. The structure of YOLOv8 is shown in Figure 2.
In the backbone network, YOLOv8 still adopts the CSPNet structure [13]. The input image is scaled to a size of 640 × 640 × 3. After the preprocessing step, the image is passed through the backbone network, which generates three multiscale feature maps of different dimensions: 20 × 20 × 256, 40 × 40 × 128, and 80 × 80 × 64. Referring to the idea of ELAN in YOLOv7 [14], an effective C2f structure is introduced. As shown in Figure 3, after inputting the feature maps into the C2f module, they are passed through a Conv module composed of Conv2d, batch normalization (BN), and the SiLU activation function. Subsequently, they are split in the channel dimension, using the split module, into two parts, each with half the number of channels as the output channels. One part goes through n bottleneck modules, where the value of n depends on the scale of YOLOv8. Finally, the resulting feature maps are concatenated and processed through another Conv module to obtain the final output.
The neck network of YOLOv8 still uses the Path Aggregation Network and Feature Pyramid Network (PAN-FPN) structure, where the C2f module is also adopted to enhance the model’s ability to fuse the global information of feature maps.
In the detecting head structure, YOLOv8 utilizes the currently predominant decoupled head to accelerate the network convergence speed while improving the detection accuracy. Furthermore, YOLOv8 replaces the traditional anchor-based method with an anchor-free approach, which allows the model to predict the location and size of objects directly without using pre-designed anchors.
In this work, YOLOv8 is adopted to serve as the insulator defect detection model and improvements are made on this basis to balance detection speed and accuracy.

2.2. Characteristics of GSConv

When it comes to drone-based power line inspections, detection speed and accuracy are equally important. On the one hand, large-scale models such as ResNet [15], vision transformer [16], etc., can achieve high detection accuracy, but their detection time is too long to satisfy the timeliness. On the other hand, lightweight networks such as Xception [17], MobileNets [18,19,20], and ShuffleNets [21,22] greatly improve the detection speed by depth-wise separable convolution, but their lower detection accuracy renders them unsuitable for power inspection tasks. Considering the above problems, Li et al. [23] proposed the GSConv structure, as shown in Figure 4. In this structure, the input feature map is passed through a module consisting of a 2D convolutional layer, batch normalization (BN), and the activation function SiLU, resulting in a feature map with half the number of channels as the final output channel. After passing through the DWConv module, the two resulting outputs are concatenated along the channel dimension and then subjected to a shuffle operation to obtain the final output. Experimental results indicate that the adoption of the GSConv modules can reduce the model complexity while maintaining accuracy and enhancing the detection performance of insulator defects.

2.3. Characteristics of CARAFE

In the original YOLOv8, the feature pyramid structure utilizes the nearest-neighbor interpolation upsampling method. However, this method only determines the upsampling kernel based on the spatial location of pixels, which makes it difficult to exploit the feature information. To address this problem, Wang et al. [24] proposed the content-aware reassembly of features (CARAFE) structure. This structure has a larger receptive field, allowing for better aggregation of contextual information, while also utilizing the feature information and performing upsampling based on the input feature map. In addition, the CARAFE structure is more lightweight and only introduces a small amount of computation and parameters, making it easy to integrate into various model structures. Specifically, the input feature map is used to predict the upsampling kernels, which are independent for each location. Then, the feature reassembly is performed based on the predicted upsampling kernels. In this work, the nearest-neighbor interpolation upsampling structure in the YOLOv8 neck network is replaced with the CARAFE module, which can improve the feature fusion for insulator defects without adding extra parameters or computation.

2.4. Characteristics of Small Object Detection Layer

In the UAV inspection pictures, not only large-scale insulator strings but also small-scale insulator defects are included. For YOLOv8 with a large downsampling ratio, it is difficult for the model to learn the feature information of tiny objects in the deeper feature maps. In addition, the insulators are arranged densely in the power transmission line and may occlude one another. Furthermore, the complex background of the aerial images can introduce noise, which further increases the difficulty of detecting small objects. Insu-YOLO incorporates an additional small object detection layer, enabling feature fusion of shallow feature maps with deeper ones. Despite the increase in computational cost and reduction in detection speed caused by adding a small object detection layer, there is a significant enhancement effect for small target detection.

3. Improved YOLOv8 Model Network Structure

In order to optimize the performance of detecting insulator defects in drone inspection images, the Insu-YOLO model is proposed, whose structure is shown in Figure 5. Insu-YOLO introduces the GSConv modules in the backbone and neck networks to reduce the number of parameters of the model and optimize its ability to extract insulator defect features, thereby improving the detection accuracy. In addition, Insu-YOLO adopts a lightweight content-aware reassembly of features (CARAFE) structure in the neck network, which enables the model to better utilize the feature information during upsampling and enhance the feature fusion capability of insulators. To enhance the accuracy of the model in detecting tiny defects, Insu-YOLO adds an additional small object detection layer to concatenate shallow and deeper feature maps before detection. Inspired by YOLOv6 v3.0 [25], this paper replaces the SPPF module with the SimCSPSPPF block, which brings a certain degree of performance improvement to our model.
The bounding box loss function used in the original YOLOv8 is CIoU, which does not take the direction between the ground-truth and predicted bounding boxes into account, resulting in a slower convergence rate during model training. Therefore, Insu-YOLO introduced the SIoU [26] as the loss function. It considers the vector angle between the ground-truth and predicted boxes, and redefines the penalty metric. SIoU consists of the following four parts.
(1)
Angle cost. The angle in this cost function is the angle between the line connecting the center points of the ground-truth and the predicted boxes. The formula is given as follows.
Λ = 1 2 sin 2 ( arcsin ( c h σ ) π 4 )
c h σ = sin α
σ = ( b c x g t b c x ) 2 + ( b c y g t b c y ) 2
c h = m a x ( b c y g t , b c y ) 2 ) m i n ( b c y g t , b c y ) 2 )
where sin α is the ratio of the opposite side to the right-angled side in the right triangle, σ is the distance between the center point of the ground-truth and predicted boxes, c h is the height difference between the center point of the ground-truth and predicted boxes, b c x g t and b c y g t are the center coordinates of the ground-truth box, and b c x and b c y are the center coordinates of the predicted box.
(2)
Distance cost. The distance cost is related to the minimum bounding rectangle of the ground-truth and predicted boxes. The formula of it is as follows.
Δ = t = x , y ( 1 e γ ρ t ) = 2 e γ ρ x e γ ρ y
ρ x = ( b c x g t b c x c w ) 2 , ρ y = ( b c y g t b c y c w ) 2 , γ = 2 Λ
where c w and c h are the width and height of the minimum bounding rectangle.
(3)
Shape cost. The definition of the shape cost is illustrated in the following formulas.
Ω = t = w , h ( 1 e w t ) θ = ( 1 e w w ) θ + ( 1 e w h ) θ
w w = | w w g t | m a x ( w , w g t ) , w h = | h h g t | m a x ( h , h g t )
where w, h, w g t , and h g t are the width and height of the ground-truth and predicted boxes, respectively. The value of θ controls the degree of attention to the shape cost.
(4)
IoU cost. IoU refers to the intersection rate between the ground-truth and predicted bounding boxes, which is defined as the ratio of the intersection to the union of the two boxes, and is calculated using the following formula.
I o U = | A B | | A B |
where A is the predicted box and B denotes the ground-truth box.
Combining the above four cost functions, the final SIoU loss function is calculated by the following equation.
L S I o U = 1 I o U + Δ + Ω 2
The Insu-YOLO model combines a variety of optimization methods and has better prospects for application in power inspection tasks.

4. Experiments

This section, which presents the experimental results of the proposed model and other baseline models, is divided into four sections. Section 4.1 describes the datasets used in our experiment. Section 4.2 introduces the experimental environment and the experimental hyperparameters. Section 4.3 illustrates the evaluation metrics used for the experimental results. In Section 4.4, the ablation experiments are carried out, and also the experimental results of different models on the datasets are compared and discussed.

4.1. Dataset Preparation

In this article, experiments are conducted on two datasets, “CPLID” and “IDID”, to facilitate performance comparison of the proposed model with other baseline models. Several sample images of the two datasets are shown in Figure 6.
(1)
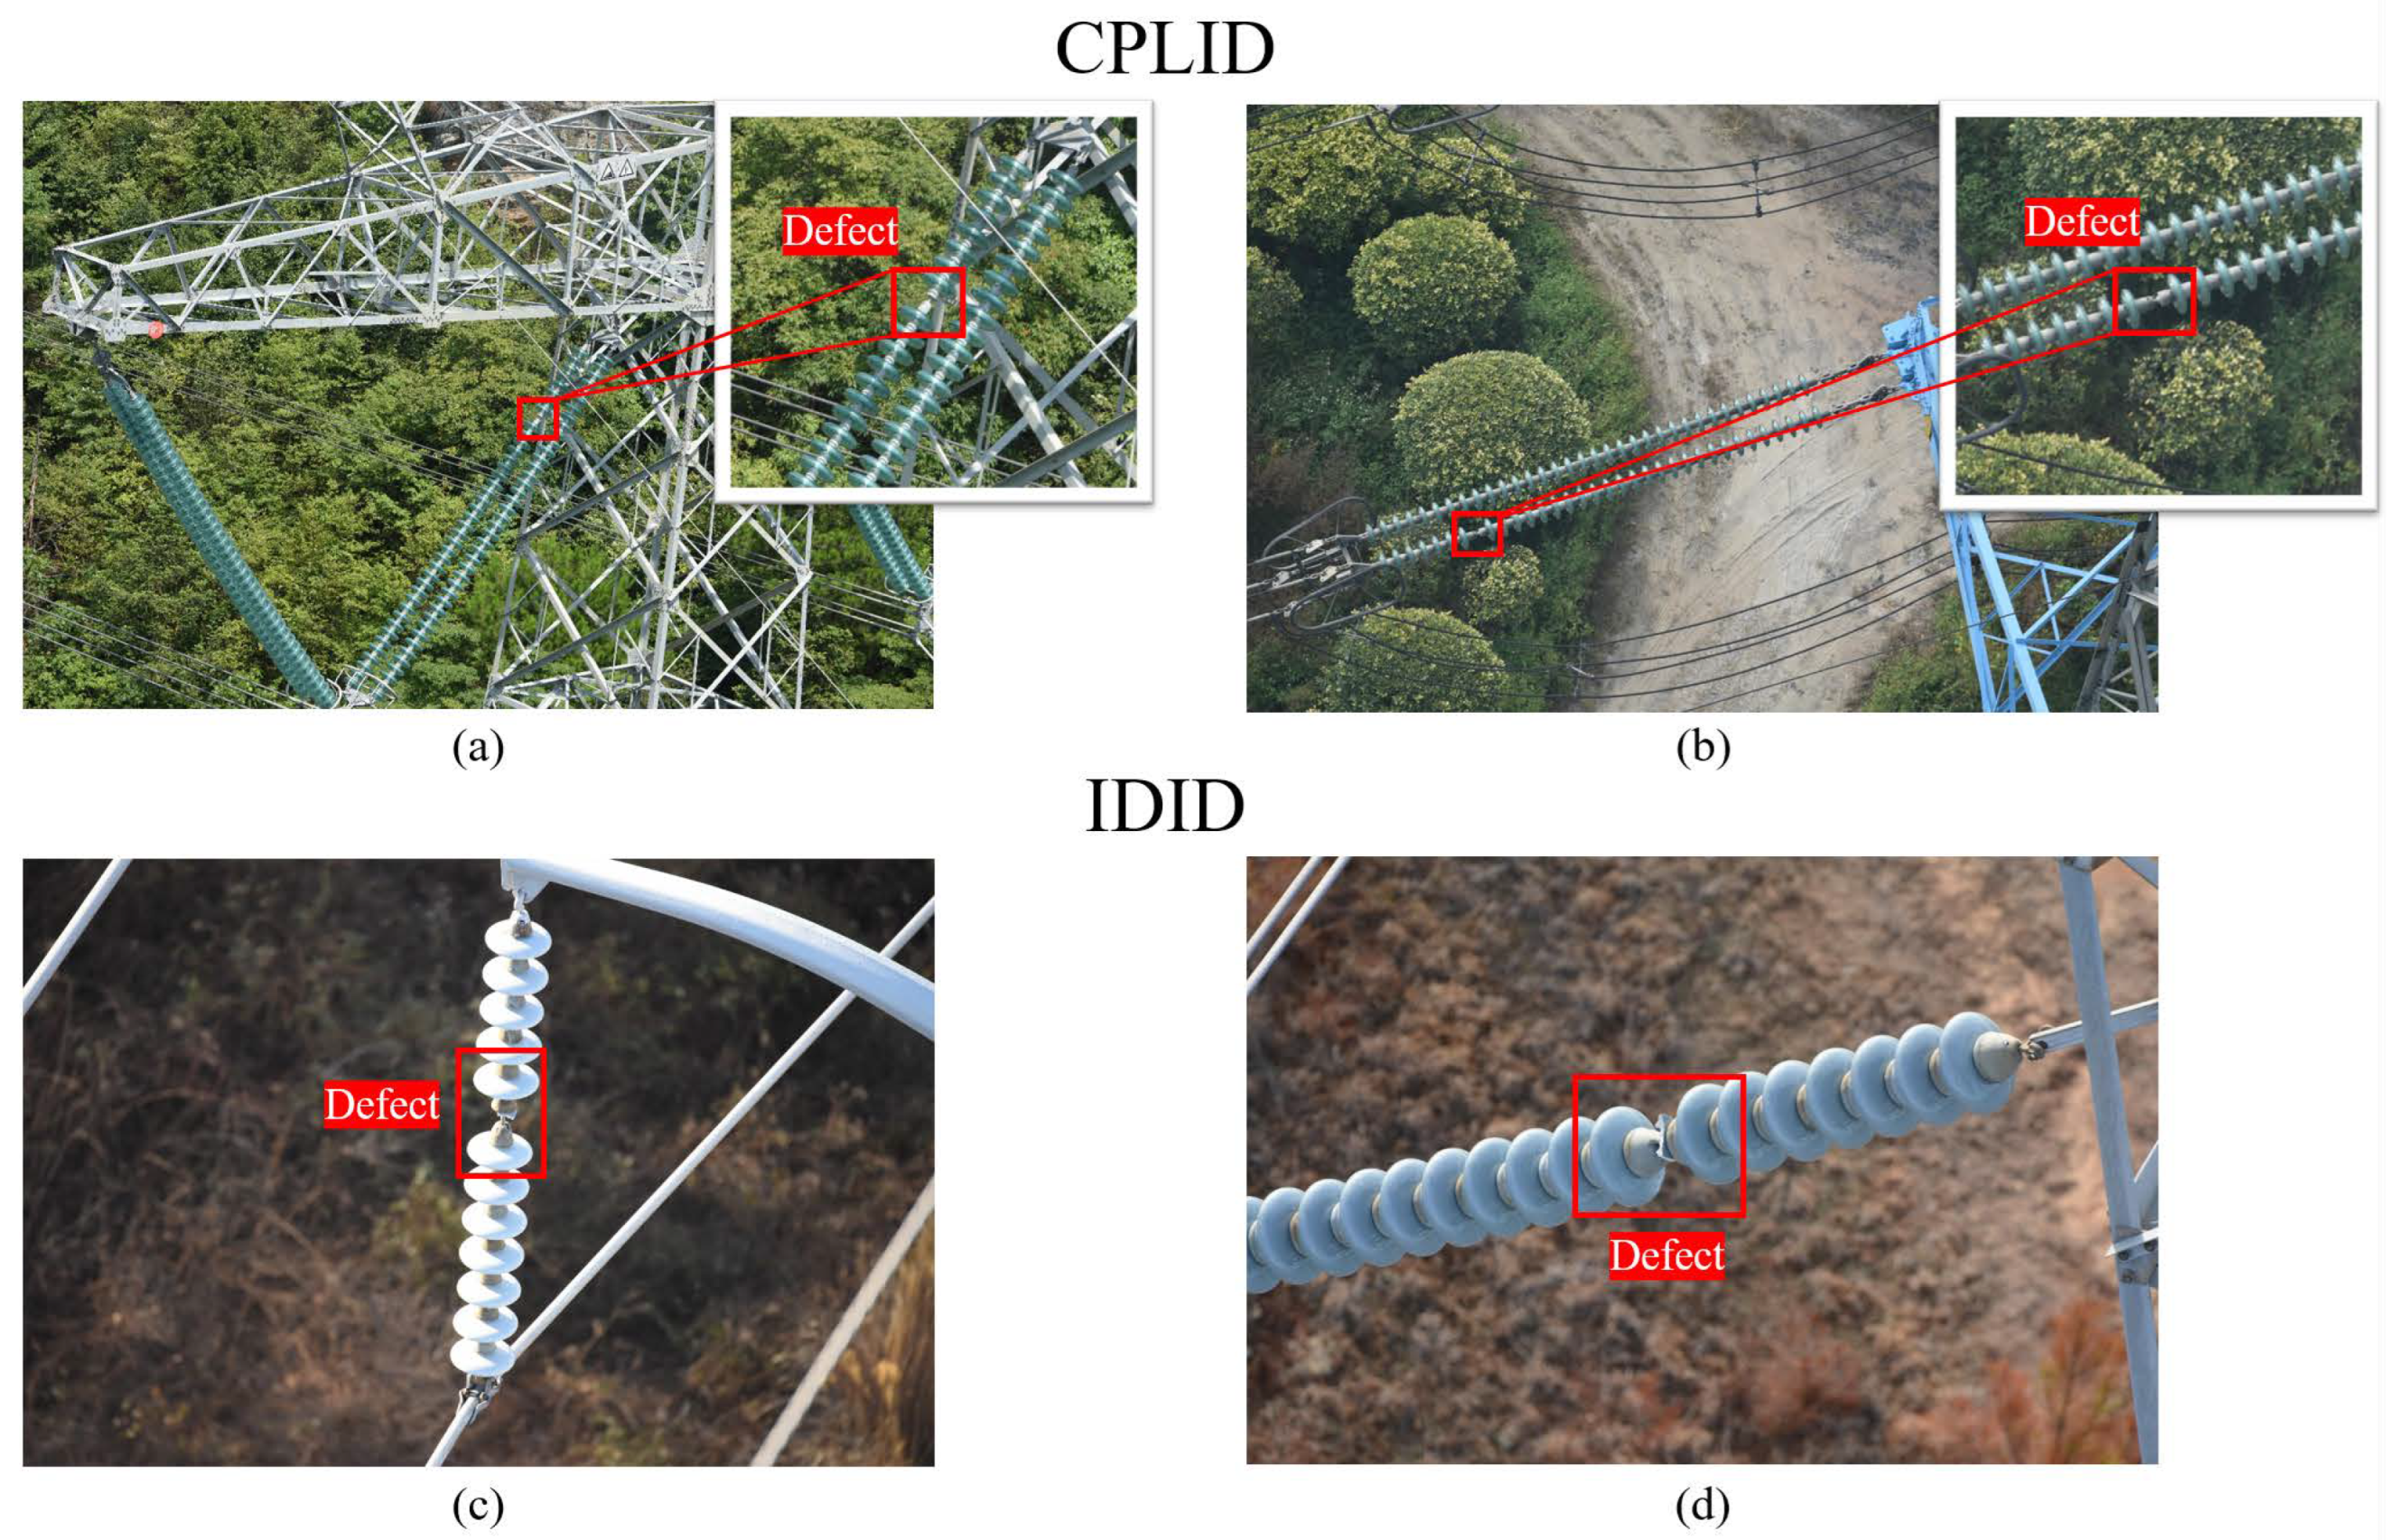
CPLID. The dataset “Chinese Power Line Insulator Dataset” (CPLID) [27] was collected by the State Grid Corporation of China. It contains 848 aerial images of composite insulators. In order to optimize the generalization ability of the Insu-YOLO in detecting insulators of different materials, this paper also introduces the intelligent defect detection dataset of power inspection provided by the eighth “TipDM Cup” data mining challenge in 2020, which contains 40 aerial images of glass insulators. The final dataset consists of 284 defective insulator images and 604 normal insulator images. Due to the insufficient number of defective insulator images, corresponding data augmentation operations are performed in this paper, including brightness enhancement, color deepening, contrast enhancement, etc. Finally, 2876 insulator aerial images are obtained, which contain the labels insulator defect and insulator.
(2)
IDID. The public dataset “Insulator Defect Image Dataset” (IDID) [28] contains 1600 high-resolution insulator images. To make the model learn more insulator features, data augmentation operations such as brightness enhancement, color deepening, and contrast enhancement are conducted to expand the dataset, resulting in 2800 insulator images.
Before the training starts, 10% of the images from each of the above two datasets are taken as the test set, and then the remaining images are separated into the training and validation sets with the ratio of 9:1. Then, the Labeme tool is used to annotate the training and validation sets to obtain label files conforming to the PASCAL VOC dataset format. Finally, these files are converted into labels that are suitable for the YOLO format, i.e., category, normalized values of the horizontal and vertical coordinates of the center point, and the normalized values of the width and height of the bounding box. The specific division of the two datasets is shown in Table 1.

4.2. Experimental Environment and Hyperparameters Settings

The experiments were performed on the Windows 10 operating system. An NVIDIA GeForce RTX 3090 of GPU and a 12th Gen Intel(R) Core I9-12900K of CPU were used for training and testing. The versions of CUDA and cuDNN were 11.3 and 8.2.1, respectively. The models were built based on the Pytorch 1.11.0 framework with the Python 3.8 programming language.
In our experiments, stochastic gradient descent was used as the optimizer. Its initial learning rate was set to be 0.01, and the learning rate was updated by cosine annealing schedule. The momentum and weight decay values of the optimizer were set to 0.937 and 0.0005, respectively. Each model was trained for 200 epochs, and a batch of 16 images was taken as input to the network during each round. Regarding the parameter settings for data augmentation, the fractions for augmenting the hue, saturation, and value of the input image were 0.015, 0.7, and 0.4, respectively. During preprocessing, there was a 50% chance that the image would be horizontally flipped. Additionally, the mosaic data augmentation technique was employed to enhance the model’s generalization capability and accuracy. More detailed settings of the hyperparameters are shown in Table 2. The improved Insu-YOLO model experiments were performed on an NVIDIA GeForce RTX 3090. The experimental results indicate that Insu-YOLO achieves an inference time of 87 frames/s on the CPLID dataset and 43 frames/s on the IDID dataset.

4.3. Evaluation Metrics

In order to evaluate the performance of the model, precision (P), recall (R), average precision ( A P ), mean average precision ( m A P ), and F1 score were used as evaluation metrics. Furthermore, FPS, memory usage, and GFLOPs were also taken into account. The formulas are as follows.
P = T P T P + F P
R = T P T P + F N
A P = 0 1 p ( r ) d r
m A P = 1 n i = 1 n A P i
F 1 S c o r e = 2 × P × R P + R
In the above-mentioned formulas, T P (True Positive) represents the number of true positive samples that are classified as positive correctly, F P (False Positive) represents the quantity of false positive samples that are classified as positive incorrectly, and F N (False Negative) is the number of false negative samples that are classified as negative incorrectly. Precision refers to the ratio of examples that are correctly classified as positive out of all samples that are predicted as positive. Recall refers to the ratio of positive samples that are correctly classified as positive by the model out of all actual positive samples. Average precision ( A P ) reflects the capability of the model to recognize a specific class by calculating the area under the precision–recall curve, while mean average precision refers to the average of APs for all categories. The F1 score represents the weighted harmonic mean score of precision and recall, and a higher F1 score indicates a more effective experimental method.

4.4. Experimental Results

(1) Compared with other models on CPLID dataset. To perform further validation on the detection performance of Insu-YOLO, it is compared with other models on the CPLID dataset, and the experimental results are shown in Table 3.
In terms of mean average precision (mAP) for object detection, Insu-YOLO shows a certain degree of improvement compared to the other models. Compared to the transformer-based RT-DETR model, Insu-YOLO achieves a 1.05% increase in mAP. When compared to YOLOv3t and YOLOv5n, Insu-YOLO exhibits improvements of 4.14% and 3.35%, respectively. In comparison to YOLOv6n and YOLOv7t, Insu-YOLO demonstrates enhancements of 2.69% and 2.47%, respectively. Moreover, when compared to the baseline model YOLOv8n, Insu-YOLO achieves a 1.70% improvement. These results indicate that the enhanced Insu-YOLO model achieves higher precision in detecting insulators and their defects.
Detection speed is one of the important indicators for evaluating model performance. Due to the high memory consumption and computational complexity of RT-DETR, its detection speed is limited and only reaches 32 frames/s. In contrast, Insu-YOLO achieves a detection speed of 87 frames/s, which is an improvement of 2.35% and 33.85% compared to YOLOv3t and YOLOv7t, respectively. However, it shows a decrease of 15.53% and 7.45% compared to YOLOv5n and YOLOv6n. It is worth mentioning that the baseline model YOLOv8n has the fastest detection speed among all the models, reaching 118 frames/s, which is an improvement of 26.27% over Insu-YOLO. Nevertheless, Insu-YOLO still meets the requirements for real-time detection.
When it comes to memory usage, the transformer-based RT-DETR model has the largest value of all models, reaching 66.1 MB, which may pose challenges for deployment on mobile devices for testing purposes. On the other hand, one-stage YOLO models exhibit relatively smaller memory usage, with YOLOv5n occupying only 5.2 MB, making it the smallest among the models. The Insu-YOLO model has a model size of 9.2 MB, which represents a 48.4% increase compared to the baseline model YOLOv8n. Nevertheless, Insu-YOLO still meets the requirements of a lightweight model and remains suitable for deployment and experimentation on mobile devices.
Compared with the state-of-the-art (SOTA) models, Insu-YOLO achieves 95.9% on mAP, which is 4.81% and 0.31% better than BF-YOLO and ID-YOLO. In terms of the average precision of detecting defects, Insu-YOLO is able to achieve 92.2%, which is lower than BF-YOLO and ID-YOLO by 5.74% and 6.96%, respectively. However, as for insulator detection, compared to BF-YOLO and ID-YOLO, the average precision of Insu-YOLO can reach 99.5%, which is an increase of 16.78% and 8.03%, respectively. In addition, in terms of detection speed, Insu-YOLO is 7.9 times and 1.4 times faster than BF-YOLO and ID-YOLO. Furthermore, when it comes to memory usage, Insu-YOLO only occupies 9.2 MB, which is much smaller than ID-YOLO.
(2) Experiments on the IDID dataset. In order to further validate the generalization ability of our proposed model, this section conducts experiments on the IDID dataset. The experimental results are presented in Table 3.
In terms of the mean average precision (mAP) of the models, Insu-YOLO achieves 99.1%, which is a 1.64% improvement over the baseline model YOLOv8n. It shows increases of 16.18% and 1.75% compared to YOLOv3t and YOLOv5n, respectively, and improvements of 12.10% and 17.56% compared to YOLOv6n and YOLOv7t. In comparison to the transformer-based model RT-DETR, Insu-YOLO exhibits an 8.90% improvement in mAP. These results indicate that the improved Insu-YOLO model also maintains excellent generalization and detection accuracy on the IDID dataset.
Regarding the F1 score, Insu-YOLO exhibits significant improvements compared to other models. In comparison to RT-DETR, Insu-YOLO shows an 8.61% increase in F1 score. It demonstrates improvements of 21.83% and 4.30% compared to YOLOv3t and YOLOv5n, respectively. Similarly, it achieves enhancements of 17.27% and 12.12% when compared to YOLOv6n and YOLOv7t. Compared to the baseline model YOLOv8n, Insu-YOLO achieves a 3.41% increase in the F1 score. The experimental results demonstrate that the improved Insu-YOLO model exhibits better quality and performance.
When evaluated based on detection speed, Insu-YOLO achieves 43 frames/s, which is a 15.69% decrease compared to the baseline model YOLOv8n. Compared to RT-DETR, Insu-YOLO demonstrates a detection speed that is approximately 2.53 times higher. In comparison to YOLOv6n and YOLOv7t, Insu-YOLO shows improvements of 10.26% and 4.88% in detection speed, respectively. However, compared to YOLOv3t and YOLOv5n, Insu-YOLO experiences a decrease in detection speed of 34.85% and 15.69%, respectively. Nevertheless, Insu-YOLO is still capable of achieving real-time detection.
Compared with the SOTA model, the mAP of Insu-YOLO achieves 99.1%, which is 5.64% higher than the improved YOLOv7 [29]. As for F1 score, Insu-YOLO can reach 0.971, improving by 3.30% comparing to the improved YOLOv7 model, which demonstrates that Insu-YOLO also has robustness and generalization on this dataset. However, when it comes to inference speed, the improved YOLOv7 model reaches 95 frames/s, which is approximately 2.2 times faster than Insu-YOLO. Nonetheless, Insu-YOLO still satisfies the requirements for timely detection.
(3) Comparison of Detection Performance on the COCO Dataset. In this paper, various models were tested on the COCO dataset, as shown in Table 4. Since the proposed Insu-YOLO model is improved based on YOLOv8n, under a uniform configuration, our method achieves a balance between detection speed and accuracy compared to previous SOTA models. Although YOLOv7n and Insu-YOLO are similar in terms of the number of parameters and computational complexity, our method exhibits slight performance improvement.
(4) Ablation experiments. This section examines the effects of the GSConv, CARAFE, and SimCSPSPPF modules and the addition of a small object detection layer on the model performance, and conducts corresponding experiments on the “CPLID” dataset. The corresponding experimental results are illustrated in Table 5. G-YOLO is the original model with the GSConv module. C-YOLO represents the model with only the CARAFE module. GC-YOLO denotes the model with the GSConv and CARAFE modules, and GCS-YOLO means the model with the GSConv, CARAFE, and SimCSPSPPF modules.
As can be learned from Table 5, the mAP values of G-YOLO, C-YOLO, GC-YOLO, GCS-YOLO, and Insu-YOLO are higher than that of the baseline model YOLOv8n, reaching 94.4%, 94.2%, 94.7%, 94.9%, and 95.9%, respectively. These improved models have increased the average precision for defect detection by 0.68%, 0.34%, 1.35%, 1.69%, and 3.95%, respectively. As for detecting insulators, the average precision of these models is maintained at around 99.5%. For G-YOLO, the adoption of the GSConv block improves feature extraction capability to a certain extent. Compared with an ordinary convolutional module, the GSConv module is able to enhance model accuracy while reducing model complexity, where memory usage and computation are reduced to 5.7 MB and 7.6 GFLOPs, respectively. The experimental results show that G-YOLO achieves a 0.63% improvement in F1 score, a 10.2% improvement in detection speed, an 8.1% reduction in memory usage, and a 6.2% decrease in the number of floating-point operations (GFLOPs). C-YOLO replaces the original upsampling in the neck network with a CARAFE structure, which has a larger receptive field and can better utilize the semantic information in the feature map, thus performing upsampling more efficiently. Although there is only a relatively weak improvement in the mean average precision of the model, its lightweight nature further enhances the detection speed, by 14.4% compared to the original YOLOv8n. Combining the advantages of the GSConv and CARAFE modules, GC-YOLO shows a significant improvement in the average precision of defect detection compared to G-YOLO and C-YOLO. However, due to the increasing number of network layers in GC-YOLO, its inference time has greatly increased, resulting in an 18.6% decrease in its detection speed compared to the YOLOv8n baseline model. GCS-YOLO uses the SimCSPSPPF module instead of the SPPF module. As for the results, the introduction of the SimCSPSPPF module in GCS-YOLO increases its memory usage and floating-point operations (GFLOPs) by 48.4% and 14.8% compared with YOLOv8n, respectively, while reducing the detection speed by 21.2%. Nonetheless, GCS-YOLO still shows some improvement in detection performance, with a 1.69% increase in average precision for defect detection and a 0.94% increase in F1 score. Finally, Insu-YOLO adds an additional object detection layer based on the foundation of GCS-YOLO. The results indicate that fusing features from the first three C2f modules in the backbone network significantly improves the detection performance for tiny targets. Compared to the original YOLOv8n model, there is a 3.95% increase in average precision for defect detection, and a 1.47% improvement in F1 score. However, this improvement also comes with certain costs, as the introduction of an additional object detection layer leads to a deeper network and increased detection time. In particular, Insu-YOLO has a 70.4% increase in floating-point operations (GFLOPs) and a 26.3% decrease in detection speed. Despite this, Insu-YOLO is able to reach 87 frames/s in detection speed, which still satisfies the needs for timely detection.
The loss curves of bounding box regression during training for the different models can be seen in Figure 7. Models with different improvements show faster loss reduction in the early stage of training than the YOLOv8n baseline model. At the end of training, the loss value of Insu-YOLO is lower than that of other models, which indicates that the introduction of the GSConv, CARAFE, and SimCSPSPPF modules can optimize the feature extraction capability. In addition, the additional object detection layer can effectively enhance the ability to identify tiny defects, thereby improving detection performance.
In order to compare the attention regions of various models in detecting targets, this paper utilizes the gradient-weighted class activation mapping (Grad-CAM) technique [30] to generate heatmaps based on the feature maps of the eighth layer of the network, which corresponds to the fourth C2f module of the backbone network. The comparison of the feature heatmaps generated by the different models on the test images is shown in Figure 8. As shown in the pictures, in the second and third rows, the region of interest of the YOLOv8n and GCS-YOLO models is only focused on a small part when detecting the front and back insulators, respectively. The attention regions of G-YOLO and GC-YOLO are relatively scattered, with some regions focusing on power transmission towers and other background information. The attention regions of the C-YOLO and our proposed Insu-YOLO models can relatively completely cover the entire insulator target. Compared to C-YOLO, the attention regions of Insu-YOLO are more complete, resulting in a higher detection accuracy. As seen from the images in the last row, when detecting defects, the attention regions of the YOLOv8n, G-YOLO, and GCS-YOLO models are relatively scattered, including some irrelevant information. Although the area of interest of the C-YOLO and GC-YOLO models can cover the defect locations relatively well, there is a portion of attention regions of the C-YOLO model that contain the back insulator, while the attention regions of the G-YOLO model include the entire string of the insulator in front. In contrast, Insu-YOLO can focus more intensively on the defect parts, resulting in higher recognition accuracy.
According to the results above, Insu-YOLO is able to focus more accurately and completely on the positions of insulators and defects than other models, thereby facilitating better feature extraction. Compared with the YOLOv8n baseline model, Insu-YOLO can achieve an F1 score of 0.969, an mAP value of 95.9%, and an inspection speed of 87 frames/s, demonstrating its excellent performance in insulator defect detection tasks.

5. Conclusions

To further improve the detection accuracy of insulator defects in power tower inspection images, this paper proposes an Insu-YOLO model for tiny-defect detection based on the latest YOLOv8n model. By introducing the GSConv module into the backbone and neck networks, the model is able to improve the detection accuracy while reducing model complexity. Moreover, by replacing the original upsampling in the neck network with a more lightweight content-aware reassembly of features (CARAFE) block, the model is able to fully utilize the contextual information in feature maps and perform content-based upsampling, thereby enhancing the ability to fuse features for insulator defects. The original SPPF module is also replaced with the SimCSPSPPF module to optimize the representational capability. Finally, to improve the detection performance on small targets, an additional object detection layer is added to further enhance the fusion of shallow and deep feature maps. The experimental results validate the outstanding performance of Insu-YOLO. Specifically, Insu-YOLO reaches 95.9% on mAP and 0.969 on F1 score using only 9.2 MB of memory. Additionally, it achieves a detection speed of 87 frames/s, which satisfies the real-time detection requirements for insulator defects. In future research, it is necessary to further enhance the accuracy in detecting tiny defects while optimizing the detection speed, which is of great significance and application prospects for unmanned aerial vehicle power inspection tasks.

Author Contributions

Conceptualization, Y.C. and H.L.; methodology, H.L.; software, Y.C.; validation, Y.C., H.L. and J.C.; formal analysis, Y.C.; investigation, Y.C.; resources, H.L.; data curation, J.C.; writing—original draft preparation, Y.C.; writing—review and editing, Y.C. and H.L.; visualization, J.C.; supervision, J.H. and E.Z. All authors have read and agreed to the published version of the manuscript.

Funding

This research received no funding.

Data Availability Statement

Dataset link: https://github.com/InsulatorData/InsulatorDataSet, accessed on 19 November 2018.

Conflicts of Interest

The authors declare no conflict of interest.

References

  1. Lv, W.; Xu, S.; Zhao, Y.; Wang, G.; Wei, J.; Cui, C.; Du, Y.; Dang, Q.; Liu, Y. Detrs beat yolos on real-time object detection. arXiv 2023, arXiv:2304.08069. [Google Scholar]
  2. Zhang, H.; Li, F.; Liu, S.; Zhang, L.; Su, H.; Zhu, J.; Ni, L.M.; Shum, H.Y. Dino: Detr with improved denoising anchor boxes for end-to-end object detection. arXiv 2022, arXiv:2203.03605. [Google Scholar]
  3. Li, F.; Zhang, H.; Liu, S.; Guo, J.; Ni, L.M.; Zhang, L. Dn-detr: Accelerate detr training by introducing query denoising. In Proceedings of the IEEE/CVF Conference on Computer Vision and Pattern Recognition, New Orleans, LA, USA, 18–24 June 2022; pp. 13619–13627. [Google Scholar]
  4. Liu, S.; Li, F.; Zhang, H.; Yang, X.; Qi, X.; Su, H.; Zhu, J.; Zhang, L. Dab-detr: Dynamic anchor boxes are better queries for detr. arXiv 2022, arXiv:2201.12329. [Google Scholar]
  5. Lu, W.; Zhou, Z.; Ruan, X.; Yan, Z.; Cui, G. Insulator Detection Method Based on Improved Faster R-CNN with Aerial Images. In Proceedings of the 2021 2nd International Symposium on Computer Engineering and Intelligent Communications (ISCEIC), Nanjing, China, 6–8 August 2021; IEEE: Piscataway, NJ, USA, 2021; pp. 417–420. [Google Scholar]
  6. Zhao, W.; Xu, M.; Cheng, X.; Zhao, Z. An insulator in transmission lines recognition and fault detection model based on improved faster RCNN. IEEE Trans. Instrum. Meas. 2021, 70, 1–8. [Google Scholar] [CrossRef]
  7. Zhou, M.; Wang, J.; Li, B. ARG-Mask RCNN: An Infrared Insulator Fault-Detection Network Based on Improved Mask RCNN. Sensors 2022, 22, 4720. [Google Scholar] [CrossRef] [PubMed]
  8. Yang, Z.; Xu, Z.; Wang, Y. Bidirection-Fusion-YOLOv3: An Improved Method for Insulator Defect Detection Using UAV Image. IEEE Trans. Instrum. Meas. 2022, 71, 1–8. [Google Scholar] [CrossRef]
  9. Hao, K.; Chen, G.; Zhao, L.; Li, Z.; Liu, Y.; Wang, C. An insulator defect detection model in aerial images based on Multiscale Feature Pyramid Network. IEEE Trans. Instrum. Meas. 2022, 71, 1–12. [Google Scholar] [CrossRef]
  10. Xu, S.; Deng, J.; Huang, Y.; Ling, L.; Han, T. Research on Insulator Defect Detection Based on an Improved MobilenetV1-YOLOv4. Entropy 2022, 24, 1588. [Google Scholar] [CrossRef] [PubMed]
  11. Guo, Z.; Wang, C.; Yang, G.; Huang, Z.; Li, G. Msft-yolo: Improved yolov5 based on transformer for detecting defects of steel surface. Sensors 2022, 22, 3467. [Google Scholar] [CrossRef] [PubMed]
  12. Han, G.; Yuan, Q.; Zhao, F.; Wang, R.; Zhao, L.; Li, S.; He, M.; Yang, S.; Qin, L. An Improved Algorithm for Insulator and Defect Detection Based on YOLOv4. Electronics 2023, 12, 933. [Google Scholar] [CrossRef]
  13. Wang, C.Y.; Liao, H.Y.M.; Wu, Y.H.; Chen, P.Y.; Hsieh, J.W.; Yeh, I.H. CSPNet: A new backbone that can enhance learning capability of CNN. In Proceedings of the IEEE/CVF Conference on Computer Vision and Pattern Recognition Workshops, Seattle, WA, USA, 14–19 June 2020; pp. 390–391. [Google Scholar]
  14. Wang, C.Y.; Bochkovskiy, A.; Liao, H.Y.M. YOLOv7: Trainable bag-of-freebies sets new state-of-the-art for real-time object detectors. In Proceedings of the IEEE/CVF Conference on Computer Vision and Pattern Recognition, Vancouver, BC, Canada, 18–22 June 2023; pp. 7464–7475. [Google Scholar]
  15. He, K.; Zhang, X.; Ren, S.; Sun, J. Deep residual learning for image recognition. In Proceedings of the IEEE Conference on Computer Vision and Pattern Recognition, Las Vegas, NV, USA, 27–30 June 2016; pp. 770–778. [Google Scholar]
  16. Dosovitskiy, A.; Beyer, L.; Kolesnikov, A.; Weissenborn, D.; Zhai, X.; Unterthiner, T.; Dehghani, M.; Minderer, M.; Heigold, G.; Gelly, S.; et al. An image is worth 16 × 16 words: Transformers for image recognition at scale. arXiv 2020, arXiv:2010.11929. [Google Scholar]
  17. Chollet, F. Xception: Deep learning with depthwise separable convolutions. In Proceedings of the IEEE Conference on Computer Vision and Pattern Recognition, Honolulu, HI, USA, 21–26 July 2017; pp. 1251–1258. [Google Scholar]
  18. Howard, A.G.; Zhu, M.; Chen, B.; Kalenichenko, D.; Wang, W.; Weyand, T.; Andreetto, M.; Adam, H. Mobilenets: Efficient convolutional neural networks for mobile vision applications. arXiv 2017, arXiv:1704.04861. [Google Scholar]
  19. Sandler, M.; Howard, A.; Zhu, M.; Zhmoginov, A.; Chen, L.C. Mobilenetv2: Inverted residuals and linear bottlenecks. In Proceedings of the IEEE Conference on Computer Vision and Pattern Recognition, Salt Lake City, UT, USA, 18–23 June 2018; pp. 4510–4520. [Google Scholar]
  20. Howard, A.; Sandler, M.; Chu, G.; Chen, L.C.; Chen, B.; Tan, M.; Wang, W.; Zhu, Y.; Pang, R.; Vasudevan, V.; et al. Searching for mobilenetv3. In Proceedings of the IEEE/CVF International Conference on Computer Vision, Seoul, Republic of Korea, 27 October–2 November 2019; pp. 1314–1324. [Google Scholar]
  21. Zhang, X.; Zhou, X.; Lin, M.; Sun, J. Shufflenet: An extremely efficient convolutional neural network for mobile devices. In Proceedings of the IEEE Conference on Computer Vision and Pattern Recognition, Salt Lake City, UT, USA, 18–23 June 2018; pp. 6848–6856. [Google Scholar]
  22. Ma, N.; Zhang, X.; Zheng, H.T.; Sun, J. Shufflenet v2: Practical guidelines for efficient cnn architecture design. In Proceedings of the European Conference on Computer Vision (ECCV), Munich, Germany, 8–14 September 2018; pp. 116–131. [Google Scholar]
  23. Li, H.; Li, J.; Wei, H.; Liu, Z.; Zhan, Z.; Ren, Q. Slim-neck by GSConv: A better design paradigm of detector architectures for autonomous vehicles. arXiv 2022, arXiv:2206.02424. [Google Scholar]
  24. Wang, J.; Chen, K.; Xu, R.; Liu, Z.; Loy, C.C.; Lin, D. Carafe: Content-aware reassembly of features. In Proceedings of the IEEE/CVF International Conference on Computer Vision, Seoul, Republic of Korea, 27 October–2 November 2019; pp. 3007–3016. [Google Scholar]
  25. Li, C.; Li, L.; Geng, Y.; Jiang, H.; Cheng, M.; Zhang, B.; Ke, Z.; Xu, X.; Chu, X. YOLOv6 v3. 0: A Full-Scale Reloading. arXiv 2023, arXiv:2301.05586. [Google Scholar]
  26. Gevorgyan, Z. SIoU loss: More powerful learning for bounding box regression. arXiv 2022, arXiv:2205.12740. [Google Scholar]
  27. Tao, X.; Zhang, D.; Wang, Z.; Liu, X.; Zhang, H.; Xu, D. Detection of Power Line Insulator Defects Using Aerial Images Analyzed With Convolutional Neural Networks. IEEE Trans. Syst. Man Cybern. Syst. 2018, 50, 1486–1498. [Google Scholar] [CrossRef]
  28. Vieira-e Silva, A.L.; Chaves, T.; Felix, H.; Macêdo, D.; Simões, F.; Gama-Neto, M.; Teichrieb, V.; Zanchettin, C. Unifying Public Datasets for Insulator Detection and Fault Classification in Electrical Power Lines. 2020. Available online: https://github.com/heitorcfelix/public-insulator-datasets (accessed on 7 February 2020).
  29. Zheng, J.; Wu, H.; Zhang, H.; Wang, Z.; Xu, W. Insulator-Defect Detection Algorithm Based on Improved YOLOv7. Sensors 2022, 22, 8801. [Google Scholar] [CrossRef] [PubMed]
  30. Selvaraju, R.R.; Cogswell, M.; Das, A.; Vedantam, R.; Parikh, D.; Batra, D. Grad-cam: Visual explanations from deep networks via gradient-based localization. In Proceedings of the IEEE International Conference on Computer Vision, Venice, Italy, 22–29 October 2017; pp. 618–626. [Google Scholar]
Figure 1. Insulator disc defect in insulator string.
Electronics 12 03210 g001
Figure 2. The structure of basic YOLOv8.
Electronics 12 03210 g002
Figure 3. The structure of the C2f module. T/F in the bottleneck module indicates whether the shortcut is used or not. T denotes true and F denotes false.
Electronics 12 03210 g003
Figure 4. The structure of the GSConv module. The Conv2d_BN_SiLU module includes a 2D convolutional layer, a batch normalization (BN) layer, and an activation function SiLU. The DWConv module refers to the depth-wise separable convolution.
Electronics 12 03210 g004
Figure 5. The structure of Insu-YOLO.
Electronics 12 03210 g005
Figure 6. Sample images of the CPLID and IDID datasets. Images of insulator defects are contained in both datasets. There are some insulator images with complex backgrounds and small area of defects in CPLID dataset, as shown in figure (a,b). There are some insulator images with obvious defects in IDID dataset, as shown in figure (c,d).
Electronics 12 03210 g006
Figure 7. Loss curves of bounding box regression during training for different models.
Electronics 12 03210 g007
Figure 8. Comparison of the feature heatmaps of various models at the eighth layer of the network. The first row (ag) shows the original images. The second row (hm) shows the heatmaps when detecting the front insulator. The third row (ns) shows the heatmaps when detecting the back insulator. The last row (ty) shows the heatmaps when detecting insulator defects. From the performance of the heatmaps, Insu-YOLO, compared to the previous models, allows the receptive fields of the model to be further expanded and has more aggregated features due to the introduction of GSConv and the upsampling module Content-Aware ReAssembly of FEatures (CARAFE), as shown in figure (m,s). For small-target defect detection, Insu-YOLO allows the fine-grained features of small-target defect detection to be enhanced by using a multi-scale approach. It is obvious to figure out from the comparison graphs in the fourth row that the attention region in figure (y) becomes more concentrated.
Electronics 12 03210 g008
Table 1. Division of the “CPLID” and “IDID” datasets.
DatasetTotal NumberTraining SetValidation SetTesting SetImage Size
CPLID28762329259288 1152 × 864
IDID28002268252280 4928 × 3264
Table 2. Detailed hyperparameters used in the experiment.
ItemValue
Input Size 640 × 640
Training Epochs200
Batch Size16
OptimizerSGD
Initial Learning Rate0.01
Momentum0.937
Weight Decay × 10 4
Fraction of Hue Augmentation0.015
Fraction of Saturation Augmentation0.7
Fraction of Value Augmentation0.4
Probability of Image Flip Up–Down0
Probability of Image Flip Left–Right0.5
Probability of Image Mosaic1.0
Probability of Image Mixup0
Table 3. Comparison of detection performance of various models on the CPLID and IDID datasets.
MethodCPLIDIDID
AP (Def.)AP (Ins.)mAPFPSMemory (MB)PRmAPF1FPS
RT-DETR [1]90.498.894.63266.191.087.991.00.89417
YOLOv3t88.295.491.8859.281.378.285.30.79766
YOLOv5n87.599.593.51035.292.694.397.40.93154
YOLOv6n [25]88.597.793.1948.683.282.488.40.82839
YOLOv7t [14]88.198.593.36512.383.889.784.30.86641
YOLOv8n88.799.594.11186.293.893.997.50.93951
BF-YOLO [8]89.094.091.511------
ID-YOLO [9]92.199.195.663227-----
YOLOv7 [29]-----94.993.493.80.94095
Insu-YOLO92.299.595.9879.297.696.799.10.97143
Def. denotes insulator defects. Ins. denotes insulator string. The letter “t” in YOLOv3t denotes “tiny”, while the letter “n” in YOLOv5n represents “nano”, and so on. F1 denotes F1-Score.
Table 4. Comparison of detection performance on the COCO dataset.
Model#Param.FLOPSFPSAP test (%)AP val (%)
YOLOXs9.0 M26.8 G10240.540.5
PPYOLOEs7.9 M17.4 G20843.142.7
YOLOv5n1.9 M4.5 G159-28.0
YOLOv5s7.2 M16.5 G156-37.4
YOLOv7n6.2 M13.8 G28638.738.7
YOLOv8n3.2 M8.7 G-37.3-
YOLOv8s11.2 M28.6 G--44.9
Ours6.4 M13.8 G17439.539.1
Table 5. Comparison of detection performance of models under different improvements.
GSCARAFESimDet.AP/%F1mAP/%FPSMemoryGFLOPs
LayerDef.Ins.(MB)
××××88.799.30.95594.01186.28.1
×××89.399.50.96194.41305.77.6
×××89.099.50.95994.21356.58.6
××89.999.50.96294.7965.98.0
×90.299.50.96494.9937.29.3
92.299.50.96995.9879.213.8
GS denotes the GSConv block. Sim denotes the SimCSPSPPF block. Det. Layer denotes the additional detection layer. Def. denotes insulator defects. Ins. denotes insulator strings.
Disclaimer/Publisher’s Note: The statements, opinions and data contained in all publications are solely those of the individual author(s) and contributor(s) and not of MDPI and/or the editor(s). MDPI and/or the editor(s) disclaim responsibility for any injury to people or property resulting from any ideas, methods, instructions or products referred to in the content.

