Article

Proton Radiation Effects of CMOS Image Sensors on Different Star Map Recognition Algorithms for Star Sensors

1
Xinjiang Technical Institute of Physics and Chemistry, Chinese Academy of Sciences, Urumqi 830011, China
2
Xinjiang Key Laboratory of Electronic Information Material and Device, Urumqi 830011, China
3
University of Chinese Academy of Sciences, Beijing 100049, China
*
Authors to whom correspondence should be addressed.
Electronics 2023, 12(7), 1629; https://doi.org/10.3390/electronics12071629
Submission received: 20 February 2023 / Revised: 27 March 2023 / Accepted: 29 March 2023 / Published: 30 March 2023
(This article belongs to the Special Issue Radiation Effects of Advanced Electronic Devices and Circuits)

Abstract

:
Star sensors are widely used by satellites for their precise pointing accuracy. However, protons in space will cause cumulative effects and single-event transients in the imaging systems of star sensors. These effects will affect the success rate of star map recognition of star sensors. In this paper, proton irradiation experiments and field tests were carried out in turn, and three typical star recognition algorithms were used to recognize the star maps. The results showed that cumulative effects led to a decrease in the number of identifiable stars, which greatly affected the recognition success rate of the grid algorithm. Hot pixels caused by displacement damage effects increased the star centroid positioning error, leading to a decrease in the recognition success rate of the triangle algorithm and pyramid algorithm. Single-event transients produced by protons hitting the image sensor are similar to the grayscale value and shape of a star, and were recognized as “false stars”, which had a significant impact on the success rate of the three recognition algorithms. In general, the pyramid algorithm was more effective than the other two algorithms in identifying the affected star map, and the recognition success rate of the grid algorithm was significantly reduced.

1. Introduction

A star sensor is an optical measurement device that takes stars as observation targets and outputs the attitude information of its measurement coordinate system in the inertial coordinate system, and it is the most accurate attitude sensor at present [1,2]. The imaging system is an important component of a star sensor, and it determines the stellar detection sensitivity and attitude measurement accuracy of the star sensor. Since complementary metal oxide semiconductor image sensors (CMOS image sensors) have the advantages of high integration and low power consumption, most star sensors use CMOS image sensors as imaging devices [3,4,5]. However, CMOS image sensors in star sensors are subject to cumulative effects and single-event transients by the widespread presence of protons in space. The cumulative effects cause the degradation of image sensor parameters such as dark current, uniformity, and full well capacity [6,7,8]. Moreover, protons can cause bulk defects inside the image sensor, resulting in hot pixels in the image. As the radiation fluence increases, the detection performance and accuracy of the star sensor decrease [9]. Single-event transients produced by protons hitting CMOS image sensors appear as clusters in an image. Some of the clusters are similar to the grayscale value and shapes of stars, resulting in “false stars” in the field of view of the star sensor. The star sensor in JASON-1 can only be temporarily turned off when it is disturbed by transient clusters, and the satellite uses a gyroscope for attitude positioning [10,11].
Star map recognition is the matching of stars in the current field of view of the star sensor with reference stars in the existing star catalogue, being an important prerequisite for the accurate determination of the space attitude of the spacecraft. At present, the most widely used star map recognition algorithms can be divided into sub-graph isomorphism recognition algorithms and pattern recognition algorithms [12]. After years of development, star map recognition algorithms have greatly improved in terms of recognition accuracy and speed. However, the improvement in and research on these star map recognition algorithms are based on ideal conditions. Proton irradiation in space will degrade the performance of the image sensor and affect the recognition success rate. This will affect the output of high-precision attitude information from the star sensor. The specific impact mechanism of proton irradiation on different star map recognition algorithms has not yet been studied.
In this paper, we researched the mechanism of the cumulative effects and single-event transients caused by proton irradiation of CMOS image sensors on the star map recognition algorithm. The paper first introduces the test details and star map recognition algorithms used in this paper, then analyzes the effects of proton irradiation on the star map recognition algorithm of a star sensor such as reducing the identifiable number of stars due to the degradation of device performance caused by cumulative effects, star centroid positioning error increase by hot pixels, and “false stars” caused by single-event transients. This paper provides theoretical support for the improvement in star map recognition algorithms for long-term on-orbit star sensors.

2. Test and Algorithms

2.1. Test Details

The CMOS image sensor used in the experiment is a global exposure image sensor produced by CMOSIS; the number of pixels is 2048 × 2048, and the pixel size is 5.5 μm × 5.5 μm. Proton irradiation experiments were divided into the cumulative radiation test and single-event effects test. Cumulative irradiation test was carried out at Peking University. This test was an offline test, and the energy of proton irradiation was 3 MeV. Three image sensors were subjected to irradiation fluences of 3.68 × 10⁹ p/cm2, 1.47 × 10¹⁰ p/cm2, and 3.6 × 10¹⁰ p/cm2, separately. The single-event effects test was carried out at the Northwest Institute of Nuclear Technology, and the energy of proton irradiation was 60 MeV. This test was an online test, the image sensor was kept working during the irradiation, and 10-bit RAW format images containing transient bright clusters were obtained from the image sensor driver board to the computer through the cameralink cable. The characteristics of single-event transient bright clusters were extracted and analyzed after the test. After all the irradiation experiments were completed, the field test was carried out at the Lijiang Observatory. Three CMOS image sensors with different irradiation fluences and one unirradiated CMOS image sensor were installed into the star sensor test system in turn. The integration time of the CMOS image sensor was adjusted to 95.6 ms after the calibration of the principal point and focal length of the test system in the laboratory, and the platform was kept stable while pictures were taken of the Orion sky area.

2.2. Star Map Recognition Algorithms

The star map recognition algorithm relies on accurate locations of stars in a star map, but the star map captured by CMOS image sensor also contain noise besides stars, and thus the star map needs to be filtered to obtain identifiable stars through threshold segmentation. In this paper, a low pass filter was used, and the threshold segmentation value was the average grayscale value of the star map plus three times the standard deviation of the grayscale value. The classic star map recognition algorithms, including the triangle algorithm, pyramid algorithm, and grid algorithm, were used to complete the star map recognition. Although many new recognition algorithms have been proposed since these algorithms were first introduced, most of the new recognition algorithms were improved on the basis of these algorithms. Therefore, it is very meaningful to use these three algorithms as research objects. Among them, the triangle algorithm and the pyramid algorithm belong to the sub-graph isomorphism algorithms, and the grid algorithm is a pattern recognition algorithm.
The triangle recognition algorithm works by creating triangles out of three stars from the star map, and utilizing the diagonal distances between these stars as matching features [13]. The identification process involves filtering the star catalogue based on the star sensor’s limit magnitude, then calculating the cosine value of the diagonal distance between each pair of filtered stars; the calculation formula is shown in Equation (1). Finally, a star pair information catalogue is constructed, which includes the numbers of the two stars and the cosine value of the angle between them.
θ T h e = V A · V B = ( cos δ A · cos α A cos δ A sin α A sin δ A ) · ( cos δ B · cos α B cos δ B sin α B sin δ B )
In Equation (1), θ T h e indicates the cosine of the theoretical diagonal distances between star A and B in the star catalog; V A and V B represent the direction vectors of stars A and B in the celestial coordinate system; and ( α A , δ A ) and ( α B , δ B ) signify the right ascension and declination of stars A and B, respectively. Equation (2) determines the diagonal distance of the triangle in the star map structure.
θ Mea = V α · V β = [ x α x 0 y α y 0 f ] / r α · [ x β x 0 y β y 0 f ] / r β r i = ( x i x 0 ) 2 + ( y i y 0 ) 2 + f 2 , i = α   or   β  
In Equation (2), θ Mea represents the cosine of the measured diagonal distance between stars α and β in the star map. The direction vectors of stars α and β in the star sensor coordinate system are denoted as V α and V β , respectively. ( x α , y α ) and ( x β , y β ) represent the coordinate positions of stars α and β in the star map, respectively. The principal point of the star sensor is represented by ( x 0 , y 0 ), and the focal length of the star sensor is represented by f . The matching process is depicted in Figure 1a. If stars i, j, and k can be found from a star pair information catalogue such that their relationships with stars α, β, and γ in the star map satisfy Equation (3), and the result is unique, then the matching process is considered successful.
{ | θ ij t θ α β m | ε | θ ik t θ α γ m | ε | θ jk t θ β γ m | ε
In Equation (3), θ ij t , θ ik t , and θ jk t represent the cosine of the theoretical diagonal distance between stars i, j, and k in the star catalog, and θ α β m , θ α γ m , and θ β γ m   represent the cosine of the measured diagonal distance between stars α , β ,   and   γ   in the star map. The value of ε represents the threshold for the allowable error. Based on the previous algorithm, the pyramid algorithm has been enhanced by employing a pyramid structure for matching that involves using four stars. Compared with the triangle algorithm, this algorithm not only determines three more sets of diagonal distances during recognition but also verifies the previous recognition results when identifying new stars. The pyramid algorithm schematic is shown in Figure 1b [14].
The grid algorithm is different from the above-mentioned types of algorithms. The main idea of this algorithm is to select a star in the field of view as the reference star S1, and use “R” as the radius to determine the influence range, finding the nearest star as the closest-neighbor star S2. Then, a coordinate system with the connection line between star S1 and S2 serving as the positive x-axis is established and a grid network is constructed to project all the stars within the influence range into this grid, with the grid with stars recorded as 1 and the grid without stars recorded as 0. Following this, the pattern vector of the reference star is constructed in order. It is matched with the navigation star pattern vector constructed by stars in the star catalog, and the navigation star with the greatest consistency is the star. A schematic diagram of the grid algorithm is shown in Figure 1c [12,15].
Since these recognition algorithms usually only output the final recognition results, in order to explore the reasons for the decrease in the success rate of star map recognition caused by proton irradiation, these three algorithms were modified in this paper. In addition to outputting the final recognition results, the matching results between all the star pairs also outputted. For example, after identifying three stars, the original triangle algorithm will remove these three stars from the identification queue and replace other unidentified stars for recognition. The algorithm used in this paper keeps these three stars in the identification queue, allowing other unrecognized stars to be matched with them until the matching results of all triangular structures are outputted.
Three kinds of recognition algorithms were used to recognize the star map taken by the unirradiated CMOS image sensor, and the parameters of the star map recognition algorithm were optimized under the condition of considering the recognition success rate and recognition speed. The allowable error ε for the triangle algorithm and the pyramid algorithm was set to 0.000025, of the grid algorithm was set to 50 × 50, and the influence radius set to 1200 pixels. These three identification algorithms can correctly identify the eight stars in the star map. The star map recognition results are shown in Figure 2. The numbers in the figure correspond to the numbers of the stars in SAO Star Catalog (Smithsonian Astrophysical Observatory Star Catalog). The same parameters were used to identify and analyze star maps taken by the CMOS image sensors with different irradiation fluences and star maps taken by unirradiated CMOS image sensors with the addition of single-event transient clusters.

3. Results

Figure 3a,b show respectively images of the Orion’s Belt captured by star sensor test systems with unirradiated CMOS image sensor and irradiated with a fluence of 1.47 × 10¹⁰ p/cm2. The nonuniformity of the image taken by the irradiated CMOS image sensor was significantly greater compared to that of the unirradiated CMOS image sensor. Figure 3c,d show 3D point maps constructed from star maps that have been processed with low-pass filtering. The star map acquired by the unirradiated CMOS image sensor was smooth, except for the stars’ region, while the star map taken by the CMOS image sensor with an irradiation fluence of 1.47 × 10¹⁰ p/cm2 still had many spikes, even after the filtering process.
The above three algorithms were used to identify star maps captured by the CMOS image sensors with different irradiation fluences. It was observed that as the irradiation fluence increased, the threshold segmentation value used in the pre-processing of star maps gradually increased and the number of stars entering the identification procedure decreased. This means that the final number of stars that could eventually be correctly identified decreased. When proton irradiation fluences were 3.68 × 10⁹ p/cm2, 1.47 × 10¹⁰ p/cm2, and 3.6 × 10¹⁰ p/cm2, the numbers of stars identified were six, four, and three, respectively. Moreover, the three recognition algorithms had different success rates. When the irradiation fluence was 1.47 × 10¹⁰ p/cm2, the grid algorithm was no longer able to output the correct recognition result. When the proton irradiance was 3.6 × 10¹⁰ p/cm2, the pyramid algorithm was unable to output a result because it requires a number of identifiable star points greater than four. The outputs of each triangular and pyramidal structure were compared with the correct SAO catalog number for each star; when the proton irradiation fluence was 1.47 × 10¹⁰ p/cm2, some of these two structures outputted the wrong results.
An image containing single-event transient bright clusters captured by the CMOS image sensor is shown in Figure 4a. The shapes and gray values of these transient bright clusters appeared to be similar to stars, as can be seen in the figure. The average value of the gray value of each position of the 3 × 3 window centered on the maximum value was calculated. They were taken as the gray values of the single-event transient clusters in the follow-up experiment. These clusters were randomly added to the star map detected by the unirradiated image sensor. The star map after the addition of the transient star clusters is shown in Figure 4b.
A single transient bright cluster is similar in size to a star in an image, and thus it is difficult for a small number of bright clusters to have a great impact on the threshold segmentation value of a star map. These transient clusters are recognized as identifiable stars along with true stars. As transient bright clusters are added at random locations in the map they may also overlap with real stars and affect the centroid positioning of stars. However, the probability of this being the case is low, and the corresponding treatment is now available [16]; therefore, this paper focused on the effect of transient bright clusters as identifiable stars in terms of the star map recognition algorithm.
Three identification algorithms were used to identify the star maps with transient clusters. For the triangle and pyramid algorithms, false results occurred as the number of transient clusters increased, but the pyramid algorithm had a higher recognition success rate than the triangle algorithm. After multiple recognitions, it was found that the triangle algorithm was very sensitive to the order of stars and transient clusters entering the identification queue. When the transient bright clusters were at the end of the recognition queue, the recognition success rate was higher than at the head. For the grid algorithm, both the number of transient bright clusters and their position in the star map caused the program to output different error results. The effects of cumulative radiation damage and single-event transients on different star map identification algorithms are summarized in Table 1.

4. Discussion

As the proton irradiation fluence increases, the oxide trap charge, interface trap charge and bulk defects in CMOS image sensors increase. The oxide trap charge is mainly distributed in the shallow trench isolation (STI) region and gate oxide region, while the interface trap charge is mainly distributed at the Si-SiO2 interface. These charges will increase the dark current of the image sensor, resulting in an increase in the background gray value in star maps. Bulk defects caused by displacement damage effects can generate new energy levels [17]. Some defect levels act as generation–recombination centers, thereby increasing the dark signal value. Some pixels have a higher dark current value (hot pixels), resulting in bright spots that occupy one pixel in the image [18]. The difference in dark signals between different pixels will reduce pixel uniformity, resulting in an increase in the standard deviation of the star map. Since the threshold segmentation value used in the pre-processing is the average grayscale value of the star map plus three times the standard deviation, it increases as the irradiation fluences increase. Moreover, the decrease in quantum efficiency of the CMOS image sensor after proton irradiation can lead to a decrease in the grayscale value of star areas. If the grayscale value of a star is less than the segmentation threshold, the star will not be selected. This is the main reason for the decrease in identifiable star caused by proton irradiation.
The reduction in the number of identifiable stars only affects the final output count of stars for the triangle algorithm and pyramid algorithm, without generating any incorrect output results. When the proton irradiation fluence was 3.6 × 10¹⁰ p/cm2, there were only three identifiable stars in the star map, which did not meet the minimum requirement of the pyramid algorithm, so the pyramid algorithm did not output any results. The recognition success rate of the grid algorithm was affected by the pattern vectors built by the star map. The decrease in the number of identifiable stars will result in changes to the pattern vectors, which will affect the recognition success rate. If the nearest star S2 is not the one used to build the grid pattern database, it will result in errors in the rotation of the star map, generate completely wrong pattern vectors, and output incorrect recognition results.
The reason for the wrong identification results for some of the triangular and pyramidal structures at a proton irradiation fluence of 1.47 × 10¹⁰ p/cm2 was related to the hot pixels. In previous research, it was discovered that the noise caused by the total ionizing dose effect can lead to an increase in star centroid positioning error through the diagonal distance relationship between star pairs [19]. However, the hot pixels generated by the displacement damage can have a greater impact on the star centroid positioning accuracy. In the star maps taken by the CMOS image sensor with a proton irradiation fluence of 1.47 × 10¹⁰ p/cm2, the initial position of a star in relation to a hot pixel is depicted in Figure 5a. Here, the red box is the hot pixel, which is far away from the star and does not affect the accuracy of star centroid positioning; however, the position of the star in the star map was changed by the rotation of the Earth, and thus the hot pixel gradually came closer to the star (Figure 5b–d). The distribution of the grayscale value of the star was also changed.
Without the influence of hot pixels, the energy distribution of a star approximately obeys a two-dimensional Gaussian distribution, as shown in Equation (4).
I x , y = I 0 2 π σ P S F 2 e x p [ ( x x 0 ) 2 2 σ P S F 2 ] e x p [ ( y y 0 ) 2 2 σ P S F 2 ]
In Equation (4), I ( x , y ) represents the energy of the star whose center is ( x 0 , y 0 ) at ( x , y ), I 0 is the total energy of the star, and σ P S F is the Gaussian dispersion radius. The σ P S F   of this star sensor is 0.8. In order to prevent the saturation of the grayscale value of the center pixel of the star from affecting the centroid positioning, the exposure time of the image sensor was adjusted so that the center gray value of the lowest magnitude star was about 80% of the saturation gray value of the image sensor. This paper further analyzed the influence of a hot pixel on the centroid positioning of star from the different positional relationships and the grayscale value between a hot pixel and a star.
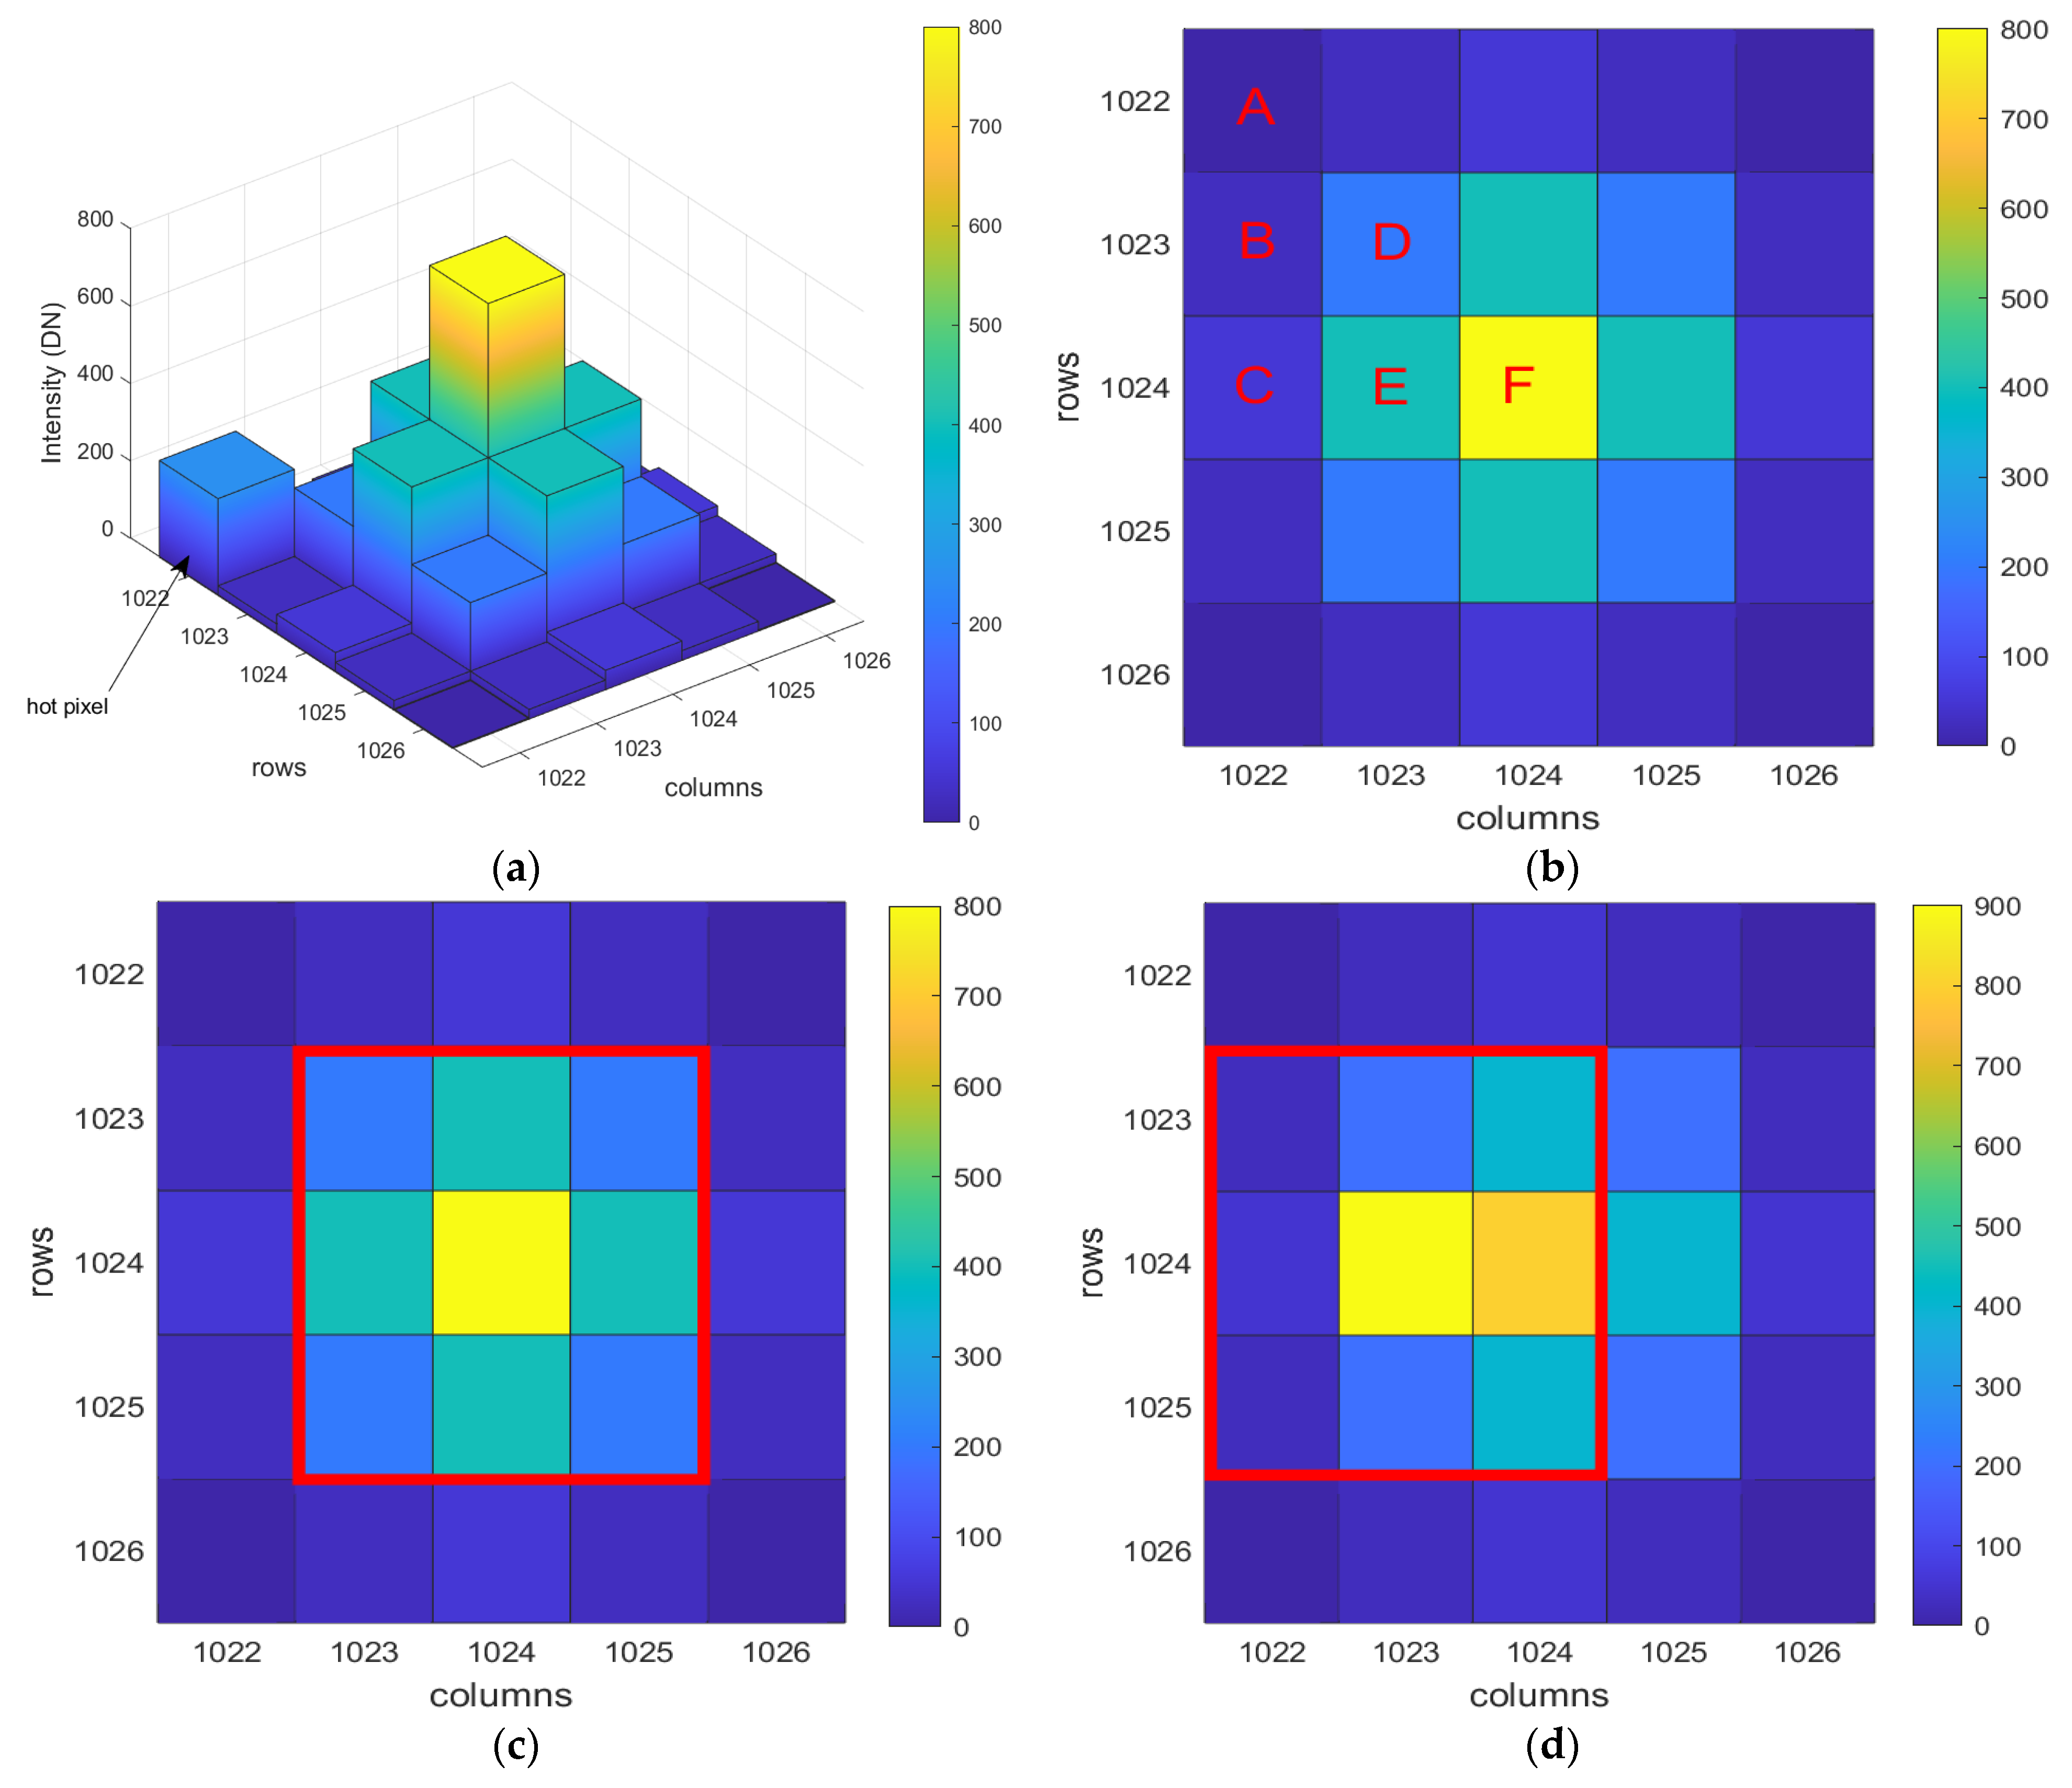
The grayscale value of each position within the 3 × 3 window of the star point is calculated according to Equation (4). 
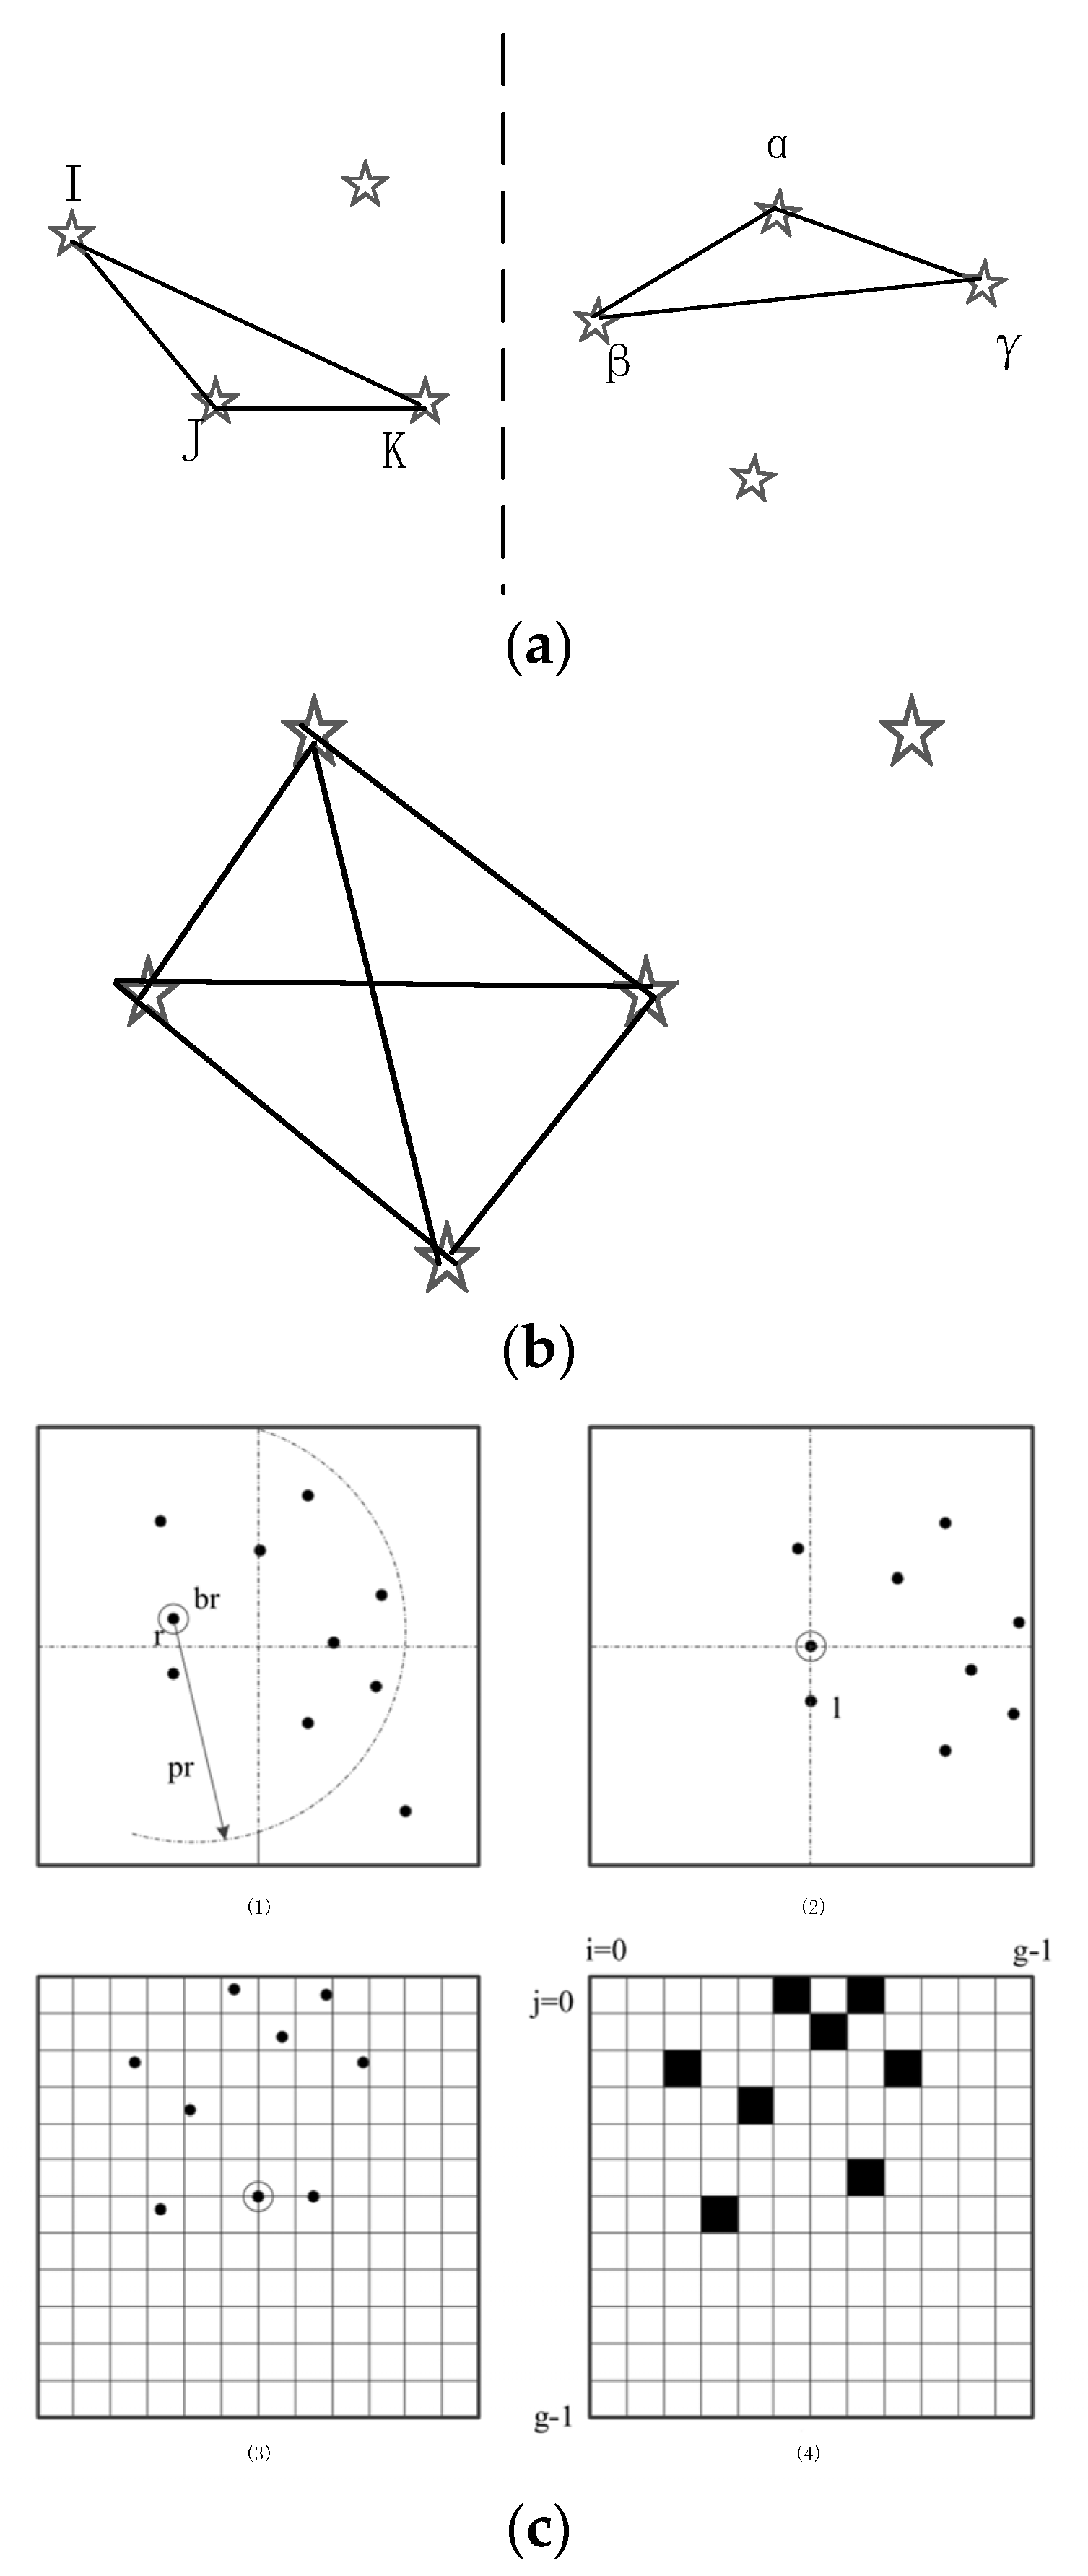
Figure 6a shows the model of the impact of a hot pixel on it. When obtaining the centroid position of a star in the image, it will first locate the pixel position with the largest grayscale value in the area; select a 3 × 3 window with it as the center; and then use different centroid positioning algorithms to extract the centroid coordinates of the star point as needed, such as the centroid algorithm, square centroid algorithm, Gaussian centroid algorithm, and other algorithms. Due to the different calculation methods of these centroid positioning algorithms, the different centroid positioning algorithms also lead to different centroid positioning errors of a star. Due to the different calculation methods of these centroid positioning algorithms, the resulting centroid positioning errors will also be different.
According to the symmetry of the distribution of the star grayscale value and the size of the centroid positioning window, there are six cases of the influence of the hot pixels on the distribution of the star, as shown in Figure 6b. Among them, the F case mainly changed the Gaussian dispersion radius. For the cases D and E where the hot pixel was within the original window, the change of the grayscale value in the window led to an error of the centroid positioning of the star. When the grayscale value of a hot pixel was lower than that at the center of the star, the centroid positioning window remains the same as shown in the red box in Figure 6c. However, if the grayscale value of the hot pixel was higher than that of the center of the star, the center of the positioning window shifted to the location of the hot pixel. This is shown in Figure 6d. For cases A, B, and C outside the window, centroid positioning error will occur only when the grayscale value of the hot pixel is higher than the grayscale value of the star center.
The centroid position ( x 1 , y 1 ) is calculated using different centroid positioning methods for the five cases, and the error of centroid positioning Δ x , y is calculated according to Equation (5). The result is shown in Figure 7.
Δ x , y = ( x 1 x 0 ) 2 + ( y 1 y 0 ) 2
It can be seen from Figure 7 that in the case of D and E, the error of centroid positioning increased with the increase in the grayscale value of the hot pixel. After the grayscale value of the hot pixel exceeded the grayscale value of the center of the star, the error of centroid positioning increased sharply due to the movement of the centroid positioning window, but in these cases, the centroid error calculated by the centroid positioning algorithm was within one pixel. In the case of A, B, and C, since the change of the grayscale value of the hot pixel did not affect the grayscale distribution of the star in the original window, only after the gray-scale value exceeds the grayscale value of the center of the star will the centroid positioning window move, and the error of centroid positioning occur. In these cases, the error of centroid positioning of the star was larger than one pixel, and the maximum error of centroid positioning calculated by the square centroid method exceeded 2.7 pixels. In all cases, the higher the grayscale value of the hot pixel and the farther the distance from the center of the star, the larger the error of centroid positioning; under the same influence conditions, the error of centroid positioning calculated by the Gaussian centroid algorithm is the smallest. Moreover, high-magnitude stars in the field of view have a lower grayscale value, and are more likely to be affected by hot pixels.
Taking the star Alnilam (SAO 132346) affected by a hot pixel in Figure 5 as an example, the right ascension and declination of another star Saiph in the field of view and this star were ( α A , δ A ) = (86.93914, −9.66968), ( α B , δ B ) = (84.05338, −1.20196), and the theoretical cosine value of the diagonal distance θ T h e between the two stars can be calculated by Equation (2).
θ T h e = ( 0.052638 0.984386 0.167968 ) · ( 0.103579 0.994399 0.020976 ) = 0.987849
The focal length of the star sensor test system was 24.048 mm, and the coordinates of the principal point obtained by calibration were ( x 0 , y 0 ) = (1093.379, 1207.317). The coordinates of these two stars in the map were calculated to be (1505.018, 1410.990), (915.000, 1066.081), and then the cosine value of measured diagonal distance θ Mea between the two stars was calculated by Equation (3).
θ Mea = ( 0.093631 0.046327   0.994528 ) · ( 0.040742 0.032258 0.998648 ) = 0.987876
The difference between the θ Mea and θ T h e was 0.000027, exceeding the allowable error (0.000025), and thus it is impossible for this pair of stars to be correctly identified in the formed triangle and pyramid structure. In the star map not affected by the hot pixel, the coordinates of the center of the two stars were (1504.98, 1411.015) and (914.153, 1066.941), respectively. The calculated value from them is 98,786,586. The difference between the theoretical cosine values was 0.0000168. Therefore, these two stars can be correctly identified in the pyramid and triangle structures. On the basis of the matching results of Alnilam and all other stars, the error of the cosine value of the diagonal distance between the two stars would increase as the cosine value of the two stars decreased. That is, when the two stars in the map are far away from each other, a small positioning error generated by a hot pixel will have a large effect on the cosine value of the diagonal distance of the two stars. For the grid algorithm, it is difficult for a star to move from its original grid to other grids due to a small centroid offset. Therefore, the centroid error caused by hot pixels will not significantly affect the recognition success rate of the grid algorithm. Although annealing can reduce proton radiation damage to image sensors [20], it is difficult to install annealing devices in star sensors. The local threshold segmentation algorithm can be used instead of global thresholding in the pre-processing. This is effective for stars with lower magnitudes. For centroid positioning error caused by hot pixels, the allowable error ε used in recognition can be slightly increased based on the need to consider the speed of the recognition algorithm.
Incoming particles generate electron–hole pairs in the sensitive silicon volume through direct or indirect ionization [21]. Direct ionization means that the proton excites and releases off-core electrons of the Si atom through Coulomb interaction with Si, directly generating electron–hole pairs. Indirect ionization means that the proton generates new charged secondary particles through nuclear reactions, and these secondary particles continue to generate electron–hole pairs through either direct or indirect ionization. Part of the charge generated by the proton incident is collected by the depletion region of the pixel unit during the integration stage of the image sensor [22]. Due to the difference in the potential of the region before and after the integration time, the grayscale value of the pixel changes. Some of the charge is also collected by other pixel cells through diffusion, appearing as bright clusters in the image. Unlike the stars on a star map which generally remains at the same position for several consecutive frames, the transient cluster is related to the incident position of the proton and only exists in one frame.
After analyzing the output of the triangle algorithm, it was found that in a triangular structure composed of a single-event transient cluster and stars or other transient clusters, if the calculated diagonal distance is within allowable error ε and the result is unique, it will lead to an incorrect recognition result. If the transient clusters are at the head of the identification queue, they will form a triangular structure with other stars and transient clusters in the recognition queue multiple times for recognition, leading to a higher probability of outputting incorrect recognition results. While the transient cluster is at the end of the recognition queue, the transient cluster has less influence on the result because the recognition has been completed between the stars in the star map. The recognition success rate of the pyramid algorithm is improved because it needs to judge three more sets of diagonal distances than the triangle algorithm, and this algorithm will introduce other stars to validate the recognition results. After analyzing the results of all pyramid structure outputs, it was found that if there is one transient cluster in the pyramid structure, the recognition result is usually not output because the condition of six sets of diagonal distance matching cannot be satisfied. However, incorrect matching results may be output in pyramid structures composed of multiple transient clusters, but these incorrect results will be discarded in the subsequent verification process, and a small number of transient clusters have no effect on the final recognition results. Transient clusters can cause the grid algorithm to output incorrect results in two ways. The first way is that transient clusters are incorrectly selected as the reference star S1 or closest-neighbor star S2, which will cause the star map to be incorrectly rotated and generate completely incorrect mode vectors. The second way is that even if both the reference star and closest-neighbor star are real stars, but there are transient clusters in some grids. It will also generate incorrect pattern vectors. The algorithm of increasing the judgment conditions to verify clusters multiple times is effective when there are few clusters. But the time consumed by this algorithm will significantly increase as the number of clusters increases. By utilizing the characteristic that transient clusters exist in only one frame at the same position in the image, it is possible to distinguish them from stars [23]. However, since this algorithm requires the collection of multiple sets of star maps, the posture output frequency may be reduced.

5. Conclusions

Star map recognition is a key step in the output of attitude information from a star sensor. However, the success rate of star map recognition is affected by proton radiation. In this study, we investigated the mechanism of the cumulative irradiation effect and single-event transients of protons on the image sensor on star map recognition. The results of the study showed that increased dark current and non-uniformity of CMOS image sensor pixels led to a decrease in the number of identifiable star points. The hot pixels generated by displacement damage increased the centroid positioning error of the star when it was near the star. Transient clusters were found to be similar to a star and they affected the success rate of the star map recognition as “false stars”.
For the triangle algorithm and the pyramid algorithm, the reduction in the number of stars to be recognized did not affect the recognition accuracy, but the increase in the centroid positioning error of the star points caused by hot pixels and the interference of “false stars” affected the recognition accuracy. For the grid algorithm, the decrease in the number of identifiable stars and the presence of “false stars” affected the mode vector constructed by the grid algorithm, resulting in a significant decrease in the identification success rate. The pyramid algorithm was found to have the highest stability among these three algorithms, and the grid algorithm was the worst.

Author Contributions

Conceptualization, J.F. and Y.C.; methodology, Y.C. and J.F.; software, Y.C.; validation, Y.C. and Y.L.; formal analysis, J.F.; investigation, J.F.; data curation, Y.C.; writing—original draft preparation, Y.C.; writing—review and editing, J.F.; visualization, Y.C.; supervision, Y.L.; project administration, L.W. and Q.G.; funding acquisition, J.F. and Y.L. All authors have read and agreed to the published version of the manuscript.

Funding

This research was funded by the National Natural Science Foundation of China under grant No. 12175307, the West Light Talent Training Plan of the Chinese Academy of Sciences under grant No. 2022-XBQNXZ-010, the Youth Science and Technology Talents Project of Xinjiang Uygur Autonomous Region No. 2022TSYCCX0094, and the Tianshan Innovation Team Program of Xinjiang Uygur Autonomous Region No. 2022D14003.

Institutional Review Board Statement

Not applicable.

Informed Consent Statement

Not applicable.

Data Availability Statement

Not applicable.

Conflicts of Interest

The authors declare no conflict of interest.

References

  1. He, L.; Ma, Y.; Zhao, R.; Hou, Y.; Zhu, Z. High update rate attitude measurement method of star sensors based on star point correction of rolling shutter exposure. Sensors 2021, 21, 5724. [Google Scholar] [CrossRef] [PubMed]
  2. Liebe, C.C. Star trackers for attitude determination. IEEE Aerosp. Electron. Syst. Mag. 1995, 10, 10–16. [Google Scholar] [CrossRef] [Green Version]
  3. Saint-Pe, O.; Tulet, M.; Davancens, R.; Larnaudie, F.; Magnan, P.; Martin-Gonthier, P.; Corbiere, F.; Belliot, P.; Estribeau, M. Research-grade CMOS image sensors for remote sensing applications. In Proceedings of the Sensors, Systems, and Next-Generation Satellites VIII, Canary Islands, Spain, 13–16 September 2004; Volume 5570, pp. 549–556. [Google Scholar]
  4. Sukhavasi, S.B.; Sukhavasi, S.B.; Elleithy, K.; Abuzneid, S.; Elleithy, A. CMOS image sensors in surveillance system applications. Sensors 2021, 21, 488. [Google Scholar] [CrossRef] [PubMed]
  5. Li, J.; Liu, J.; Li, X.; Liu, Y.; Hao, Z. CMOS APS imaging system application in star tracker. In Proceedings of the Advanced Materials and Devices for Sensing and Imaging II, Beijing, China, 8–11 November 2004; Volume 5633, pp. 536–542. [Google Scholar]
  6. Virmontois, C.; Toulemont, A.; Rolland, G.; Materne, A.; Lalucaa, V.; Goiffon, V.; Codreanu, C.; Durnez, C.; Bardoux, A. Radiation-induced dose and single event effects in digital CMOS image sensors. IEEE Trans. Nucl. Sci. 2014, 61, 3331–3340. [Google Scholar] [CrossRef] [Green Version]
  7. Virmontois, C.; Goiffon, V.; Corbière, F.; Magnan, P.; Girard, S.; Bardoux, A. Displacement damage effects in pinned photodiode CMOS image sensors. IEEE Trans. Nucl. Sci. 2014, 59, 2872–2877. [Google Scholar] [CrossRef]
  8. Rizzolo, S.; Goiffon, V.; Estribeau, M.; Paillet, P.; Marcandella, C.; Durnez, C.; Magnan, P. Total-ionizing dose effects on charge transfer efficiency and image lag in pinned photodiode CMOS image sensors. IEEE Trans. Nucl. Sci. 2017, 65, 84–91. [Google Scholar] [CrossRef]
  9. Fu, J.; Feng, J.; Li, Y.D.; Wen, L.; Zhou, D.; Guo, Q. Effect of proton beam irradiation on the tracking efficiency of CMOS image sensors. Radiat. Eff. Defects Solids 2022, 177, 590–603. [Google Scholar] [CrossRef]
  10. Ecoffet, R. Overview of in-orbit radiation induced spacecraft anomalies. IEEE Trans. Nucl. Sci. 2013, 60, 1791–1815. [Google Scholar] [CrossRef]
  11. Minec-Dube, J.; Jacob, P.; Guillon, D.; Temperanza, D. Protons robustness improvement for the SED 26 star tracker. In Proceedings of the Guidance, Navigation and Control Systems, Loutraki, Greece, 17–20 October 2005; Volume 606. [Google Scholar]
  12. Li, J.; Wei, X.; Wang, G.; Zhou, S. Improved grid algorithm based on star pair pattern and two-dimensional angular distances for full-sky star identification. IEEE Access 2013, 8, 1010–1020. [Google Scholar] [CrossRef]
  13. Liebe, C.C. Pattern recognition of star constellations for spacecraft applications. IEEE Aerosp. Electron. Syst. Mag. 1993, 8, 31–39. [Google Scholar] [CrossRef] [Green Version]
  14. Mortari, D. Search-less algorithm for star pattern recognition. J. Astronaut. Sci. 1993, 45, 179–194. [Google Scholar] [CrossRef]
  15. Padgett, C.; Kreutz-Delgado, K. A grid algorithm for autonomous star identification. IEEE Trans. Aerosp. Electron. Syst. 1997, 33, 202–213. [Google Scholar] [CrossRef]
  16. Mingqian, L.; Hong, T.; Kaili, L. An On-orbit Correction Method for Star Sensor Under Single Event Effect Based on PSF Reference Model. Semicond. Optoelectron. 2022, 43, 986–991. [Google Scholar]
  17. Le Roch, A.; Virmontois, C.; Goiffon, V.; Tauziède, L.; Belloir, J.M.; Durnez, C.; Magnan, P. Radiation-induced defects in 8T-CMOS global shutter image sensor for space applications. IEEE Trans. Nucl. Sci. 2018, 65, 1645–1653. [Google Scholar] [CrossRef] [Green Version]
  18. Virmontois, C.; Goiffon, V.; Magnan, P.; Girard, S.; Saint-Pe, O.; Petit, S.; Rolland, G.; Bardoux, A. Similarities between proton and neutron induced dark current distribution in CMOS image sensors. IEEE Trans. Nucl. Sci. 2012, 59, 927–936. [Google Scholar] [CrossRef]
  19. Feng, J.; Wang, H.C.; Cui, Y.H.; Li, Y.D.; Guo, Q.; Wen, L.; Fu, J. Effects of gamma radiation on the performance of star sensors for star map recognition. Radiat. Phys. Chem. 2018, 203, 110607. [Google Scholar] [CrossRef]
  20. Virmontois, C.; Goiffon, V.; Magnan, P.; Girard, S.; Inguimbert, C.; Petit, S.; Rolland, G.; Saint-Pé, O. Displacement damage effects due to neutron and proton irradiations on CMOS image sensors manufactured in deep submicron technology. IEEE Trans. Nucl. Sci. 2010, 57, 3101–3108. [Google Scholar] [CrossRef] [Green Version]
  21. Goiffon, V. Radiation Effects on CMOS Active Pixel Image Sensors. In Ionizing Radiation Effects in Electronics; CRC Press: Boca Raton, FL, USA, 2015; pp. 295–332. [Google Scholar]
  22. Beaumel, M.; Hervé, D.; van Aken, D.; Pourrouquet, P.; Poizat, M. Proton, electron, and heavy ion single event effects on the HAS2 CMOS image sensor. IEEE Trans. Nucl. Sci. 2014, 61, 1909–1917. [Google Scholar] [CrossRef]
  23. Blarre, L.; Piot, D.; Jacob, P.; Minec, J.; Piriou, V.; Ouaknine, J. SED16 Autonomous Star Sensor Product Line in Flight Results, New Developments and Improvements in Progress. In Proceedings of the AIAA Guidance, Navigation, and Control Conference and Exhibit, San Francisco, CA, USA, 15–18 August 2005; pp. 2005–5930. [Google Scholar]
Figure 1. Schematic diagram of several different star map recognition algorithms. (a) Diagram of the triangulation algorithm. (b) Diagram of the pyramid algorithm. (c) Diagram of the grid algorithm.
Electronics 12 01629 g001
Figure 2. Recognition result of the star map taken by the non-irradiated CMOS image sensor. The numbers in the picture are the serial numbers of these stars in the SAO Star Catalog. In the zoomed version, DN (Digital Number) is the unit of gray value.
Electronics 12 01629 g002
Figure 3. Star maps containing Orion’s Belt and 3D point maps. (a) Star map captured with unirradiated CMOS image sensor; (b) star map captured with CMOS image sensor irradiated with a fluence of 1.47 × 10¹⁰ p/cm2. (c) 3D point map constructed from low-pass filtered unirradiated image; (d) 3D point map constructed from low-pass filtered irradiated image.
Electronics 12 01629 g003
Figure 4. Image containing single-event transient clusters. (a) Part of an image collected online during a proton irradiation experiment. (b) Part of a star map with single-event transient clusters. The real stars are shown in the red circle and the transient cluster is shown in the blue box.
Electronics 12 01629 g004
Figure 5. Different positional relationships of the hot pixel and the star: (a) the hot pixel is far away from the star; (bd) the distance between the hot pixel and the center of the star is gradually approaching.
Electronics 12 01629 g005
Figure 6. Schematic diagram of star gray value distribution and positioning window: (a) star gray value distribution; (b) six situations that affect star centroid positioning; (c) original centroid positioning window; (d) centroid positioning window shift.
Electronics 12 01629 g006
Figure 7. The error of centroid positioning calculated by using different centroid positioning methods.
Electronics 12 01629 g007
Table 1. The effect of proton irradiation on the success rate of different star map recognition algorithms.
Star Map Recognition AlgorithmCumulative Radiation DamageSingle-Event Transient
Triangle algorithmThe algorithm’s recognition success rate is almost unaffected but the number of stars outputted by the algorithm decreased as the irradiation fluence increased. When the number of identifiable stars was less than four, the pyramid algorithm cannot output a recognition result.The recognition success rate decreased and the success rate may be related to the position of transient clusters in the recognition queue.
Pyramid algorithmCompared to other algorithms, the recognition success rate was the highest.
Grid algorithmThe decrease in the number of identifiable stars led to a decrease in the recognition success rate.The recognition success rate decreased the most severely and the erroneous output results may be related to the position of the transient clusters in the star map.
Disclaimer/Publisher’s Note: The statements, opinions and data contained in all publications are solely those of the individual author(s) and contributor(s) and not of MDPI and/or the editor(s). MDPI and/or the editor(s) disclaim responsibility for any injury to people or property resulting from any ideas, methods, instructions or products referred to in the content.

