Article

Investigation of Lithium-Ion Battery Negative Pulsed Charging Strategy Using Non-Dominated Sorting Genetic Algorithm II

School of Electrical and Electronic Engineering, Changchun University of Technology, Changchun 130012, China
*
Author to whom correspondence should be addressed.
Electronics 2024, 13(11), 2178; https://doi.org/10.3390/electronics13112178
Submission received: 13 May 2024 / Revised: 27 May 2024 / Accepted: 27 May 2024 / Published: 3 June 2024

Abstract

:
To address the critical issue of polarization during lithium-ion battery charging and its adverse impact on battery capacity and lifespan, this research employs a comprehensive strategy that considers the charging duration, efficiency, and temperature increase. Central to this approach is the proposal of a novel negative pulsed charging technique optimized using the Non-Dominated Sorting Genetic Algorithm II (NSGA-II). This study initiates the creation of an intricate electrothermal coupling model, which simulates variations in internal battery parameters throughout the charging cycle. Subsequently, NSGA-II is implemented in MATLAB to fine-tune pulsed charging and discharging profiles, generating a Pareto front showcasing an array of optimal solutions tailored to a spectrum of goals. Leveraging the capabilities of the COMSOL Multiphysics software 6.2 platform, a high-fidelity simulation environment for lithium-ion battery charging is established that incorporates three charging strategies: constant-current (CC) charging, a multi-stage constant-current (MS-CC) charging protocol, and a pulsed-current (PC) charging strategy. This setup works as a powerful instrument for assessing the individual effects of these strategies on battery characteristics. The simulation results strongly support the superiority of the proposed pulsed-current charging strategy, which excels in increasing the battery temperature and amplifying battery charge capacity. This dual achievement not only bolsters charging efficiency significantly but also underscores the strategy’s potential to augment both the practical utility and long-term viability of lithium-ion batteries, thereby contributing to the advancement of sustainable energy storage solutions.

1. Introduction

Due to their high energy density, long cycle life, low self-haul rate, and environmental friendliness, lithium-ion batteries are extensively used in both pure electric and hybrid electric vehicles [1,2]. Nonetheless, several challenges arise in their practical application. First, the charging time is prolonged, and excessive charging currents may induce thermal runaways, leading to battery explosions and the generation of harmful gases, posing a significant threat to human life [3]. Consequently, exploring appropriate charging methods and strategies for lithium-ion batteries has become imperative. Among the various charging strategies, the constant-current/constant-voltage (CC/CV) battery-charging method, multi-stage constant-current (MS-CC) charging protocol, and pulsed-current (PC) charging strategy are the most common [4]. Due to its simplicity, versatility, and controllability, the CC/CV charging strategy is currently used in electric vehicles. However, in practical scenarios, the charging rate must decrease if a short charging time is frequently encountered. This, in turn, exacerbates issues such as elevated battery and component temperatures, abbreviated cycle life, low standard lithium evolution, and an increased risk of high thermal runaway. Furthermore, the CV phase of the CC/CV charging mode can be protracted [5,6]. A multi-stage, constant-current charging method has been proposed to circumvent these issues. This method aims to prevent overcharging and prolonged charging times, which may result from constant-current and constant-voltage charging methods. Duan et al. introduced a DMCC charging strategy that reduced the charging time by 10.46% compared to the conventional 0.5 CC/CV charging strategy [7]. Zhao et al. developed a battery thermal management system utilizing the NSGA-II algorithm to demonstrate the superiority of this algorithm within thermal management systems [8]. Tian et al. established an electrothermal aging coupling model, and by comparing the multi-stage charging strategies under the multi-objective moth burning algorithm (NSMFO) and the multi-objective genetic algorithm (NSGA-II), they discovered that the NSGA-II exhibited superior operating efficiency. Moreover, compared to traditional constant-current charging methods, this charging strategy, implemented under the same charging time, could decrease battery health degradation and temperature escalation [9].
In practical scenarios, pulsed-current (PC) charging strategies are primarily categorized into positive-pulsed with intermittent time, positive- and negative-pulsed with intermittent time, and positive- and negative-pulsed with variable current strategies [10]. The pulsed-current (PC) charging strategy can compensate for the shortcomings of the constant-current and constant-voltage charging methods, resulting in a more balanced internal polarization reaction of the battery, and enhancing the cycle performance of all-solid-state lithium batteries [11]. Compared to traditional constant-current (CC) charging, pulsed charging with brief pauses or discharges can improve the charging acceptance ability of lithium batteries by eliminating the polarization voltage, inhibiting the growth of lithium dendrites, slowing battery aging, accelerating the charging speed, and so on [12]. Chen et al. developed a bidirectional, pulsed charging strategy for rapidly charging lithium batteries. They compared it with traditional constant-current charging to investigate its influence on rapid charging at low temperatures [13]. Aryanfar et al. simulated the growth of lithium dendrites using pulsed charging experiments and Monte Carlo calculations and demonstrated that pulsed charging can effectively inhibit the growth of lithium dendrites [14]. Through experimental comparison, Acosta et al. discovered that the performance of traditional lithium-ion batteries was substantially influenced by the operating mode. The implementation of pulsed charging could enhance the capacity of a specific battery [15]. Ou et al. designed an entirely digitally controlled fast charger for lithium-ion batteries utilizing the Motorola charging method to achieve rapid charging functionality. The experimental charging time was less than 40 min, the charging temperature rise was less than 1.1 °C, and the charging efficiency reached 87.51% [16].
The aforementioned research and analysis elaborate on the merits of the NSGA-II algorithm in the context of charging strategy, delineating the pros and cons of the pulsed-current (PC) charging strategy, as well as the effects of varying charging currents, pulse durations, and intermittent intervals on lithium batteries. Nonetheless, the genetic algorithm remains unintegrated with the pulsed-current charging strategy, precluding the selection of an appropriate charging ratio based on diverse charging objectives. This study presents an innovative negative pulsed charging technique, which is formulated based on the NSGA-II. By developing an electric-thermal coupling model, we successfully identified various internal parameters associated with the battery. Furthermore, we constructed a multi-objective optimization function that encompasses charging time, charging efficiency, and battery temperature increase. The NSGA-II algorithm is employed to determine the optimal charging and discharging currents, resulting in Pareto optimal frontiers that cater to diverse objectives. Finally, a comprehensive analysis and comparison of the merits and drawbacks of the proposed charging method and CC and MS-CC charging strategies are provided.
The remainder of this article is organized as follows: In the Section 1, an overview of the subject’s context and importance is provided. The subsequent section establishes an electrothermal coupling model for lithium-ion batteries. The combination of the algorithm and negative pulsed-current (PC) charging strategy occurs in the third segment. The Section 4 presents the optimization outcomes and accompanying discussion. A comparison between the negative pulsed charging strategy and the original method is presented in the Section 5. Finally, the article is summarized in the Section 6.

2. Electrothermal Coupling Model

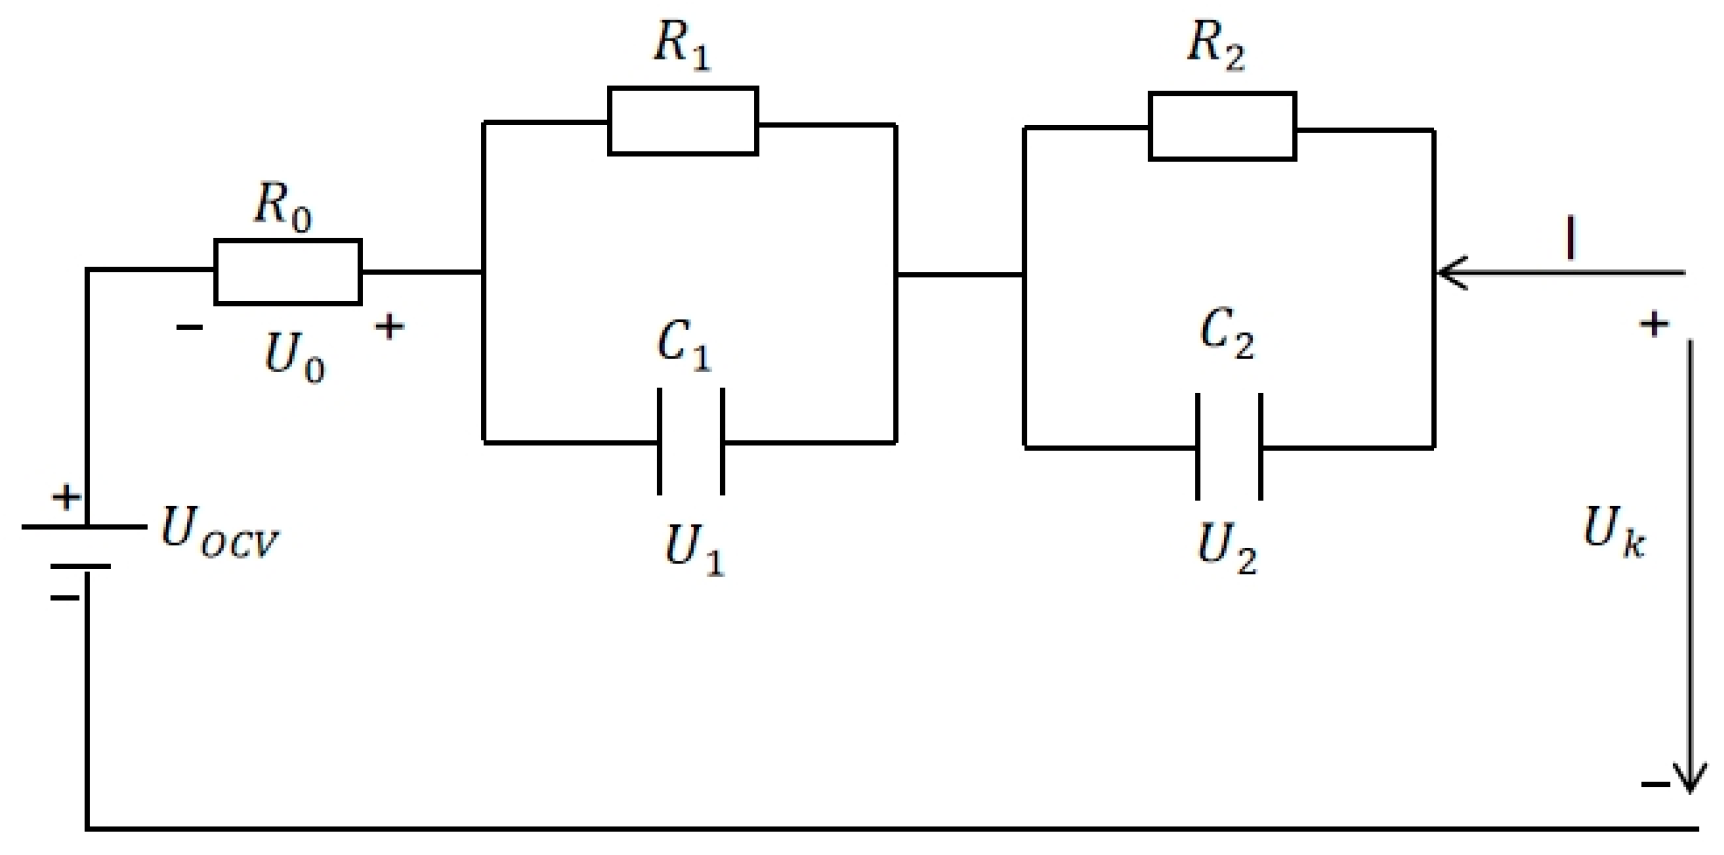
2.1. Electrical Model

In this paper, the second-order RC equivalent circuit model was selected to model the lithium-ion battery, as shown in Figure 1. In the figure, U o c v is the open-circuit voltage of the battery; the open-circuit voltage is defined as the voltage of the battery without the action of an external current; and U k is the battery terminal voltage. When the battery is working, due to the different formation mechanisms, the internal resistance of the battery is divided into ohmic internal resistance and polarization internal resistance. R 0 is the ohm internal resistance of the battery, indicating the resistance of ions during movement, U 0 is the voltage at both ends of the ohm capacitance, and I is the current flowing through the equivalent circuit. The internal resistance of the polarization is divided into electrochemical resistance and concentration resistance. R 1 is the internal resistance of the electrochemical polarization, C 1 is the electrochemical polarization capacitance of the battery, R 2 is the internal resistance of the concentration polarization capacitance, C 2 is the electrochemical polarization capacitance of the battery, U 1 is the voltage at both ends of the electrochemical polarization capacitance of the battery, U 2 is the voltage at both ends of the battery concentration polarization capacitor, and the polarization process is used to describe the phenomenon of the transfer, storage, and loss of the internal charge of the battery in the electrolyte during the charging and discharging process of the battery [17].
The pulsed-current charging strategy can shorten the charging time and improve the charging efficiency by enhancing the charging ratio. Moreover, pulsed charging can cause the internal polarization process of lithium-ion batteries to develop more evenly and maintain the balance of the internal electrochemical reaction, which has many advantages [18,19]. This paper uses the positive and negative pulsed charging modes as the charging strategy. A waveform diagram of the charging current is shown in Figure 2.
According to the second-order RC circuit model and pulsed charging characteristics, the parameter relationship can be expressed by the following formula: R ( t ) indicates the resistance that varies with the charging process; I c indicates the charging current; I d indicates the discharging current; t c indicates the charging time; t d indicates the discharging time; and S O C ( t ) indicates the actual state of charge of the lithium-ion battery, which varies with the charging and discharging time.
U 0 = R 0 I
I = U 1 R 1 + C 1 d U 1 d t
I = U 2 R 2 + C 2 d U 2 d t
The voltage relationship under the charge and discharge states is expressed as:
U k = U o c v + I c ( R 0 ( t c ) + R 1 ( t c ) + R 2 ( t c ) ) I d ( R 0 ( t d ) + R 1 ( t d ) + R 2 ( t d ) )
The battery charge status can be expressed as:
S O C ( t ) = S O C ( t 0 ) + S O C ( t c ) S O C ( t d )
S O C ( t ) = S O C ( t 0 ) + I c × t c I d × t d C n × η ( t )
The following formula can express the charging efficiency η ( t ) :
η ( t ) = t 0 t I U o c v d t t 0 t I U k d t × 100 %
U O C V , R 0 , R 1 , R 2 , C 1 , and C 2 are the internal parameters that can reflect the operating characteristics of lithium-ion batteries. Moreover, the battery parameters, including SOC and temperature, should be identified before the battery model simulation. The battery model employed in this study is the INR18650-20R, which possesses a rated capacity of 2000 mAh and a charging cut-off voltage of 4.2 V. Initially, a lithium-ion battery charging and discharging experiment was conducted using a 0.5C rate current. The battery was charged from 10% to the cut-off voltage, with the cell being left to stand for 1 h at every 10% state of charge (SOC). For the fitting curves under both charging and discharging experiments, the SOC open-circuit voltage (OCV) fitting curve of the lithium-ion battery was derived by averaging the two sets of curves, as illustrated in Figure 3. It can be discerned from the figure that there is a tight linear correlation between the SOC and OCV.
Hybrid pulse power characterization (HPPC) can trigger the dynamic response of the battery by pulsed discharge, and the internal parameters of the battery can be identified by fitting the rebound curve. First, a pulsed discharge is applied to the battery at a 1C rate, followed by another pulsed discharge after allowing it to stand. This process is repeated until the power of the lithium-ion battery is reduced to just 10%. The terminal voltage change curve is presented in Figure 4. The significant decrease in terminal voltage during discharge is attributed to the internal ohmic resistance of the battery, while the gradual increase in voltage is due to the internal resistance of polarization within the battery. Identification was carried out at every 10% state of charge (SOC) based on the voltage rebound curve, with experiments conducted at various ambient temperatures (0 °C, 10 °C, 20 °C, 30 °C, and 40 °C). The identification results for R 0 , R 1 , R 2 , C 1 , and C 2 can be obtained, as depicted in Figure 5.
The aforementioned paragraph presents a comprehensive overview of the second-order RC electrophysical model for lithium-ion batteries. As illustrated in Figure 5, a conspicuous trend can be observed, indicating that as the ambient temperature decreases, the internal ohmic resistance, electrochemical internal resistance, and concentration polarization internal resistance of lithium-ion batteries increase. This, in turn, signifies that as the temperature decreases, the resistance of the battery-charging process increases, thereby causing a significant reduction in charging efficiency. Notably, a sharp increase in the internal resistance of the battery occurs when the state of charge reaches 10%.
As the ambient temperature increases, the internal reaction rate of lithium-ion batteries correspondingly accelerates, leading to an increase in the diffusion rate of lithium ions. This, in turn, results in a gradual increase in both the electrochemical polarization capacitance and concentration polarization capacitance within the battery. When the charge reaches 50%, the electrochemical polarization capacitance reaches its maximum value, indicating that the electrochemical reaction occurring within the lithium battery is the most intense.

2.2. Thermal Model

The lithium battery will generate heat during the working process, and the root cause of the battery heating problem is the mismatch between heat, heat transfer, and heat dissipation during the use of the battery, resulting in some energy loss. It is necessary to establish a thermal model of the battery in the process of charging and discharging. The heat production of batteries can be divided into reversible heat, irreversible heat, heat exchange power, phase-change heat, and mixed heat. Reversible heat refers to the heat production caused by an entropy change in the chemical reaction of lithium-ion deintercalation of positive and negative electrodes and intercalation. Irreversible heat refers to the heat generated by the current flowing through the internal resistance of polarization and ohmic resistance during the charging process of a lithium battery. Heat exchange power refers to the amount of heat transferred between the battery and the ambient temperature [20,21]. After analysis, the heat production Q 0 formula is as follows:
Q 0 = Q j + Q r
The amount of Joule heat generated by the internal resistance during the charging of lithium batteries Q j can be expressed as:
Q j = I c ( U k U o c v ) + I d ( U k U o c v )
The internal reversible heat during the charging of the lithium battery Q r can be expressed as:
Q r = I c T U o c v T I d T U o c v T
where U o c v T is the entropy heat coefficient of the battery.
The following formula can express the heat exchange Q s between the battery and the external environment:
Q s = h A ( T T a )
where h is the battery heat transfer coefficient, A is the battery surface area, T is the battery temperature, and T a is the external environment temperature. The following formula calculates the total heat change of the battery:
Q = Q 0 Q s = C h M d T d t
w h e r e   M is the battery mass and C h is the specific heat capacity of the battery. In the literature [22], natural and mixed cooling methods were used to measure the specific heat capacity of 18,650 cylindrical lithium batteries. Combined with the characteristics of the current charging strategy, the final thermal model formula is shown, as follows:
T ( t + 1 ) = T ( t ) + I 1 ( U k U o c v ) + I 2 ( U k U o c v ) + I 1 T U o c v T I 2 T U o c v T h A ( T ( t ) T a ) C h M

3. Negative Pulsed-Current Charging Strategy Based on NSGA-II

3.1. Optimization Targets

During the optimization of battery charging, the evaluation metrics include the charging time, charging efficiency, and temperature increase, which determine the rationality of the battery charging strategy. A higher charging current can enhance the charging speed, shorten the charging time, and improve the charging efficiency; however, it also increases the battery temperature. This increase in temperature triggers irreversible electrochemical reactions within the battery, accelerating its aging process and compromising its service life. These evaluation indices are interdependent; therefore, this paper employs a multi-objective optimization approach that incorporates genetic algorithms to address this issue and subsequently determines the corresponding charging strategy based on distinct objective functions.
This paper adopts the pulsed-current charging strategy and assumes that the total number of charging stages is I c = [ I 1 , I 2 , I 3 , I 4 I M ]. The discharging current sequence is I d = [ I 1 , I 2 , I 3 , I 4 I M ]. The charging time sequence is t c = [ t 1 , t 2 , t 3 , t 4 t M ]. The discharging time sequence is t d = [ t 1 , t 2 , t 3 , t 4 t M ]. The battery charging time objective function is shown below:
J t = c = 1 M t c + d = 1 M t d
Improving the battery charging speed and shortening the charging time are the primary problems to be solved for lithium battery charging, so the charging time objective function is set, and the minimum value is obtained. While reducing the charging time, it is also necessary to improve the charging efficiency to maximize the energy utilization rate. The charging efficiency’s objective function formula is referred to as Formula (7).
In the process of charging and discharging lithium-ion batteries, heat output will lead to a rise in battery temperature, and too high of a temperature will affect battery life and damage the internal structure of the battery. Therefore, in the process of charging, the heat production of the lithium battery should be reduced as much as possible so that the lithium battery can work in a suitable temperature environment to obtain the temperature increase calculation, Formula (13).

3.2. Constraint

Before finding a suitable charging strategy for the battery through the algorithm, we need to apply real-time constraints on several variables of the lithium battery, including aspects such as the charge current magnitude, discharge current magnitude, and charge-to-discharge ratio, which are set within the range of 0.5–3c. Additionally, the impulse response time and discharge pulsed response time are considered. The battery’s state of charge transitions from 10% SOC to 100% SOC, and the battery terminal voltage corresponds to the minimum voltage and cut-off voltage required for normal operation. Considering the ambient temperature of the experimental conditions and the maximum temperature increase that does not damage the internal structure of the battery, the range is set at 20–60 °C. Furthermore, it is crucial to ensure a charging efficiency of over 90% for the battery, as depicted in Table 1.

3.3. Optimization Algorithm

In this paper, the charging time, charging efficiency, and rise in the battery temperature of lithium batteries are used as the objective functions of the charging strategy, and the three objective functions are mutually restricted, so it is impossible to optimize a single objective function. Therefore, it is necessary to introduce a multi-objective optimization method. This paper uses the NSGA-II algorithm to solve the multi-objective optimization problem, considering that there are many objectives and that the mutual constraints are complex. The specific flow of the algorithm is shown in Figure 6.
According to the specific analysis in Figure 6, the particular solving process of the charging current calculation is as follows:
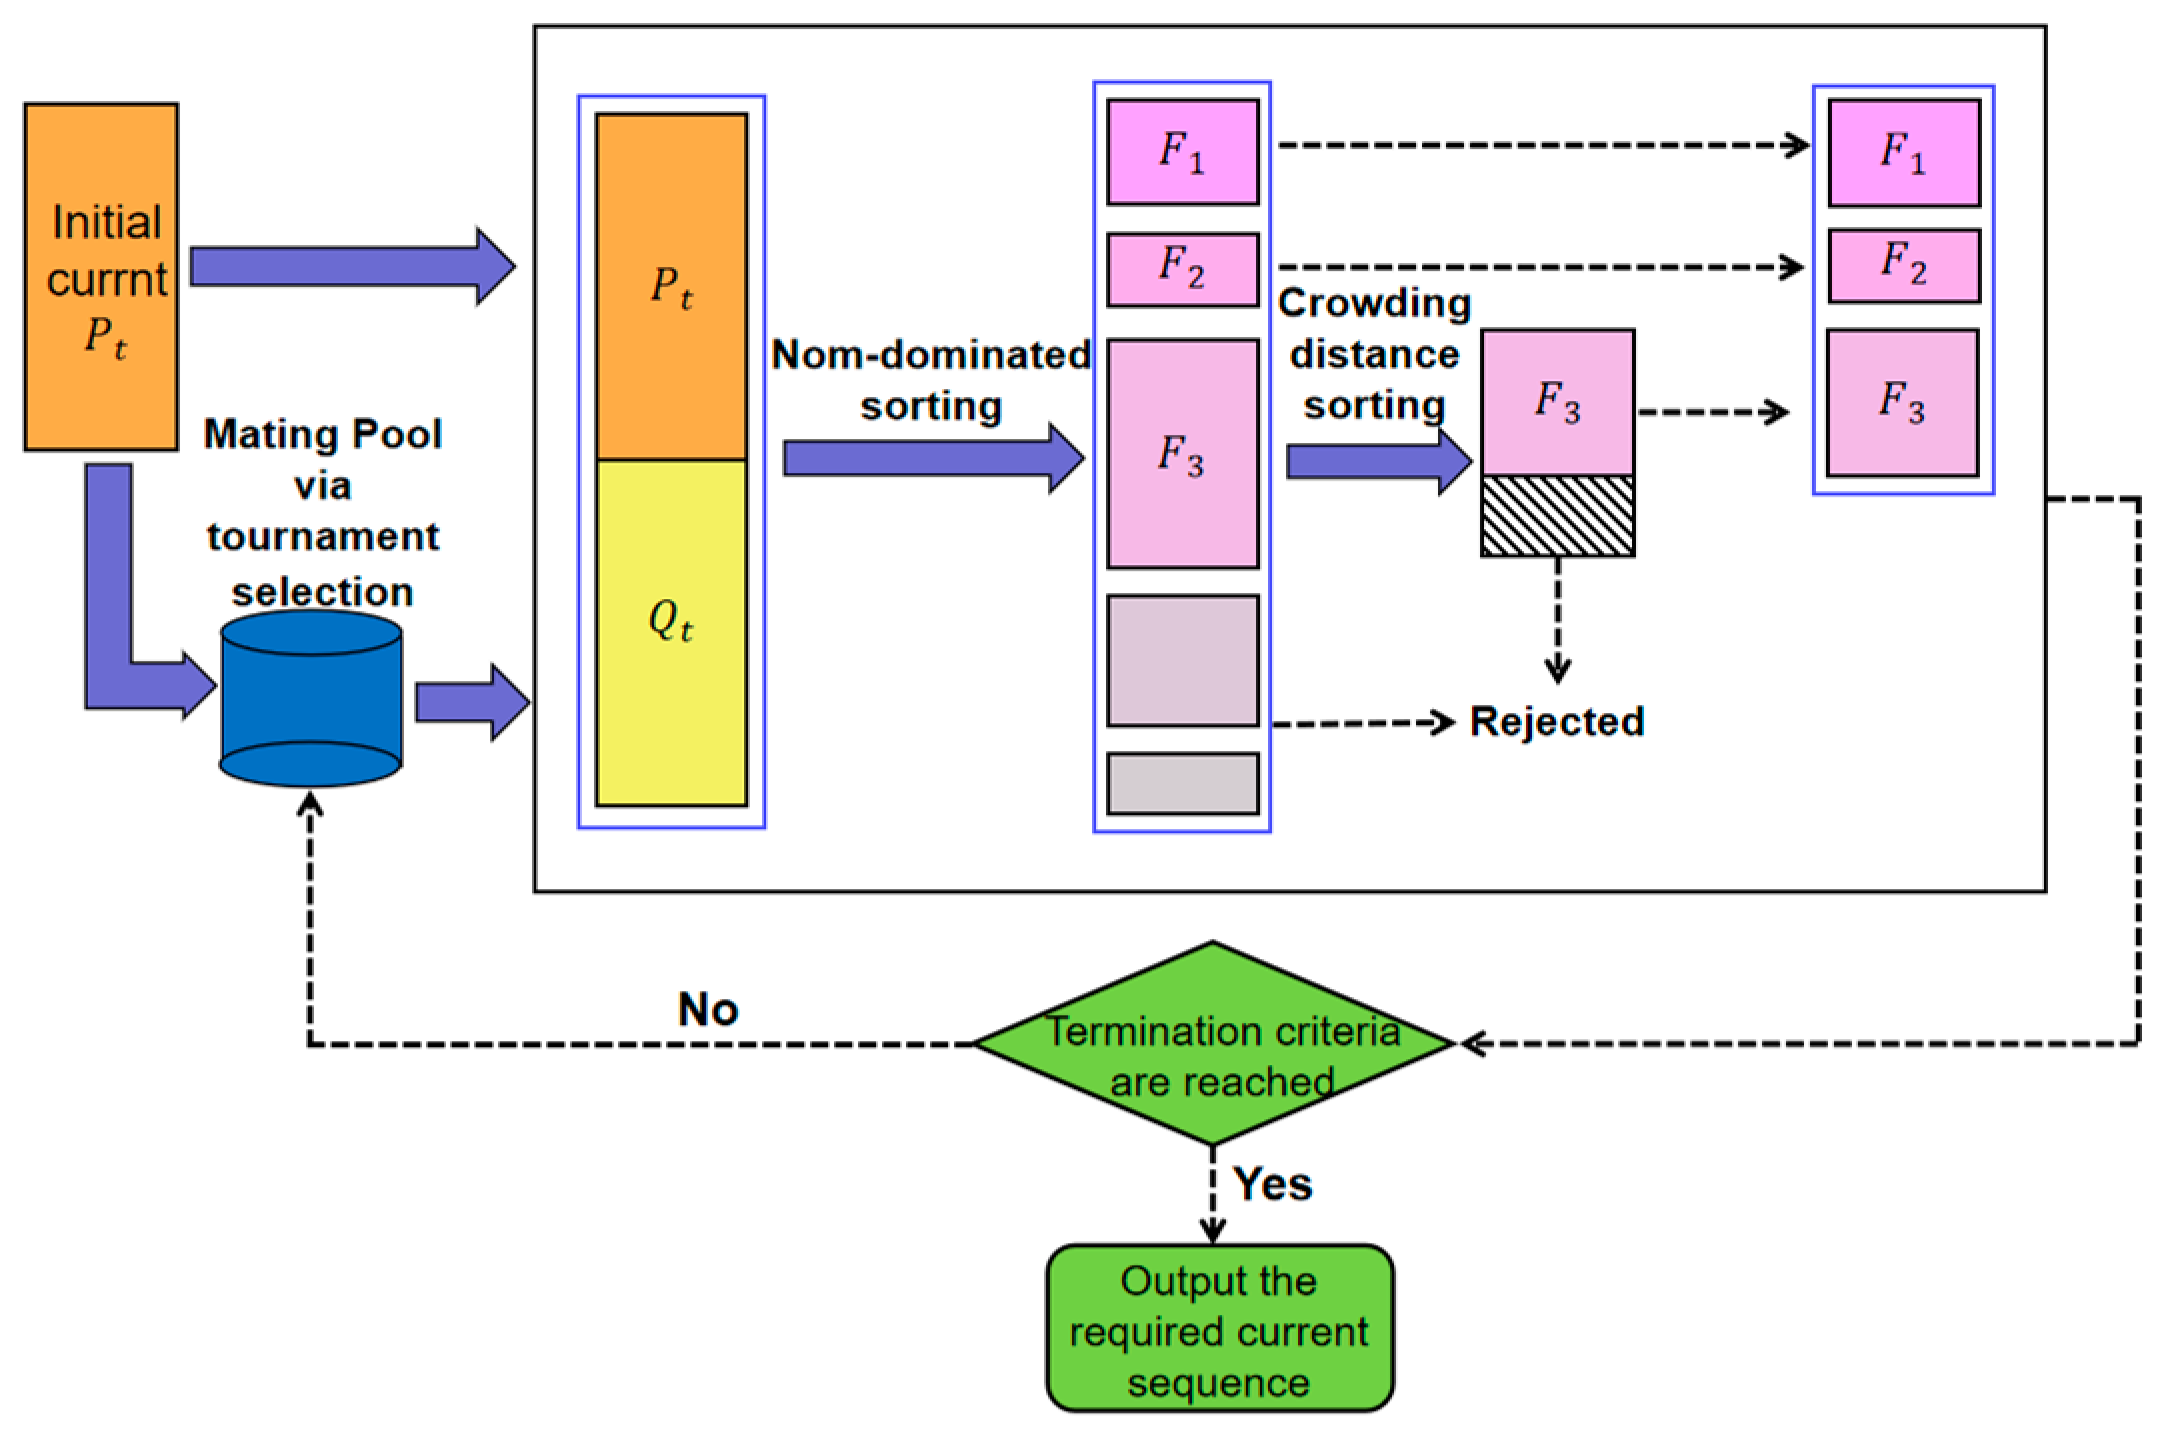
  • The electrothermal coupling model and the objective function formula were imported to generate the initial current sequence in accordance with the negative pulsed-current charging characteristics. In this process, the population size and the number of iterations were set to 100. Based on the constraint conditions, M random charge and discharge current sequences were generated. I c = [ I 1 , I 2 , I 3 , I 4 I M ], I d = [ I 1 , I 2 , I 3 , I 4 I M ];
2.
The charging and discharging current sequences were optimized by implementing selection and cross-mutation operators. The objective functions considered charging time, charging efficiency, and battery temperature rise. The resulting current sequence was compared using non-dominated sorting and crowding distance sorting to obtain the globally optimal charging and discharging current sequence [23,24];
3.
The optimal current sequence and the result of the objective function were constantly updated to verify whether the output charging current sequence satisfied the iterative requirements. If it satisfied the iterative requirements, the final result was derived from the output Pareto front; otherwise, the iteration continued. This section is primarily based on the genetic algorithm toolbox and programming in MATLAB 2022b software.

4. Optimization Results and Discussion

This section explores the effects of different optimized charging strategies on the charging time, battery temperature increase, and charging efficiency.

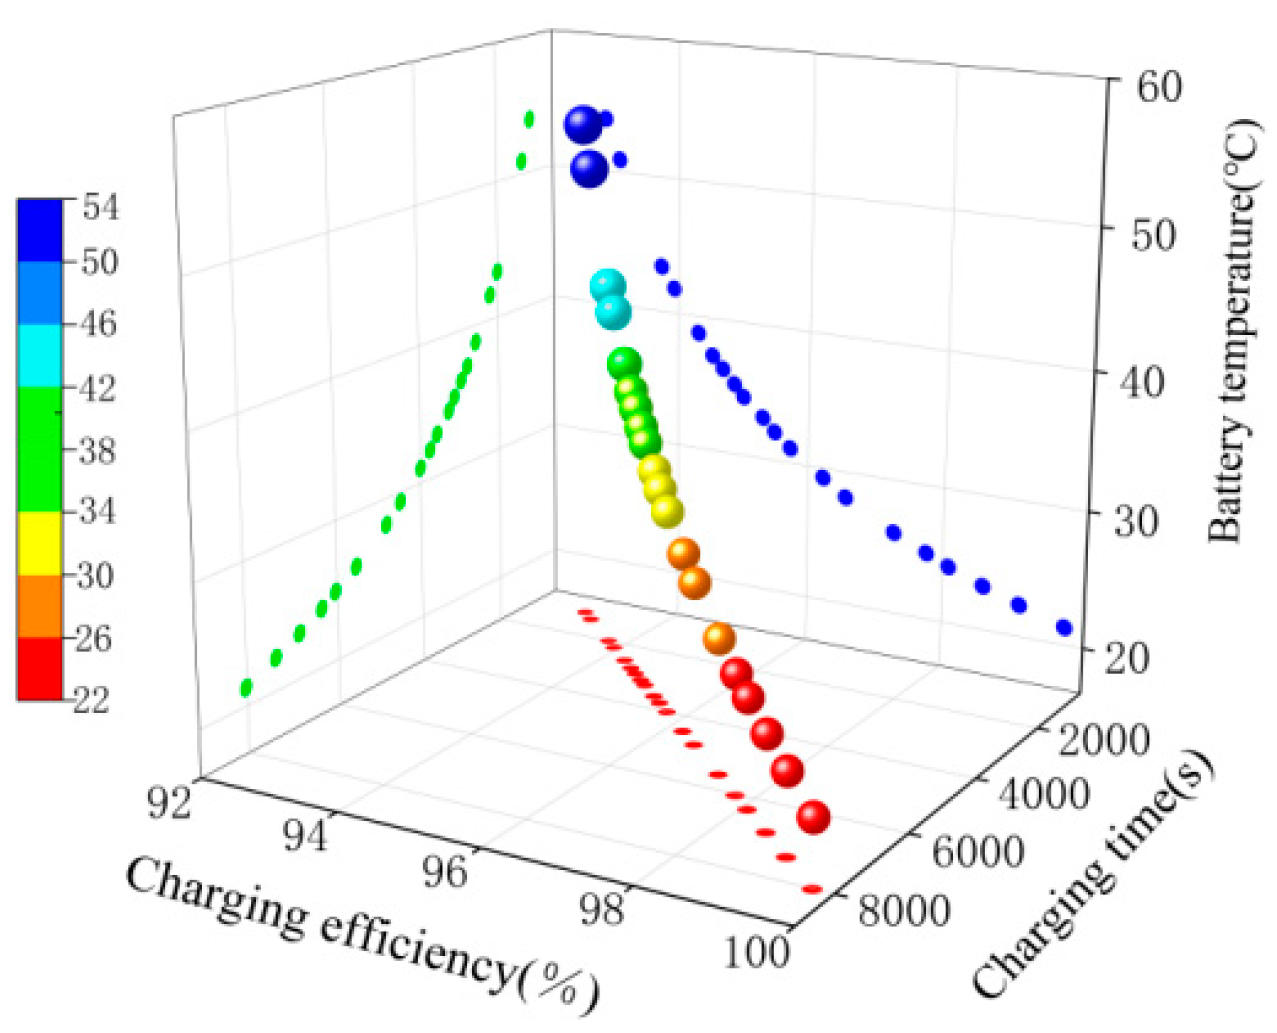
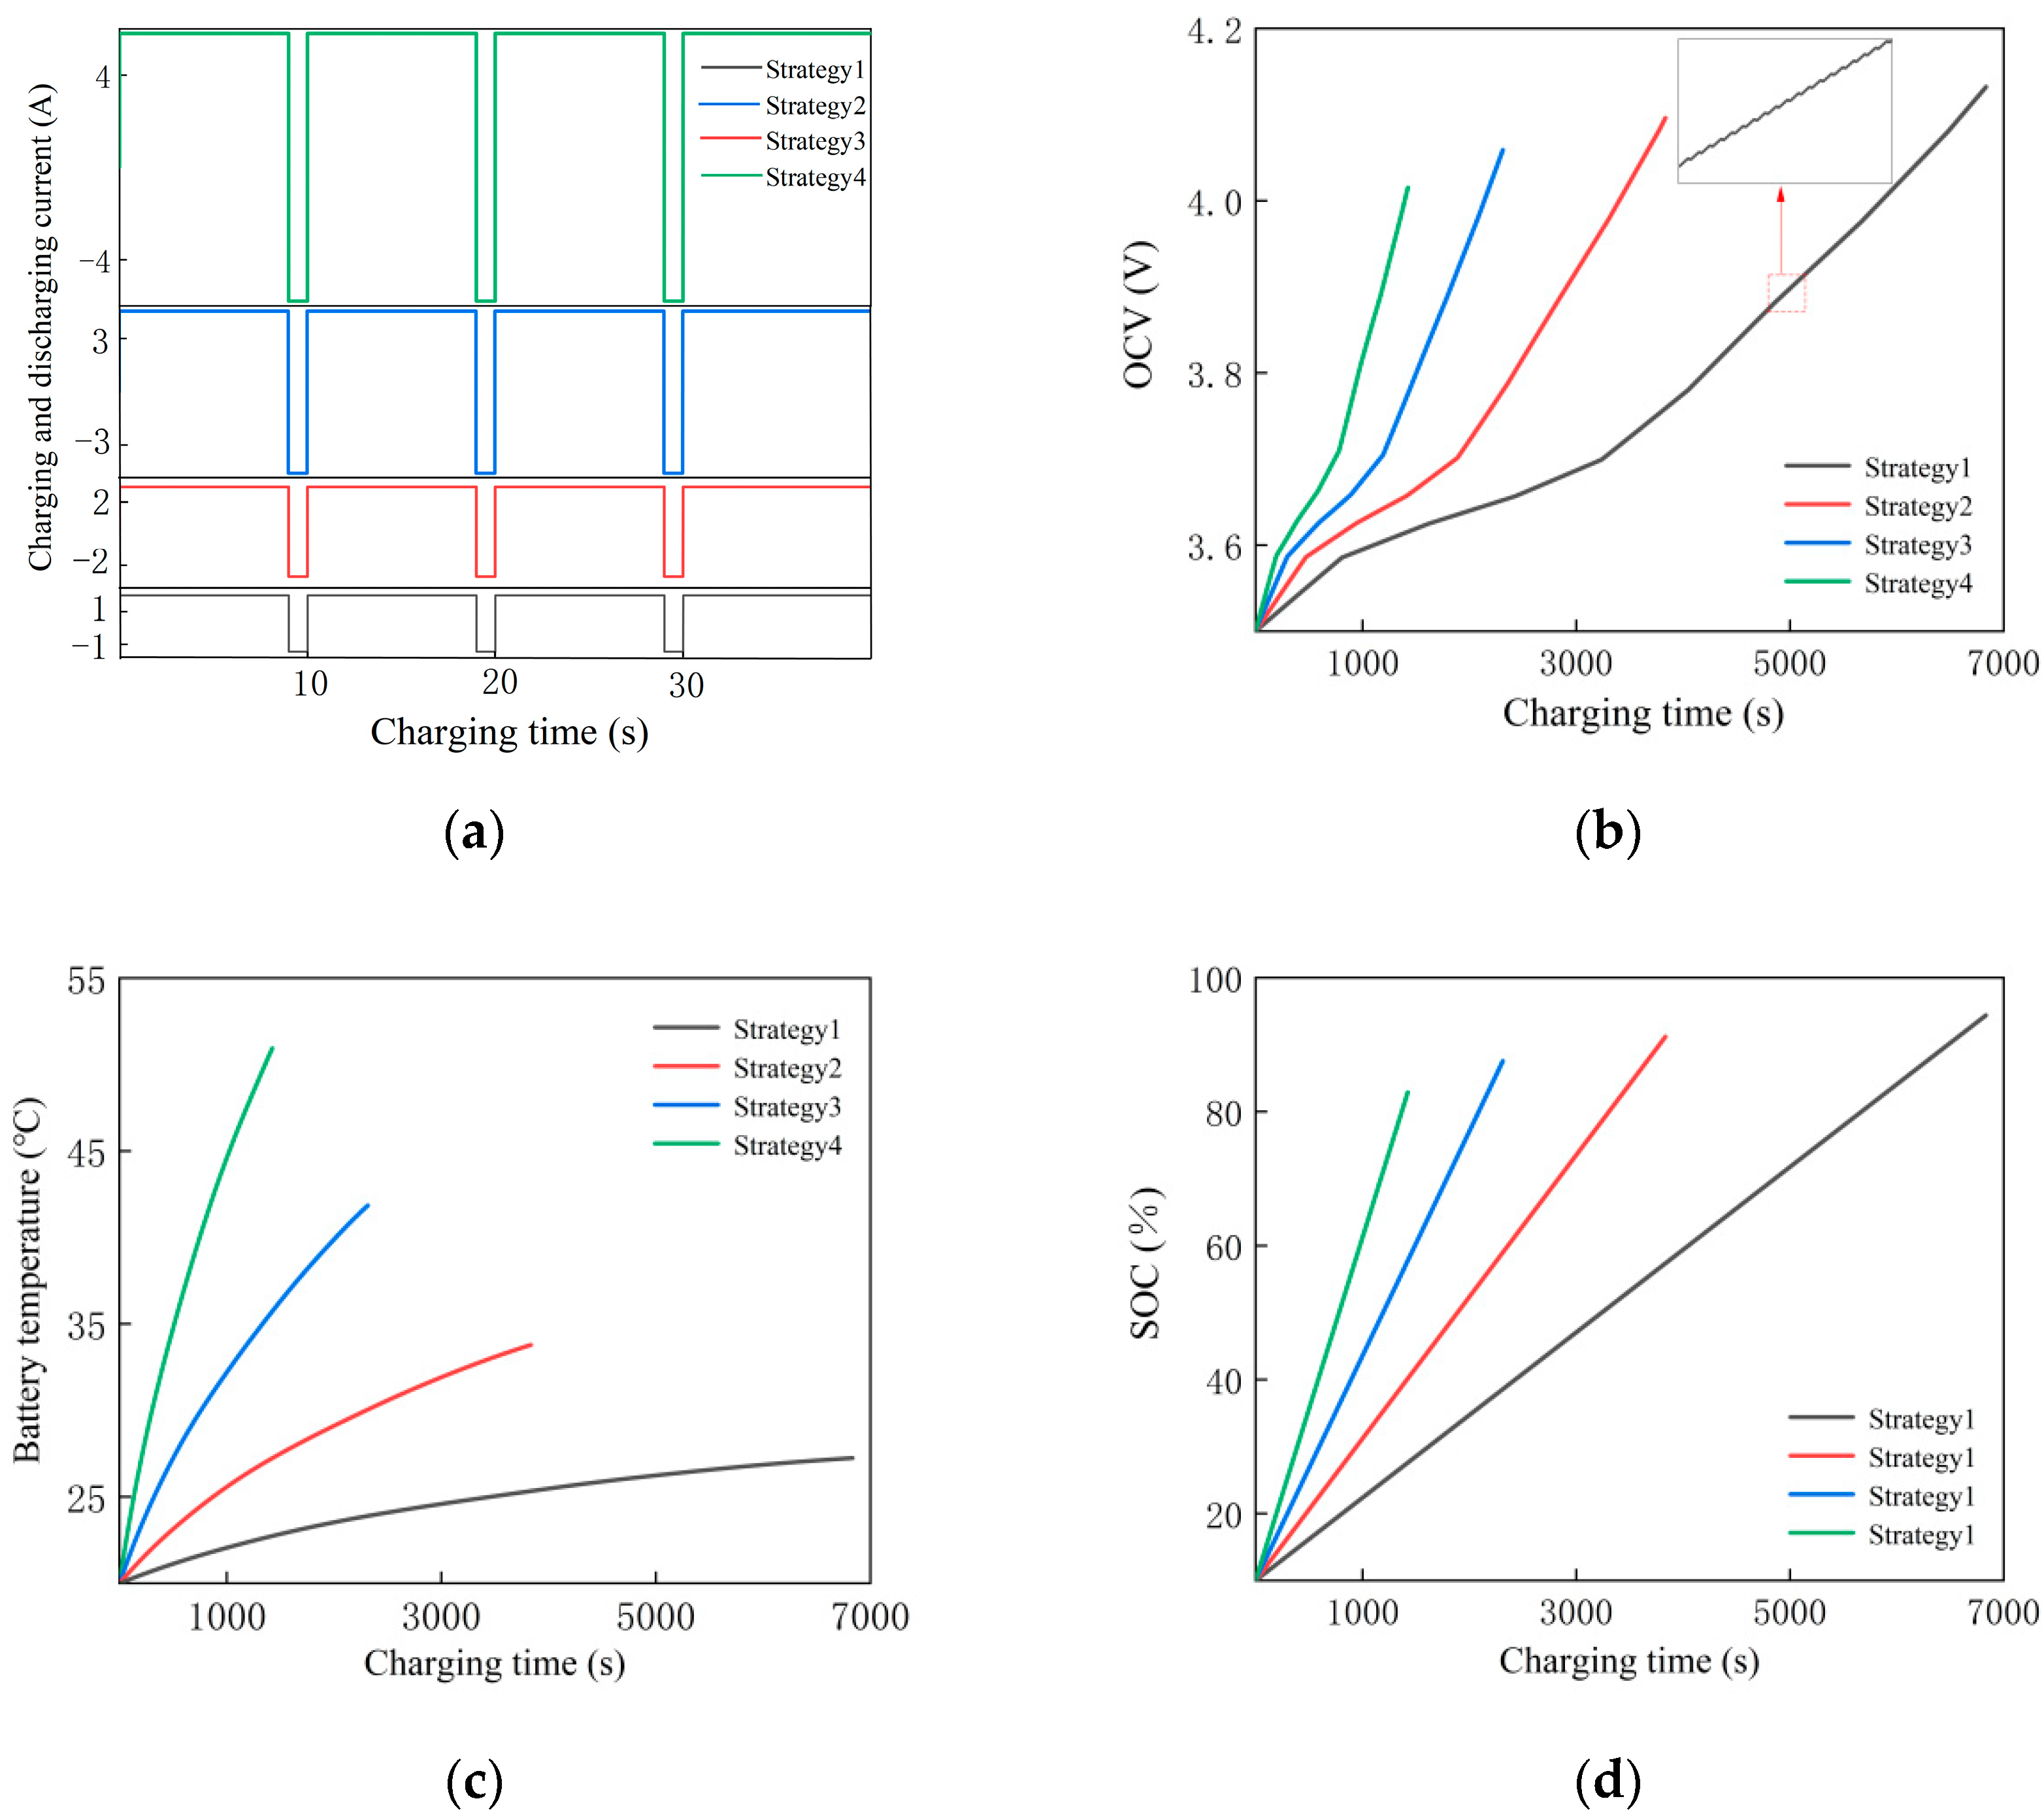
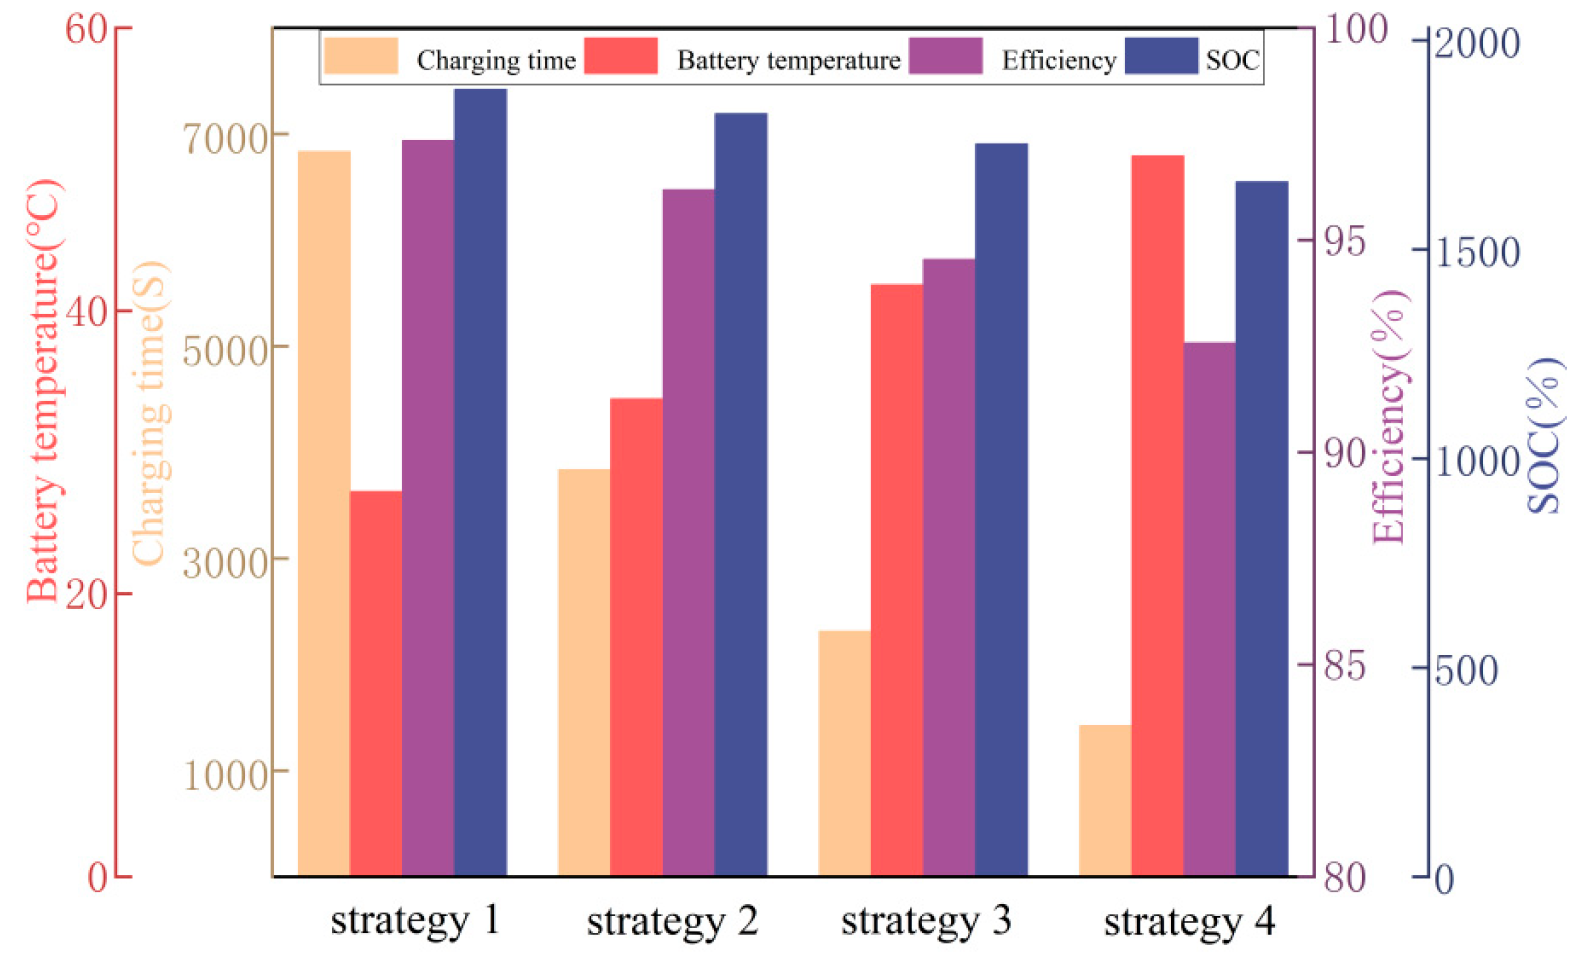
Optimization Strategy for Negative Pulsed-Current Charging

To solve the problems of different dimensions and conflicts in multi-objective optimization, the Pareto optimal frontier method was adopted, which can consider multiple optimization objectives simultaneously and provide the optimal charging current size while focusing on different objective functions.
The Pareto frontier is derived from the combination of the objective function and constraints of the optimization algorithm, as illustrated in Figure 7. The objective function, which encompasses charging time, charging efficiency, and rising battery temperature, exhibits mutual dependency among its components. The points on the Pareto front surface represent the optimal solutions achieved by balancing and emphasizing the objective function. An appropriate solution can be selected depending on the varying emphasis placed on the objective function. Consequently, based on the distinct focus accorded to the objective function, four representative charging ratios are chosen for the experiment’s charge and discharge current. These ratios are 0.7C, 1.2C, 1.9C, and 2.9C, corresponding to strategies 1, 2, 3, and 4, respectively. Strategy 1 features the lowest charge–discharge ratio and longest charging time, while Strategy 4 presents the highest charge–discharge ratio and shortest charging time.
Figure 8 compares the charging time, charging efficiency, and increase in battery temperature for the four charging strategies. As the charging ratio increases, the battery’s charging state gradually decreases after reaching the cut-off voltage. The charging state of Strategy 4 is only 83.14%, while that of Strategy 1 is 94.42%.
Strategy 1 emphasizes the charging efficiency of the battery and controlling the increase in temperature of the battery. The temperature of the battery increases by only 7.24 °C throughout the charging process, and the charging efficiency reaches 97.53%. It boasts the highest charging efficiency and the smallest increase in battery temperature compared to the other three strategies.
Strategy 4 is more inclined to prioritize the shortest charging time, which is only 1426 s, reducing the time by 79.09% compared with Strategy 1 and 62.99% and 38.41% compared with Strategies 2 and 3, respectively. Although the charging efficiency of Strategy 4 has decreased compared to the other three strategies, the difference could be clearer. However, Strategy 4 has the highest charging ratio, resulting in the greatest increase in the battery temperature. The temperature rise of the battery reached 50.96 °C, which is 1.8 times that of Strategy 1. This demonstrates that an excessive charging rate will cause a sharp increase in battery temperature, potentially leading to thermal runaway and reducing the battery’s service life.
A multi-Y-axis bar chart of the different strategies is presented in Figure 9. Comparing the four charging strategies, the charging efficiency gap is small. Given the importance of charging time, the charging and discharging ratio of Strategy 3 is more reasonable, as it considers both factors of battery temperature rise and battery charging state.

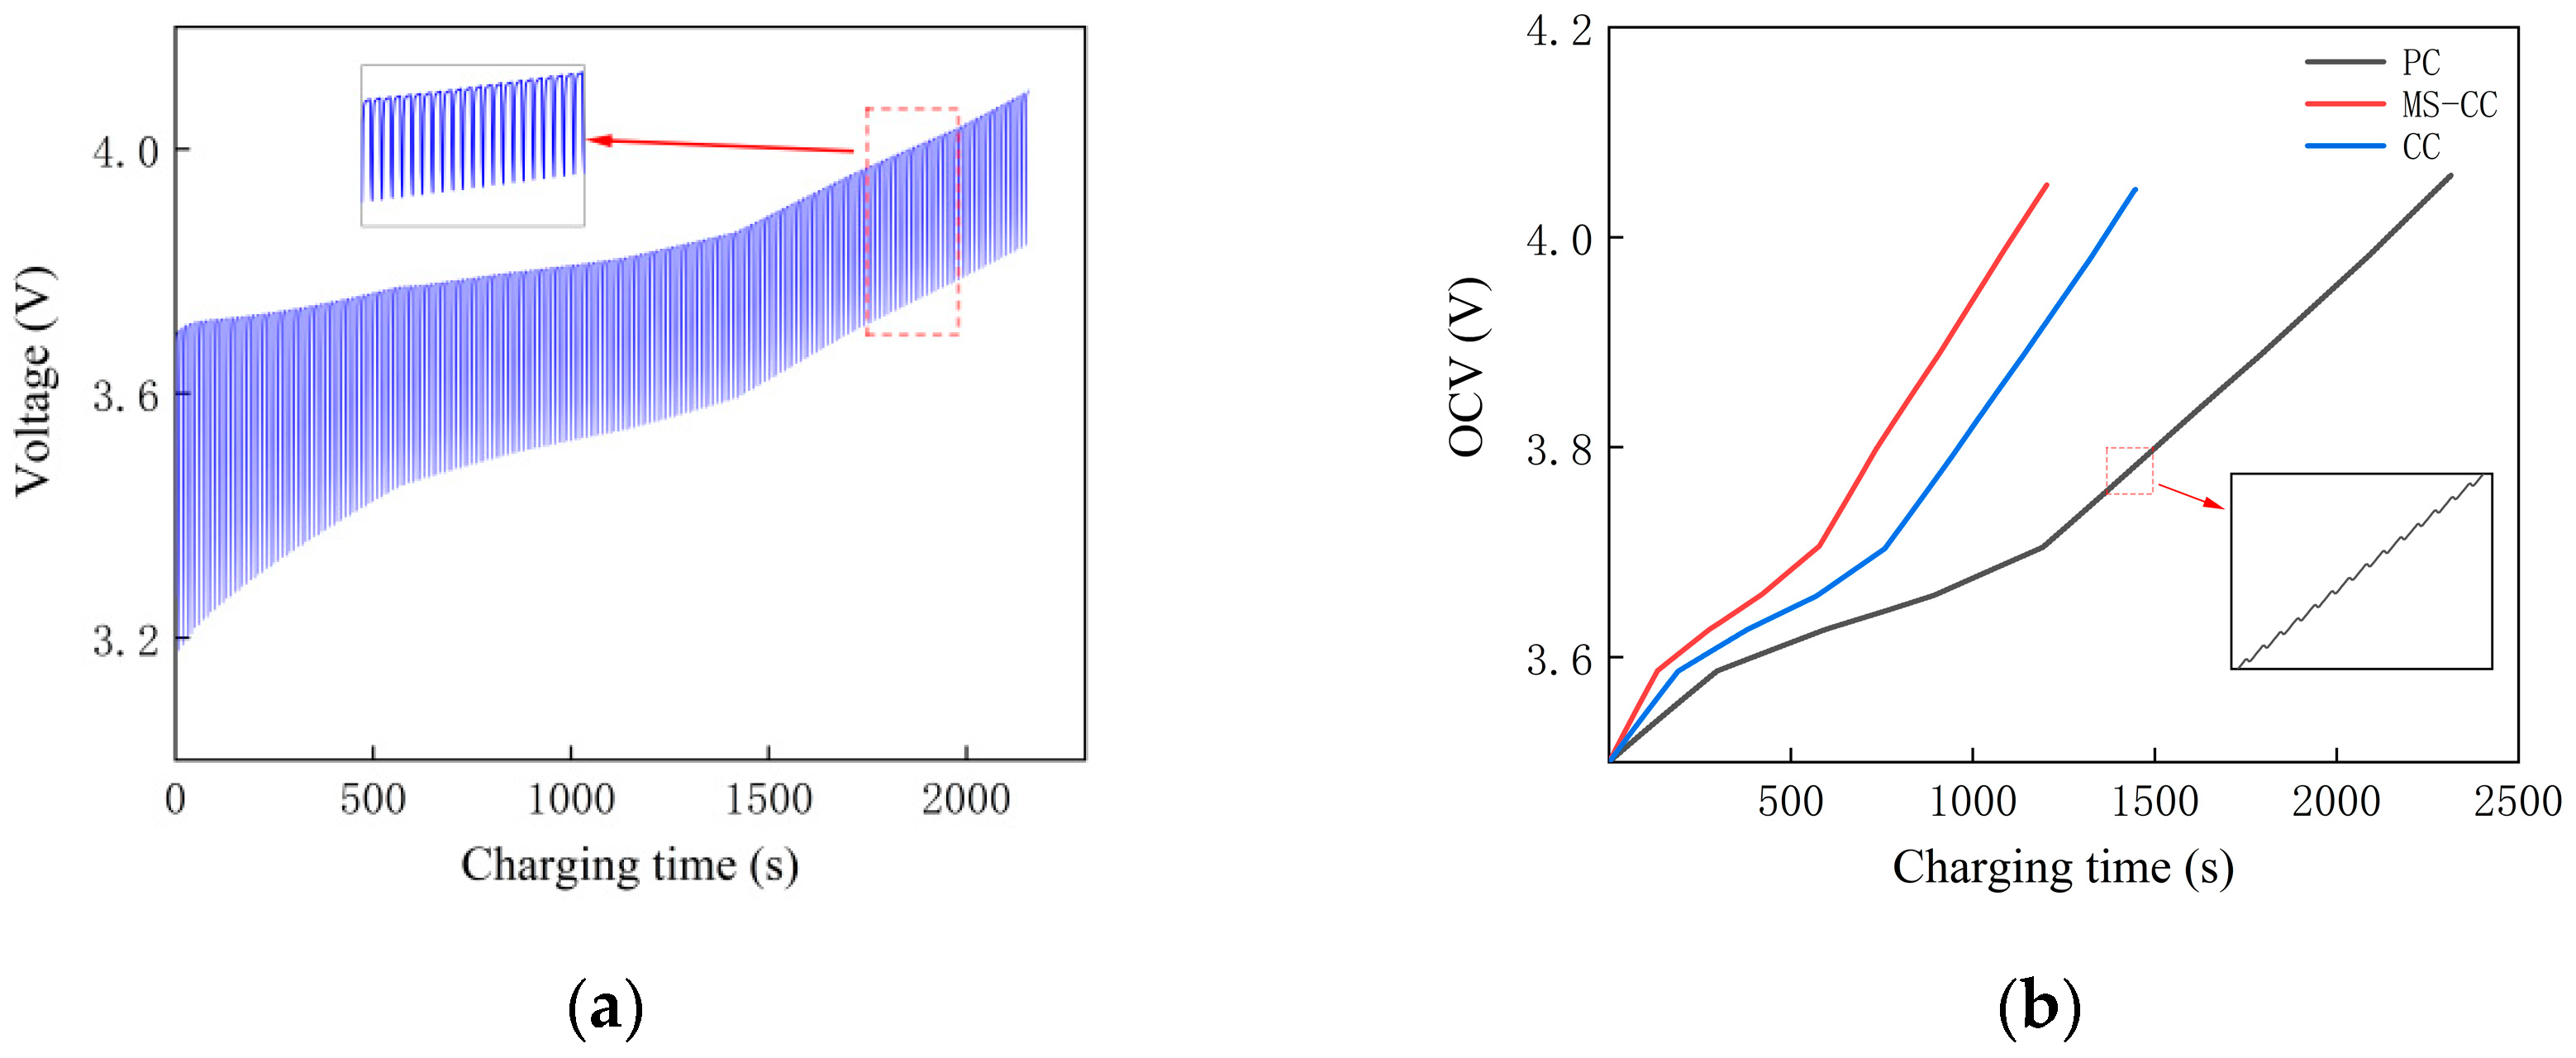
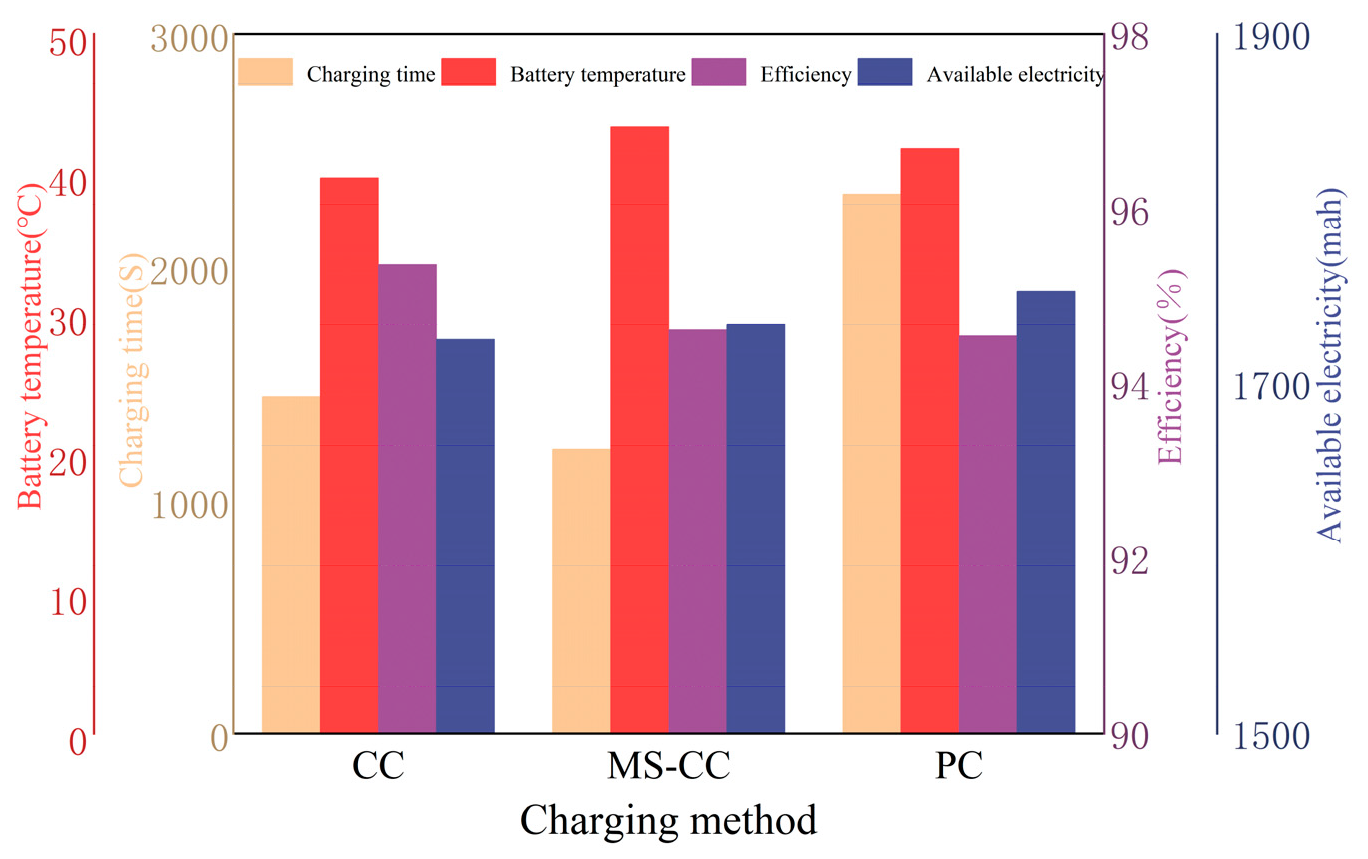
5. Comparison of the CC, PC, and MS-CC Charging Strategy

This section compares the effects of CC, MS-CC, and PC charging methods on the amount of charge, temperature increase, and battery charging time. The charging current of Strategy 3 is used as the multiplier of these three charging methods. The terminal voltage, open-circuit voltage (OCV), state of charge (SOC), and temperature rise curves of the battery during the whole charging process are shown in Figure 10.
In the constant-current charging mode, the internal polarization phenomenon of the battery gradually accumulates, leading to a gradual decline in the battery’s ability to accept electrical energy. Consequently, the constant-voltage charging mode must be employed to progressively reduce the charging current until the battery is fully charged, which requires considerable time. In the multi-stage constant-current charging mode, the charging process is segmented into five stages, gradually decreasing the charging current. This approach can enhance the battery’s acceptance of electrical energy; however, it is also necessary to utilize constant voltage or reduced charging current to achieve total battery capacity in the later stages of charging. Under the pulsed-current charging mode condition, the terminal voltage of the battery experiences a significant change. Both positive pulsed charging and negative pulsed discharge can effectively mitigate the polarization phenomenon within the battery and improve the battery’s acceptance of electrical energy. Due to the reduced accumulation of polarization effects, the battery can be charged to its total capacity by appropriately increasing the cut-off voltage, obviating the need to decrease the current. This method can reduce the internal polarization effect and enhance the ability of the battery to accept electrical energy.
According to the outcomes of the three distinct charging modes, as illustrated in Figure 11, the CC mode requires the least amount of time, at 1445 s, but has a lower charging power, amounting to only 1725.48 mAh. The multi-stage constant-current charging mode (MS-CC) and pulsed-current (PC) charging strategy exhibit minimal differences in charging time. The pulsed-current (PC) charging strategy charges 1752.66 mAh, a mere 1.58% more than the constant-current charging strategy, and the charging efficiency remains virtually the same. These results indicate that the pulsed-current (PC) charging strategy can facilitate the battery to accept more energy, and the temperature increase of the battery under the PC charging mode is 3.587% lower than that under the MS-CC charging mode.
To further compare the acceptance of electrical energy between constant-current (CC) charging and pulsed-current (PC) charging strategies, a total of six experiments were conducted with a gradient of 0.5C and a cut-off voltage of 4.2 V. As depicted in Figure 12, there was minimal discrepancy in the amount of charge of the battery under the condition of 0.5C. As the charging ratio gradually increased, the benefits of the PC charging mode became increasingly apparent. When the charging rate reached 3C, the PC charging method provided a charging efficiency 3.54% higher than that of the CC charging method.
In comparison to the constant-current charging strategy, the negative pulsed-current charging strategy based on NSGA-II could mitigate the internal polarization of the battery and significantly augment the charged energy. This approach is more suitable for investigating battery aging and the internal polarization effect, despite the extended charging time and its challenging implementation in practice. Compared to the multi-stage constant-current charging strategy, this method results in a smaller increase in the battery temperature. The differences in charging efficiency among the PC, CC, and MS-CC methods under the same conditions are not significant.

6. Conclusions

To achieve a balance among charging time, charging efficiency, and battery temperature increase during the charging process, an electric-thermal model of the battery was established using the INR18650-20R lithium-ion battery as the research object. Furthermore, a PC charging strategy was proposed based on the NSGA-II algorithm for lithium batteries. The following conclusions were drawn by comparing the MS-CC and traditional CC charging modes:
  • The proposed charging strategy can effectively charge the battery by optimizing the three objective functions of charging time, charging efficiency, and battery temperature increase;
  • In this study, the NSGA-II algorithm was employed to screen the generated charging current sequence through non-dominating sorting and crowding, making it challenging to directly determine the fitness of multi-objective problems. An appropriate charging current magnification is determined depending on the emphasis on different objective functions, resulting in a Pareto optimal solution set;
  • The PC charging strategy proposed in this study can balance the internal polarization phenomenon of lithium batteries and significantly enhance the battery’s acceptance of electrical energy. Furthermore, the increase in temperature is lower than that of the MS-CC charging mode. A comparative analysis was conducted between the PC and CC charging capacities at charging rates of 0.5C, 1C, 1.5C, 2C, 2.5C, and 3C. The results demonstrated that the PC charging mode could improve the battery’s charging capacity as the charging rate increased under a 3C charging rate or less.

Author Contributions

Y.H.: methodology, writing—original draft; S.W.: writing—review and editing, funding acquisition; Z.W.: investigation, data curation; G.X.: investigation. All authors have read and agreed to the published version of the manuscript.

Funding

This work is financially supported by the Jilin Province science and technology development plan project (20230203195SF).

Data Availability Statement

The data that support the findings of this study are available from the corresponding authors upon reasonable request.

Conflicts of Interest

The authors declare that they have no known competing financial interests or personal relationships that could have appeared to influence the work reported in this paper.

References

  1. Patel, M.; Mishra, K.; Banerjee, R.; Chaudhari, J.; Kanchan, D.K.; Kumar, D. Fundamentals, recent developments and prospects of lithium and non-lithium electrochemical rechargeable battery systems. J. Energy Chem. 2023, 81, 221–259. [Google Scholar] [CrossRef]
  2. He, L.E.; Gu, Z.H.; Zhang, Y.; Jing, H.D.; Li, P.P. Review on Thermal Management of Lithium-Ion Batteries for Electric Vehicles: Advances, Challenges, and Outlook. Energy Fuels 2023, 37, 4835–4857. [Google Scholar] [CrossRef]
  3. Bugryniec, P.J.; Resendiz, E.G.; Nwophoke, S.M.; Khanna, S.; James, C.; Brown, S.F. Review of gas emissions from lithium-ion battery thermal runaway failure—Considering toxic and flammable compounds. J. Energy Storage 2024, 87, 111288. [Google Scholar] [CrossRef]
  4. Huang, X.R.; Liu, W.J.; Acharya, A.B.; Meng, J.H.; Teodorescu, R.; Stroe, D.I. Effect of Pulsed Current on Charging Performance of Lithium-Ion Batteries. IEEE Trans. Ind. Electron. 2022, 69, 10144–10153. [Google Scholar] [CrossRef]
  5. Waseem, M.; Ahmad, M.; Parveen, A.; Suhaib, M. Battery technologies and functionality of battery management system for EVs: Current status, key challenges, and future prospectives. J. Power Sources 2023, 580, 233349. [Google Scholar] [CrossRef]
  6. Cho, S.Y.; Lee, I.O.; Baek, J.I.; Moon, G.W. Battery Impedance Analysis Considering DC Component in Sinusoidal Ripple-Current Charging. IEEE Trans. Ind. Electron. 2016, 63, 1561–1573. [Google Scholar] [CrossRef]
  7. Shuangming, D.; Penglai, D. Adaptive charging strategy for lithium batteries based on differential voltage platforms. Energy Storage Sci. Technol. 2023, 12, 1561–1573. [Google Scholar]
  8. Zhao, D.; Chen, M.B.; Lv, J.; Lei, Z.G.; Song, W.J. Multi-objective optimization of battery thermal management system combining response surface analysis and NSGA-II algorithm. Energy Conv. Manag. 2023, 292, 117374. [Google Scholar] [CrossRef]
  9. Tian, J.Q.; Li, S.Q.; Liu, X.H.; Yang, D.; Wang, P.; Chang, G.Y. Lithium-ion battery charging optimization based on electrical, thermal and aging mechanism models. Energy Rep. 2022, 8, 13723–13734. [Google Scholar] [CrossRef]
  10. He, J.H.; Meng, J.K.; Huang, Y.H. Challenges and recent progress in fast-charging lithium-ion battery materials. J. Power Sources 2023, 570, 232965. [Google Scholar] [CrossRef]
  11. Reisecker, V.; Flatscher, F.; Porz, L.; Fincher, C.; Todt, J.; Hanghofer, I.; Hennige, V.; Linares-Moreau, M.; Falcaro, P.; Ganschow, S.; et al. Effect of pulse-current-based protocols on the lithium dendrite formation and evolution in all-solid-state batteries. Nat. Commun. 2023, 14, 2432. [Google Scholar] [CrossRef] [PubMed]
  12. Chen, L.R. Design of Duty-Varied Voltage Pulse Charger for Improving Li-Ion Battery-Charging Response. IEEE Trans. Ind. Electron. 2009, 56, 480–487. [Google Scholar] [CrossRef]
  13. Chen, L.R. A design of an optimal battery pulse charge system by frequency-varied technique. IEEE Trans. Ind. Electron. 2007, 54, 398–405. [Google Scholar] [CrossRef]
  14. Aryanfar, A.; Brooks, D.; Merinov, B.V.; Goddard, W.A.; Colussi, A.J.; Hoffmann, M.R. Dynamics of Lithium Dendrite Growth and Inhibition: Pulse Charging Experiments and Monte Carlo Calculations. J. Phys. Chem. Lett. 2014, 5, 1721–1726. [Google Scholar] [CrossRef] [PubMed]
  15. Acosta, L.N.; Garaventta, G.; Levi, M.; Aurbach, D.; Flexer, V. Pulsed Charging Protocols with Non-Zero Relaxation Time for Lithium-Ion Batteries. J. Electrochem. Soc. 2022, 169, 100519. [Google Scholar] [CrossRef]
  16. Ou, S.-Y.; Tian, J.-H.; Yang, C.-Y. Design and implementation of a DSP-based fast charger for Li-ion battery. In Proceedings of the 2011 IEEE Ninth International Conference on Power Electronics and Drive Systems, Singapore, 5–8 December 2011; pp. 809–812. [Google Scholar]
  17. Li, F.; Zuo, W.; Zhou, K.; Li, Q.Q.; Huang, Y.H.; Zhang, G.D. State-of-charge estimation of lithium-ion battery based on second order resistor-capacitance circuit-PSO-TCN model. Energy 2024, 289, 130025. [Google Scholar] [CrossRef]
  18. Amanor-Boadu, J.M.; Guiseppi-Elie, A.; Sánchez-Sinencio, E. Search for Optimal Pulse Charging Parameters for Li-Ion Polymer Batteries Using Taguchi Orthogonal Arrays. IEEE Trans. Ind. Electron. 2018, 65, 8982–8992. [Google Scholar] [CrossRef]
  19. Keil, P.; Jossen, A. Charging protocols for lithium-ion batteries and their impact on cycle life-An experimental study with different 18650 high-power cells. J. Energy Storage 2016, 6, 125–141. [Google Scholar] [CrossRef]
  20. Liu, J.; Yadav, S.; Salman, M.; Chavan, S.; Kim, S.C. Review of thermal coupled battery models and parameter identification for lithium-ion battery heat generation in EV battery thermal management system. Int. J. Heat Mass Transfer 2024, 218, 124748. [Google Scholar] [CrossRef]
  21. Wang, J.A.; Yang, K.; Sun, S.Y.; Ma, Q.Y.; Yi, G.; Chen, X.; Wang, Z.; Yan, W.; Liu, X.H.; Cai, Q.; et al. Advances in thermal-related analysis techniques for solid-state lithium batteries. InfoMat 2023, 5, e12401. [Google Scholar] [CrossRef]
  22. Maleki, H.; Al Hallaj, S.; Selman, J.R.; Dinwiddie, R.B.; Wang, H. Thermal properties of lithium-ion battery and components. J. Electrochem. Soc. 1999, 146, 947. [Google Scholar] [CrossRef]
  23. Liu, Z.T.; Li, K.N.; Zhang, W.L.; Xie, Y.; Liu, J.Y.; Sun, L.D.; Zan, J.M. Research on safe charging strategy of lithium-ion battery based on three-electrode equivalent circuit model. J. Energy Storage 2023, 72, 108563. [Google Scholar] [CrossRef]
  24. Doerr, B.; Qu, Z.D. A First Runtime Analysis of the NSGA-II on a Multimodal Problem. IEEE Trans. Evol. Comput. 2023, 27, 1288–1297. [Google Scholar] [CrossRef]
Figure 1. Second−order RC equivalent circuit diagram.
Electronics 13 02178 g001
Figure 2. 2C rate charging current waveform diagram of the positive and negative pulsed-current (PC) charging strategy.
Electronics 13 02178 g002
Figure 3. SOC–OCV fitted curve.
Electronics 13 02178 g003
Figure 4. HPPC test voltage and current diagram.
Electronics 13 02178 g004
Figure 5. (a) The identification results of R 0 ; (b) the identification results of R 1 ; (c) the identification results of R 2 ; (d) the identification results of C 1 ; (e) the identification results of C 2 .
Electronics 13 02178 g005aElectronics 13 02178 g005b
Figure 6. NSGA-II algorithm execution flowchart.
Electronics 13 02178 g006
Figure 7. Three targets on the Pareto front.
Electronics 13 02178 g007
Figure 8. (a) Changes in current under the different strategies; (b) changes in OCV under the different strategies; (c) changes in temperature under the different strategies; (d) changes in SOC under the different strategies.
Electronics 13 02178 g008
Figure 9. Comparison of battery charging under different strategies.
Electronics 13 02178 g009
Figure 10. (a) PC charging mode terminal voltage changes; (b) three charging modes corresponding to the OCV curve; (c) three charging modes corresponding to the temperature curve; (d) three charging modes corresponding to the SOC curves.
Electronics 13 02178 g010aElectronics 13 02178 g010b
Figure 11. Comparison of the charging effects of the 3 charging strategies.
Electronics 13 02178 g011
Figure 12. Comparison of the charged power between CC and PC at different magnifications.
Electronics 13 02178 g012
Table 1. The constraints and initial conditions are optimized.
ParameterValue RangeUnit
I c [1, 6]A
I d [1, 6]A
t c 9s
t d 1s
SOC[10, 100]%
T[20, 60]°C
η [90, 100]%
U k [3.4, 4.2]V
Disclaimer/Publisher’s Note: The statements, opinions and data contained in all publications are solely those of the individual author(s) and contributor(s) and not of MDPI and/or the editor(s). MDPI and/or the editor(s) disclaim responsibility for any injury to people or property resulting from any ideas, methods, instructions or products referred to in the content.

