Abstract
The combined use of multiple medications is common in treatment, which may lead to severe drug–drug interactions (DDIs). Deep learning methods have been widely used to predict DDIs in recent years. However, current models need help to fully understand the characteristics of drugs and the relationships between these characteristics, resulting in inaccurate and inefficient feature representations. Beyond that, existing studies predominantly focus on analyzing a single DDIs, failing to explore multiple similar DDIs simultaneously, thus limiting the discovery of common mechanisms underlying DDIs. To address these limitations, this research proposes a method based on M-Transformer and knowledge graph for predicting DDIs, comprising a dual-pathway approach and neural network. In the first pathway, we leverage the interpretability of the transformer to capture the intricate relationships between drug features using the multi-head attention mechanism, identifying and discarding redundant information to obtain a more refined and information-dense drug representation. However, due to the potential difficulty for a single transformer model to understand features from multiple semantic spaces, we adopted M-Transformer to understand the structural and pharmacological information of the drug as well as the connections between them. In the second pathway, we constructed a drug–drug interaction knowledge graph (DDIKG) using drug representation vectors obtained from M-Transformer as nodes and DDI types as edges. Subsequently, drug edges with similar interactions were aggregated using a graph neural network (GNN). This facilitates the exploration and extraction of shared mechanisms underlying drug–drug interactions. Extensive experiments demonstrate that our MTrans model accurately predicts DDIs and outperforms state-of-the-art models.
1. Introduction
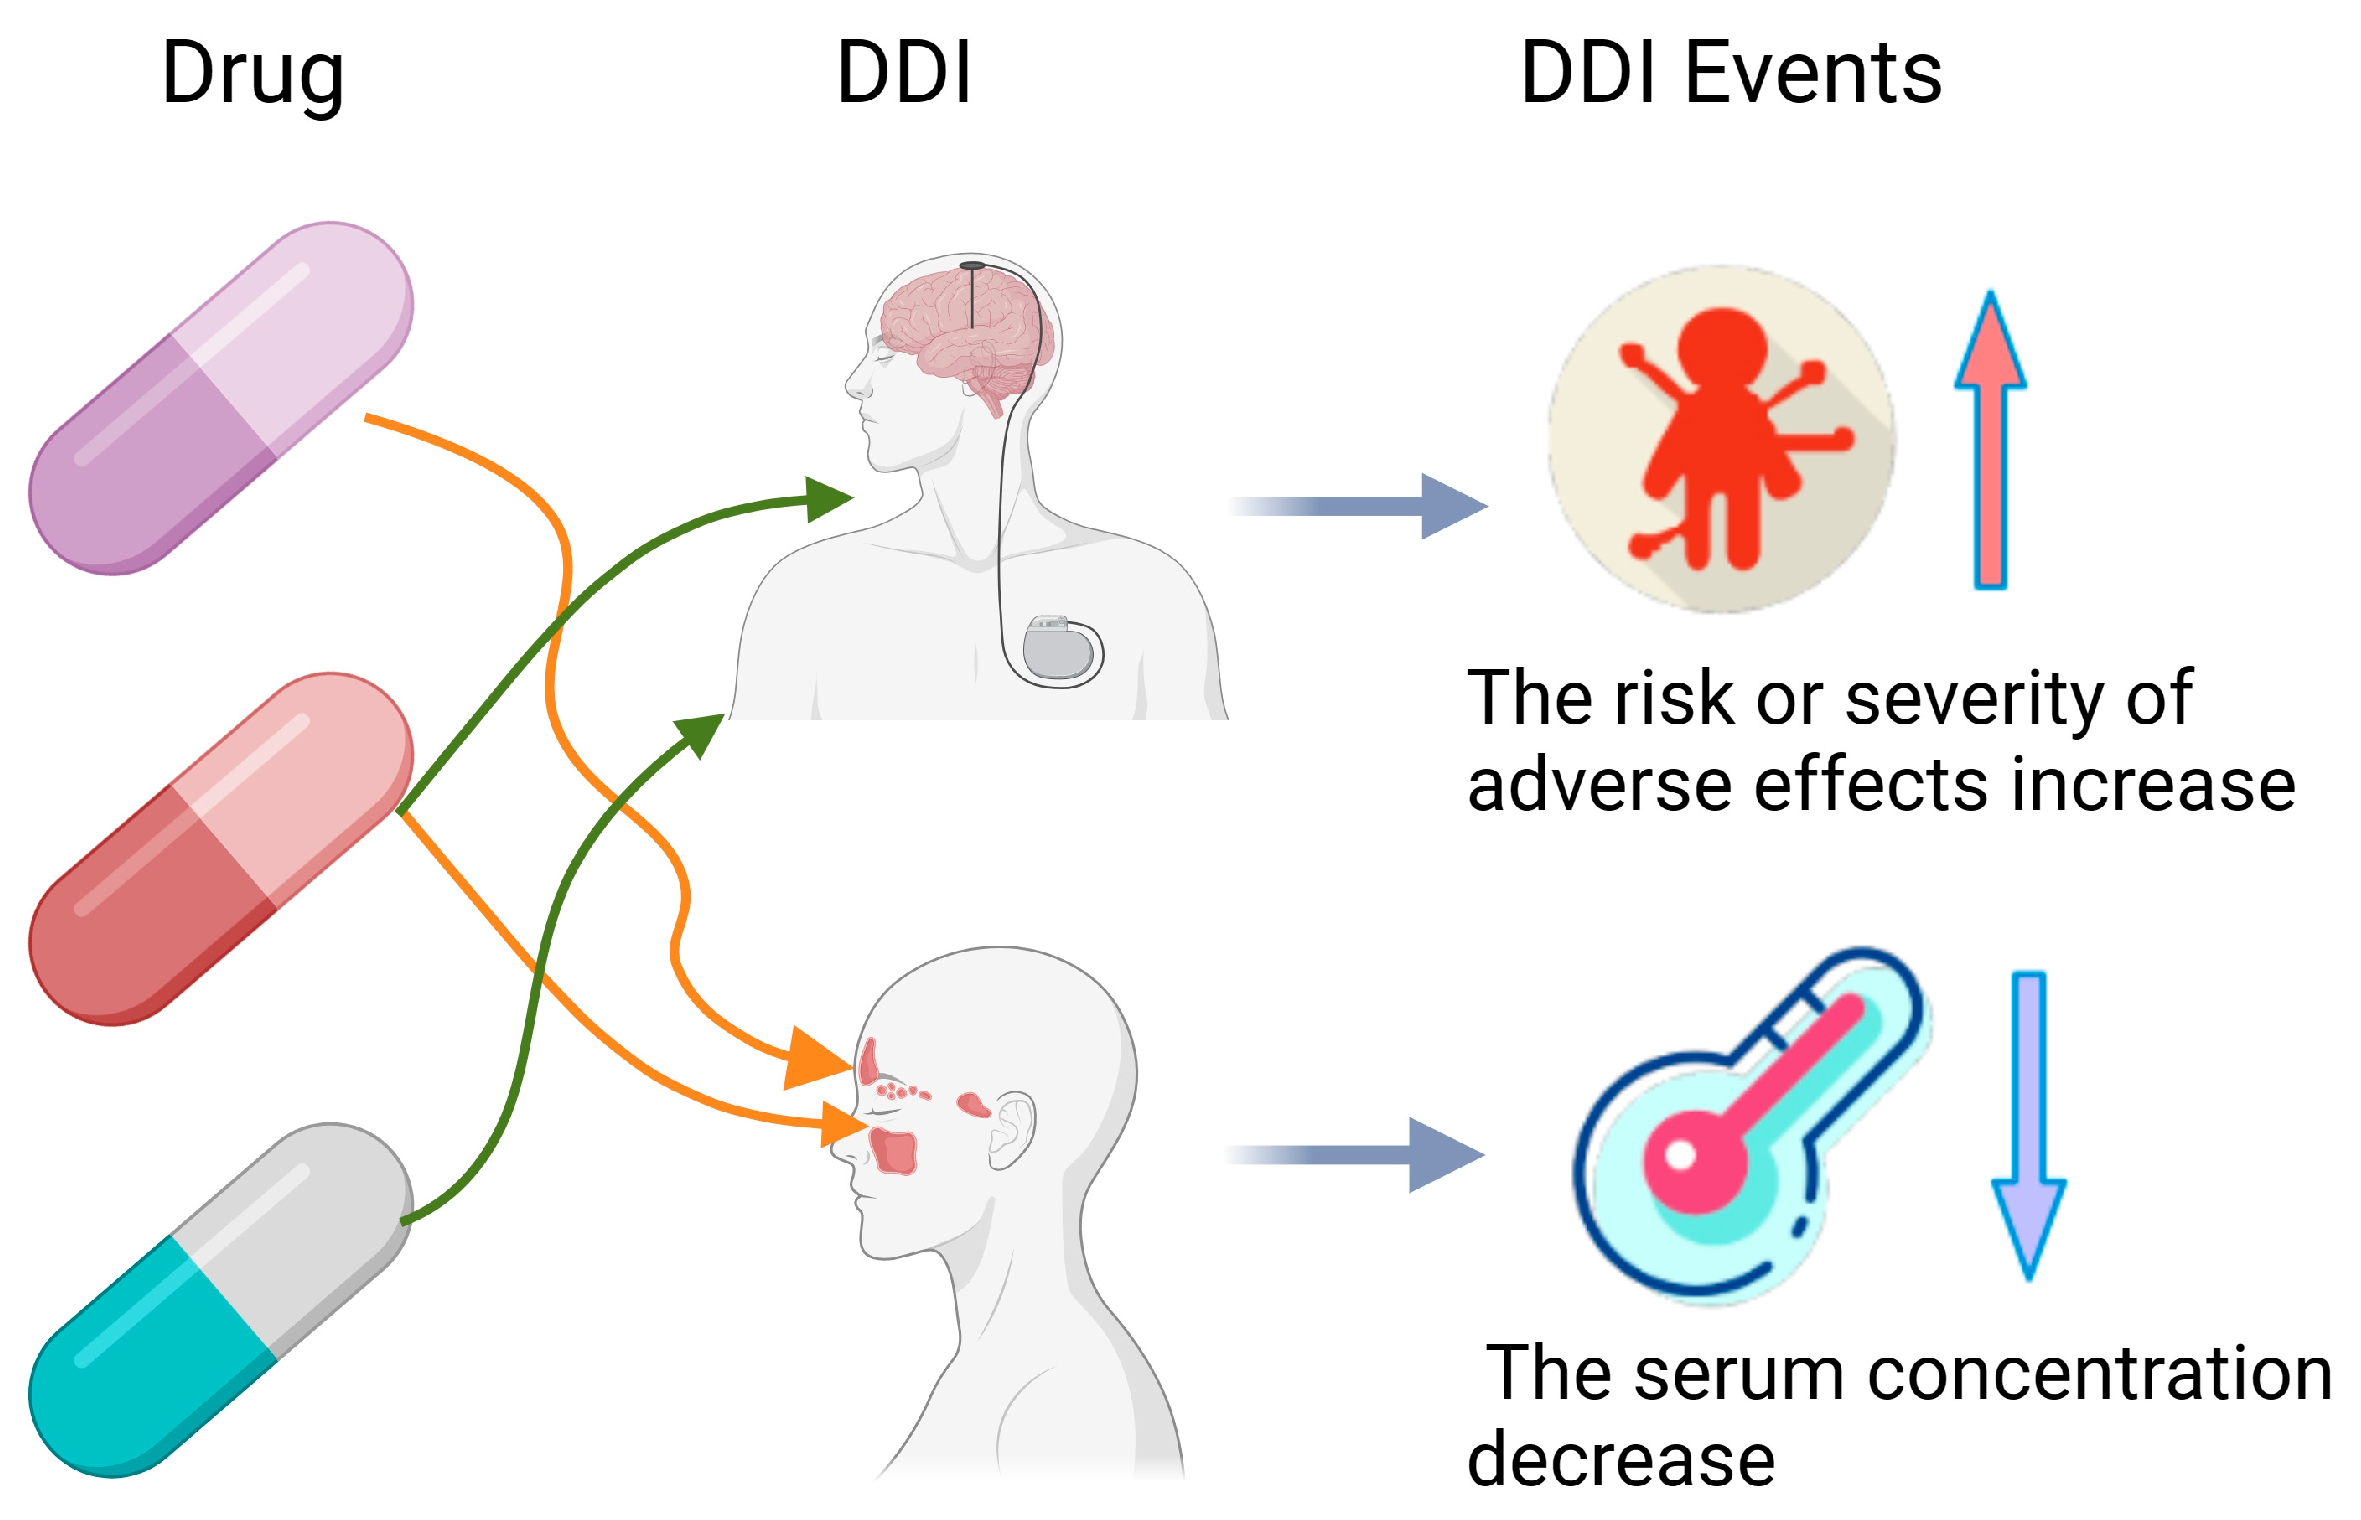
In the healthcare sector, Artificial Intelligence (AI) is redefining industry paradigms. AI technologies have permeated vital areas such as diagnostic assistance, predictive analysis, and clinical decision support, significantly enhancing the quality and efficiency of medical services [1,2]. In actual medical treatment, because of the inherent complexity of disease, patients with multiple health conditions require polypharmacy treatment. However, the use of multiple medications can lead to adverse DDIs, resulting in injury and significant healthcare costs [3,4,5,6]. For instance, if the drug abemaciclib interacts with the drug dabrafenib, a DDIs event will occur and result in decreased blood levels in the body. Moreover, there is an increased risk of adverse events when the drug abemaciclib and the drug itraconazole are mixed. These DDIs are shown in Figure 1 [7,8]. Therefore, ensuring the safety of concomitant medications is crucial to prevent various biological consequences and adverse events [9]. Clinical trials to check all potential drug interactions are both time-consuming and costly. Therefore, many researchers are now using AI for DDI prediction to increase efficiency and reduce expenses.
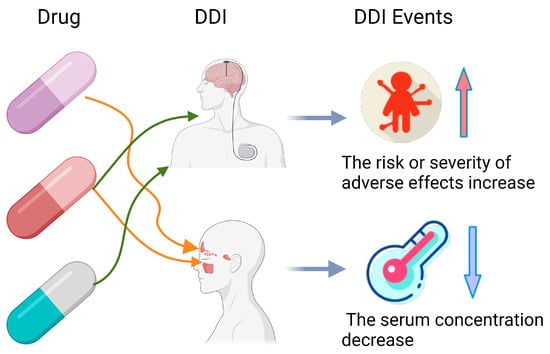
Figure 1.
Example of drug–drug interactions.
Initially, the domain of DDIs prediction research includes two principal methodologies: the computation of drug similarity and the deployment of machine learning and deep learning. In the realm of DDIs, several scholars concentrate on assessing drug similarity, such as DDI-IS-SL [10]. They factor in various drugs’ attributes to derive a composite similarity score. Techniques like the Jaccard similarity are employed for this purpose, providing a numerical representation of how alike two drugs are in terms of their features. These researchers often use Jaccard similarity to quantify drug similarity. However, methods that calculate similarity heavily rely on the quality of feature selection. This method may fail to capture the complex features of drugs, leading to lower predictive accuracy. With the widespread adoption of machine learning and deep learning technologies, researchers have begun to harness these advanced algorithms to uncover more profound insights into drug data, such as DDIMDL [11] and DeepDDI [12]. These techniques are particularly adept at handling large and complex datasets. They reveal underlying patterns that traditional similarity-based methods might overlook. They excel at deciphering complex relationships within biomedical data.
Nevertheless, the field of DDIs prediction still faces several challenges. For instance, traditional deep learning methods may need to fully capture the intricate interactions between drug features, which poses a challenge for DDIs datasets encompassing extensive sequence data. Moreover, current studies often assess drug similarity based on known DDIs data rather than delving deeply into the shared mechanisms behind the DDIs. Additionally, research that considers the comprehensive impact of a drug’s intrinsic properties, metabolic pathways, and target dynamics on DDIs still needs to be completed. Gaining a comprehensive understanding of the safety issues in polypharmacy is crucial, necessitating further in-depth research and improvement of DDIs prediction models.
In order to resolve the issues outlined above, we propose MTrans for the DDIs prediction task. We designed a dual-pathway framework comprising a pathway based on the transformer–encoder and the other one based on KG and GNN. The transformer–encoder uses multi-head attention to learn relationships among drug sequence features for better drug representations. At the same time, the common mechanisms of known DDIs are collected using KG and GNN, which can assist in the prediction of DDIs. To summarize, we can state the following as our main contribution:
- This research has developed a model called MTrans, which is a dual-pathway framework incorporating an M-Transformer model, a drug–drug interaction knowledge graph and the graph neural networks. M-Transformer is able to learn the structural and pharmacological features of drugs and the relationships between these features through three transformer–encoders. And M-Transformer can obtain a final representation vector for each drug. Additionally, we use the representation vectors obtained by the M-Transformer to construct the DDIKG, and leverage GNN to capture drug interaction information. It provides a common mechanism for the interactions between drugs.
- This research has considered not only the structural features of drugs but also the enzymes and targets involved in the processes of drug absorption, efficacy and metabolism.
- This research has conducted extensive experiments on real-world datasets to demonstrate the effectiveness of our model compared to both classical and state-of-the-art methods.
Following is the outline of the remainder of this paper. Section 2 introduces the related work of DDIs prediction. Section 3 introduces the overall framework and the methodologies specific to MTrans. Section 4 presents the experimental setup in detail and conducts two ablation studies to validate the effectiveness of our innovations. Additionally, the approach was compared with both basic machine learning methods and state-of-the-art DDIs prediction techniques. Section 5 and Section 6 are dedicated to discussion and conclusion of this paper.
2. Related Work
Several AI-based models have been proposed for predicting drug–drug interactions. Current research on DDIs prediction can be categorized into two types: calculating drug similarity and applying machine learning and deep learning.
2.1. Similarity Calculation-Based Approaches
Some researchers investigate drug research by computing drug similarity. Drug similarity is calculated between multiple features of a drug. Therefore, they can predict the DDIs based on the fused similarity. Extensive work has been conducted in this field. For example, Vilar et al. [13] utilized Jaccard similarity as a measure of drug similarity in 2012, which represents a fundamental similarity metric. Takeda et al. [14] analyzed chemical structural similarity to predict DDIs in 2017. However, more than single similarity metrics and singular information sources may be required for accurately predicting DDIs. Abdelaziz et al. [15] fused multiple drug features to compute drug similarity and accurately predicted DDIs based on the fused similarity in 2017. Vilar et al. [16] integrated drug similarity information extracted from different sources in 2014. In drug research, a frequent issue encountered is the need for high-quality labeled data (known DDIs), while unlabeled data (unknown DDIs) is abundant. Hence, Yan et al. [10] proposed a new DDIs-IS-SL method based on integrated similarity and semi-supervised learning for DDIs prediction in 2020.
Methods for computing similarity heavily rely on the quality of feature selection. Therefore, Rohani et al. [17] selected the most informative and least redundant subset of similarity types through a heuristic process in 2019. Fatehifar et al. [18] introduced a novel attention mechanism. This approach enhances the discriminative power of important words over others based on the similarity among the words, drug candidates, and their relative positions in 2021. He implies that the model does not solely rely on general similarity from a broad feature set but accurately highlights specific attributes with predictive potential. However, these methods are based on similarity for DDIs prediction and may not capture the complex features of drugs.
Similarity calculation-based methods can swiftly identify drugs with analogous chemical structures or biological activities, thus forecasting potential interactions between them. This intuitive approach is easy to comprehend and implement. Some scholars advocate integrating similarity calculation methods with machine and deep learning. Moreover, it significantly improves the accuracy and interpretability of predictions in drug interaction studies. It also allows for fully utilizing multi-source data and features, constructing more comprehensive and robust predictive models.
2.2. Machine Learning and Deep Learning Approaches
With the universality of machine learning and deep learning, an increasing number of researchers have applied these technologies to drug research. These approaches are efficient for analyzing vast and intricate datasets. Moreover, these models are skilled at understanding the complex interactions within biological data, which often involve non-linear dynamics. The strength of machine learning and deep learning lies in their capacity to generalize from the data they have been trained on. This enables them to predict outcomes for new scenarios. For example, in the field of low-carbon transportation system analysis, a new perspective for achieving a more efficient transportation system has been provided [19]. This has been accomplished by integrating the CRITIC, DEMATEL, and deep learning features. This approach not only optimizes traffic flow and energy consumption but also offers strategies for reducing carbon emissions. Moreover, in the area of financial market forecasting, the meta-heuristic method based on a hybrid neural network has also demonstrated its effectiveness in predicting the global gold market [20].
Machine learning and deep learning also play a vital role in studying DDIs prediction. Song et al. [21] found that support vector machines based on similarity could enhance the predictability of DDIs in 2019. Jang et al. [22] used bagged tree regression in 2022, a machine learning method. It enhanced the accuracy and stability of predictions by combining multiple decision tree models. However, their feature engineering requirements and model capacity often limit machine learning approaches. In contrast, with their automatic feature extraction and robust architectural designs, deep learning methods can handle more complex data patterns. Thus, deep learning methods lead to higher predictive accuracy and better generalization capabilities.
In 2018, Ryu et al. [23] proposed the DeepDDI framework, which enabled DNN to learn the complex features of drugs. In 2020, Huang et al. [23] developed the CASTER framework, employing autoencoders and DDIs based on the chemical structures of drugs. By 2023, Gan et al. [24] expanded the application of DNNs, studying multi-source drug features. That same year, several innovative methods emerged, such as predictive methods utilizing drug sequences and substructure features [25] and models combining autoencoders with deep feedforward networks to enhance prediction accuracy [26]. In 2023, researchers also utilized deep learning-based transcriptome data analysis techniques, focusing on predicting drug interactions in diabetes [27]. Additionally, methods were predicting multiple types of DDIs based on deeply fused drug features and topological relationships [28].
Furthermore, applying GNN and CNN in this field has made significant progress. In 2021, Yu et al. [29] successfully overcame the issues of data incompleteness and sparsity through graph embedding techniques, providing a new solution for multi-label DDI prediction. In 2020, Chen et al. [30] demonstrated the potential of graph convolutional networks (GCN) in accurately predicting DDIs. In 2022, Ren et al. utilized knowledge graph and GNN, further advancing the development of multi-type drug interaction prediction [31,32]. In 2023, GNN-DDI and MFFGNN brought breakthroughs to DDI prediction technology through GNN-based phased feature extraction and multi-type feature fusion methods [33,34]. The CNN-Siam model learned the feature representation of multi-modal drug data through dual convolutional neural networks and predicts the types of drug actions [35]. Additionally, there are DDI prediction methods based on a framework that integrates joint deep convolutional transformation learning and decision forest fusion [36].
Although the existing models have achieved some results in DDIs prediction, currently there are some challenges in this field:
- Drug feature vectors are typically high-dimensional and contain complex information. Traditional deep learning methods, such as DNN, may need help to learn and comprehend the intricacies of these drug features fully. While DNN can capture non-linear relationships through their layered structures, more than they might be required to reveal all the interactions and dependencies present within drug characteristics. Transformer models, equipped with multi-head attention mechanisms, can more flexibly handle sequential data, considering both long-range dependencies and short-range patterns among input features. This mechanism is particularly well-suited for processing natural language and other types of sequential data. However, drug features may be within different semantic spaces, and direct integration could lead to the loss of some crucial information.
- Existing research needs to utilize known DDIs data, often for mere drug similarity assessments rather than delving into the shared mechanisms of interactions. Known DDIs can be used to deduce the commonalities in similar DDIs occurrences. Previous studies have not focused on the information behind DDIs, which may be key to understanding drug interactions.
- A research gap exists in considering the comprehensive impact of drugs’ intrinsic properties, metabolic pathways, and target site dynamics on DDIs. It is critical to understand the complex safety profiles in multi-drug therapies.
2.3. Improvements Made by MTrans
In order to address the shortcomings of the approaches discussed above, we made considerable improvements with respect to MTrans for the DDIs prediction:
- To gain a deeper understanding of drug characteristics and capture the relationships between them, we employ a transformer–encoder to learn representations of drugs. The transformer’s multi-head attention mechanism allows it to process information from various perspectives, enhancing the model’s comprehension of drug features. Furthermore, to address the semantic disparities across different drug features, we utilize an M-Transformer architecture consisting of three transformer–encoders. Specifically designed to learn and comprehend multi-source drug information, it generates an integrated representational vector. This multi-encoder method aids in consolidating information from various data sources, thereby achieving a more thorough representation of drug therapy.
- Existing studies primarily rely on known DDIs data to evaluate drug similarity. However, known drug–drug interactions (known DDIs) contain much more exploitable information. We constructed the DDIKG based on M-Transformer and used GNN to integrate drug information with similar effects. This approach aids in profoundly analyzing and understanding the shared mechanisms behind drug interactions.
- Taking into account the intrinsic properties of drugs, their metabolic pathways and targets, which significantly influence the occurrence of drug–drug interactions (DDIs). This study not only considers the structural characteristics of the drugs but also incorporates vital information involved in the absorption, efficacy, and metabolic processes.
3. Materials and Methods
3.1. Overview of Architecture
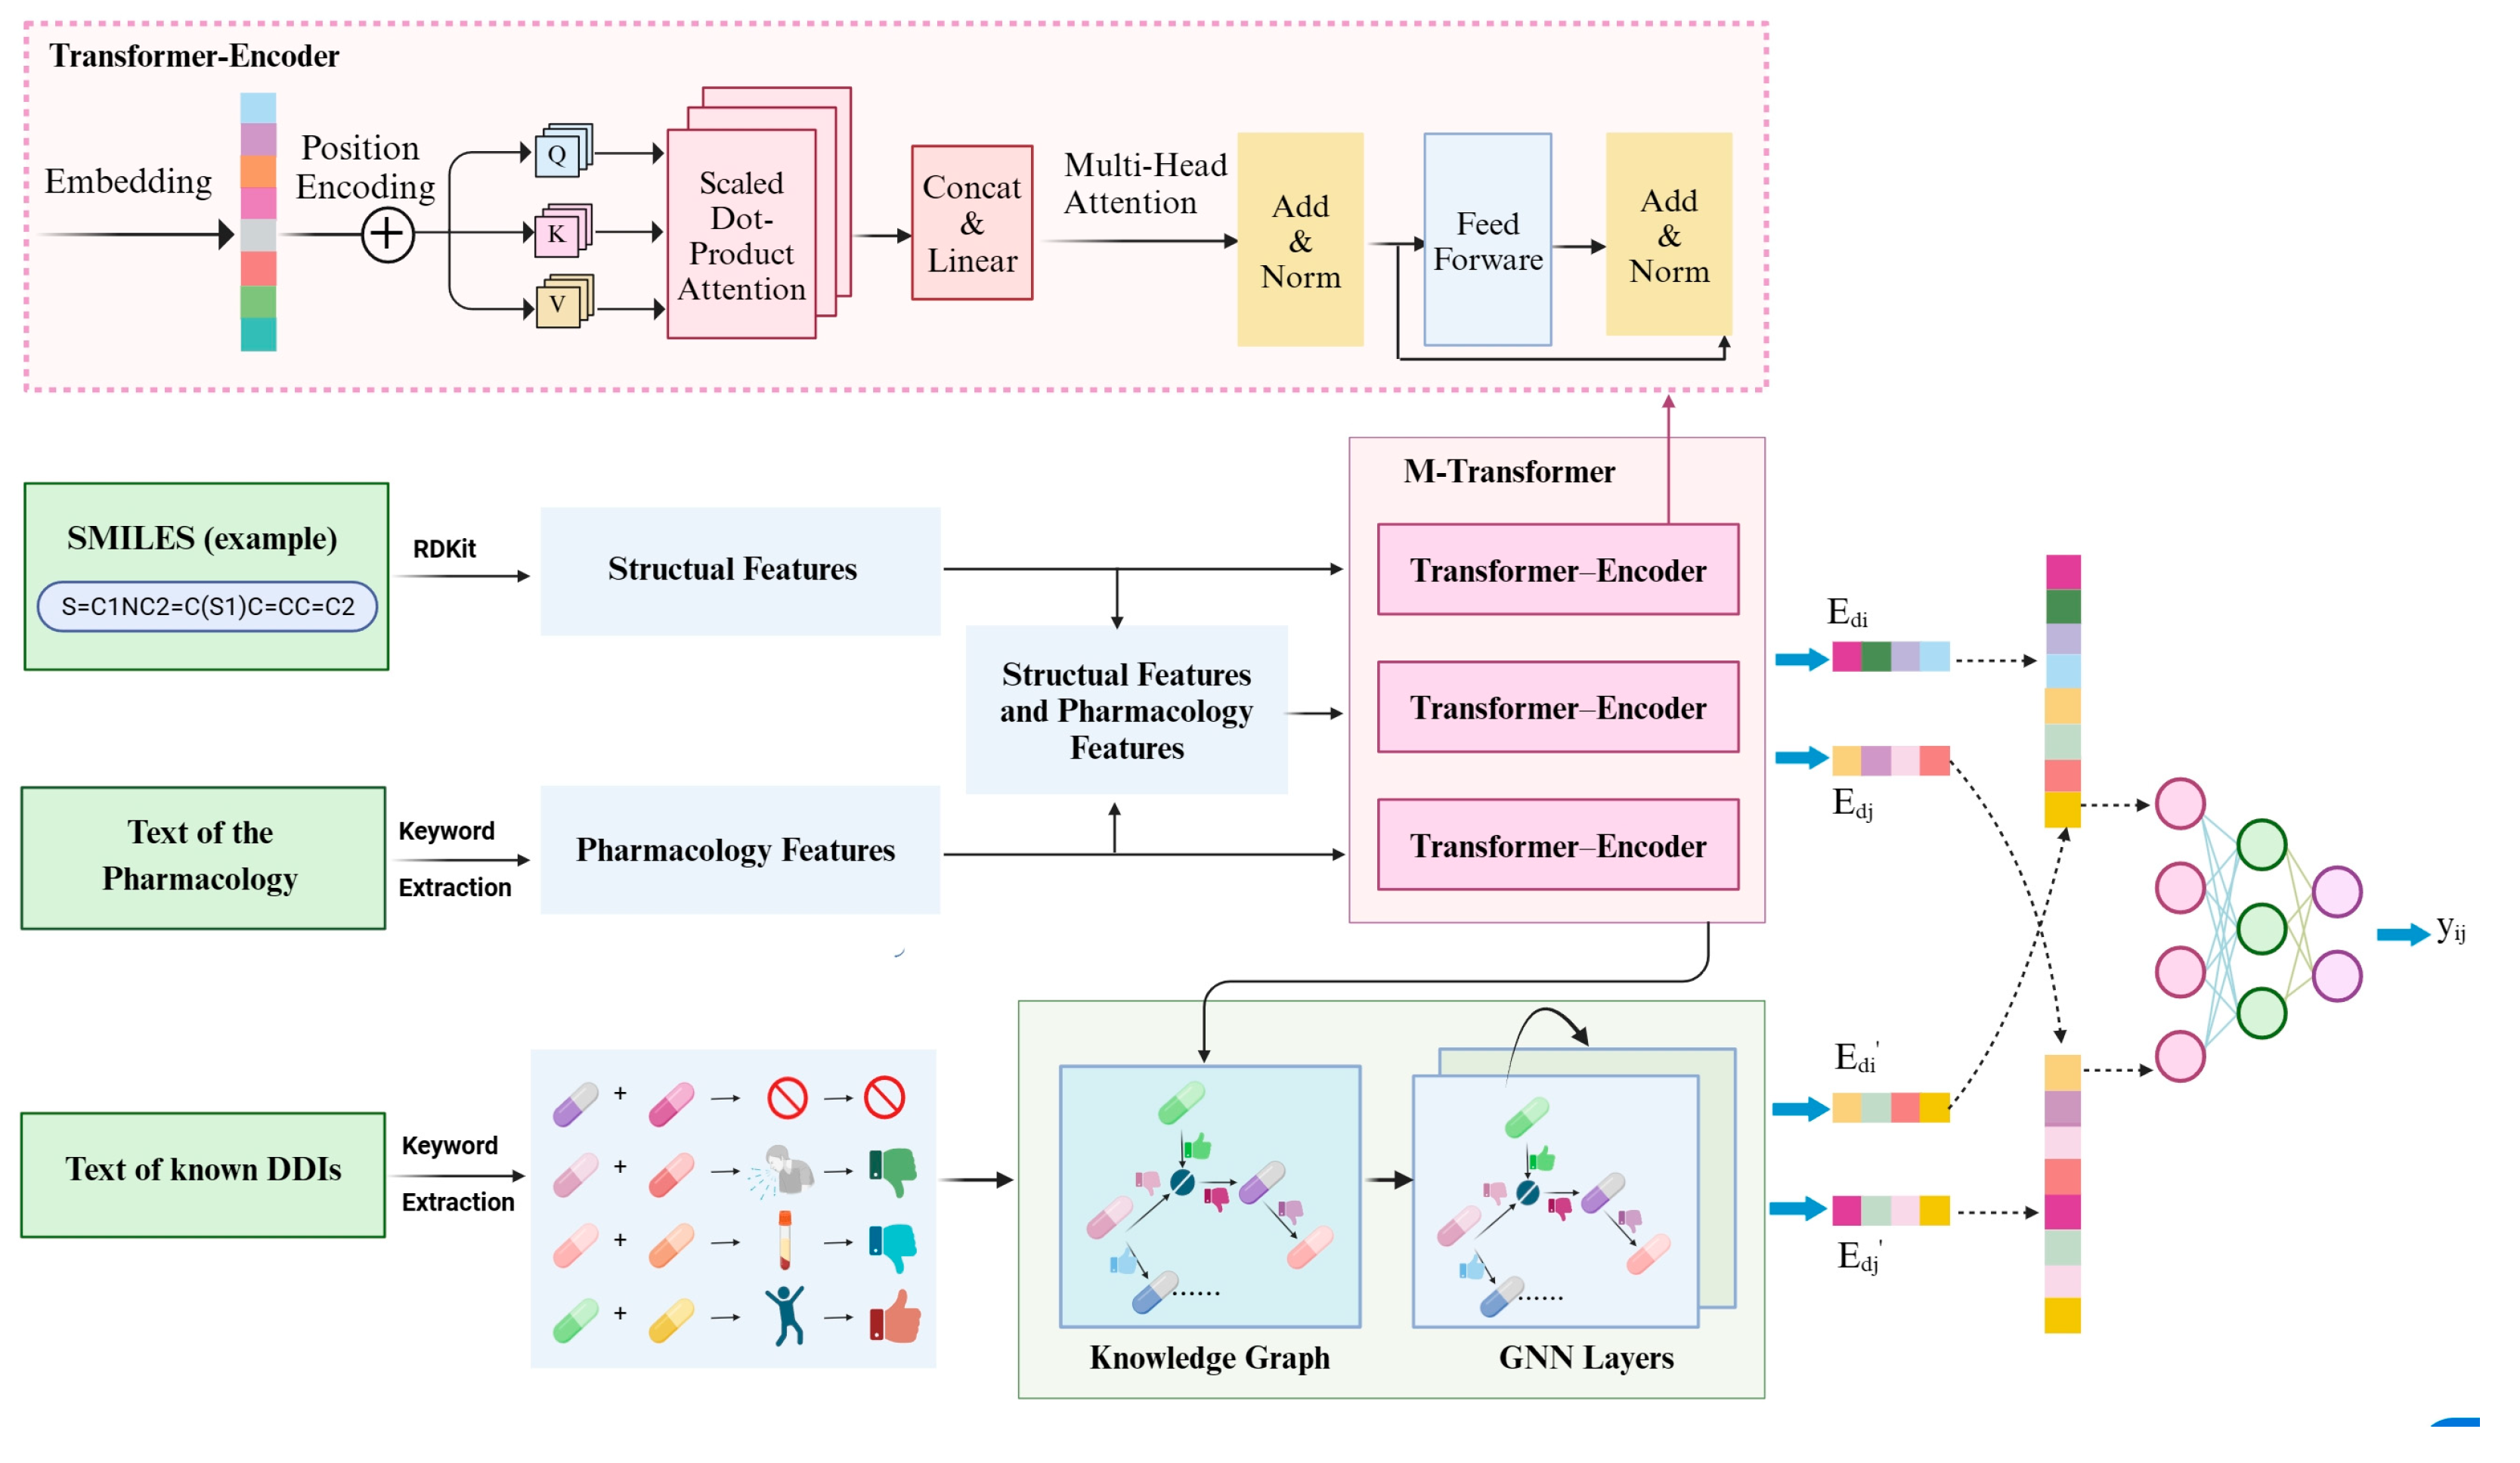
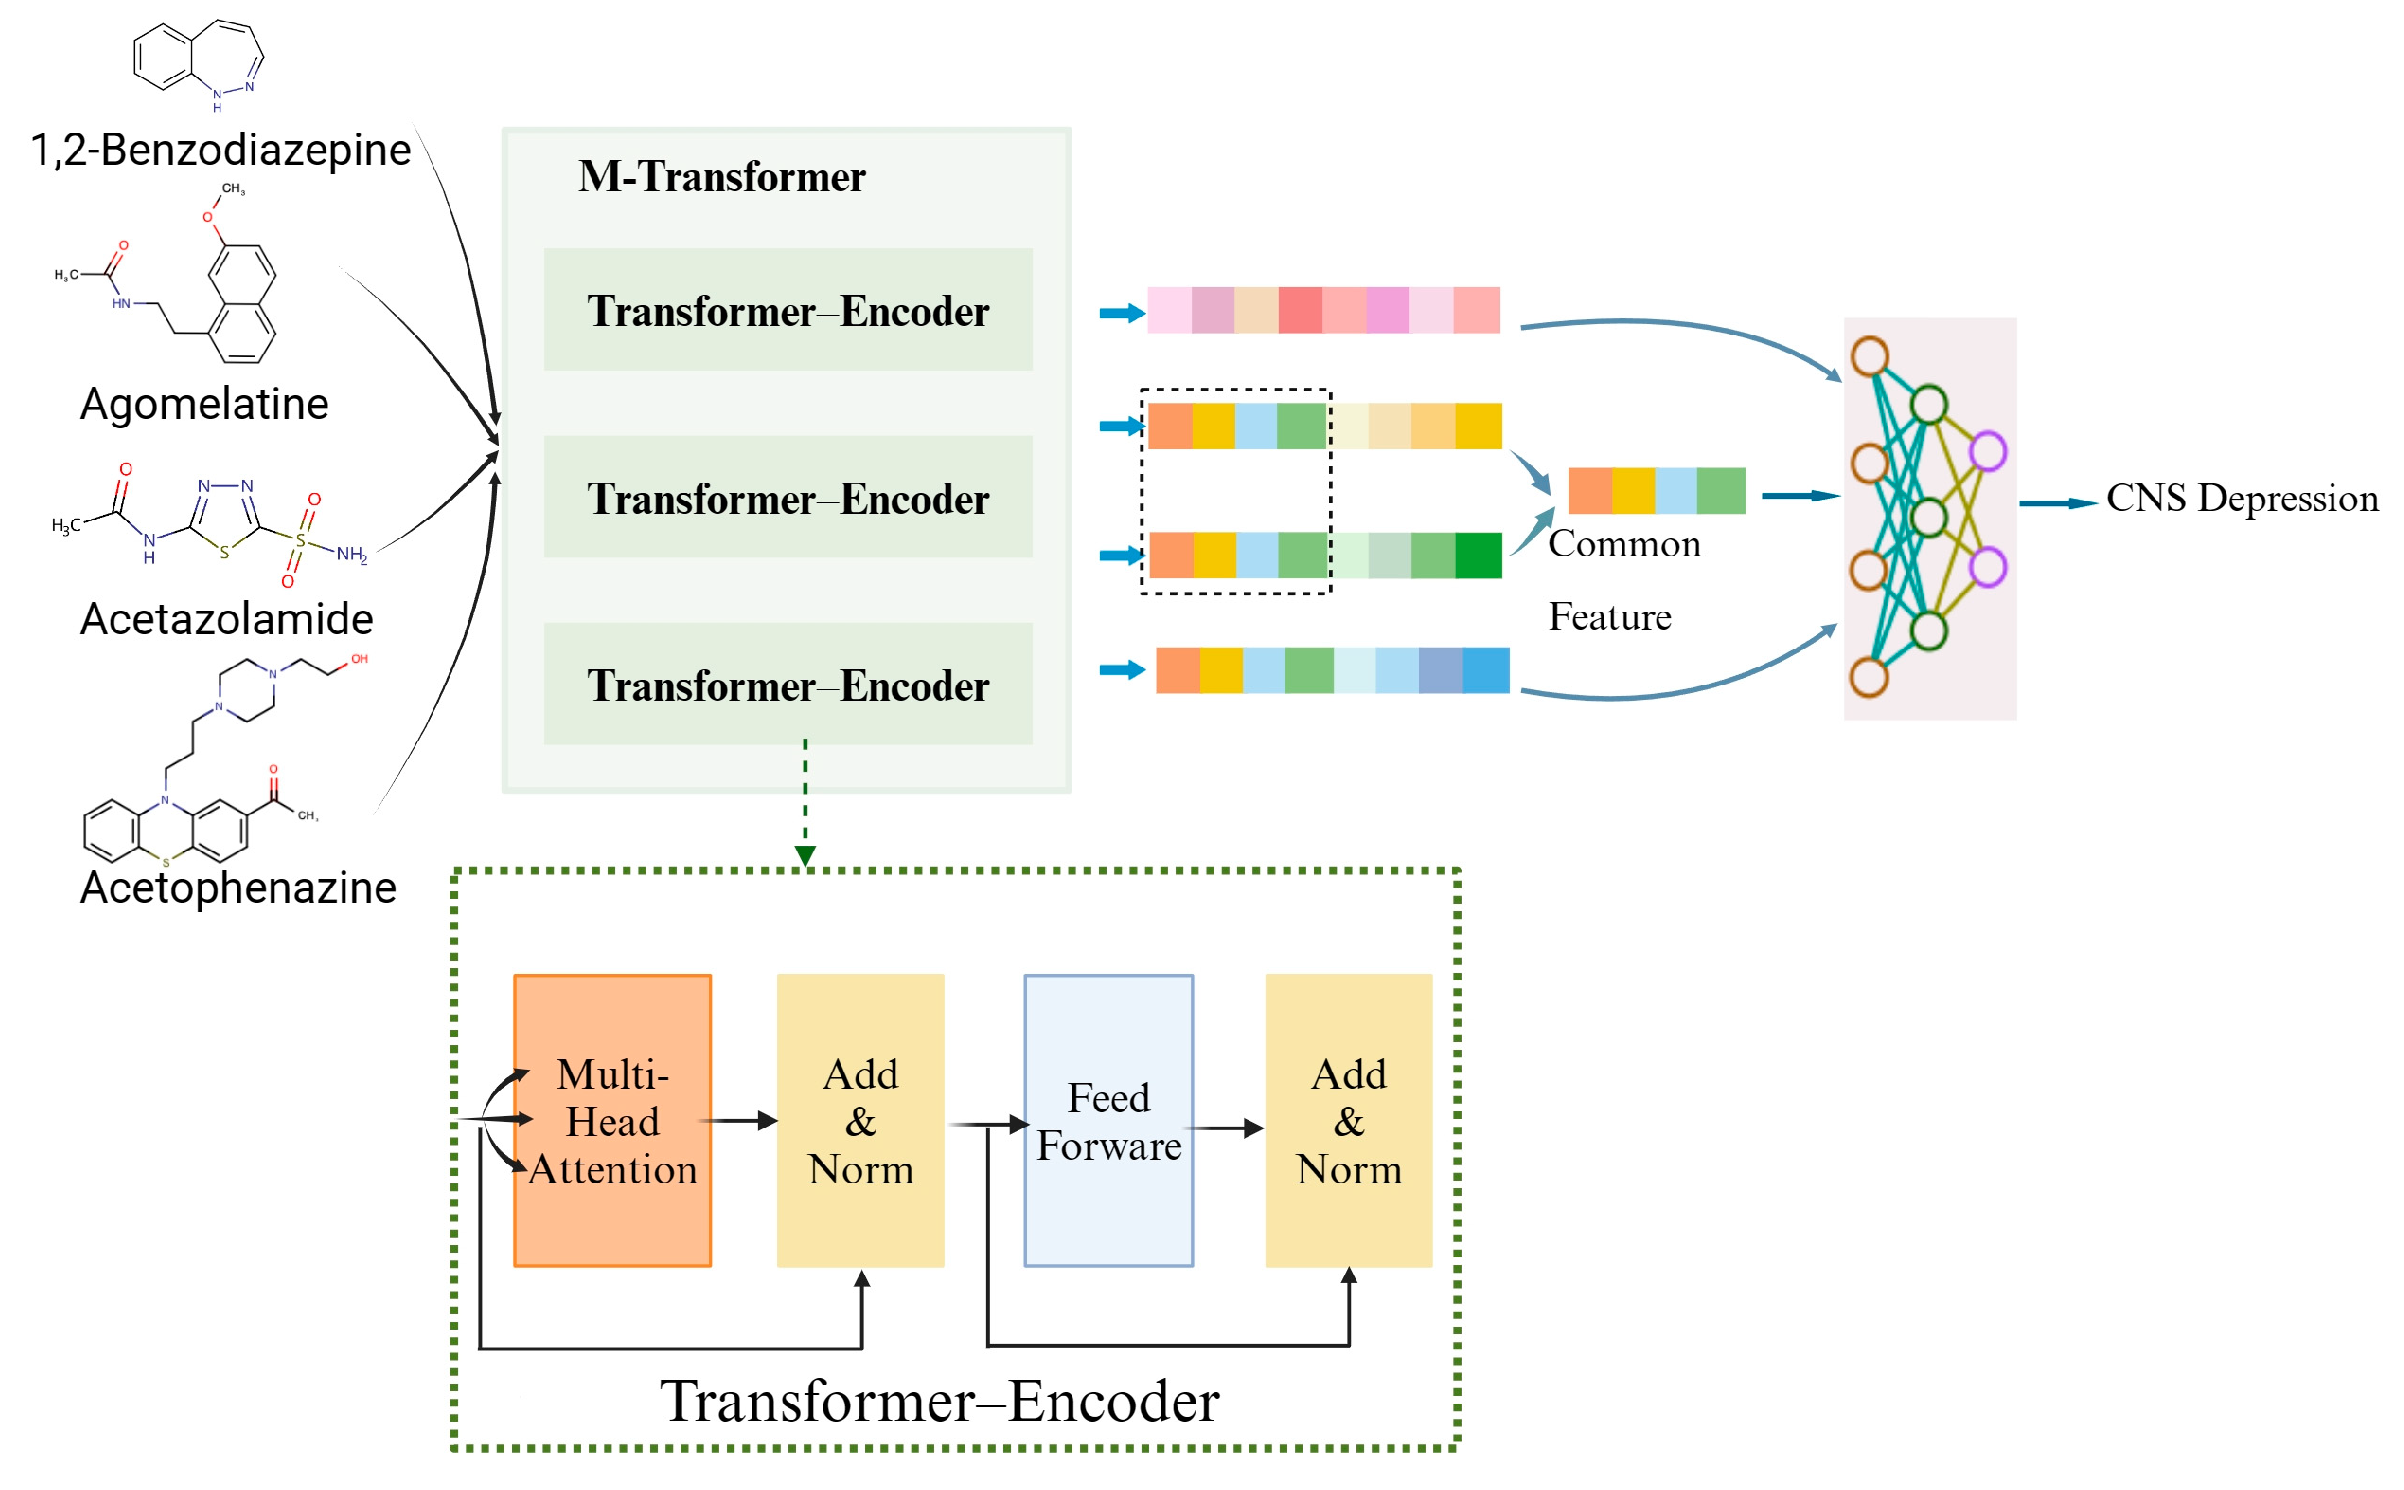
The outline of the overall architecture of our proposed MTrans model is shown in Figure 2. It consists of two core pathways and a neural network.
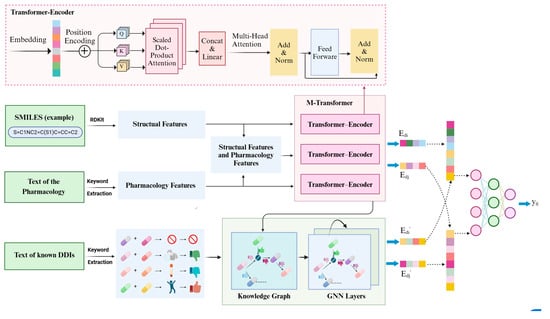
Figure 2.
Architecture overview of our proposed MTrans. (Structural features include molecular weight, bonding conditions, functional group, number of polar atoms; pharmacology features include drug type, toxic and side effects, enzyme, target).
- M-transformer-based pathway: Extracted functional group information, bonding structures, molecular weight, etc., from SMILES. Extracted drug types, enzymes, targets and other information from pharmacological texts. Vectorized and input into the M-transformer, which consists of three transformer–encoders and obtained drug representations.
- DDIKG-based pathway: Drug pair names and interaction types were extracted from pharmacological texts. Subsequently, leveraging drug representation vectors (obtained from the M-Transformer-based path) as nodes and interaction types as edges, we constructed the drug–drug interaction knowledge graph. Finally, GNN was utilized to extract common mechanisms of drug–drug interactions from the knowledge graph.
- Neural Fusion layers: Performed joint representation learning to explore cross-channel complementarity within multi-channel data.
3.2. M-Transformer-Based Pathway
3.2.1. Structural Features
SMILES from the DrugBank dataset (version 5.0) was utilized to extract the structural features of drugs. SMILES, which stands for Simplified Molecular-Input Line-Entry System, is a string-based encoding system for representing the structure of chemical molecules. It offers a concise and standardized way to denote the sequence of atomic connections and the nature of chemical bonds within a molecule.
The RDKIT package was employed to extract structural information for each drug, which allows us to obtain critical chemical information. The information contains functional group information, bonding structure, molecular weight, and the count of polar atoms.
Functional groups are one of the critical factors determining drug activity. Specific functional groups can interact with biological targets like enzymes and receptors, potentially triggering drug–drug interactions. Bonding structure information includes the molecule’s stereochemistry, which is vital for the activity and selectivity of the drug. In some cases, stereoisomers of a molecule can have entirely different biological activities. Molecular weight is also an essential factor that influences a drug’s absorption, distribution, metabolism, and excretion (ADME) properties. Many DDIs are related to the ADME processes, part of pharmacokinetics. Generally, drugs with lower molecular weights are more likely to cross biological membranes and have better pharmacokinetic properties. In addition, the count of polar atoms was extracted. It is a detail that is often overlooked but plays a significant role in drug–drug interactions. Polar atoms, such as oxygen and nitrogen, can form hydrogen bonds, affecting the solubility and stability of drug molecules within the body.
where represents the structural features of drugs. represent the molecular weight, bonding profile, functional group composition, and number of polar atoms of the drug, respectively.
3.2.2. Pharmacological Features
Pharmacological information texts were sourced from the DrugBank Dataset. Therefore, we used keyword extraction to identify the needed features and then converted them into numerical forms. This includes the type of drug, targets, enzymes, and toxic side effects.
The drug type can assist in classifying drugs, such as antibiotics, anti-inflammatory drugs, analgesics, etc. Different categories of drugs may have different interaction patterns. There may be a higher probability of interactions between certain types of drugs and understanding drug types can help predict potential DDIs.
The target of a drug is the biomolecule, such as proteins, receptors, or enzymes. Understanding the drug’s target helps to comprehend its mechanism of action and possible interactions. If two drugs act on the same target, there may be competitive inhibition or synergistic effects, leading to an increase or decrease in drug concentration in the body. If the drug concentration in the body is too high, it may result in drug toxicity or other severe side effects.
Additionally, enzymes play a crucial role in the absorption, distribution, metabolism, and excretion of drugs. Some drugs need to be converted into their active form by enzymes in the intestine after oral administration. Then, they can be absorbed into the bloodstream. Drugs may be metabolized by enzymes in the intestine or liver before absorption, known as the first-pass effect, which can reduce the bioavailability of the drug.
Enzymes are also the main catalysts for drug metabolism. Different drugs may be metabolized by different enzymes, producing active or inactive metabolites, affecting the efficacy and toxicity of the drug. Drugs and their metabolites are excreted through the kidneys. Certain enzymes are involved in regulating the filtration, secretion, and reabsorption of drugs in the kidneys.
Beyond this, understanding the toxic side effects of drugs helps assess the potential increased risks when drugs are used in combination. Some toxic side effects may be related to the mechanisms of drug interactions, such as hepatotoxic drugs that may interact with other drugs metabolized by the liver. The pharmacological features are defined as follows:
where represents pharmacological features of drugs. represent drug types, toxicities, enzymes, and targets, respectively.
3.2.3. Structural and Pharmacological Features
There is a close connection between the structural and pharmacological features of drugs. And these features are also interdependent and interconnected within themselves. The structural and pharmacological features of drugs are concatenated, with the specific formula as follows:
where indicates the characteristics of the drug and consists of and .
3.2.4. M-Transformer
- M-Transformer: M-Transformer consists of three transformer–encoders. The transformer model, which comprises an encoder and a decoder, excels in processing sequence data and understanding context. Since the representation of drug characteristics can also be conceptualized as a sequence, we utilize the transformer–encoder to interpret the characteristics of drugs. Then, we can achieve a superior representation of drugs.where consisting of , , and . The function was utilized to normalize the outcome. Utilizing the previously mentioned multiple-head attention, the drug’s representation was obtained.
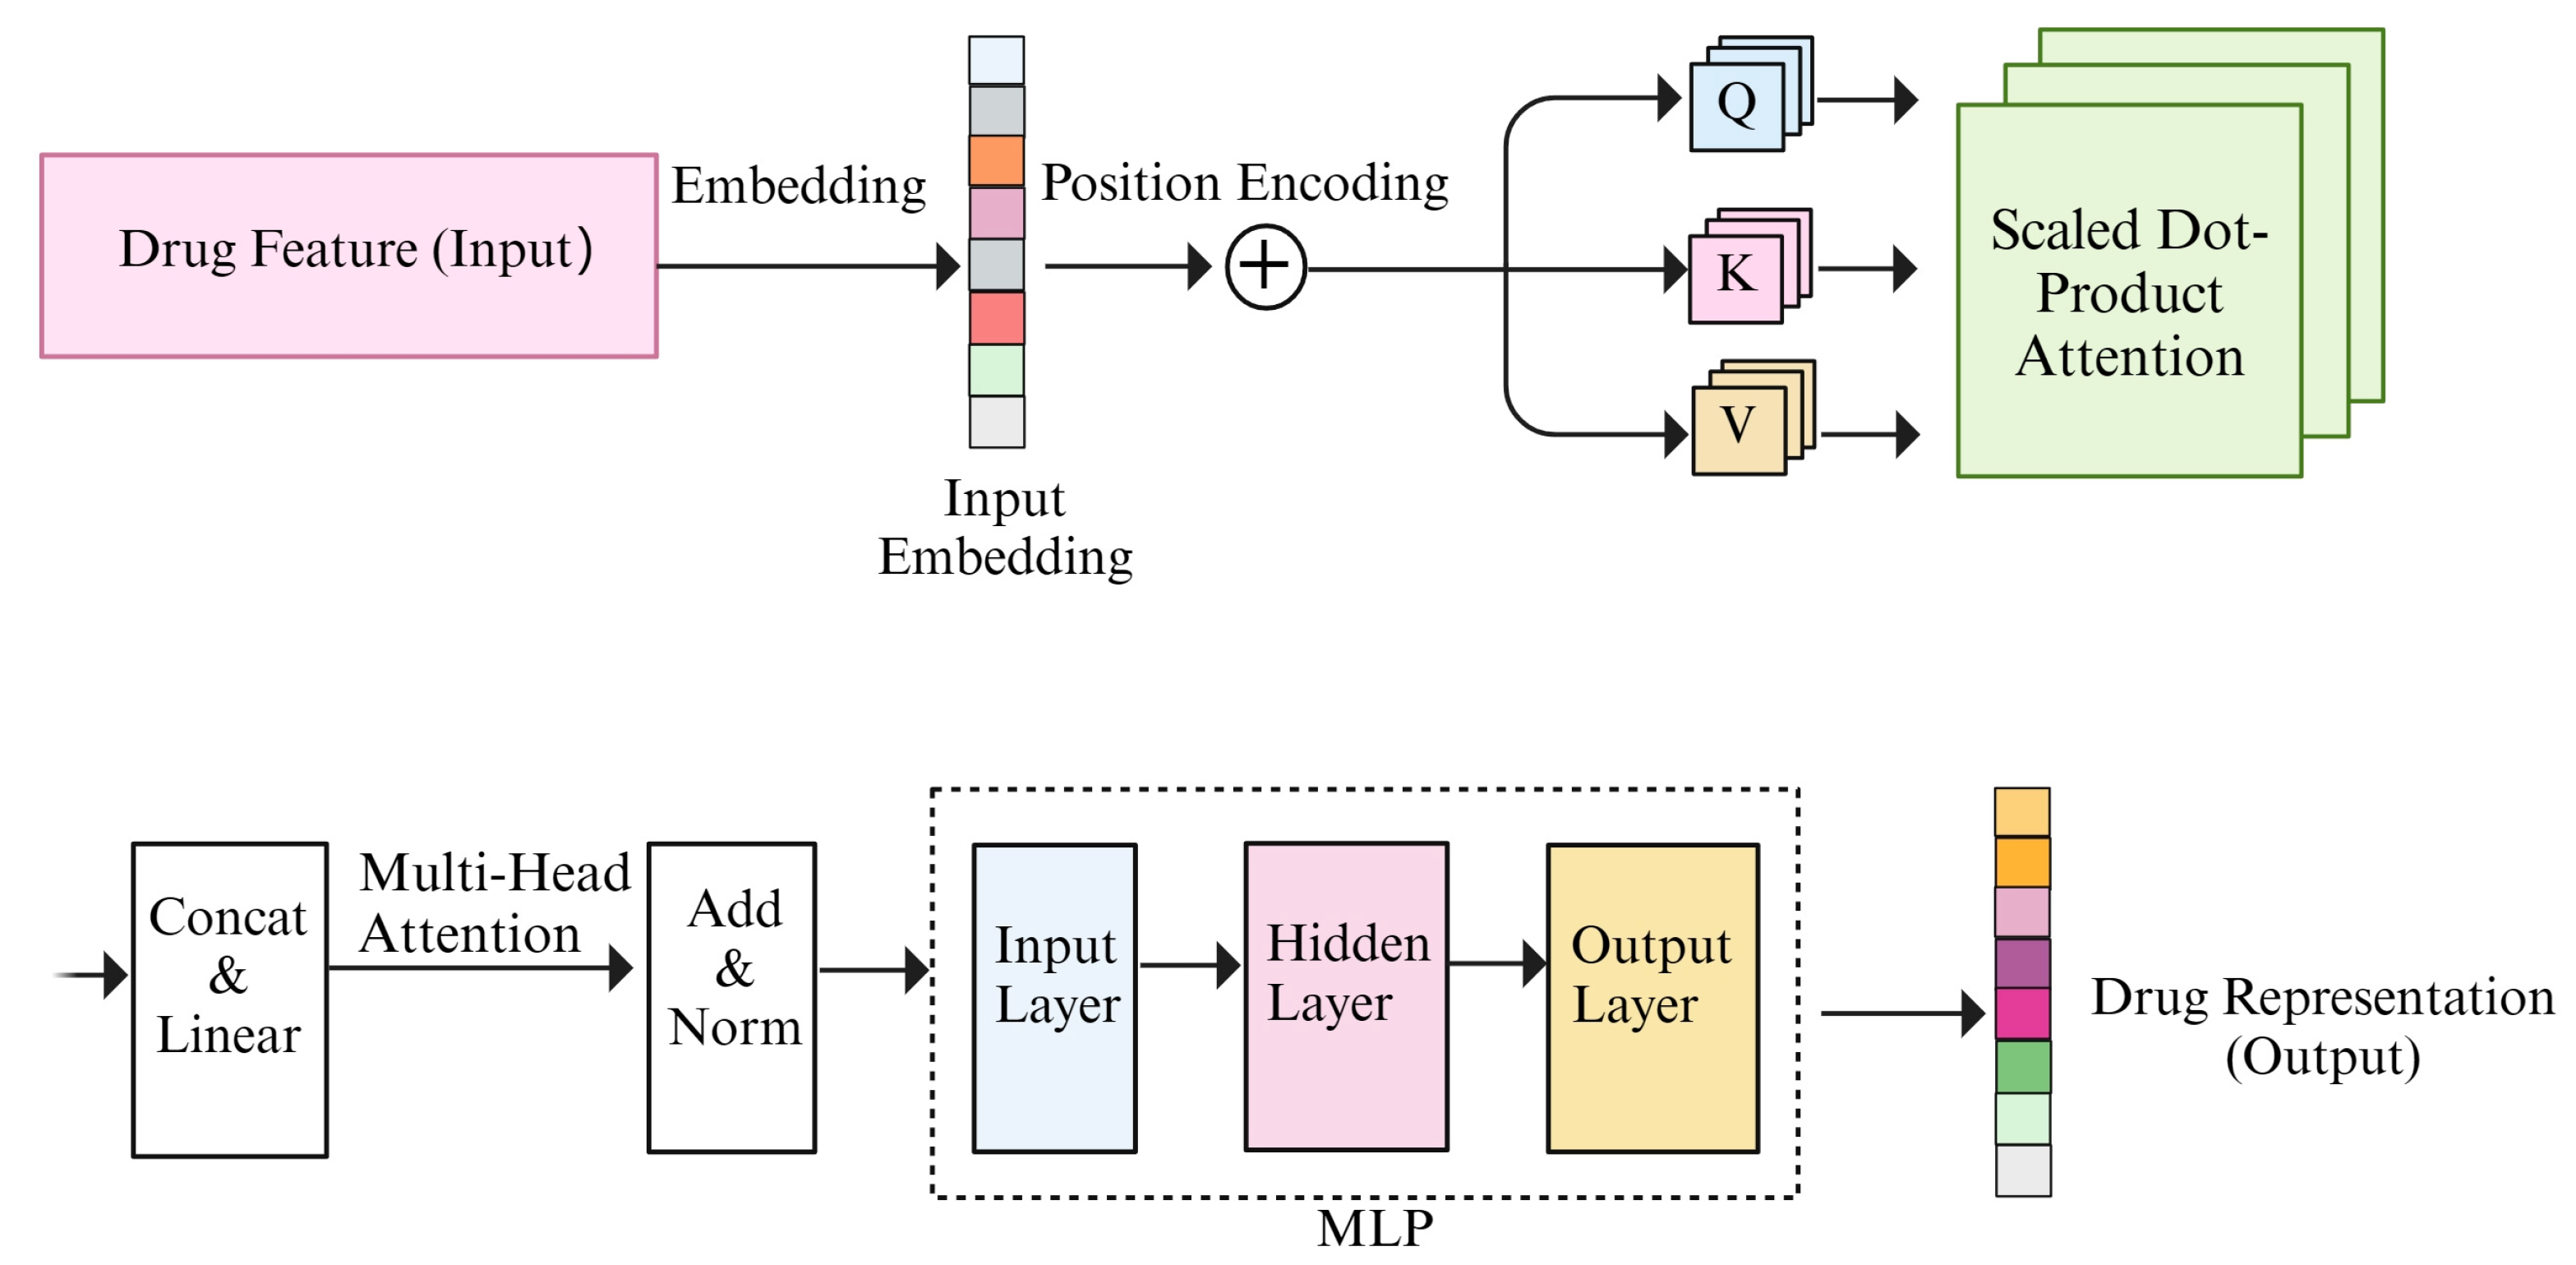
- Transformer–encoder: The improved comprehension of the transformer–encoder is due to the inclusion of a multi-head attention mechanism. And the multi-head attention mechanism consists of a number of self-attention modules.
For each self-attention module, a number of steps are performed, including adding positional coding, calculating Q (query), K (key), and V (value); calculating attention scores and weights; and determining the final output. Furthermore, each set of Q, K, and V can compute a Scaled Dot-Product Attention. The specific formula is as follows:
where the dimension of the key is and scaling the attention weights requires dividing by . We fed the feature vectors of drugs as sequential data into the transformer–encoder, incorporating positional encoding. Subsequently, utilizing the weight matrices , , and , the Q, the K, and the V were computed separately. If the query and key are more similar, indicating higher similarity, the attention weight assigned to that position will be larger. Therefore, the attention weights were multiplied with V and summed to obtain the final attention output. Attention scores was computed using , followed by applying the SoftMax function to calculate attention weights.
Each attention head incorporates a self-attention mechanism. After computing the attention outputs for multiple attention heads, these outputs were merged by concatenation. Subsequently, a final linear transformation was performed using a weight matrix . The formula for the multi-head attention mechanism is as follows:
where the projections are parameter matrices , , and . The outputs of each attention head are connected using the concat function. And the transformer–encoder process is shown in Figure 3.
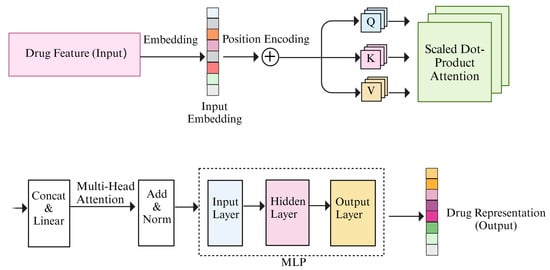
Figure 3.
Illustration of the transformer–encoder.
Finally, the LayerNorm function was utilized to normalize the outcome. Utilizing the previously mentioned multiple-head attention, the drug’s representation was obtained. The formula is as follows:
3.3. DDIKG-Based Pathway
3.3.1. Known Drug–Drug Interactions
Data mining and information extraction techniques were applied to extract textual information describing drug interactions from the known DDIs’ text data in the DrugBank dataset. This includes identifiers for drug pairs and the textual descriptions of the interactions between them. Subsequently, keywords were extracted from the text information of drug–drug interactions, yielding the names of drug pairs involved in DDIs and the types of interactions.
3.3.2. DDI Knowledge Graph
The known DDIs were utilized to construct the knowledge graph, where the nodes of the knowledge graph are the representation vectors of the drug obtained through the M-Transformer-based pathway. And the edges of the knowledge graph are the interaction types of known DDIs. And the drug–drug interaction knowledge graph was defined, denoted by:
where the set of head entities is represented by , the set of tail entities by , and the set of relations between the head and tail entities by . The head entity and tail entity refer to the expressions of drugs involved in DDIs. These expressions are obtained through the transformer-based pathway. The relation signifies the type of interaction between this pair of drugs.
3.3.3. The GNN Layers
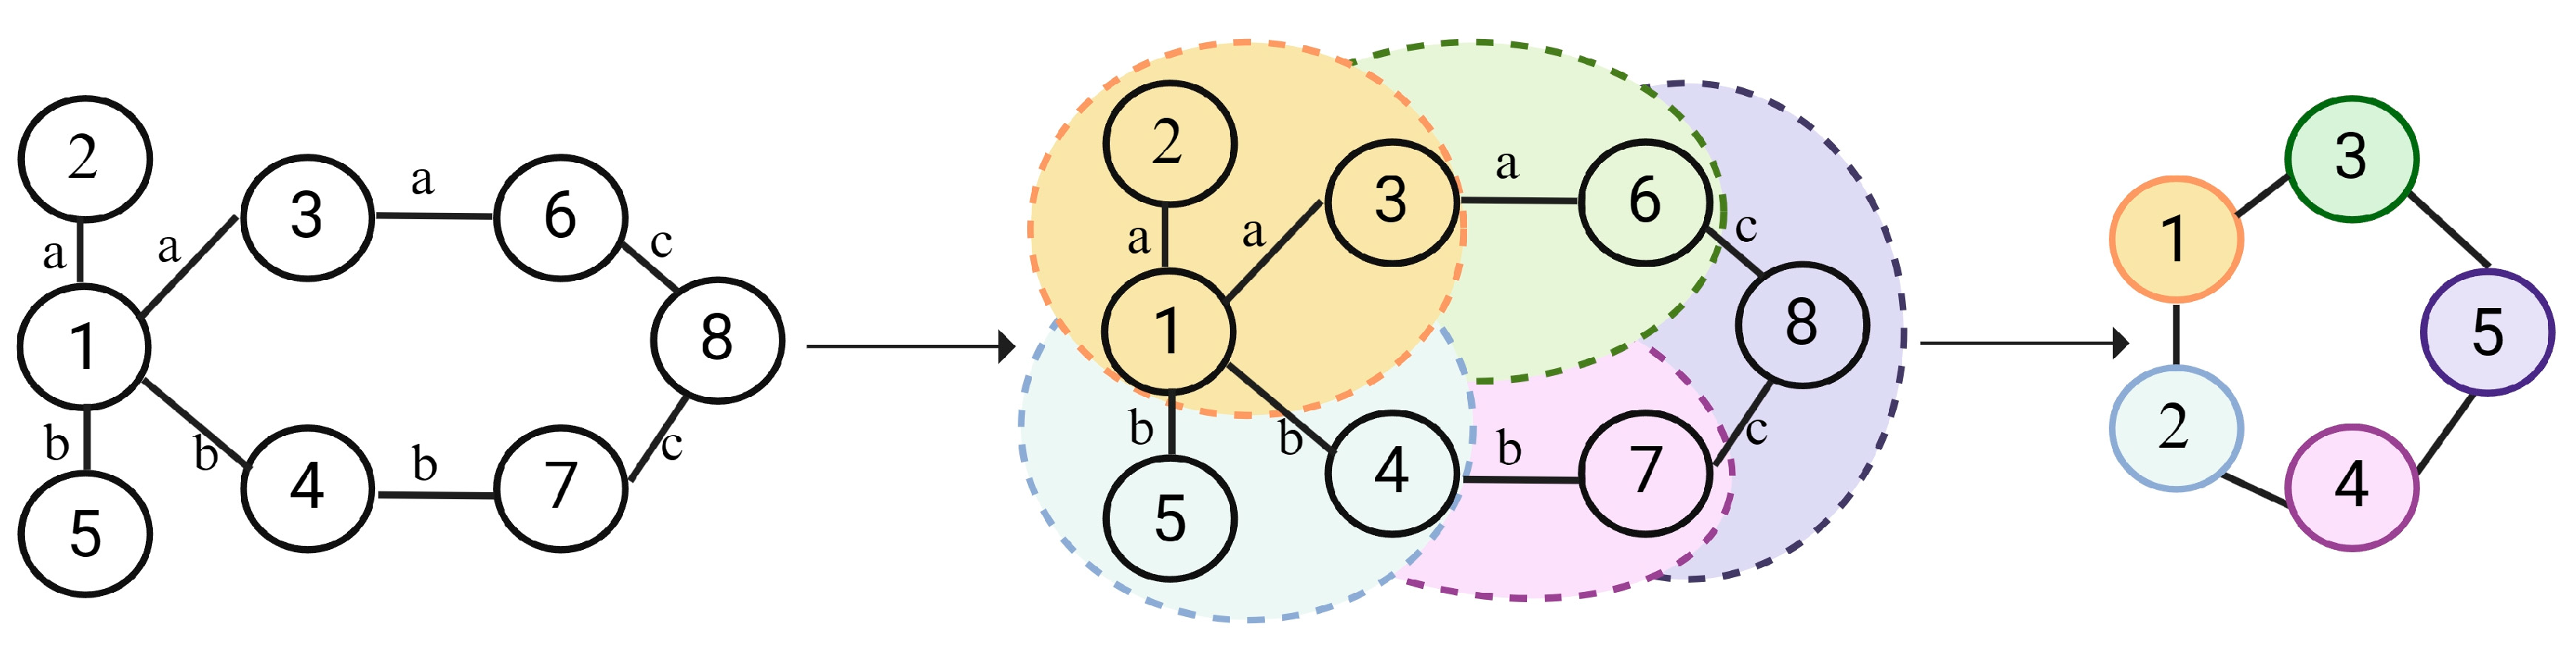
The GNN layer was used to extract structural and contextual information from the knowledge graph. Figure 4 illustrates the principle behind how GNN captures shared interaction information for known DDIs. Nodes with similar interactions need to be aggregated. Taking node 1 of Figure 4 as an example, we need to aggregate the common information of node 2 and node 3. And we need to aggregate the common information of node 4 and node 5.
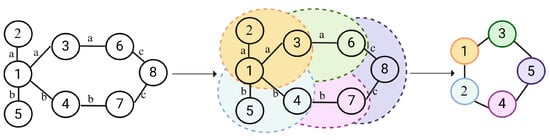
Figure 4.
Illustration of the GNN. (For each drug node within the drug–drug interaction knowledge graph, identifies domain nodes with same edge types and perform aggregation. For instance, both node2 and node3 have interaction A with node. Therefore, we need to explore the similarities between node2 and node3.)
The initial representation matrix of the knowledge graph G is as follows:
where serve as the initialization of head entity embedding, relation embedding, and tail entity embedding, in which d is the dimension of entity and relation embedding. Here, , and denote the number of drugs, relations, and tail entities in the DDIKG.
where l is set to 1. To gather information about the common properties of each node in relation to similar or identical edges corresponding to tail entities, one only needs to aggregate information from one layer. The function AGG is utilized to gather the common properties of multiple points. Additionally, aiming to gather information related to tail entities for similar or identical edges, must define a method to achieve this. Here, represents all drugs where drug i has type s interactions.
Finally, using the aggregation function, the drug’s embedding and its neighborhood embedding were aggregated into vectors with the following formula:
where σ is the activation function ReLU and is the trainable weight matrix. The concatenation operation is ⊕. Similarly, can be obtained with this.
3.4. Neural Fusion Layer
The DDIKG-based pathway and the transformer-based pathway can be realized to provide complementary information. Therefore, we used fusion layer which connects and together as the embedding of drug . The equation can be described as:
Thus, we obtained the embedding which contains the structural information, pharmacological information and DDIs information of the drug. Finally, the probability of a DDIs between drug i and drug j with the type of DDIs can be predicted by inputting the embedding of drug i and drug j into the neural network. The DDIs forecast formula is as follows:
where q is the number of complete connected layers, is the bias vector and is the trainable weight matrix. The activation function SoftMax is denoted by .
For model optimization, batch normalization layers were incorporated to accelerate convergence and dropout layers were introduced to prevent overfitting and enhance generalization. Cross-entropy was used as the loss function for the empirical training and optimization of the MTrans model. In addition, L2 regularization was used to prevent model overfitting.
4. Experiment
4.1. Experimental Setup
4.1.1. Dataset
In order to verify the validity of the model, sufficient experiments were conducted on a real dataset. We used the DrugBank [37] and KEGG datasets [38]. The DrugBank dataset includes 3743 drugs and 153,433 pairs of known DDIs for the construction of drug representations and KG, respectively. The KEGG dataset includes 1925 drugs and 38,983 pairs of known DDIs.
4.1.2. Evaluation Metrics
A number of measures are used to evaluate predictive performance, including Acc (accuracy), AUPR (area under the precision-recall curve), AUC (area under the curve), F1 (F1 score), Pre (precision), and Rec (recall). These metrics can provide information on a number of different aspects. They help us to better understand the performance of the model. Of these, AUC and AUPR are defined as follows.
AUPR: The AUPR metric quantifies the area under the precision-recall curve, which is critical for evaluating models on unbalanced datasets. Like the AUC, the precise value of the AUPR is usually derived through graphical analysis rather than a simple mathematical formula.
AUC: This metric measures the area under the receiver operating characteristic (ROC) curve, which plots the true positive rate (TPR or recall) against the false positive rate (FPR). An AUC close to 1 indicates superior model performance. The area of the ROC curve is usually calculated using a graphical method rather than a direct formula.
The other metrics are defined as follows:
4.1.3. Computational Resource
In our study, to train the DDIs model, we employed a dedicated computational server outfitted with advanced graphics processing units (GPUs). The specific configuration includes two NVIDIA RTX 4090 GPUs, each with 24 GB of VRAM, coupled with a 10-core Intel Xeon 4210R CPU and 512 GB of DDR4 RAM. Our system operates on the Ubuntu 20.04 LTS operating system, with CUDA version 11.7. The deep learning framework employed is PyTorch 1.13.0.
4.2. Ablation Study
To explore the pathways based on M-Transformer and the DDIKG, we performed ablation studies on our MTrans model with respect to these two pathways. Moreover, most current models for DDIs prediction use structural information of drugs, neglecting other useful information. Our model innovatively incorporates pharmacological information and combines both structural and pharmacological information. Therefore, in this section, we also performed ablation studies on various drug information to verify the necessity of pharmacological information and the combination of pharmacological and structural information.
- In the first ablation study:
- MTrans utilizes both the M-Transformer-based and DDIKG-based pathways to predict DDIs.
- MTrans_DDIKG does not employ the transformer–encoder to understand the interconnections within pharmacological and structural information. It simply concatenates the extracted drug features and pharmacological features, then uses the knowledge graph and graph neural network-based pathway to extract the common mechanisms of DDIs. Predictions of DDIs are made based on the information obtained by the above methods.
- MTrans_Trans does not use the knowledge graph and graph neural network to further learn the connections between DDIs events. This model solely relies on multiple transformer–encoders to learn drug representations for predicting DDIs.
- In the second ablation study:
- MTrans uses structural information, pharmacological information, and combined structural-pharmacological information, learning representation vectors for each through three separate transformer–encoders.
- MTrans_2features uses structural and pharmacological information, learning representation vectors for each through two separate transformer–encoders.
- MTrans_1feature uses only structural information, learning its representation vector through a single transformer–encoder.
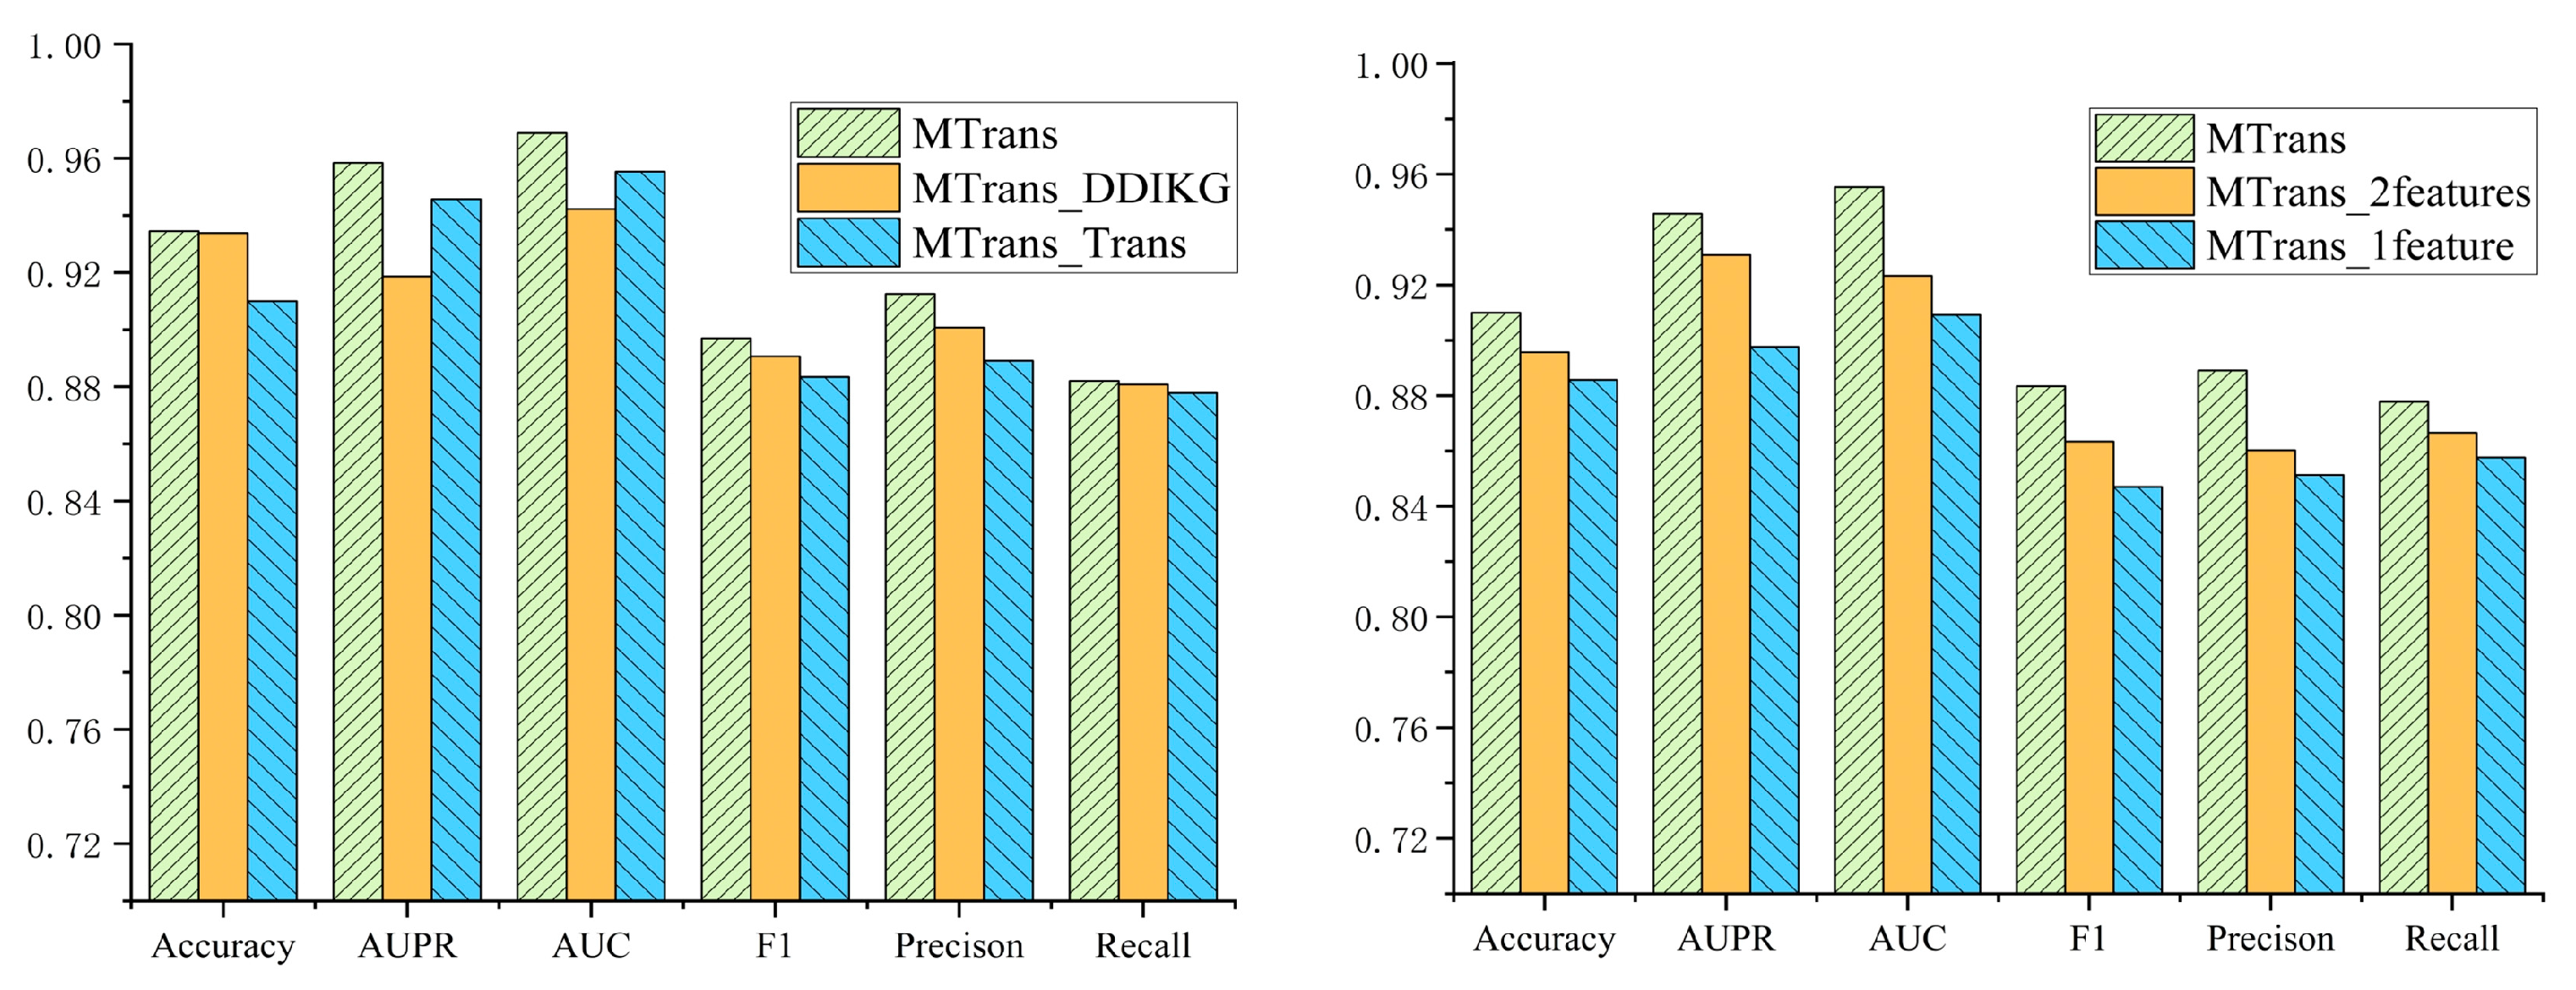
Figure 5 displays the results of the two ablation studies. In the first ablation study, we compared the MTrans model with the MTrans_DDIKG and MTrans_Trans models across six metrics: Accuracy, AUPR, AUC, F1, Precision, and Recall. The MTrans model outperformed the MTrans_DDIKG model by 0.15%, 3.98%, 2.67%, 0.84%, 1.38%, and 0.28%, respectively, and outperformed the MTrans_Trans model by 2.45%, 1.27%, 1.35%, 1.41%, 2.34%, and 0.58%, respectively.
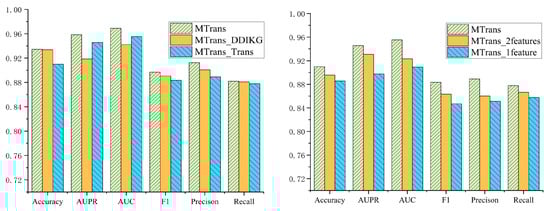
Figure 5.
The results of the ablation experiments.
In the second ablation study, we compared the MTrans model with the MTrans_2 features and MTrans_1 feature models across the same six metrics. The MTrans model outperformed the MTrans_2features model by 1.43%, 1.51%, 3.21%, 2.00%, 2.88%, and 1.12%, respectively, and outperformed the MTrans_1feature model by 2.43%, 4.81%, 4.62%, 3.64%, 3.78%, and 2.02%, respectively.
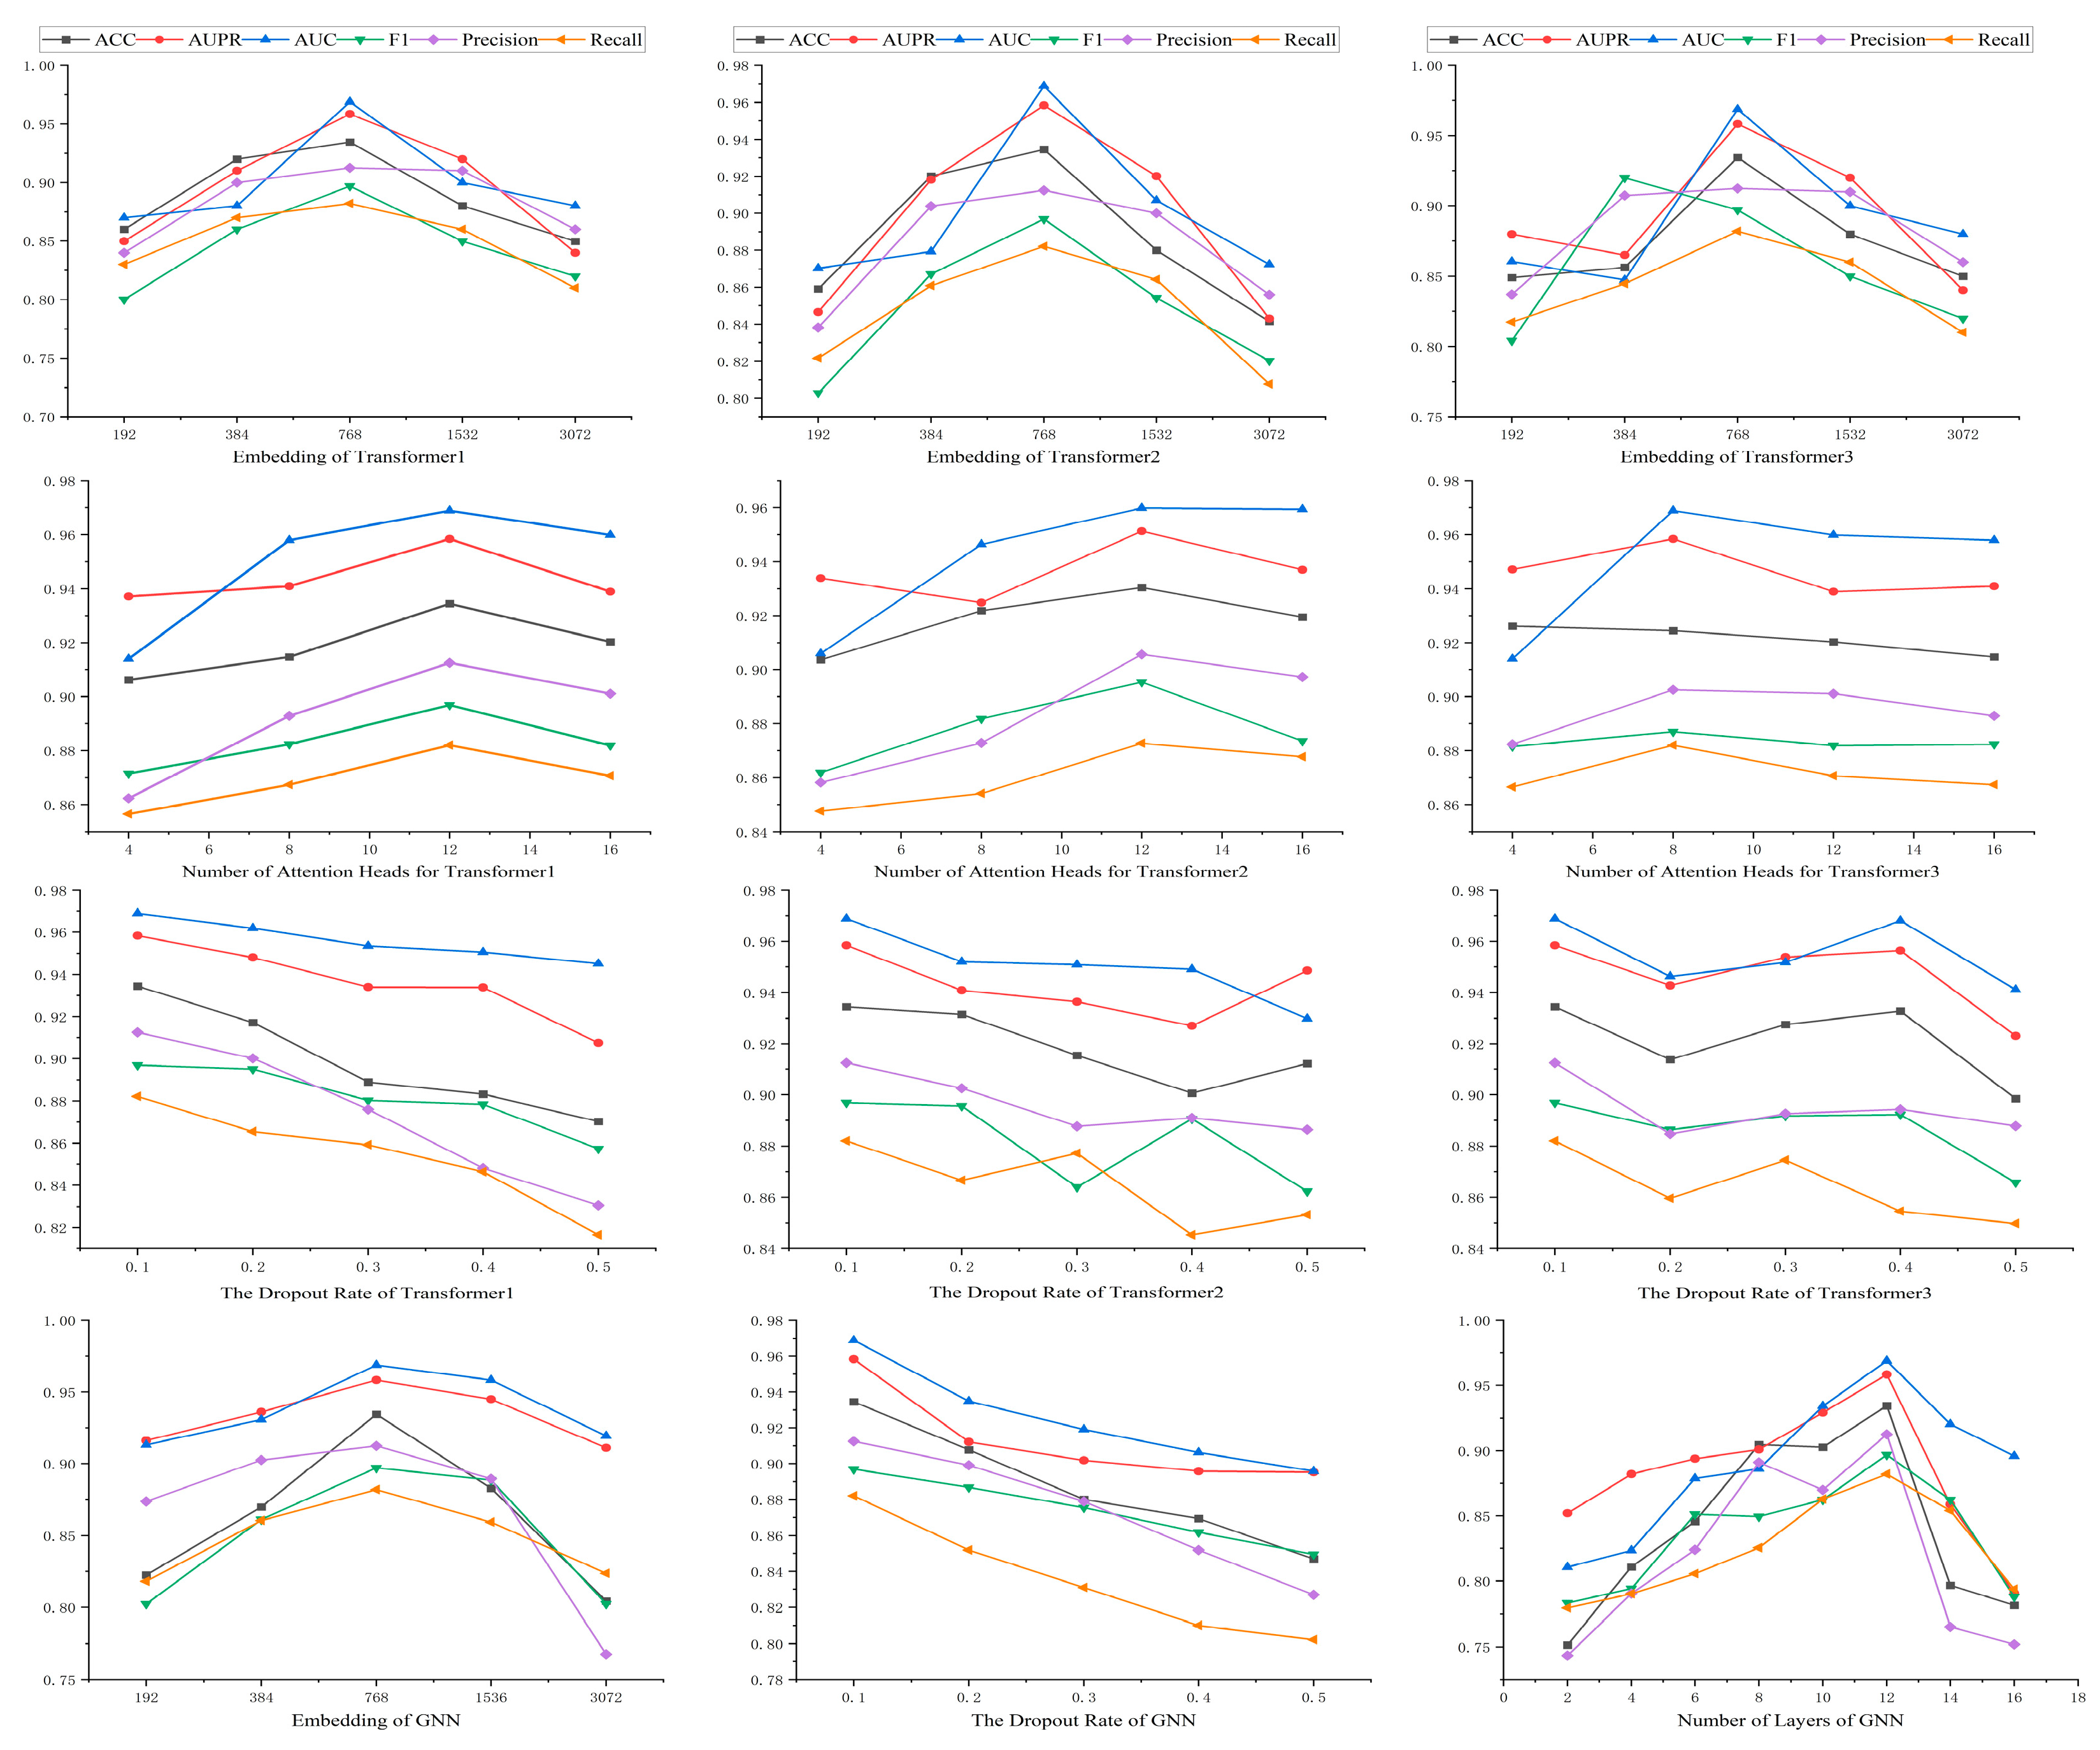
4.3. Parameter Sensitivity Analysis
In this work, there are 12 basic parameters, which are the dimensions of the three transformer–encoders, the number of attention heads and the dropout rate, as well as the dimensions, layers, and dropout rate of the GNN. The results are shown in Figure 6. This parametric experiment was performed on the DrugBank dataset.
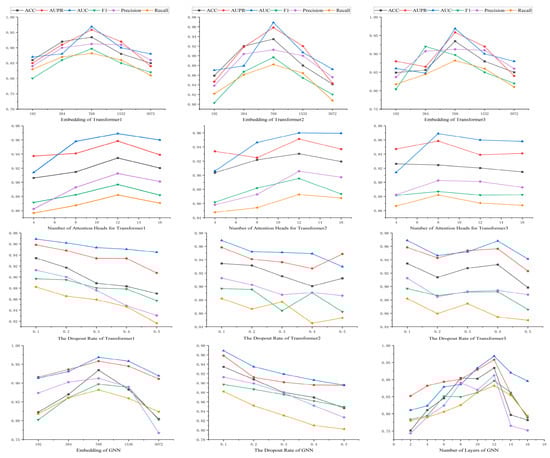
Figure 6.
The results of the parameter experiment.
The impact of the embedding dimension across three hidden transformer layers was investigated. The value of the embedding dimension varied from 192 to 3072. As shown in Figure 6, all three of our transformer models exhibited optimal performance when embedding dimension is 768. Although increasing embedding dimension can enhance representational capacity, a value of embedding dimension that is too large can lead to overfitting issues in the model. The choice of 768 provides adequate representational capacity to capture the complexity of drug features while avoiding overfitting problems associated with excessively high dimensions. A moderate embedding dimension can balance the model’s generalization ability and computational efficiency.
The effect of the number of attention heads on model performance was also examined by adjusting it (from 4 to 16). As illustrated in Figure 6, in the first and second transformer models, the model performed best with 12 attention heads. In the third transformer model, the model performed best with 8 attention heads. This indicates that different models may require different numbers of attention heads to most effectively capture different features in the data. Increasing the number of attention heads can provide more parallel processing power. It helps the model to understand the data from different perspectives. But too many attention heads may lead to a waste of computational resources and overfitting.
Furthermore, we studied the effects of the dropout rate on the three transformer models. All models performed best when the dropout rate was 0.1. Dropout is a regularization technique that prevents overfitting by randomly dropping out neurons in the network. A dropout rate of 0.1 is a balancing point that reduces overfitting without excessively impairing the network’s learning ability.
Lastly, we explored the impact of the embedding dimension, dropout rate, and number of layers in the graph neural network. The model performed best with an embedding dimension of 768 and a dropout rate of 0.1 and 12 layers. A moderate choice of embedding dimension helps the GNN capture the complex relationships of drug features, while an appropriate dropout rate also helps prevent overfitting. The choice of the number of layers reflects the depth of the GNN. More layers can provide deeper feature learning, but it is also necessary to avoid excessive layers that could lead to vanishing gradients or overfitting.
4.4. Baselines and Comparison
4.4.1. Baselines
In this study, we compared our model with the following baselines, which include both traditional models and state-of-the-art approaches for predicting drug–drug interactions. The traditional models consist of Logistic Regression (LR), K-Nearest Neighbors (KNN), Random Forest (RF), SVM (Support Vector Machine), and DNN. Additionally, we compared our model with the most advanced DDIs prediction models, including DeepDDI [11], DDIMDL [12], CNN-DDIs [39], and MDF-SA-DDIs [40].
Moreover, a comparison of the parameter counts of the models was conducted. The machine learning model has significantly fewer parameters compared to the deep learning models. Deep DDIs, DDIMDL, and CNN-DDIs, respectively, have 15 M, 25.5 M, and 44.55 M parameters. MDF-SA-DDIs and MTrans have 449.7 M and 419.6 M parameters, respectively. In addition to this, the details of these models are given below:
- DeepDDI utilizes the SMILES notation to encode drug structures as input. It applies PCA for effective dimensionality reduction, extracting the most relevant features from drug profiles. Subsequently, it harnesses the predictive power of deep neural networks to accurately forecast DDIs.
- DDIMDL integrates a multitude of drug features to compute drug similarity, enhancing the predictive power of its deep learning model for drug interaction forecasting. This approach facilitates a nuanced understanding of pharmacological interactions through the synergy of feature-rich drug profiling and advanced computational techniques.
- CNN-DDIs employs a convolutional neural network (CNN) to learn feature representations and predict drug–drug interactions (DDIs). It extracts feature interactions from drug categories, targets, pathways, and enzymes to form a feature vector. CNN-DDIs utilizes the Jaccard similarity as a metric for measuring drug similarity. Subsequently, based on these feature representations, a novel CNN model is constructed to serve as a predictor for DDIs.
- MDF-SA-DDI is a predictive model that combines various drug features and uses a mechanism called self-attention to better understand how different drugs might interact, helping to foresee potential drug–drug interactions more accurately.
4.4.2. Comparison Experiment
To verify the validity of the MTrans model, we compared it with nine baseline models. Table 1 will show the performance of our model alongside other comparative models in predicting DDIs. We highlight the data for the model with the best performance in bold, and the data for the model with the second-best performance is underlined, to clearly delineate their respective standings.

Table 1.
Comparison results for DDIs prediction models.
In this section, we compared MTrans with all baseline models using six evaluation metrics. The results indicate that our model exhibits the best performance in predicting DDIs. Due to the complexity of drug features, traditional methods for calculating drug similarity and machine learning methods have been proven insufficient for accurately predicting DDIs. Currently, some researchers have turned to deep learning models for DDIs prediction. In our study, we compared our model with two of the most advanced deep learning models. On the DrugBank dataset, our model outperformed DDIMDL by 6.87%, 1.29%, 1.36%, 1.91%, 0.19%, and 2.52% in terms of ACC, AUPR, AUC, F1, Pre, and Rec, respectively, and outperformed MDF-SA-DDIs by 2.21%, 1.52%, 1.75%, 1.18%, 0.7%, and 2.1%, respectively. On the KEGG dataset, our model outperformed DDIMDL by 4.14%, 5.69%, 3.72%, 5.81%, 5.11%, and 6.62% in terms of ACC, AUPR, AUC, F1, Pre, and Rec and outperformed MDF-SA-DDIs by 2.93%, 3.25%, 1.80%, 0.37%, 2.53%, and 4.00%.
In predicting DDIs, feature selection is a crucial task due to the complexity of drug features. Deep learning technology can learn complex drug features. Our model demonstrates superior predictive performance when compared to models such as DeepDDIs and MDF-SA-DDIs. The effectiveness of our model is mainly due to the inherent ability to be context-aware of the transformer architecture. The transformer utilizes a multi-head attention mechanism that captures long-range dependencies in sequences. It is essential for understanding the intricate interconnections between drug features. Moreover, we have also addressed the issue of different semantic spaces of drug multi-source features, using three transformers for encoding. It not only focuses on the information within two semantic spaces but also pays attention to the connections between the two semantic spaces. In addition, our model effectively utilizes the known DDIs data through KG and GNN to dig deeper into the common action mechanism of known DDIs. It has been proven that constructing a knowledge graph based on known DDIs and using GNN to learn drug interaction relationships is effective. The combination of drug features and interaction relationships enhances the discovery of the mechanisms behind drug interactions. As a result, our model is more efficient than other models.
MTrans has a more powerful understanding than traditional deep learning models. MDF-SA-DDIs lag in performance across all six evaluation metrics when compared to MTrans. This disparity arises because MTrans addresses the challenge of diverse semantic spaces in multi-source features more effectively than MDF-SA-DDIs. Additionally, MTrans delves deeper into the analysis of known DDIs, offering a more nuanced understanding that translates into superior predictive capabilities.
4.5. Case Study
To demonstrate the effectiveness of DDIs prediction with MTrans, a visual analysis was conducted following the methodology outlined by Zhu et al. [41]. Four specific drugs were selected as examples for this analysis. The features of these drugs were input into a transformer–encoder to derive their representation vectors.
It is known that the coadministration of 1,2-Benzodiazepine with Agomelatine increases the risk of CNS Depression. Similarly, the co-administration of 1,2-Benzodiazepine with Acetazolamide also raises the risk of CNS depression. Both of these drug pairs induce similar interactions and involve interactions with 1,2-Benzodiazepine. Therefore, we extracted common features from Agomelatine and Acetazolamide to identify a shared mechanism underlying these interactions. This shared mechanism, along with the representations of the drugs to be predicted, 1,2-Benzodiazepine and Acetophenazine, was then input into a neural network for DDIs prediction. Figure 7 is used to illustrate this case.
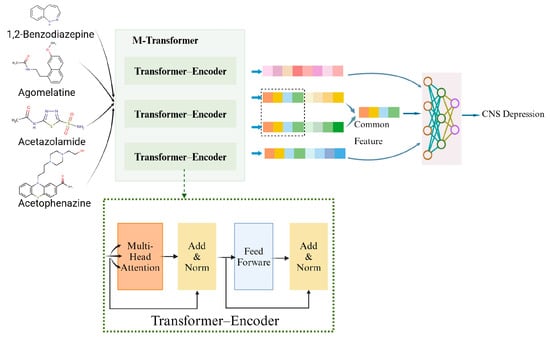
Figure 7.
The case of DDIs prediction using MTrans as a prediction model.
5. Discussion
This article introduces a model named MTrans which is designed to predict DDIs. Drug characteristics are inherently complex and multifaceted, with each feature type residing in distinct semantic spaces. To address this challenge, we employed the M-Transformer to interpret the details of drug features and generate drug vectors. Furthermore, the known DDIs contain the valuable information, which can help for DDIs predictions. Therefore, we use the M-Transformer to obtain drug representations and DDI types to construct a knowledge graph. Subsequently, we utilize GNN to learn the common mechanisms of similar DDIs.
We compared our model with other models on the DrugBank datasets and KEGG datasets. The results demonstrate that MTrans significantly outperforms other models across six evaluation metrics. Specifically, compared to the most advanced DDI prediction model on the DrugBank dataset, MTrans leads in these six metrics by 2.21%, 1.52%, 1.75%, 1.18%, 0.7%, and 2.1%, respectively. Moreover, MTrans consistently exceeds traditional models by more than 20% on both datasets in five evaluation metrics.
The superior performance and robustness of the MTrans model are not just theoretically significant; they also hold great potential in practical applications. Predicting DDIs is crucial in clinical medication use, drug discovery, and personalized medicine recommendations. MTrans can assist in optimizing medication plans by predicting DDIs. The traditional experimental verification of DDIs is lengthy and costly. MTrans offers an efficient and accurate method to assess the safety of new drugs. Moreover, as medication plans become increasingly diverse due to individual patient conditions, personalized medicine recommendations can inadvertently lead to adverse DDIs. MTrans can aid in excluding such potential adverse DDIs in personalized medication recommendations. We plan to further apply the MTrans model in these areas. We hope that this technological innovation will contribute to the healthy development of the pharmaceutical industry and bring more benefits to patients.
6. Conclusions
This article introduces a model named MTrans, designed to predict DDIs. Because drug characteristics are highly dimensional and each type of feature exists in a different semantic space. To address this challenge, we employed the M-Transformer to interpret the details of drug features and generate drug vectors. Moreover, known DDIs contain valuable information that can help with DDIs prediction. Therefore, we used the M-Transformer to obtain drug representations and DDI types to construct a knowledge graph. Subsequently, we utilized GNN to understand the common mechanisms of similar DDIs.
We compared our model with other models on the DrugBank and KEGG datasets. The results demonstrate that MTrans significantly outperforms other models across six evaluation metrics. Specifically, compared to the most advanced DDI prediction model on the DrugBank dataset, MTrans leads in these six metrics by 2.21%, 1.52%, 1.75%, 1.18%, 0.7%, and 2.1%, respectively. Moreover, in five evaluation metrics, MTrans consistently exceeds traditional models by more than 20% on both datasets.
The superior performance and robustness of the MTrans model are not just theoretically significant. They also hold great potential in practical applications. Predicting DDIs is crucial in clinical medication use, drug discovery, and personalized medicine recommendations. MTrans can assist in optimizing medication plans by predicting DDIs. The traditional experimental verification of DDIs is lengthy and costly. MTrans offers an efficient and accurate method to assess the safety of new drugs. Moreover, as medication plans become increasingly diverse due to individual patient conditions, personalized medicine recommendations can inadvertently lead to adverse DDIs. MTrans can aid in excluding such potential adverse DDIs in personalized medication recommendations. We plan to apply the MTrans model in these areas further. This technological innovation will contribute to the pharmaceutical industry’s healthy development and provide more patient benefits.
Author Contributions
Conceptualization, S.W.; methodology, S.W.; software, S.W.; validation, S.W.; formal analysis, S.W.; investigation, S.W.; resources, S.W.; data curation, S.W.; writing—original draft preparation, S.W.; writing—review and editing, S.W., B.L., X.Z., X.S. and C.L.; visualization, S.W.; supervision, S.W.; project administration, S.W.; funding acquisition, B.L. All authors have read and agreed to the published version of the manuscript.
Funding
This work was supported in part by the Natural Science Foundation of Zhejiang Province (LZ20F020001), the Science and Technology Innovation 2025 Major Project of Ningbo (20211ZDYF020036), the Natural Science Foundation of Ningbo (2021J091), the Research and Development of a Digital Infrastructure Cloud Operation and Maintenance Platform Based on 5G and AI (HK2022000189), and the China Innovation Challenge (Ningbo) Major Project (2023T001).
Data Availability Statement
The datasets and codes can be publicly available at GitHub (https://github.com/547-547/MTrans, accessed on 12 June 2024).
Acknowledgments
We thank Liu for their help in setting up the experiment’s server node.
Conflicts of Interest
The authors declare no conflicts of interest.
References
- Gautier, L.; David, P.M. “Health for all” and the challenges for pharmaceutical policies: A critical interpretive synthesis over 40 years. Soc. Sci. Humanit. Open 2022, 5, 100255. [Google Scholar] [CrossRef]
- Lavecchia, A.; Cerchia, C. In silico methods to address polypharmacology: Current status, applications and future perspectives. Drug Discov. Today 2016, 21, 288–298. [Google Scholar] [CrossRef]
- Kontsioti, E.; Maskell, S.; Dutta, B.; Pirmohamed, M. A reference set of clinically relevant adverse drug-drug interactions. Sci. Data 2022, 9, 72. [Google Scholar] [CrossRef] [PubMed]
- Edwards, I.R.; Aronson, J.K. Adverse drug reactions: Definitions, diagnosis, and management. Lancet 2000, 356, 1255–1259. [Google Scholar] [CrossRef] [PubMed]
- Kantor, E.D.; Rehm, C.D.; Haas, J.S.; Chan, A.T.; Giovannucci, E.L. Trends in Prescription Drug Use Among Adults in the United States from 1999–2012. JAMA 2015, 314, 1818–1830. [Google Scholar] [CrossRef] [PubMed]
- Qato, D.M.; Wilder, J.; Schumm, L.P.; Gillet, V.; Alexander, G.C. Changes in Prescription and Over-the-Counter Medication and Dietary Supplement Use Among Older Adults in the United States, 2005 vs 2011. JAMA Intern. Med. 2016, 176, 473–482. [Google Scholar] [CrossRef] [PubMed]
- Pirmohamed, M.; Orme, M. Drug Interactions of Clinical Importance. In Davies’s Textbook of Adverse Drug Reactions; Oxford Academic: Oxford, UK, 1998; pp. 888–912. [Google Scholar]
- Onakpoya, I.J.; Heneghan, C.J.; Aronson, J.K. Post-Marketing Withdrawal of 462 Medicinal Products Because of Adverse Drug Reactions: A Systematic Review of the World Literature. BMC Med. 2016, 14, 10. [Google Scholar] [CrossRef] [PubMed]
- Ye, Q.; Hsieh, C.Y.; Yang, Z.; Kang, Y.; Chen, J.; Cao, D.; He, S.; Hou, T. A Unified Drug-Target Interaction Prediction Framework Based on Knowledge Graph and Recommendation System. Nat. Commun. 2021, 12, 6775. [Google Scholar] [CrossRef] [PubMed]
- Yan, C.; Duan, G.; Zhang, Y.; Wu, F.X.; Pan, Y.; Wang, J. Predicting Drug-Drug Interactions Based on Integrated Similarity and Semi-Supervised Learning. IEEE/ACM Trans. Comput. Biol. Bioinform. 2020, 19, 168–179. [Google Scholar] [CrossRef]
- Ryu, J.Y.; Kim, H.U.; Lee, S.Y. Deep Learning Improves Prediction of Drug-Drug and Drug-Food Interactions. Proc. Natl. Acad. Sci. USA 2018, 115, E4304–E4311. [Google Scholar] [CrossRef]
- Deng, Y.; Xu, X.; Qiu, Y.; Xia, J.; Zhang, W.; Liu, S. A Multimodal Deep Learning Framework for Predicting Drug-Drug Interaction Events. Bioinformatics 2020, 36, 4316–4322. [Google Scholar] [CrossRef] [PubMed]
- Vilar, S.; Harpaz, R.; Uriarte, E.; Santana, L.; Rabadan, R.; Friedman, C. Drug—Drug Interaction Through Molecular Structure Similarity Analysis. J. Am. Med. Inform. Assoc. 2012, 19, 1066–1074. [Google Scholar] [CrossRef] [PubMed]
- Takeda, T.; Hao, M.; Cheng, T.; Bryant, S.H.; Wang, Y. Predicting Drug-Drug Interactions Through Drug Structural Similarities and Interaction Networks Incorporating Pharmacokinetics and Pharmacodynamics Knowledge. J. Cheminform. 2017, 9, 16. [Google Scholar] [CrossRef] [PubMed]
- Abdelaziz, I.; Fokoue, A.; Hassanzadeh, O.; Zhang, P.; Sadoghi, M. Large-Scale Structural and Textual Similarity-Based Mining of Knowledge Graph to Predict Drug-Drug Interactions. J. Web Sem. 2017, 44, 104–117. [Google Scholar] [CrossRef]
- Vilar, S.; Uriarte, E.; Santana, L.; Lorberbaum, T.; Hripcsak, G.; Friedman, C.; Tatonetti, N. Similarity-Based Modeling in Large-Scale Prediction of Drug-Drug Interactions. Nat. Protoc. 2014, 9, 2147–2163. [Google Scholar] [CrossRef] [PubMed]
- Fatehi, M.; Karshenas, H. Drug-Drug Interaction Extraction Using a Position and Similarity Fusion-Based Attention Mechanism. J. Biomed. Inform. 2021, 115, 103707. [Google Scholar] [CrossRef]
- Rohani, N.; Eslahchi, C. Drug-Drug Interaction Predicting by Neural Network Using Integrated Similarity. Sci. Rep. 2019, 9, 13645. [Google Scholar] [CrossRef] [PubMed]
- Zhan, C.; Zhang, X.; Yuan, J.; Chen, X.; Zhang, X.; Fathollahi-Fard, A.M.; Wang, C.; Wu, J.; Tian, G. A Hybrid Approach for Low-Carbon Transportation System Analysis: Integrating CRITIC-DEMATEL and Deep Learning Features. Int. J. Environ. Sci. Technol. 2024, 21, 791–804. [Google Scholar] [CrossRef] [PubMed]
- Mousapour Mamoudan, M.; Ostadi, A.; Pourkhodabakhsh, N.; Fathollahi-Fard, A.M.; Soleimani, F. Hybrid Neural Network-Based Metaheuristics for Prediction of Financial Markets: A Case Study on Global Gold Market. J. Comput. Des. Eng. 2023, 10, 1110–1125. [Google Scholar] [CrossRef]
- Song, D.; Chen, Y.; Min, Q.; Sun, Q.; Ye, K.; Zhou, C.; Yuan, S.; Sun, Z.; Liao, J. Similarity-Based Machine Learning Support Vector Machine Predictor of Drug-Drug Interactions with Improved Accuracies. J. Clin. Pharm. Ther. 2019, 44, 268–275. [Google Scholar] [CrossRef]
- Jang, H.Y.; Song, J.; Kim, J.H.; Lee, H.; Kim, I.W.; Moon, B.; Oh, J.M. Machine Learning-Based Quantitative Prediction of Drug Exposure in Drug-Drug Interactions Using Drug Label Information. NPJ Digit. Med. 2022, 5, 88. [Google Scholar] [CrossRef] [PubMed]
- Huang, K.; Xiao, C.; Hoang, T.; Glass, L.; Sun, J. Caster: Predicting Drug Interactions with Chemical Substructure Representation. Proc. AAAI Conf. Artif. Intell. 2020, 34, 702–709. [Google Scholar] [CrossRef]
- Gan, Y.; Liu, W.; Xu, G.; Yan, C.; Zou, G. DMFDDI: Deep Multimodal Fusion for Drug-Drug Interaction Prediction. Brief. Bioinform. 2023, 24, bbad397. [Google Scholar] [CrossRef] [PubMed]
- Zhu, J.; Che, C.; Jiang, H.; Xu, J.; Yin, J.; Zhong, Z. SSF-DDI: A Deep Learning Method Utilizing Drug Sequence and Substructure Features for Drug–Drug Interaction Prediction. BMC Bioinform. 2024, 25, 39. [Google Scholar] [CrossRef] [PubMed]
- Lee, G.; Park, C.; Ahn, J. Novel Deep Learning Model for More Accurate Prediction of Drug-Drug Interaction Effects. BMC Bioinform. 2019, 20, 415. [Google Scholar] [CrossRef]
- Luo, Q.; Mo, S.; Xue, Y.; Zhang, X.; Gu, Y.; Wu, L.; Zhang, J.; Sun, L.; Liu, M.; Hu, Y. Novel Deep Learning-Based Transcriptome Data Analysis for Drug-Drug Interaction Prediction with an Application in Diabetes. BMC Bioinform. 2021, 22, 318. [Google Scholar] [CrossRef] [PubMed]
- Kang, L.P.; Lin, K.B.; Lu, P.; Yang, F.; Chen, J.P. Multitype Drug Interaction Prediction Based on the Deep Fusion of Drug Features and Topological Relationships. PLoS ONE 2022, 17, e0273764. [Google Scholar] [CrossRef]
- Yu, Y.; Huang, K.; Zhang, C.; Glass, L.M.; Sun, J.; Xiao, C. SumGNN: Multi-Typed Drug Interaction Prediction via Efficient Knowledge Graph Summarization. Bioinformatics 2021, 37, 2988–2995. [Google Scholar] [CrossRef] [PubMed]
- Chen, X.; Liu, X.; Wu, J. GCN-BMP: Investigating Graph Representation Learning for DDIs Prediction Task. Methods 2020, 179, 47–54. [Google Scholar] [CrossRef]
- Ren, Z.H.; Yu, C.Q.; Li, L.P.; You, Z.H.; Guan, Y.J.; Wang, X.F.; Pan, J. BioDKG-DDIs: Predicting Drug-Drug Interactions Based on Drug Knowledge Graph Fusing Biochemical Information. Brief. Funct. Genom. 2022, 21, 216–229. [Google Scholar] [CrossRef]
- Ren, Z.H.; You, Z.H.; Yu, C.Q.; Li, L.P.; Guan, Y.J.; Guo, L.X.; Pan, J. A Biomedical Knowledge Graph-Based Method for Drug-Drug Interactions Prediction Through Combining Local and Global Features with Deep Neural Networks. Brief. Bioinform. 2022, 23, bbac363. [Google Scholar] [CrossRef] [PubMed]
- Al-Rabeah, M.H.; Lakizadeh, A. Prediction of Drug-Drug Interaction Events Using Graph Neural Networks Based Feature Extraction. Sci. Rep. 2022, 12, 15590. [Google Scholar] [CrossRef]
- He, C.; Liu, Y.; Li, H.; Zhang, H.; Mao, Y.; Qin, X.; Liu, L.; Zhang, X. Multi-Type Feature Fusion Based on Graph Neural Network for Drug-Drug Interaction Prediction. BMC Bioinform. 2022, 23, 224. [Google Scholar] [CrossRef]
- Yang, Z.; Tong, K.; Jin, S.; Wang, S.; Yang, C.; Jiang, F. CNN-Siam: Multimodal Siamese CNN-Based Deep Learning Approach for Drug–Drug Interaction Prediction. BMC Bioinform. 2023, 24, 110. [Google Scholar] [CrossRef] [PubMed]
- Gupta, P.; Majumdar, A.; Chouzenoux, E.; Chierchia, G. DeConDFFuse: Predicting Drug–Drug Interaction Using Joint Deep Convolutional Transform Learning and Decision Forest Fusion Framework. Expert Syst. Appl. 2023, 227, 120238. [Google Scholar] [CrossRef]
- Wishart, D.S.; Feunang, Y.D.; Guo, A.C.; Lo, E.J.; Marcu, A.; Grant, J.R.; Sajed, T.; Johnson, D.; Li, C.; Sayeeda, Z.; et al. DrugBank 5.0: A Major Update to the DrugBank Dataset for 2018. Nucleic Acids Res. 2018, 46, D1074–D1082. [Google Scholar] [CrossRef]
- Kanehisa, M.; Furumichi, M.; Tanabe, M.; Sato, Y.; Morishima, K. KEGG: New Perspectives on Genomes, Pathways, Diseases and Drugs. Nucleic Acids Res. 2017, 45, D353–D361. [Google Scholar] [CrossRef]
- Zhang, C.; Lu, Y.; Zang, T. CNN-DDIs: A Learning-Based Method for Predicting Drug-Drug Interactions Using Convolution Neural Networks. BMC Bioinform. 2022, 23 (Suppl. S1), 88. [Google Scholar] [CrossRef]
- Lin, S.; Wang, Y.; Zhang, L.; Chu, Y.; Liu, Y.; Fang, Y.; Jiang, M.; Wang, Q.; Zhao, B.; Xiong, Y.; et al. MDF-SA-DDI: Predicting Drug–Drug Interaction Events Based on Multi-Source Drug Fusion, Multi-Source Feature Fusion and Transformer Self-Attention Mechanism. Brief. Bioinform. 2022, 23, bbab421. [Google Scholar] [CrossRef]
- Zhu, J.; Liu, Y.; Wen, C. MTMA: Multi-Task Multi-Attribute Learning for the Prediction of Adverse Drug-Drug Interaction. Knowl.-Based Syst. 2020, 199, 105978. [Google Scholar] [CrossRef]
Disclaimer/Publisher’s Note: The statements, opinions and data contained in all publications are solely those of the individual author(s) and contributor(s) and not of MDPI and/or the editor(s). MDPI and/or the editor(s) disclaim responsibility for any injury to people or property resulting from any ideas, methods, instructions or products referred to in the content. |
© 2024 by the authors. Licensee MDPI, Basel, Switzerland. This article is an open access article distributed under the terms and conditions of the Creative Commons Attribution (CC BY) license (https://creativecommons.org/licenses/by/4.0/).