_Kalra.png)

UTAC-Net: A Semantic Segmentation Model for Computer-Aided Diagnosis for Ischemic Region Based on Nuclear Medicine Cerebral Perfusion Imaging

Abstract
1. Introduction
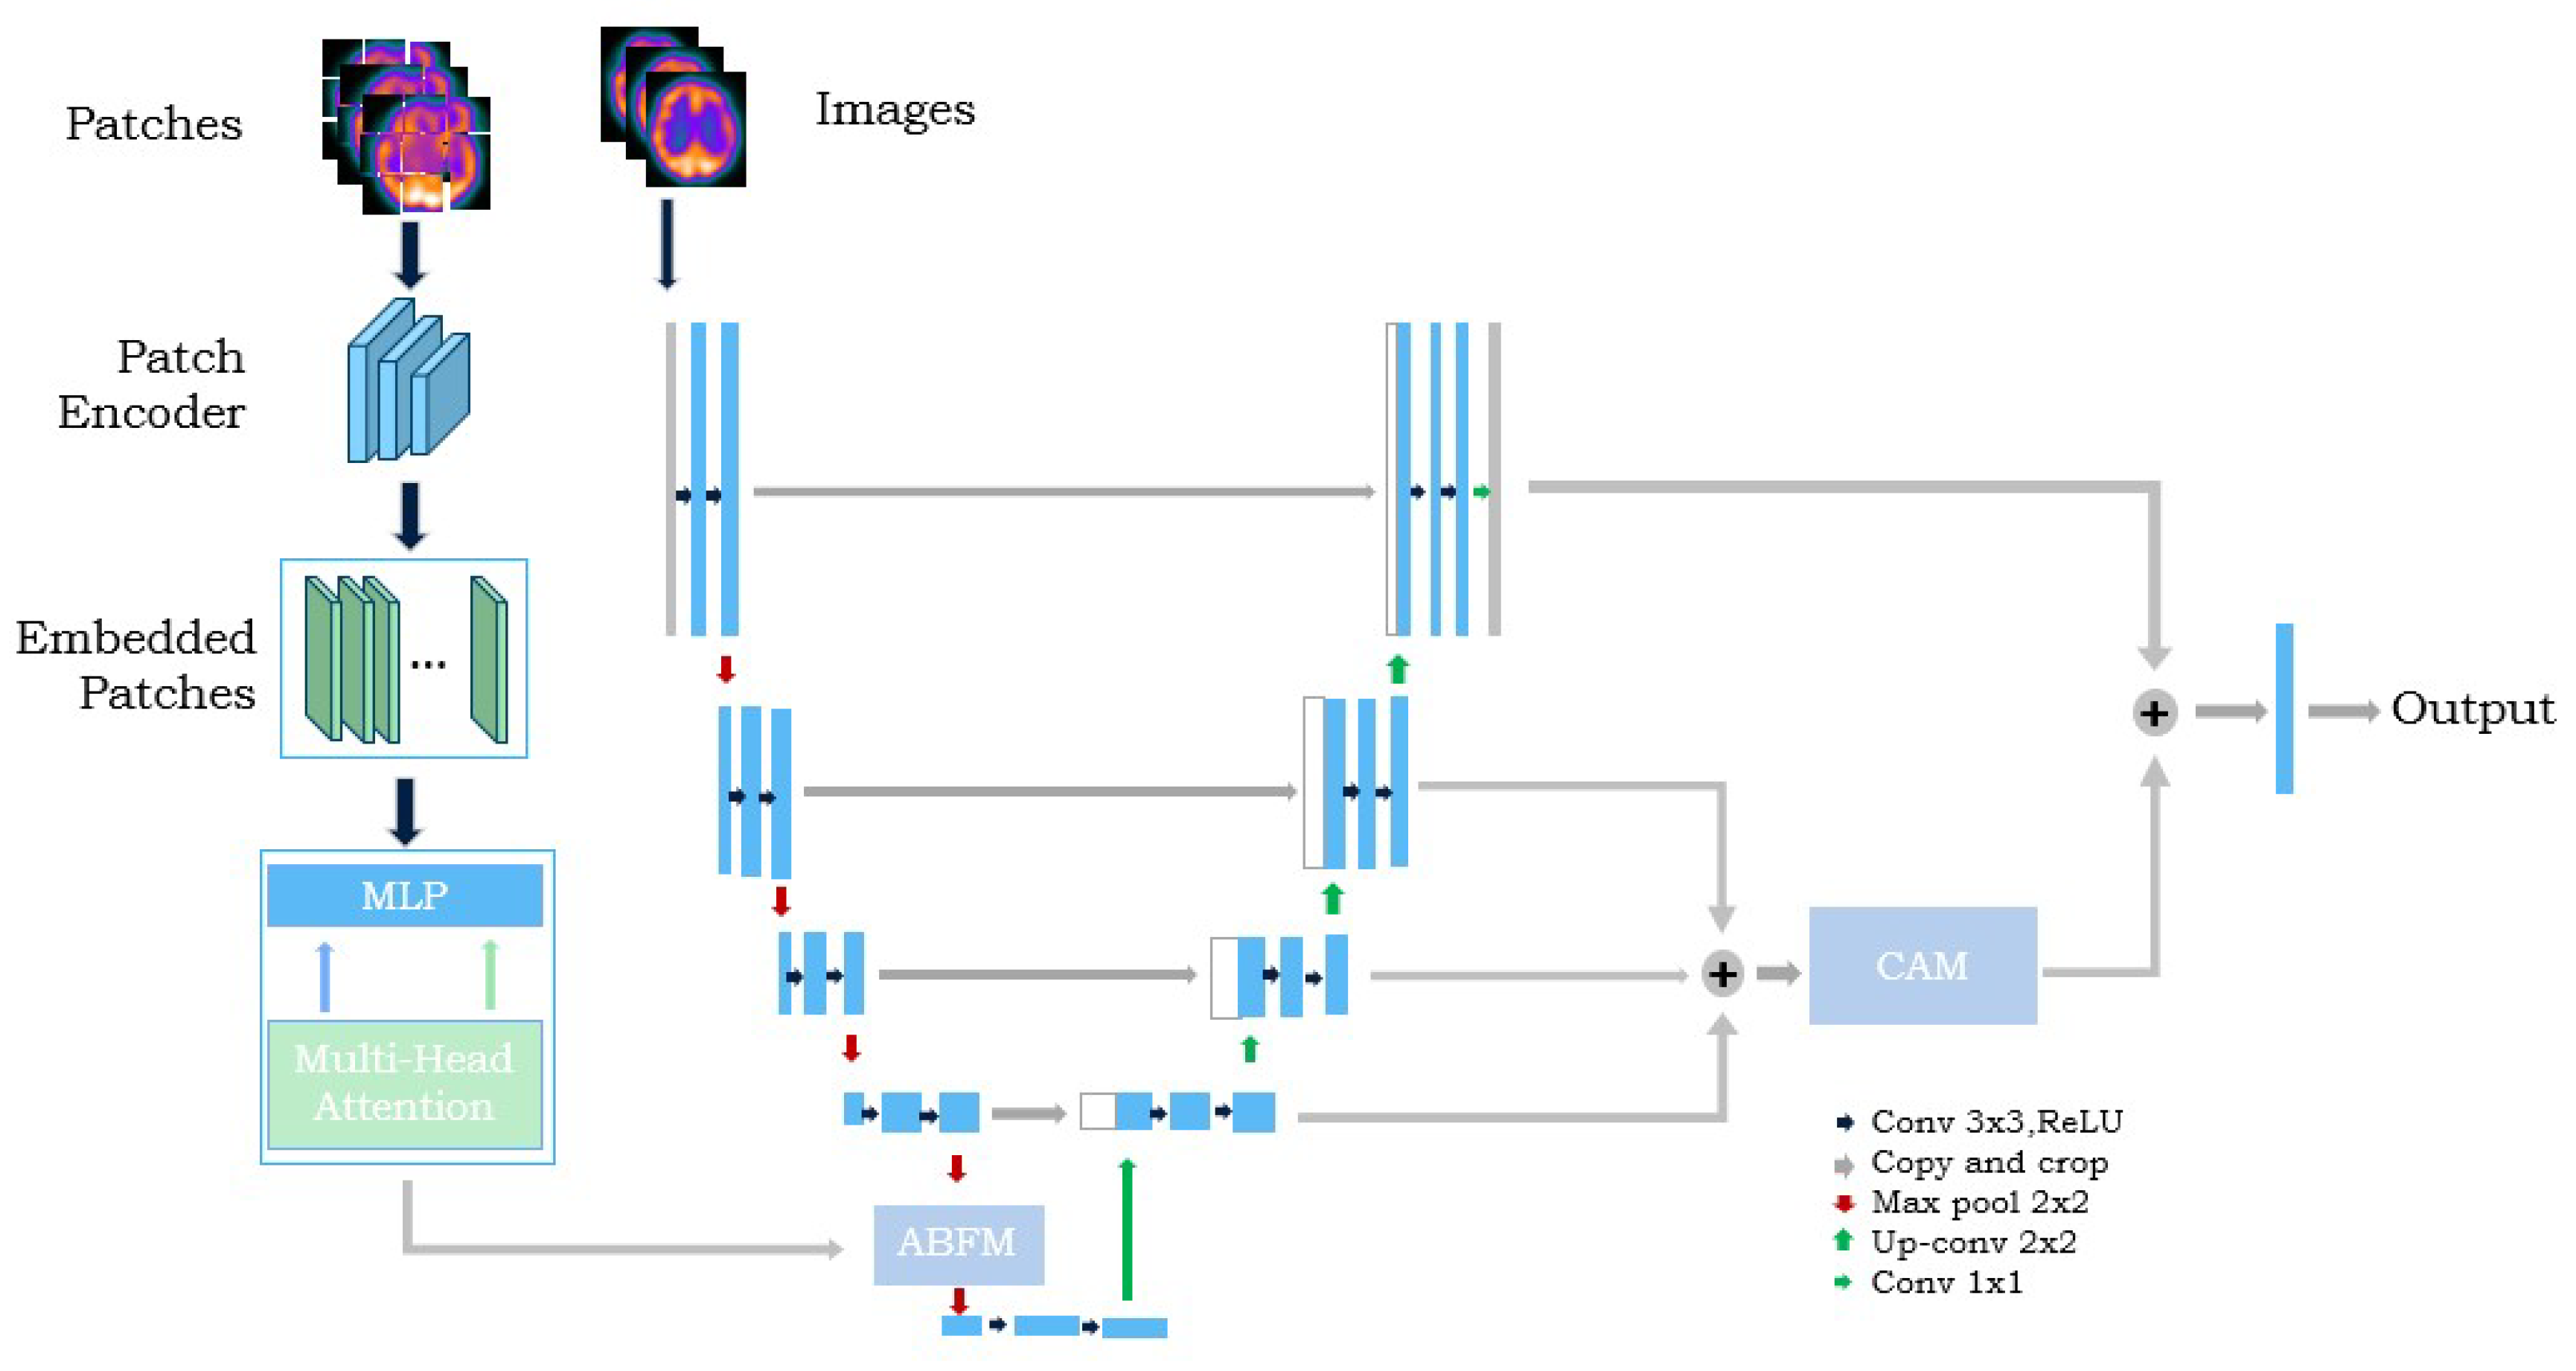
- We propose a novel segmentation network, called UTAC-Net, which adopts a branching code consisting of U-Net with Transformer, the attention branching fusion module (ABFM), and the contour-aware module (CAM).
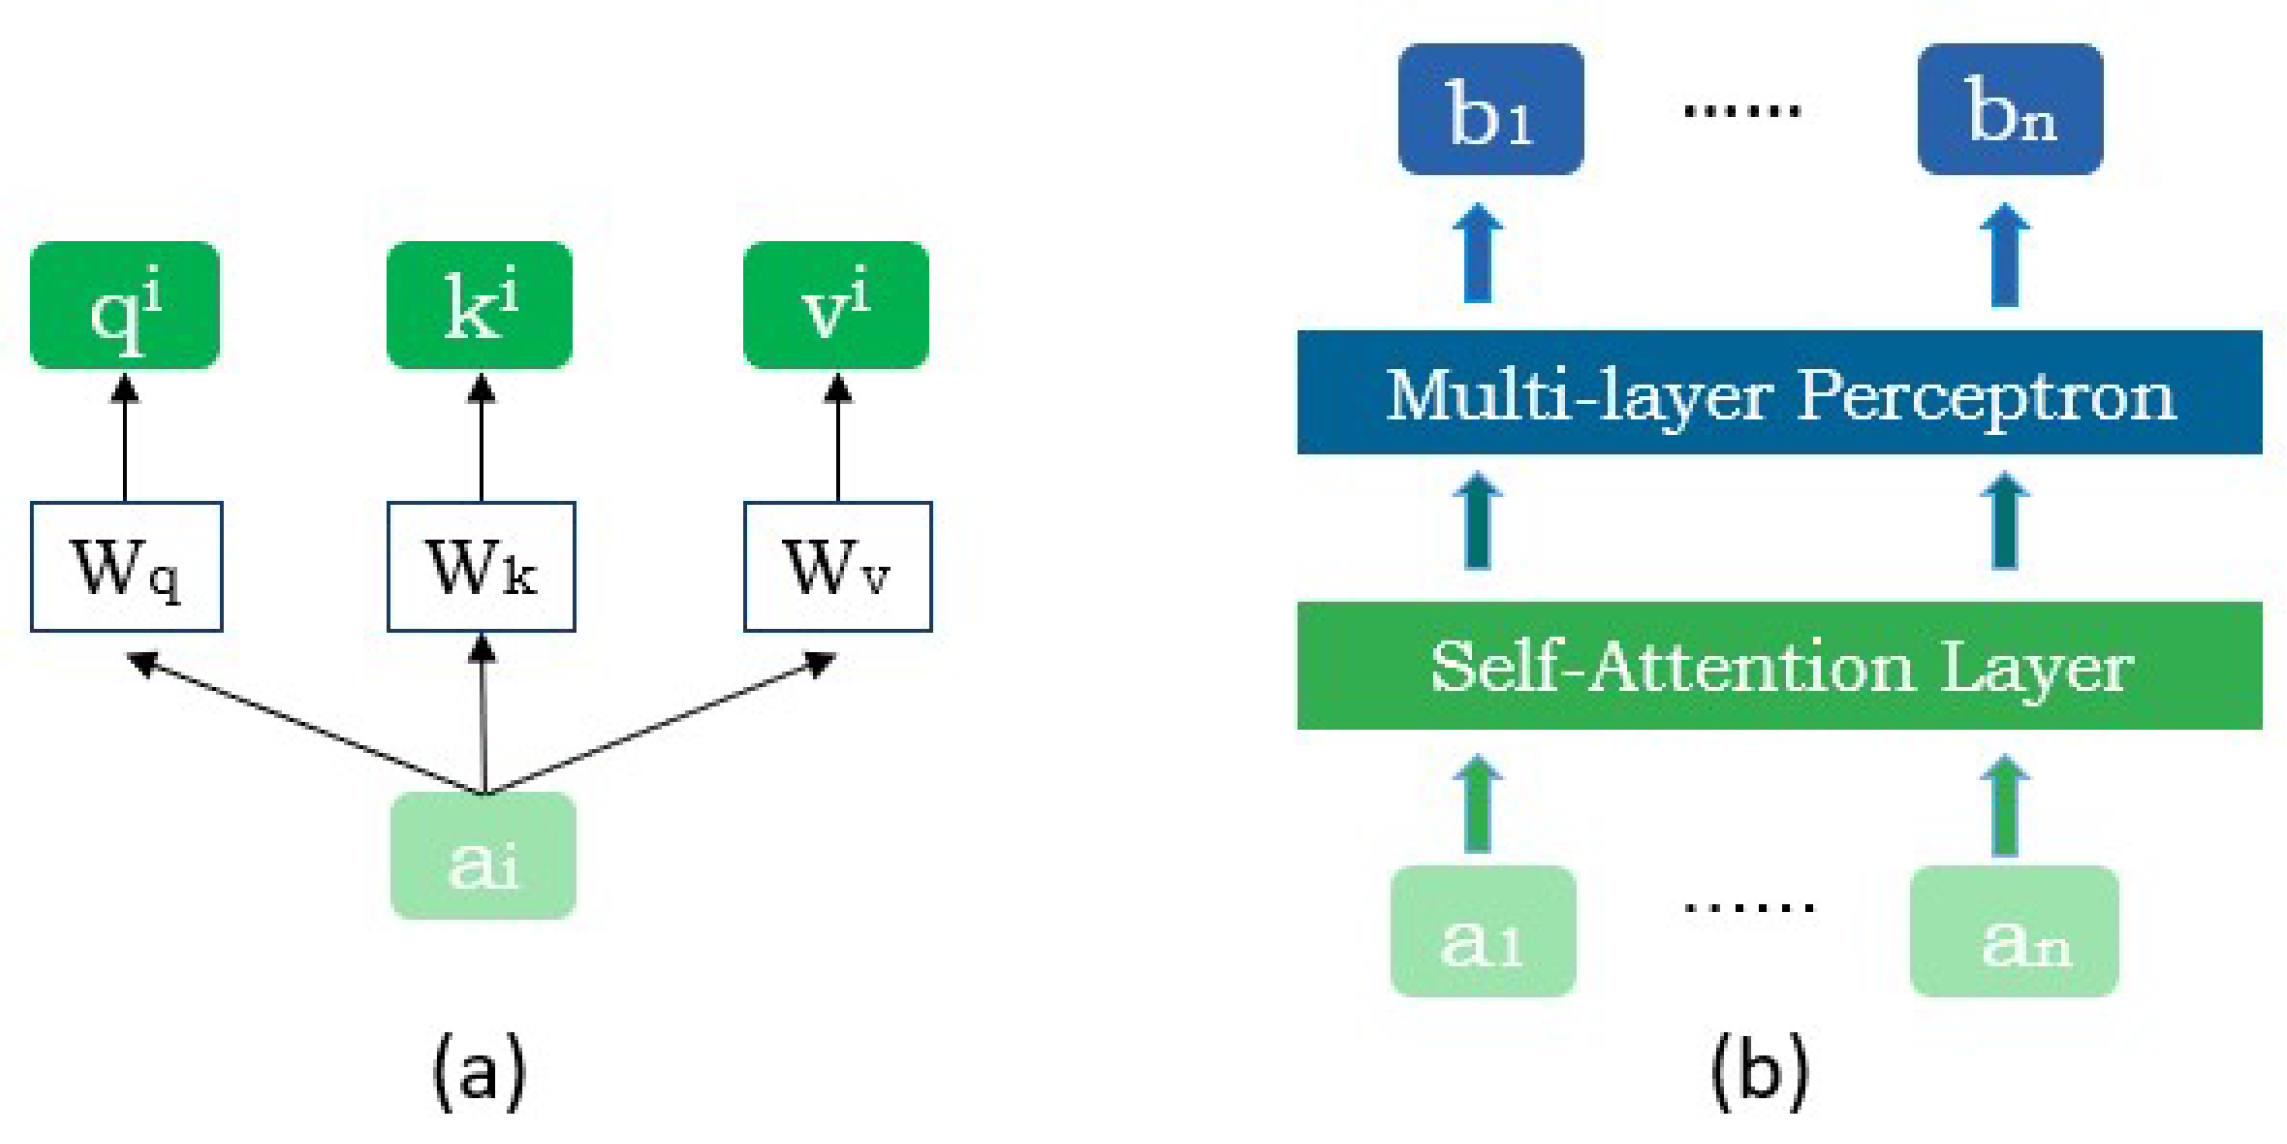
- The dual-branch encoder combines the advantages of Transformer and U-Net. U-Net pays more attention to local features with complex details, and can effectively learn and recover the details of the image; Transformer pays more attention to global features and, through self-attention, deals with multiple elements in the sequence simultaneously to achieve highly parallel computation, which can capture long-range dependencies between different positions. The two branches form a complementary structure to extract more features on the SPECT image.
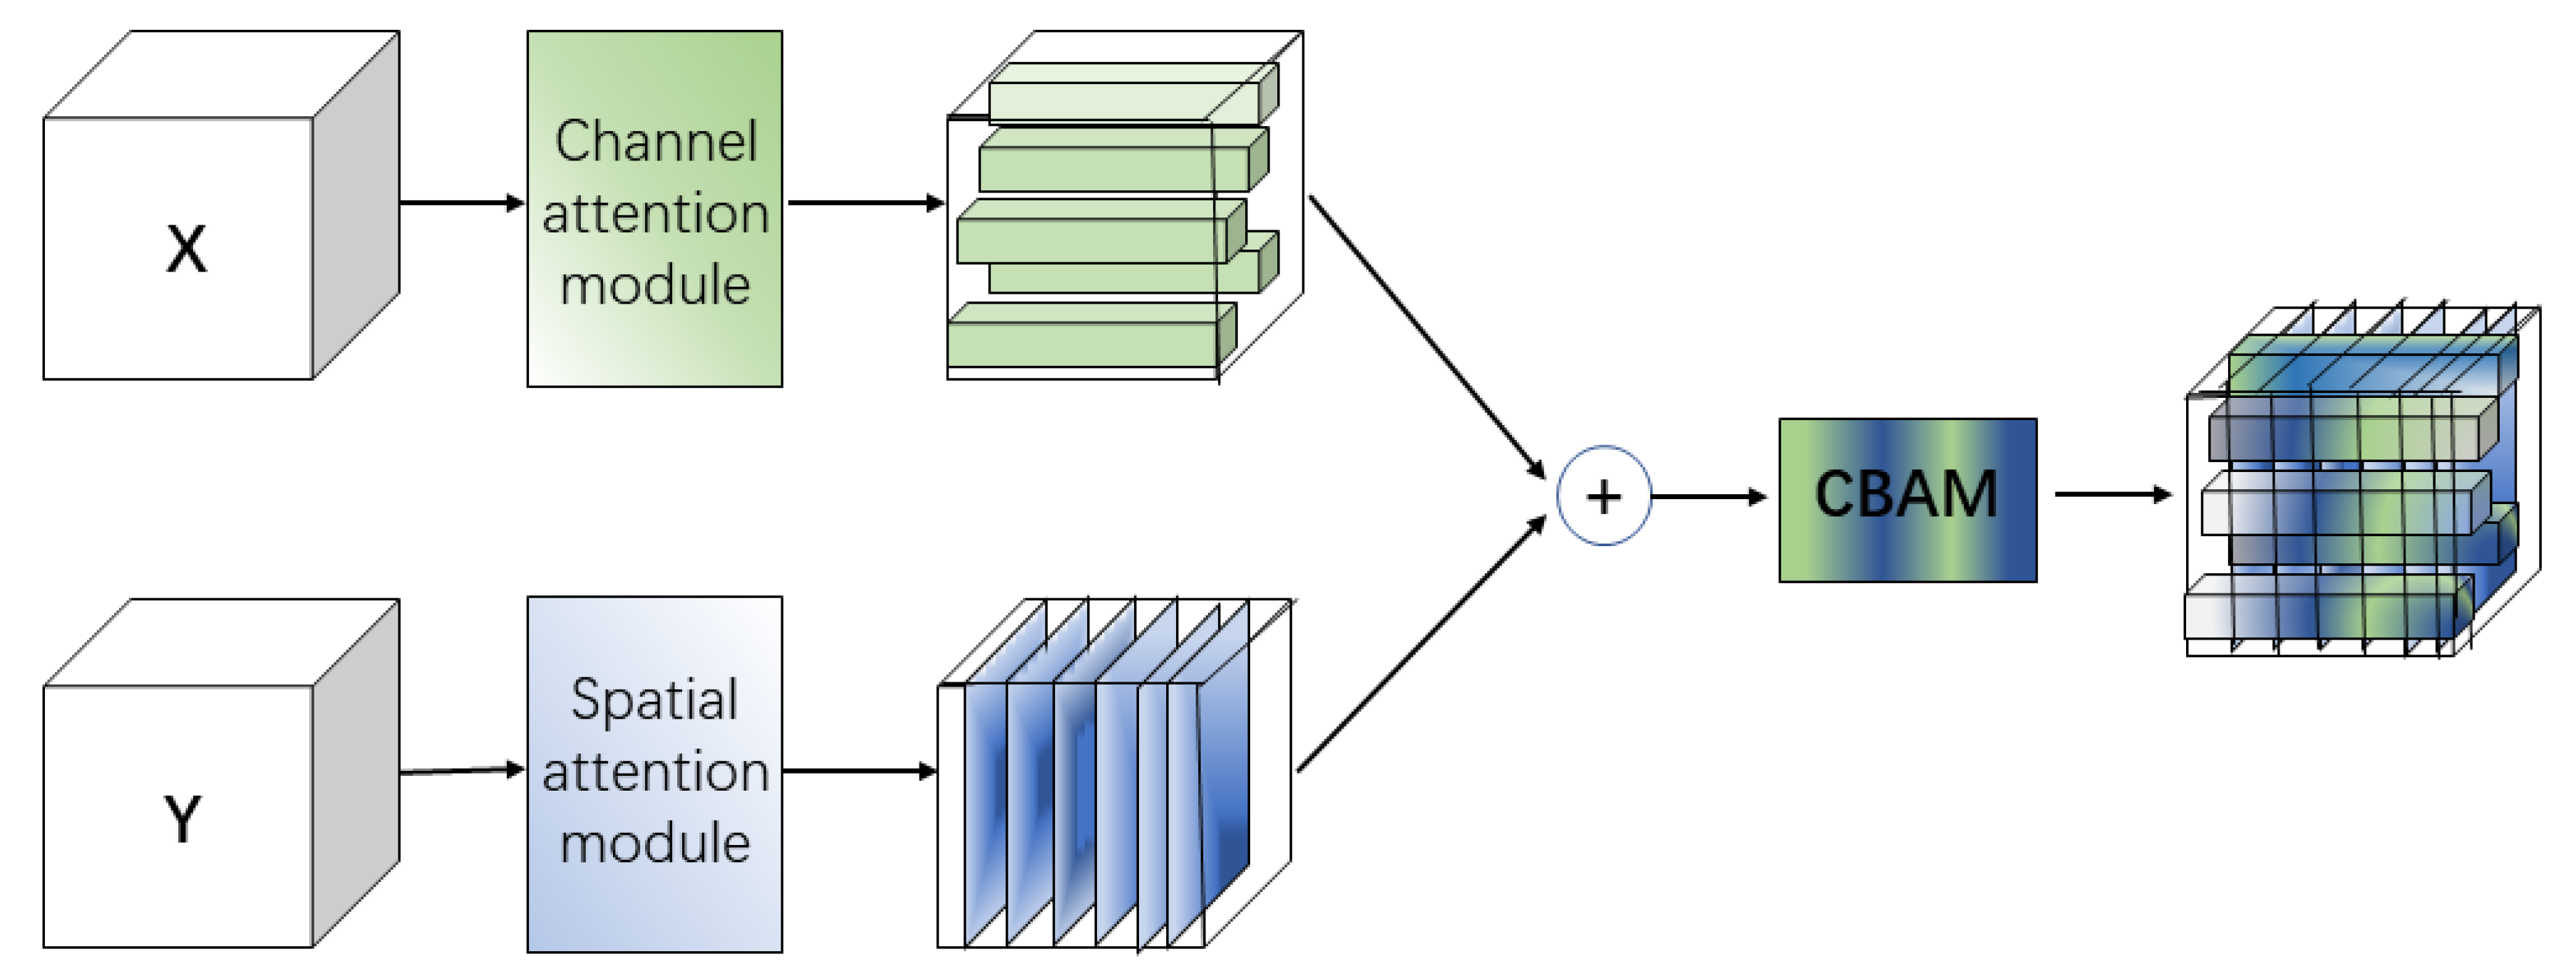
- ABFM selectively fuses global and local features to highlight those relevant to the segmentation task, and consists of the channel attention module, the spatial attention module, and the convolutional block attention module (CBAM) composition. The channel attention module filters the local features extracted by U-Net, the spatial attention module filters the global features extracted by Transformer, and the filtered features are fused and fed into CBAM to achieve full feature adaptation in both channel and spatial dimensions. This allows the network to highlight important features and suppress unimportant features.
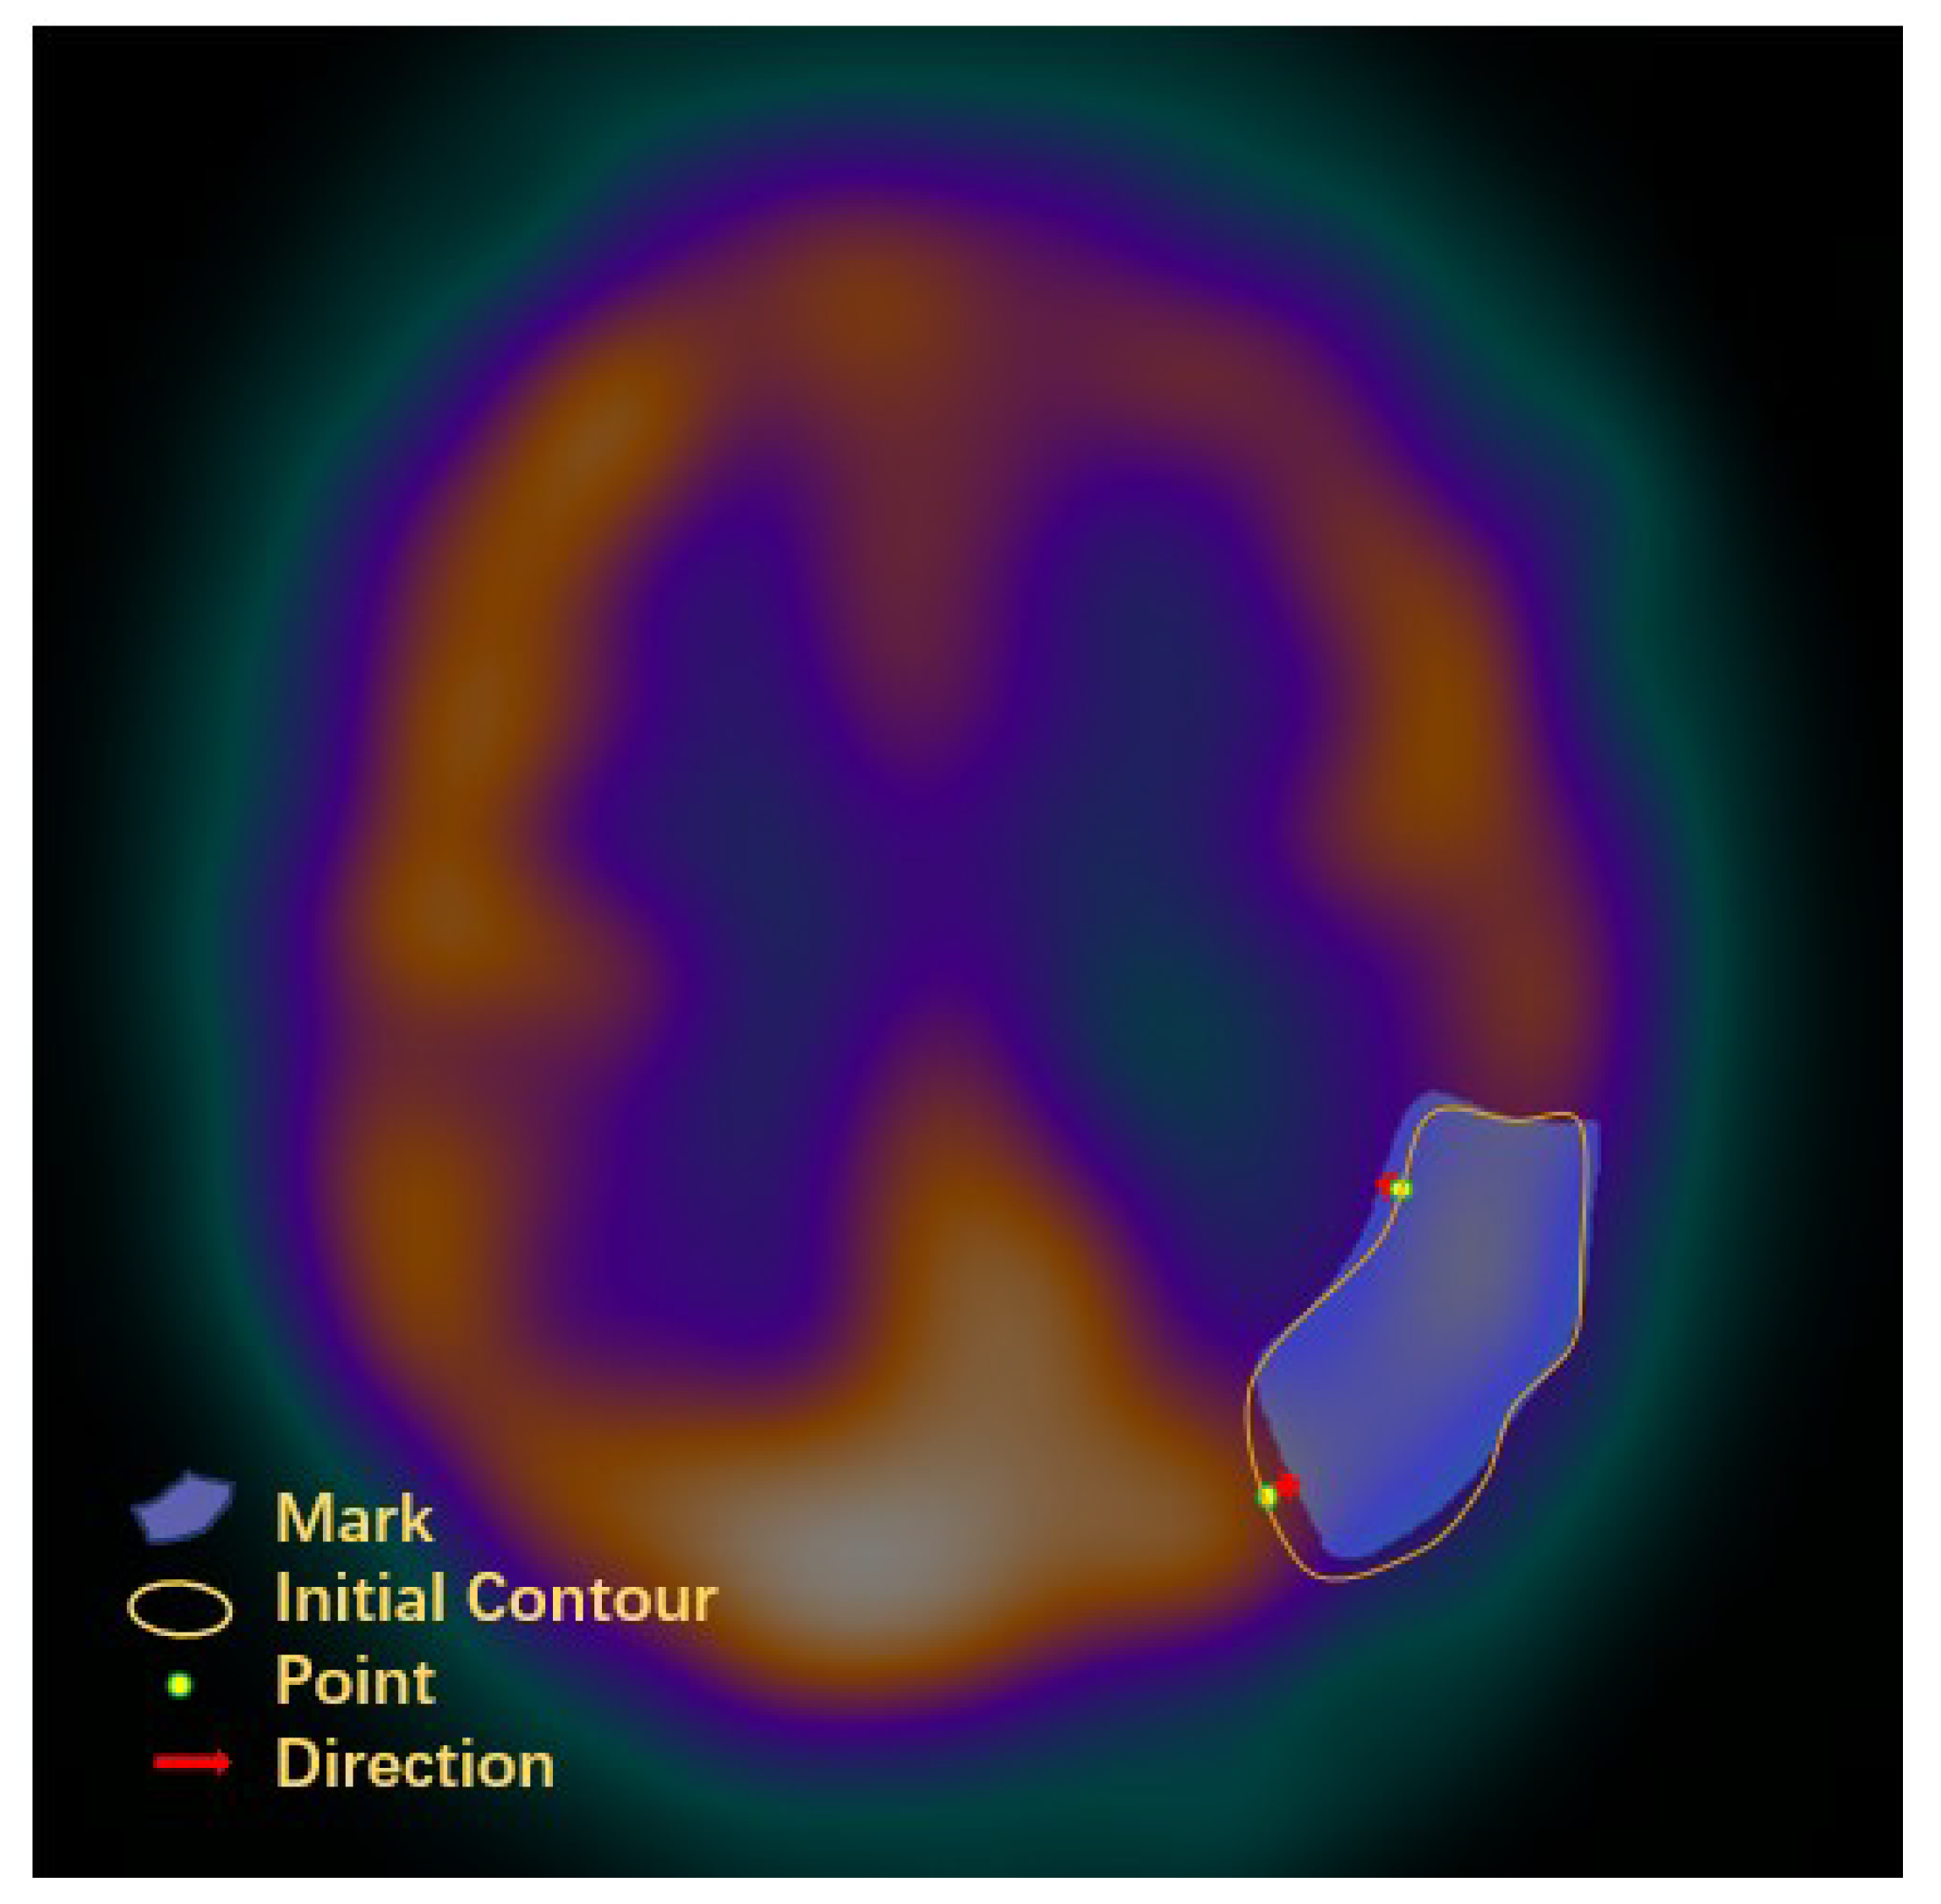
- CAM fuses the contour features containing different scales from the decoding stage to further clarify the contour of the ischemic region. CAM performs an evolutionary deformation of the contour vertices of the ischemic region by the vertex iteration method designed in this paper so that the vertices keep approaching the contour of the ischemic region.
2. Materials and Methods
2.1. Overview
2.2. Transformer
2.3. Attention Branching Fusion Module
2.4. Contour-Aware Module
3. Results
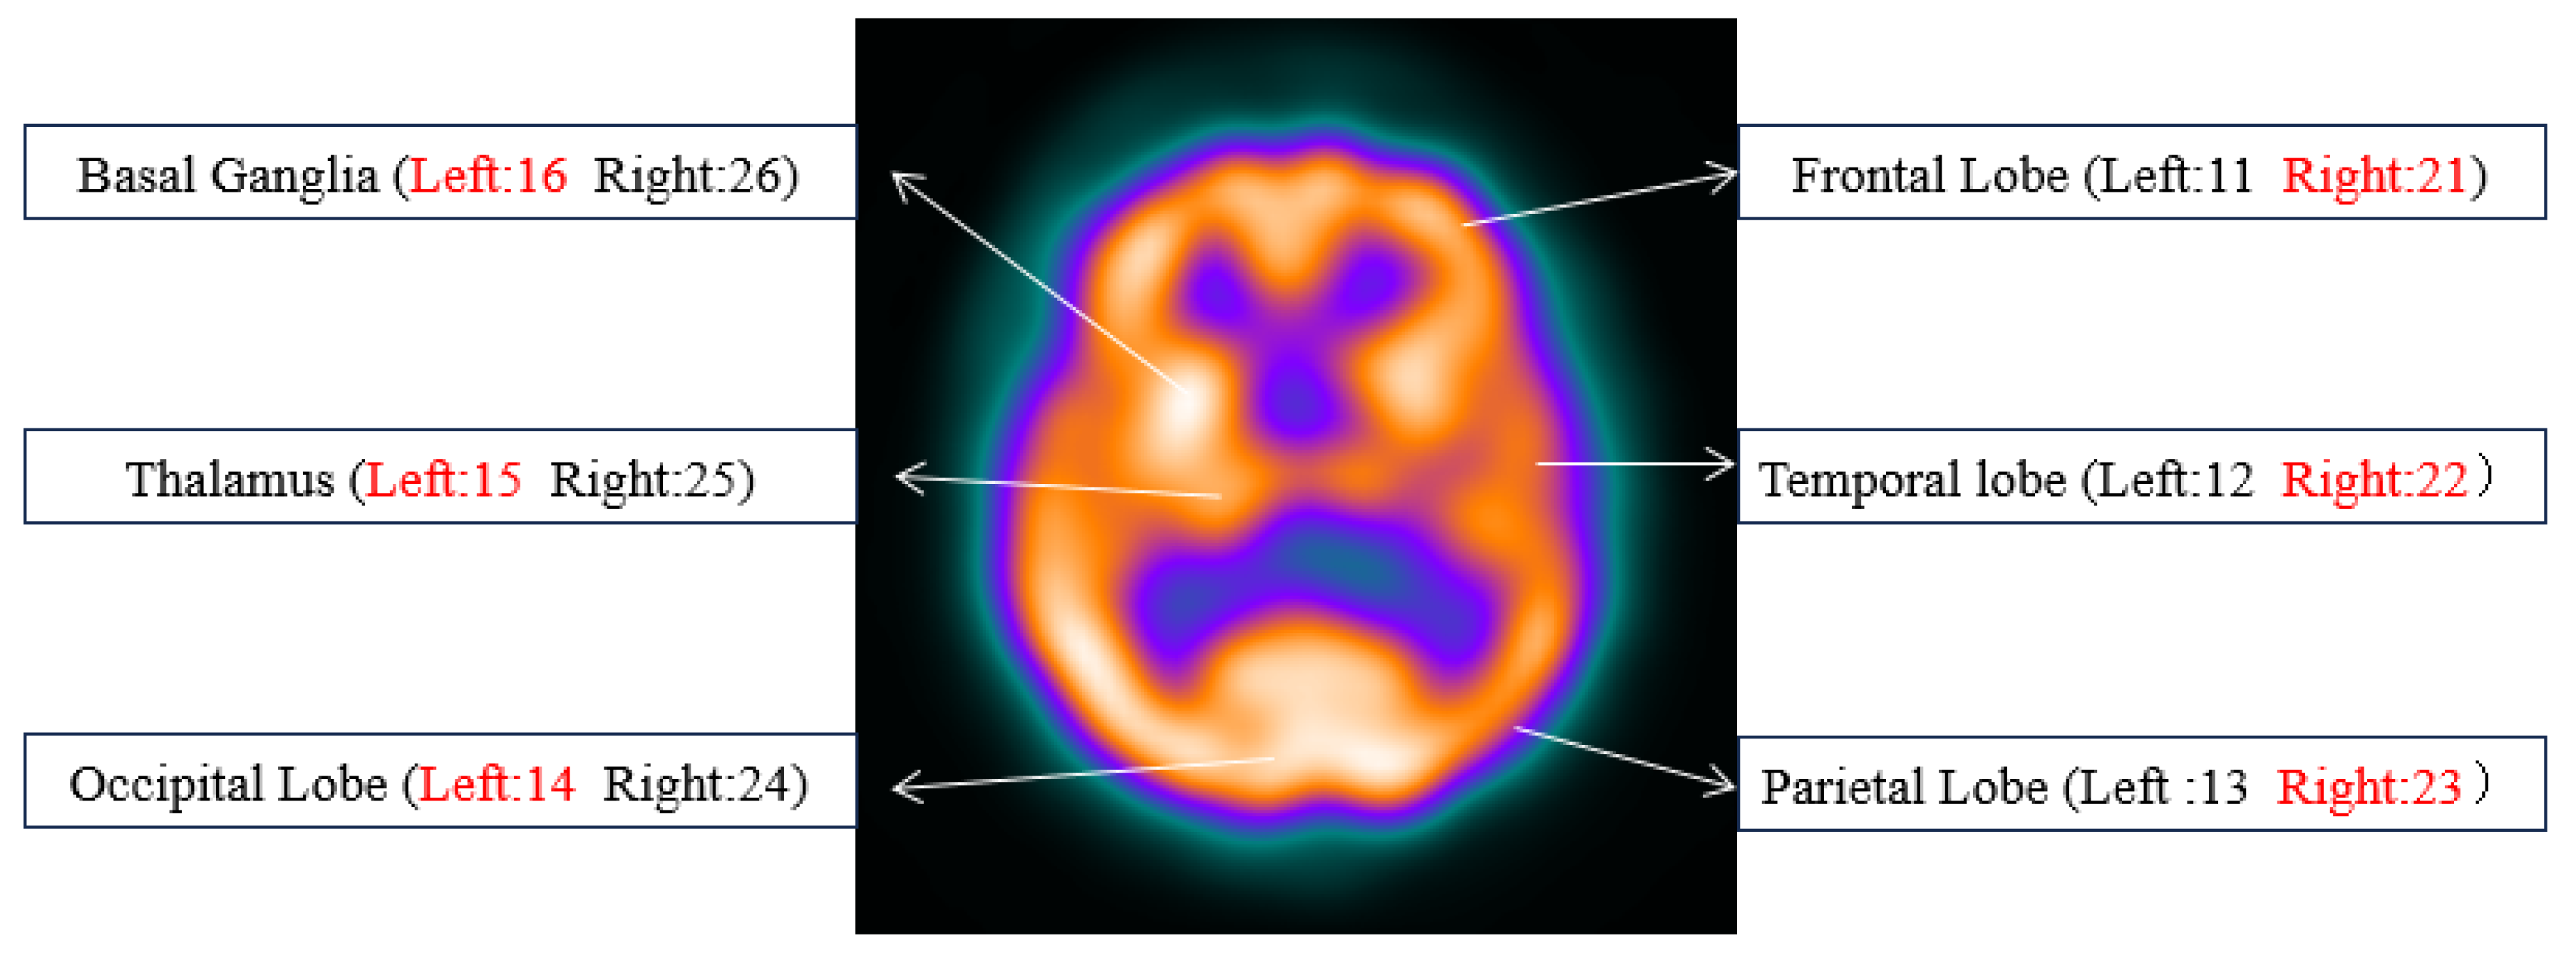
3.1. Datasets
3.2. Experimental Configuration
3.3. Evaluation Metrics
3.4. Comparison with Other Methods on the CPI Dataset
3.4.1. Quantitative Results
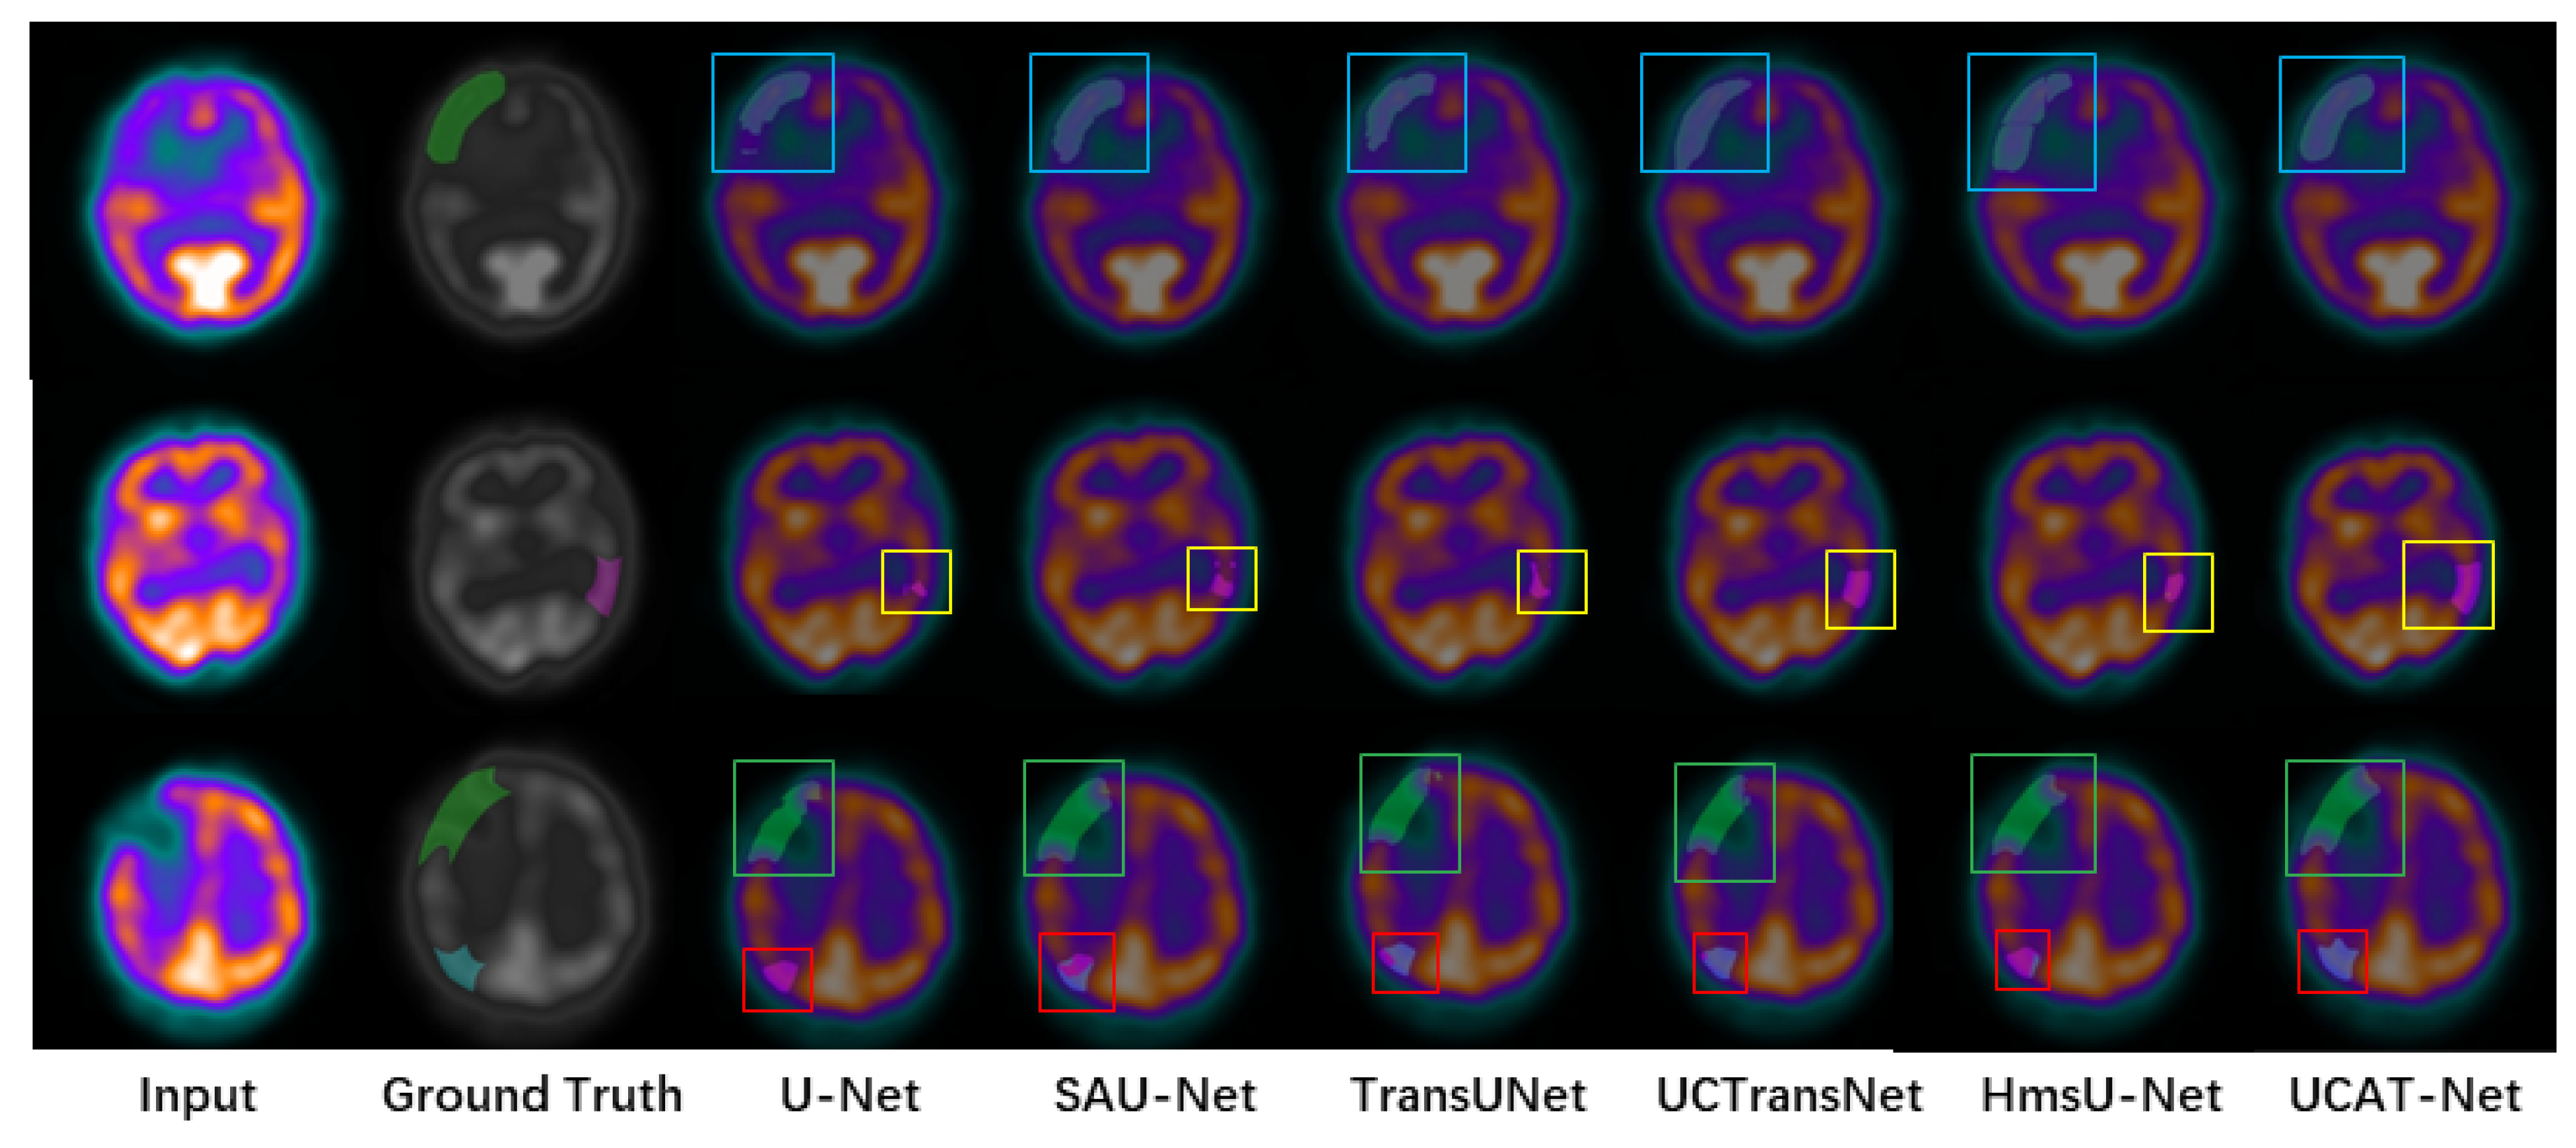
3.4.2. Qualitative Results
3.5. Comparison with Other Methods on the ISIC 2018 Dataset
3.6. Ablation Study
3.6.1. Transformer
3.6.2. Attention Branching Fusion Module
3.6.3. Contour-Aware Module
4. Discussion
Author Contributions
Funding
Data Availability Statement
Acknowledgments
Conflicts of Interest
Abbreviations
| CNN | convolutional neural network |
| CPI | cerebral perfusion imaging |
| SPECT | single-photon emission computed tomography |
| CAD | computer-aided diagnosis |
| ABFM | attention branching fusion module |
| CAM | contour-aware module |
| MSA | multihead self-attention |
| FFN | feed forward network |
| MLP | multilayer perceptron |
| CBAM | convolutional block attention module |
| Tc-99m-ECD | Technetium-99m-Ethyl Cysteinate Dimer |
| IoU | intersection over union |
| TP | true positives |
| TN | true negatives |
| FP | false positives |
| FN | false negatives |
References
- Wang, S.; Liu, F.; Ying, C.; Gao, C.; Zhang, Y. Action Mechanism of Traditional Chinese Medicine Combined with Bone Marrow Mesenchymal Stem Cells in Regulating Blood-brain Barrier after Cerebral Ischemia Reperfusion Injury. Chin. J. Tissue Eng. Res. 2023, 27, 5377. [Google Scholar]
- Burns, M.M.J.; Pomager, L.; Young, B. Time is brain. Am. Nurse J. 2023, 18, 6–12. [Google Scholar] [CrossRef]
- Zhang, H.Y.; Tian, Y.; Shi, H.Y.; Cai, Y.; Xu, Y. The Critical Role of the Endolysosomal System in Cerebral Ischemia. Neural Regen. Res. 2023, 18, 983. [Google Scholar] [CrossRef]
- Shi, G.; Feng, J.; Jian, L.Y.; Fan, X.Y. DNA Hypomethylation Promotes Learning and Memory Recovery in A Rat Model of Cerebral Ischemia/Reperfusion Injury. Neural Regen. Res. 2023, 18, 863. [Google Scholar] [CrossRef] [PubMed]
- Kahl, A.; Blanco, I.; Jackman, K.; Baskar, J.; Milaganur Mohan, H.; Rodney-Sandy, R.; Zhang, S.; Iadecola, C.; Hochrainer, K. Cerebral Ischemia Induces the Aggregation of Proteins Linked to Neurodegenerative Diseases. Sci. Rep. 2018, 8, 2701. [Google Scholar] [CrossRef] [PubMed]
- Negredo, P.N.; Yeo, R.W.; Brunet, A. Aging and Rejuvenation of Neural Stem Cells and Their Niches. Cell Stem. Cell 2020, 27, 202–223. [Google Scholar] [CrossRef] [PubMed]
- Haggenmüller, B.; Kreiser, K.; Sollmann, N.; Huber, M.; Vogele, D.; Schmidt, S.A.; Beer, M.; Schmitz, B.; Ozpeynirci, Y.; Rosskopf, J.; et al. Pictorial Review on Imaging Findings in Cerebral CTP in Patients with Acute Stroke and Its Mimics: A Primer for General Radiologists. Diagnostics 2023, 13, 447. [Google Scholar] [CrossRef] [PubMed]
- Shamshad, F.; Khan, S.H.; Zamir, S.W.; Khan, M.H.; Hayat, M.; Khan, F.S.; Fu, H. Transformers in Medical Imaging: A Survey. Med. Image. Anal. 2022, 88, 102802. [Google Scholar] [CrossRef]
- Wang, Y.; Yu, X.; Yang, Y.; Zeng, S.; Xu, Y.; Feng, R. FTUNet: A Feature-Enhanced Network for Medical Image Segmentation Based on the Combination of U-Shaped Network and Vision Transformer. Neural Process. Lett. 2024, 56, 84. [Google Scholar] [CrossRef]
- Taghanaki, S.A.; Abhishek, K.; Cohen, J.P.; Cohen-Adad, J.; Hamarneh, G. Deep Semantic Segmentation of Natural and Medical Images: A Review. Artif. Intell. Rev. 2021, 54, 137–178. [Google Scholar] [CrossRef]
- He, S.; Minn, K.T.; Solnica-Krezel, L.; Anastasio, M.A.; Li, H. Deeply-supervised Density Regression for Automatic Cell Counting in Microscopy Images. Med. Image Anal. 2021, 68, 101892. [Google Scholar] [CrossRef] [PubMed]
- Zhang, M.; Wang, Y.; Ding, Q.; Li, H.; Chao, H. Application of Artificial Intelligence Image-Assisted Diagnosis System in Chest CT Examination of COVID-19. Medicine 2020, 68, 9. [Google Scholar] [CrossRef]
- Ayus, I.; Gupta, D. A Novel Hybrid Ensemble Based Alzheimer’s Ldentification System Using Deep Learning Technique. Biomed. Signal Proces. 2024, 92, 106079. [Google Scholar] [CrossRef]
- Jasphin, C.; Geisa, J.M. Automated Identification of Gastric Cancer in Endoscopic Images by a Deep Learning Model. Automatika 2024, 65, 559–571. [Google Scholar] [CrossRef]
- Zhong, Y.; Piao, Y.; Tan, B.; Liu, J. A Multi-Task Fusion Model Based on a Residual–Multi-Layer Perceptron Network for Mammographic Breast Cancer Screening. Comput. Meth. Prog. Biomed. 2024, 247, 108101. [Google Scholar] [CrossRef]
- Papandrianos, N.; Papageorgiou, E. Automatic Diagnosis of Coronary Artery Disease in SPECT Myocardial Perfusion Imaging Employing Deep Learning. Appl. Sci. 2021, 11, 6362. [Google Scholar] [CrossRef]
- Petibon, Y.; Fahey, F.; Cao, X.; Levin, Z.; Sexton-Stallone, B.; Falone, A.; Zukotynski, K.; Kwatra, N.; Lim, R.; Bar-Sever, Z.; et al. Detecting Lumbar Lesions in Tc-99m-MDP SPECT by Deep Learning: Comparison with Physicians. Med. Phys. 2021, 48, 4249–4261. [Google Scholar] [CrossRef] [PubMed]
- Xing, H.; Wang, T.; Jin, X.; Tian, J.; Ba, J.; Jing, H.; Li, F. Direct Attenuation Correction for Tc-99m-3PRGD(2) Chest SPECT Lung Cancer Images Using Deep Learning. Front. Oncol. 2023, 13, 1165664. [Google Scholar] [CrossRef] [PubMed]
- Kwon, K.; Hwang, D.; Oh, D.; Kim, J.H.; Yoo, J.; Lee, J.S.; Lee, W.W. CT-Free Quantitative SPECT for Automatic Evaluation of% Thyroid Uptake Based on Deep-Learning. Ejnmmt. Phys. 2023, 10, 20. [Google Scholar] [CrossRef]
- Lin, Q.; Man, Z.; Cao, Y.; Wang, H. Automated Classification of Whole-Body SPECT Bone Scan Images with VGG-Based Deep Networks. Int. Arab. J. Inf. Technol. 2023, 20, 1–8. [Google Scholar] [CrossRef]
- Ni, Y.C.; Tseng, F.P.; Pai, M.C.; Hsiao, I.T.; Lin, K.J.; Lin, Z.K.; Lin, W.B.; Chiu, P.Y.; Hung, G.U.; Chang, C.C.; et al. Detection of Alzheimer’s Disease Using ECD SPECT Images by Transfer Learning from FDG PET. Ann. Nucl. Med. 2021, 35, 889–899. [Google Scholar] [CrossRef] [PubMed]
- Ronneberger, O.; Fischer, P.; Brox, T. U-Net: Convolutional Networks for Biomedical Image Segmentation. In Proceedings of the Medical Image Computing and Computer-Assisted Intervention–MICCAI 2015: 18th International Conference, Munich, Germany, 5–9 October 2015; Proceedings, Part III 18. Springer: Berlin/Heidelberg, Germany, 2015; pp. 234–241. [Google Scholar] [CrossRef]
- Xiao, X.; Lian, S.; Luo, Z.; Li, S. Weighted Res-UNet for High-Quality Retina Vessel Segmentation. In Proceedings of the 2018 Ninth International Conference on Information Technology in Medicine and Education(ITME 2018), Hangzhou, China, 19–21 October 2018; pp. 327–331. [Google Scholar] [CrossRef]
- Zhou, Z.; Rahman Siddiquee, M.M.; Tajbakhsh, N.; Liang, J. UNet++: A Nested U-Net Architecture for Medical Image Segmentation. In Proceedings of the Deep Learning in Medical Image Analysis and Multimodal Learning for Clinical Decision, Granada, Spain, 20 September 2018; Springer International Publishing: Cham, Switzerland, 2018; pp. 3–11. [Google Scholar] [CrossRef]
- Patel, K.; Bur, A.M.; Wang, G. Enhanced U-Net: A Feature Enhancement Network for Polyp Segmentation. In Proceedings of the 2021 18th Conference on Robots and Vision (CRV), Burnaby, BC, Canada, 26–28 May 2021; pp. 181–188. [Google Scholar] [CrossRef]
- Schlemper, J.; Oktay, O.; Schaap, M.; Heinrich, M.; Kainz, B.; Glocker, B.; Rueckert, D. Attention Gated Networks: Learning to Leverage Salient Regions in Medical Images. Med. Image Anal. 2019, 53, 197–207. [Google Scholar] [CrossRef] [PubMed]
- Zhang, S.j.; Peng, Z.; Li, H. SAU-Net: Medical Image Segmentation Method Based on U-Net and Self-Attention. Acta Electonica Sin. 2022, 50, 1. [Google Scholar]
- Chen, J.; Lu, Y.; Yu, Q.; Luo, X.; Adeli, E.; Wang, Y.; Lu, L.; Yuille, A.L.; Zhou, Y. Transunet: Transformers Make Strong Encoders for Medical Image Segmentation. arXiv 2021, arXiv:2102.04306. [Google Scholar] [CrossRef]
- Wang, H.; Cao, P.; Wang, J.; Zaiane, O.R. UCTransNet: Rethinking the Skip Connections in U-Net from a Channel-wise Perspective with Transformer. In Proceedings of the Thirty-Sixty AAAI Conference on Artificial Intelligence, Online Conference, 22 February–1 March 2022; pp. 2441–2449. [Google Scholar] [CrossRef]
- Liu, Z.; Lin, Y.; Cao, Y.; Hu, H.; Wei, Y.; Zhang, Z.; Lin, S.; Guo, B. Swin Transformer: Hierarchical Vision Transformer Using Shifted Windows. In Proceedings of the 2021 IEEE/CVF International Conference on Computer Vision (ICCV 2021), Montreal, QC, Canada, 10–17 October 2021; pp. 9992–10002. [Google Scholar] [CrossRef]
- Zhang, Y.; Liu, H.; Hu, Q. TransFuse: Fusing Transformers and CNNs for Medical Image Segmentation. In Proceedings of the Medical Image Computing and Computer Assisted Intervention-Miccai, Strasbourg, France, 27 September–1 October 2021; PT I, Lecture Notes in Computer Science. DeBruijne, M., Cattin, P., Cotin, S., Padoy, N., Speidel, S., Zheng, Y., Essert, C., Eds.; Springer: Berlin/Heidelberg, Germany, 2021; Volume 12901, pp. 14–24. [Google Scholar] [CrossRef]
- Zhu, Z.; He, X.; Qi, G.; Li, Y.; Cong, B.; Liu, Y. Brain Tumor Segmentation Based on the Fusion of Deep Semantics and Edge Information in Multimodal MRI. Inform. Fusion 2023, 91, 376–387. [Google Scholar] [CrossRef]
- Ma, J.; He, Y.; Li, F.; Han, L.; You, C.; Wang, B. Segment Anything in Medical Images. Nat. Commun. 2024, 15, 654. [Google Scholar] [CrossRef] [PubMed]
- Fu, B.; Peng, Y.; He, J.; Tian, C.; Sun, X.; Wang, R. HmsU-Net: A hybrid Multi-Scale U-net Based on a CNN and Transformer for Medical Image Segmentation. Comput. Biol. Med. 2024, 170, 108013. [Google Scholar] [CrossRef] [PubMed]
- Lyu, Y.; Xu, Y.; Jiang, X.; Liu, J.; Zhao, X.; Zhu, X. AMS-PAN: Breast Ultrasound Image Segmentation Model Combining Attention Mechanism and Multi-Scale Features. Biomed. Signal. Proces. 2023, 81, 104425. [Google Scholar] [CrossRef]
- Lin, A.; Chen, B.; Xu, J.; Zhang, Z.; Lu, G.; Zhang, D. Ds-Transunet: Dual Swin Transformer U-Net for Medical Image Segmentation. IEEE T. Instrum. Meas. 2022, 71, 4005615. [Google Scholar] [CrossRef]
- Valanarasu, J.M.J.; Oza, P.; Hacihaliloglu, I.; Patel, V.M. Medical Transformer: Gated Axial-Attention for Medical Image Segmentation. In Proceedings of the Medical Image Computing and Computer Assisted Intervention–MICCAI 2021: 24th International Conference, Strasbourg, France, 27 September 27–1 October 2021; Proceedings, Part I 24. Springer: Berlin/Heidelberg, Germany, 2021; pp. 36–46. [Google Scholar] [CrossRef]
- Wu, H.; Chen, S.; Chen, G.; Wang, W.; Lei, B.; Wen, Z. FAT-Net: Feature Adaptive Transformers for Automated Skin Lesion Segmentation. Med. Image. Anal. 2022, 76, 102327. [Google Scholar] [CrossRef] [PubMed]
- Liu, B.; Wu, R.; Bi, X.; Xiao, B.; Li, W.; Wang, G.; Gao, X. D-Unet: A Dual-encoder U-Net for Image Splicing Forgery Detection and Localization. arXiv 2020, arXiv:2012.01821. [Google Scholar]
- Karri, M.; Annavarapu, C.S.R.; Acharya, U.R. Explainable Multi-module Semantic Guided Attention Based Network for Medical Image Segmentation. Comput. Biol. Med. 2022, 151, 106231. [Google Scholar] [CrossRef] [PubMed]
- Wang, B.; Qin, J.; Lv, L.; Cheng, M.; Li, L.; Xia, D.; Wang, S. MLKCA-Unet: Multiscale large-kernel Convolution and Attention in Unet for Spine MRI Segmentation. Optik 2023, 272, 170277. [Google Scholar] [CrossRef]
- Woo, S.; Park, J.; Lee, J.Y.; Kweon, I.S. CBAM: Convolutional Block Attention Module. In Proceedings of the European Conference on Computer Vision (ECCV); Springer: Berlin/Heidelberg, Germany, 2018; pp. 3–19. [Google Scholar] [CrossRef]
- Hu, S.; Zhang, J.; Xia, Y. Boundary-Aware Network for Kidney Tumor Segmentation. In Proceedings of the Machine Learning in Medical Imaging: 11th International Workshop, MLMI 2020, Held in Conjunction with MICCAI 2020, Lima, Peru, 4 October 2020; Proceedings 11. Springer: Berlin/Heidelberg, Germany, 2020; pp. 189–198. [Google Scholar] [CrossRef]
- Tang, C.; Chen, H.; Li, X.; Li, J.; Zhang, Z.; Hu, X. Look Closer to Segment Better: Boundary Patch Refinement for Instance Segmentation. In Proceedings of the Proceedings of the IEEE/CVF Conference on Computer Vision and Pattern Recognition, Nashville, TN, USA, 20–25 June 2021; pp. 13926–13935. [Google Scholar] [CrossRef]
- Cao, H.; Wang, Y.; Chen, J.; Jiang, D.; Zhang, X.; Tian, Q.; Wang, M. Swin-Unet: Unet-like Pure Transformer for Medical Image Segmentation. In Proceedings of the ECCV Workshops; Springer: Berlin/Heidelberg, Germany, 2021. [Google Scholar] [CrossRef]
- Xu, Q.; Duan, W.; He, N. DCSAU-Net: A Deeper and More Compact Split-Attention U-Net for Medical Image Segmentation. Comput. Biol. Med. 2022, 154, 106626. [Google Scholar] [CrossRef] [PubMed]
- Pang, B.; Chen, L.; Tao, Q.; Wang, E.; Yu, Y. GA-UNet: A Lightweight Ghost and Attention U-Net for Medical Image Segmentation. J. Imaging Inform. Med. 2024. (Early Access). [Google Scholar] [CrossRef]
- Yuan, L.; Song, J.; Fan, Y. MCNMF-Unet: A mixture Conv-MLP Network With Multi-Scale Features Fusion Unet for Medical Image Segmentation. PeerJ. Comput. Sci. 2024, 10, e1798. [Google Scholar] [CrossRef]
- Hu, B.; Zhou, P.; Yu, H.; Dai, Y.; Wang, M.; Tan, S.; Sun, Y. LeaNet: Lightweight U-Shaped Architecture for High-Performance Skin Cancer Image Segmentation. Comput. Biol. Med. 2024, 169, 107919. [Google Scholar] [CrossRef] [PubMed]
- Liu, Y.; Yao, S.; Wang, X.; Chen, J.; Li, X. MD-UNet: A Medical Image Segmentation Network Based on Mixed Depthwise Convolution. Med. Biol. Eng. Comput. 2023, 62, 1201–1212. [Google Scholar] [CrossRef] [PubMed]


| Categories | U-Net | SAU-Net | TransUNet | UCTransNet | HmsU-Net | UTAC-Net |
|---|---|---|---|---|---|---|
| background | 99.64 | 99.64 | 99.67 | 99.68 | 99.65 | 99.69 |
| 11 | 86.14 | 84.09 | 92.25 | 92.51 | 90.15 | 92.72 |
| 21 | 86.90 | 88.59 | 82.84 | 91.57 | 89.22 | 92.31 |
| 12 | 81.94 | 82.24 | 88.07 | 84.87 | 84.42 | 86.84 |
| 22 | 73.90 | 85.70 | 85.31 | 85.46 | 84.86 | 85.81 |
| 13 | 76.08 | 87.59 | 87.73 | 88.50 | 85.18 | 88.65 |
| 23 | 81.53 | 82.01 | 89.92 | 89.30 | 86.50 | 90.92 |
| 14 | 77.51 | 80.02 | 80.20 | 86.39 | 78.61 | 87.13 |
| 24 | 76.82 | 78.96 | 79.62 | 83.76 | 78.82 | 86.67 |
| 15 | 75.66 | 76.31 | 83.77 | 85.00 | 85.46 | 86.50 |
| 25 | 77.88 | 77.65 | 85.70 | 85.29 | 85.52 | 87.92 |
| 16 | 86.01 | 87.79 | 86.88 | 88.03 | 90.50 | 94.48 |
| 26 | 84.24 | 86.01 | 90.42 | 89.87 | 90.32 | 93.03 |
| mDice | 81.19 | 84.67 | 87.35 | 88.64 | 86.83 | 90.35 |
| Categories | U-Net | SAU-Net | TransUNet | UCTransNet | HmsU-Net | UTAC-Net |
|---|---|---|---|---|---|---|
| background | 99.28 | 99.28 | 99.34 | 99.36 | 99.30 | 99.38 |
| 11 | 65.65 | 72.55 | 85.61 | 86.06 | 82.07 | 86.43 |
| 21 | 66.83 | 79.52 | 70.71 | 84.45 | 80.54 | 85.72 |
| 12 | 69.40 | 69.83 | 78.68 | 73.71 | 73.04 | 76.74 |
| 22 | 58.61 | 74.98 | 74.38 | 74.61 | 73.70 | 75.15 |
| 13 | 61.39 | 77.92 | 78.14 | 79.37 | 74.19 | 79.61 |
| 23 | 68.82 | 69.51 | 81.69 | 80.66 | 76.21 | 83.36 |
| 14 | 63.28 | 66.70 | 66.96 | 76.04 | 64.76 | 77.20 |
| 24 | 62.37 | 65.23 | 66.15 | 72.06 | 65.04 | 76.48 |
| 15 | 60.85 | 61.69 | 72.07 | 73.91 | 74.61 | 76.21 |
| 25 | 63.78 | 63.46 | 74.98 | 74.36 | 74.70 | 78.45 |
| 16 | 75.45 | 78.23 | 76.81 | 78.62 | 82.65 | 89.53 |
| 26 | 72.77 | 75.45 | 82.51 | 81.60 | 82.35 | 86.96 |
| mIoU | 68.34 | 73.41 | 77.54 | 79.60 | 77.17 | 82.40 |
| Network | Dice (%) | IoU (%) |
|---|---|---|
| U-Net [22] | 89.24 | 80.57 |
| U-Net++ [24] | 90.61 | 82.83 |
| ResU-Net [23] | 90.43 | 82.53 |
| Swin-Unet [45] | 85.90 | 75.28 |
| DCSAU-Net [46] | 90.41 | 84.10 |
| GA-UNet [47] | 89.81 | 81.50 |
| HmsU-Net [34] | 91.85 | 84.93 |
| MCNMF-Unet [48] | 89.96 | 81.75 |
| LeaNet [49] | 88.89 | 78.93 |
| MDU-Net [50] | 91.58 | 84.81 |
| UTAC-Net(Ours) | 91.75 | 84.76 |
| Module | Metric | ||||
|---|---|---|---|---|---|
| Network | Transformer | ABFM | CAM | mDice (%) | mIoU (%) |
| U-Net | - | - | - | 81.19 | 68.34 |
| Ours | ✓ | - | - | 87.35 | 77.54 |
| Ours | ✓ | ✓ | - | 88.15 | 78.81 |
| Ours | ✓ | ✓ | ✓ | 90.35 | 82.40 |
Disclaimer/Publisher’s Note: The statements, opinions and data contained in all publications are solely those of the individual author(s) and contributor(s) and not of MDPI and/or the editor(s). MDPI and/or the editor(s) disclaim responsibility for any injury to people or property resulting from any ideas, methods, instructions or products referred to in the content. |
© 2024 by the authors. Licensee MDPI, Basel, Switzerland. This article is an open access article distributed under the terms and conditions of the Creative Commons Attribution (CC BY) license (https://creativecommons.org/licenses/by/4.0/).
Share and Cite
Li, W.; Zhang, W. UTAC-Net: A Semantic Segmentation Model for Computer-Aided Diagnosis for Ischemic Region Based on Nuclear Medicine Cerebral Perfusion Imaging. Electronics 2024, 13, 1466. https://doi.org/10.3390/electronics13081466
Li W, Zhang W. UTAC-Net: A Semantic Segmentation Model for Computer-Aided Diagnosis for Ischemic Region Based on Nuclear Medicine Cerebral Perfusion Imaging. Electronics. 2024; 13(8):1466. https://doi.org/10.3390/electronics13081466
Chicago/Turabian StyleLi, Wangxiao, and Wei Zhang. 2024. "UTAC-Net: A Semantic Segmentation Model for Computer-Aided Diagnosis for Ischemic Region Based on Nuclear Medicine Cerebral Perfusion Imaging" Electronics 13, no. 8: 1466. https://doi.org/10.3390/electronics13081466
APA StyleLi, W., & Zhang, W. (2024). UTAC-Net: A Semantic Segmentation Model for Computer-Aided Diagnosis for Ischemic Region Based on Nuclear Medicine Cerebral Perfusion Imaging. Electronics, 13(8), 1466. https://doi.org/10.3390/electronics13081466