Article

Electromagnetic Environment Assessment and Safety Research of Electrified High-Speed Railway Carriages

School of Automation & Electrical Engineering, Lanzhou Jiaotong University, Anning District, Lanzhou 730070, China
*
Author to whom correspondence should be addressed.
Electronics 2024, 13(4), 740; https://doi.org/10.3390/electronics13040740
Submission received: 2 January 2024 / Revised: 7 February 2024 / Accepted: 8 February 2024 / Published: 12 February 2024
(This article belongs to the Special Issue Advances in Electromagnetic Interference and Protection)

Abstract

:
With the advent of modern, high-speed electrified rail systems, there has been increasing concern about electromagnetic safety in rail carriages. The aim of this study was to assess the electromagnetic safety of passengers on trains by utilizing advanced 3D electromagnetic simulation software. A comprehensive model of the electromagnetic environment experienced by passengers on a CR400AF train, specifically under the influence of catenary radiation, was constructed. We analyzed the magnetic field strength, electric field strength, and current density in the brains of 20 passengers in various positions in the train. The findings revealed that among the 20 passengers analyzed, the maximum and minimum magnetic induction intensity recorded in the brain were 8.41 and 0.01 μ T , respectively. The maximum and minimum induced electric field intensities were 1110 and 10 μ V / m , respectively. Lastly, the maximum and minimum induced current densities were 1200 and 10 μ A / m 2 , respectively. The results show that when people ride on the CR400AF train, the magnetic induction intensity, induced electric field strength, and induced current density in the brain are below the recommended basic limits of exposure to power frequency electromagnetic fields in the guidelines of the International Committee on Non-Ionizing Radiation Protection. The power frequency magnetic field generated by the catenary can be effectively shielded by the aluminum alloy car body. The final result of this study indicates that the electromagnetic exposure from the contact wire at the level 25 kV does not pose a threat to the health of passengers on the CR400AF train.

1. Introduction

As of January 2023, the total operating mileage of China’s high-speed rail reached 42,000 km, and China entered the era of high-speed rail, the coverage of which for cities with a population over one million exceeds 95%. High-speed rail is an important symbol of transportation modernization. Since 2008, when China’s first intercity railway from Beijing to Tianjin (with a design speed of 350 km/h) was completed and started operation, numerous high-speed railways have been completed and commenced operation [1]. China has successfully built the world’s largest and most modern high-speed railway network. Statistics from China State Railway Group Co., Ltd. (Beijing, China), show that by the end of 2020, the country’s high-speed rail operating mileage reached 37,900 km, accounting for 69% of the world’s total high-speed rail mileage. In particular, the operating mileage of high-speed railways with speed of 300–350 km/h is 13,700 km (36%), and that with speeds of 200–250 km/h is 24,200 km (64%). The issue of whether the electromagnetic environment in high-speed electric multiple unit (EMU) carriages is safe has gradually attracted the attention of the public [2].
The study of electromagnetic exposure began overseas as early as the 20th century. In 1997, Farag et al. conducted a study on human exposure to power-frequency electromagnetic fields. They particularly investigated the actual measurement of the strength of electromagnetic fields under transmission and distribution lines and near substations, including from household appliances. They also provided data to help understand the size of electromagnetic fields that may be encountered in different places and to estimate possible occupational and residential exposure levels [3]. Psenakova et al. simulated the long-term exposure of passengers to radio frequency fields when using mobile phones in trains. They measured the electric field strength in the carriage during voice calls using the planer inverted F-shaped antenna (PIFA) as a radiation source. Their measurement results met the specified electromagnetic field safety threshold [4].
As of January 2023, the operating mileage of China’s high-speed railways reached 42,000 km, and the total operating mileage of railways in the country exceeded 155,000 km, putting the system in first place globally. In July 2010, Feng et al. conducted electromagnetic tests on the China Railways High-Speed 1 (CRH1) EMU, operated by the Chengguan Passenger Line, and provided actual measurement data for studying the electromagnetic radiation generated by the offline phenomenon of pantographs [5]. In 2013, Shuangyun et al. studied the relevant electromagnetic compatibility technology of China’s high-speed rail EMUs and constructed a theoretical analysis model using the actual measurement results. They provided a reliable technical and theoretical basis for studying the electromagnetic compatibility of high-speed rail EMUs [6]. In 2018, Tian et al. conducted a safety assessment of the low-frequency electromagnetic field radiation of the CRH5 EMU. They concluded that being exposed to low-frequency magnetic field in a carriage will not cause harm to passengers [7]. Yang and Lu studied the electromagnetic exposure of railway pantograph arcs to railway ground workers and concluded that the electromagnetic radiation generated by pantograph arcs does not affect the health of railway workers when raising and lowering pantographs [8].
Yuan et al. studied health problems related to power frequency electromagnetic fields from the catenaries of high-speed railways in water supply work. Their research constructed a model of water supply workers and concluded that the power frequency electric field in the water supply work environment would not harm their health [9]. Li et al. conducted research on the impact of occupational exposure to the environment of 220 and 500 kV distribution lines on neurobehavioral aspects, such as short-term memory and cognitive abilities [10]. A study by Lorich et al. revealed that electric fields contribute to the growth of osteoblasts [11]. Jian et al. found that a 50 Hz, 4.8 mT sinusoidal alternating current electromagnetic field had a promoting effect on the differentiation and maturation of osteoblasts [12]. Hakansson et al. demonstrated that people exposed to strong electric currents in the range of 1–100 kA did not have an increased risk of Alzheimer’s disease [13]. Investigating certain health indicators for adolescents near 500 kV transmission lines, Wang identified a correlation between high-voltage transmission lines and elevated hemoglobin levels and decreased immune function [14]. In recent years, Jiali et al. have conducted in-depth research on the health effects of very low frequency and radio-frequency electromagnetic fields, as well as the associated health risks. In summary, research on the electromagnetic radiation of high-speed rail, especially the impact on passengers, is still popular [15,16,17].
High-speed railway is a means of transportation that integrates multiple types of equipment and systems, and the electrical energy that drives high-speed rail bullet trains is provided by the catenary contact line above the train. The electric energy is directly transmitted from the traction substation to the EMU by the catenary contact line. A catenary contact wire is an exposed cable directly above the roof of the train car. According to the theoretical knowledge of electromagnetic fields, a power frequency magnetic field will be generated around the catenary, which will then fill the carriage below the contact line with power frequency magnetic field. Even though the CR400AF-type EMU uses a fully enclosed aluminum alloy body to shield the electromagnetic field influence of the high-power electrical equipment under the car and the contact line above the roof, this still does not eliminate passengers’ concerns about the safety of the electromagnetic environment in the driver’s cab and passenger cars [18].
Research on the safety of human exposure to the electromagnetic environment of high-speed rail mainly focuses on investigating the physical health of staff and passengers [19], and there are few studies on the impact of the power frequency electromagnetic field generated by the high-speed rail catenary line on the health of passengers in the real environment of high-speed bullet trains. Many tests and analyses have been carried out in China on the electromagnetic environment in the cabin and the driver’s cab of high-speed EMUs under different operating conditions, but there are few studies on the distribution of induced electromagnetic fields in human tissue, especially in the brain, which contains a large part of the central nervous system. At this stage, research on measuring the distribution of induced electromagnetic fields in the human body is progressing slowly. This study introduces the method of electromagnetic dosimetry for safety measurement to analyze the distribution of induced electromagnetic fields in the brain, which is of great practical significance.
In this study, a model of passenger exposure to low-frequency electromagnetic radiation from the contact line of a high-speed railway network is constructed and simulations are performed to obtain the relevant parameters, including induced magnetic field strength, induced electric field strength, and induced current density of the brain. The novelty of this research method is that it can provide a detailed understanding of the exposure of passengers to EMR in the vicinity of HSR trains, which can help in assessing the potential health effects of EMR on the human body. By performing an EM simulation, the distribution of EMF in real HSR lines and contact lines can be modelled. Compared with traditional experimental methods, Comsol 6.0 can acquire data more efficiently and reduce experimental cost and time. In addition, the simulation method can provide more detailed information, such as the distribution of electromagnetic field strength in different locations and directions, as well as the distribution of electric field and current density inside the human body. This information is very important for understanding the mechanism of the effect of electromagnetic radiation on the human body and developing corresponding protective measures.
In this study, we used Comsol6.0 to construct a model of the exposure of passengers to low-frequency electromagnetic radiation from the contact line of the catenary of a high-speed rail line. Through the simulation calculation, we obtained the induced magnetic field strength, induced electric field strength, and induced current density of the brain. The ICNIRP guidelines were utilized to evaluate the safety of passengers in the low-frequency electromagnetic field environment of the catenary contact line when traveling by high-speed rail.

2. CR400AF EMU Marshalling Principle and Electrical Principle

The Fuxing CR400AF train (China Railway 400) has eight cars. The CR400AF design adopts the 4M4T scheme, and the pantograph has two groups distributed at the top of TPO3 and TP06 [20]. Figure 1 shows a schematic of the CR400AF group, in which cars 2, 4, 5, and 7 of the CR400AF are EMUs.
The pantograph is transmitted from the catenary to the 25 kV single-phase power frequency alternating current, and then to the TBQ-55-6300/25 traction transformer. The traction transformer converts the large voltage into a 1500-V single-phase alternating current output to the rectifier. After the rectifier carries out AC–DC conversion, the direct current is output to the traction inverter through the intermediate DC link. Lastly, direct current is converted into three-phase alternating current and output to the YQ-625 traction motor, and the traction motor is transmitted to the wheelset drive train through the gearbox. In this study, we selected two front cars and one middle car for 1:1 modeling (see Figure 1).

3. Simulation Model

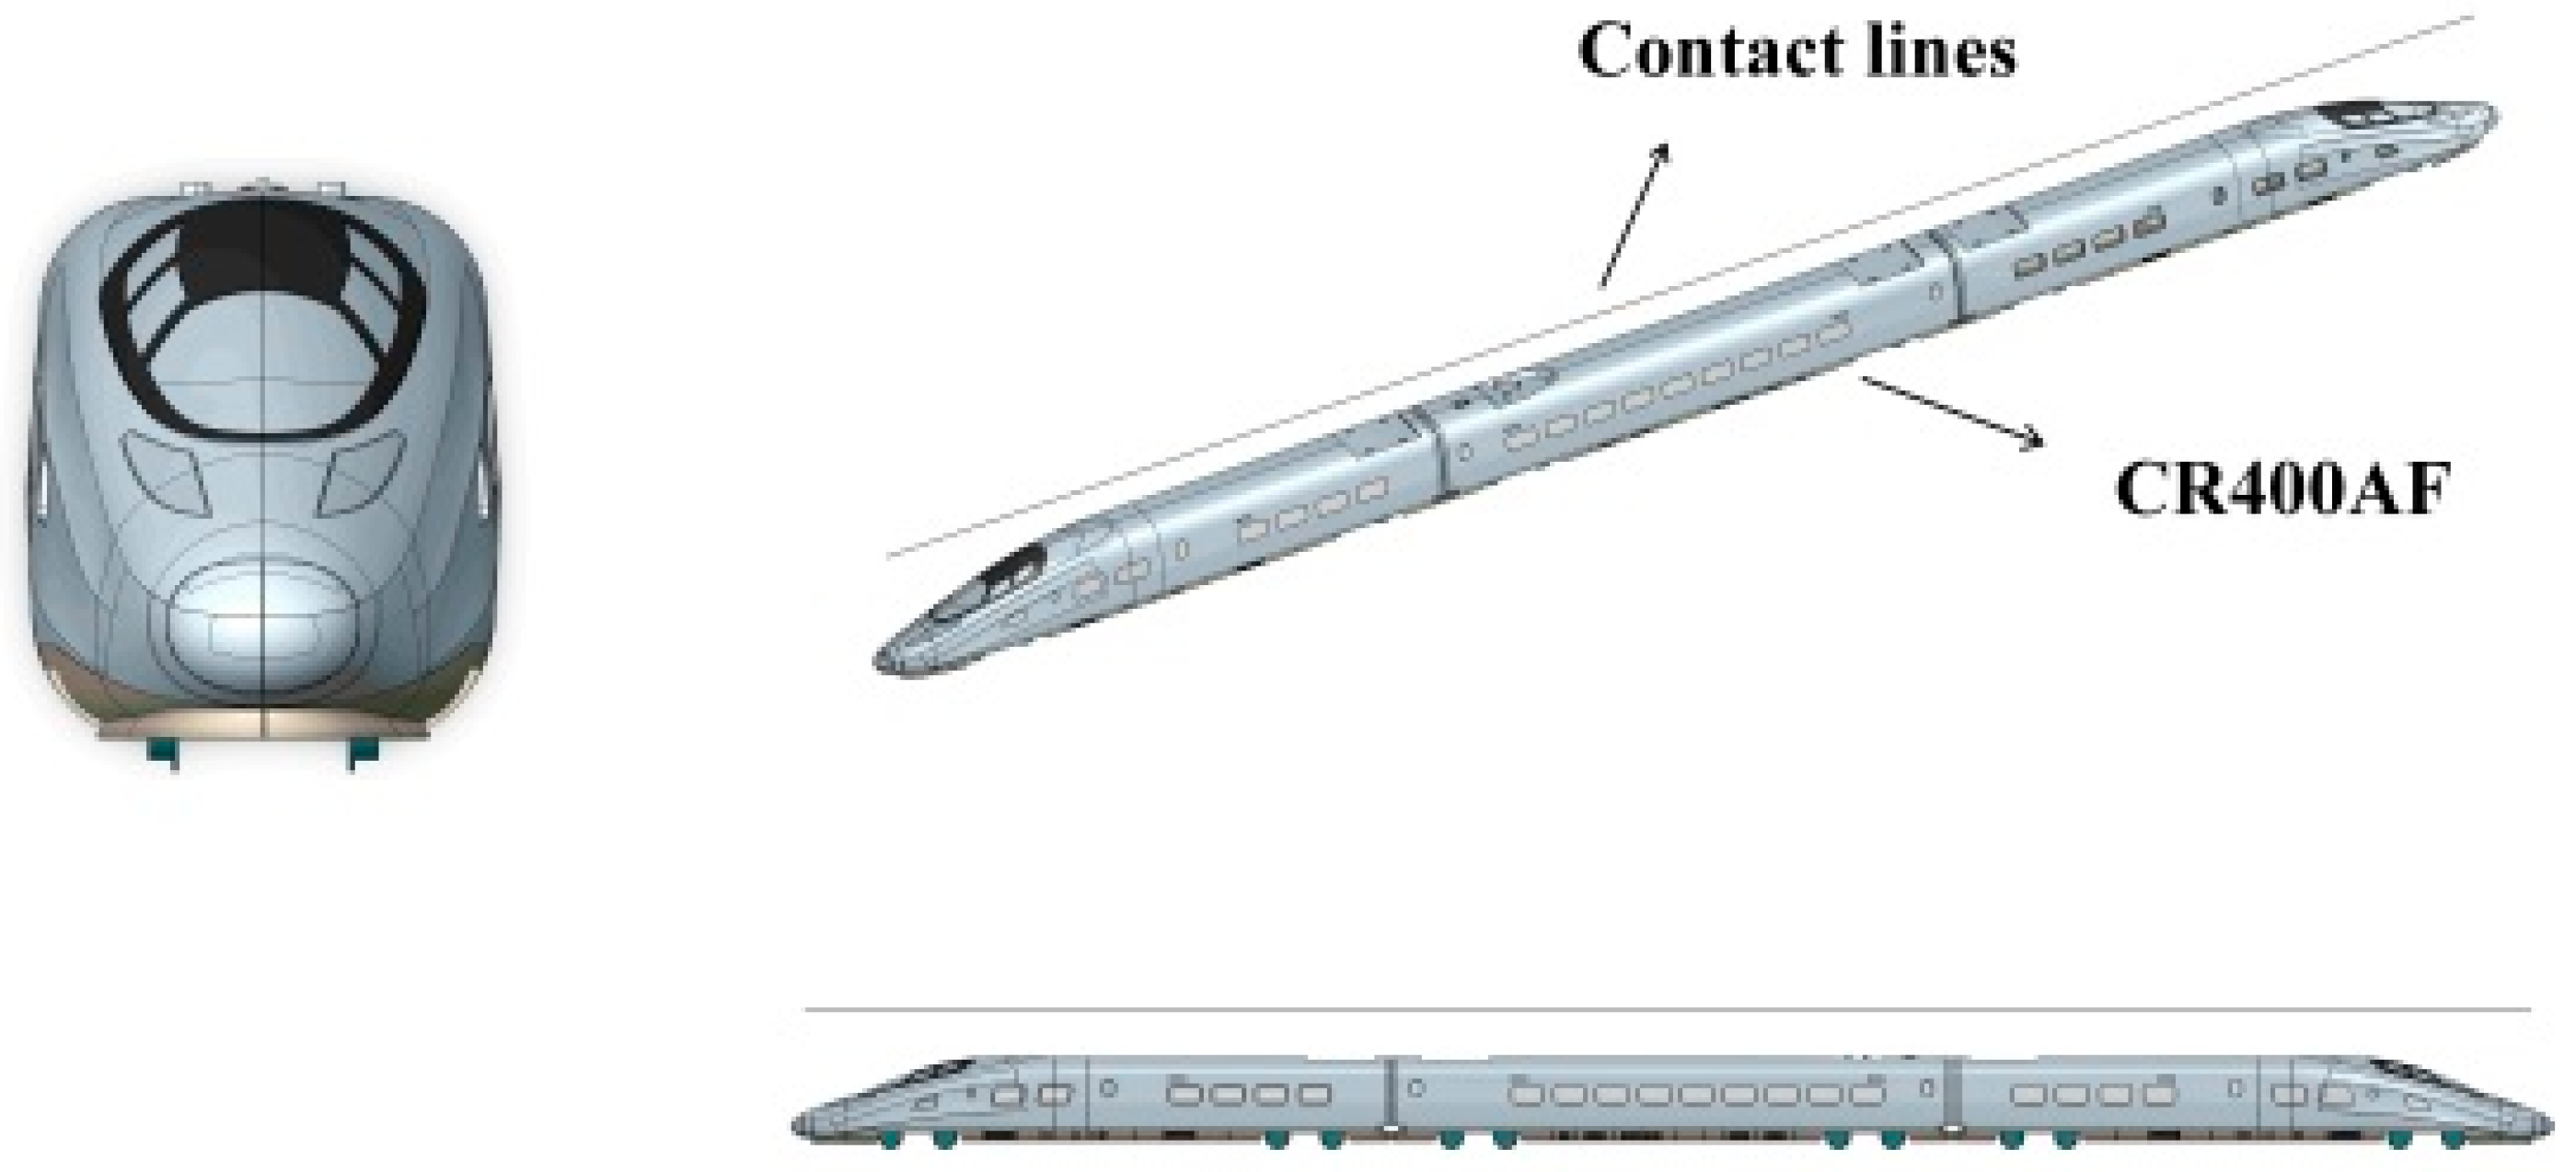
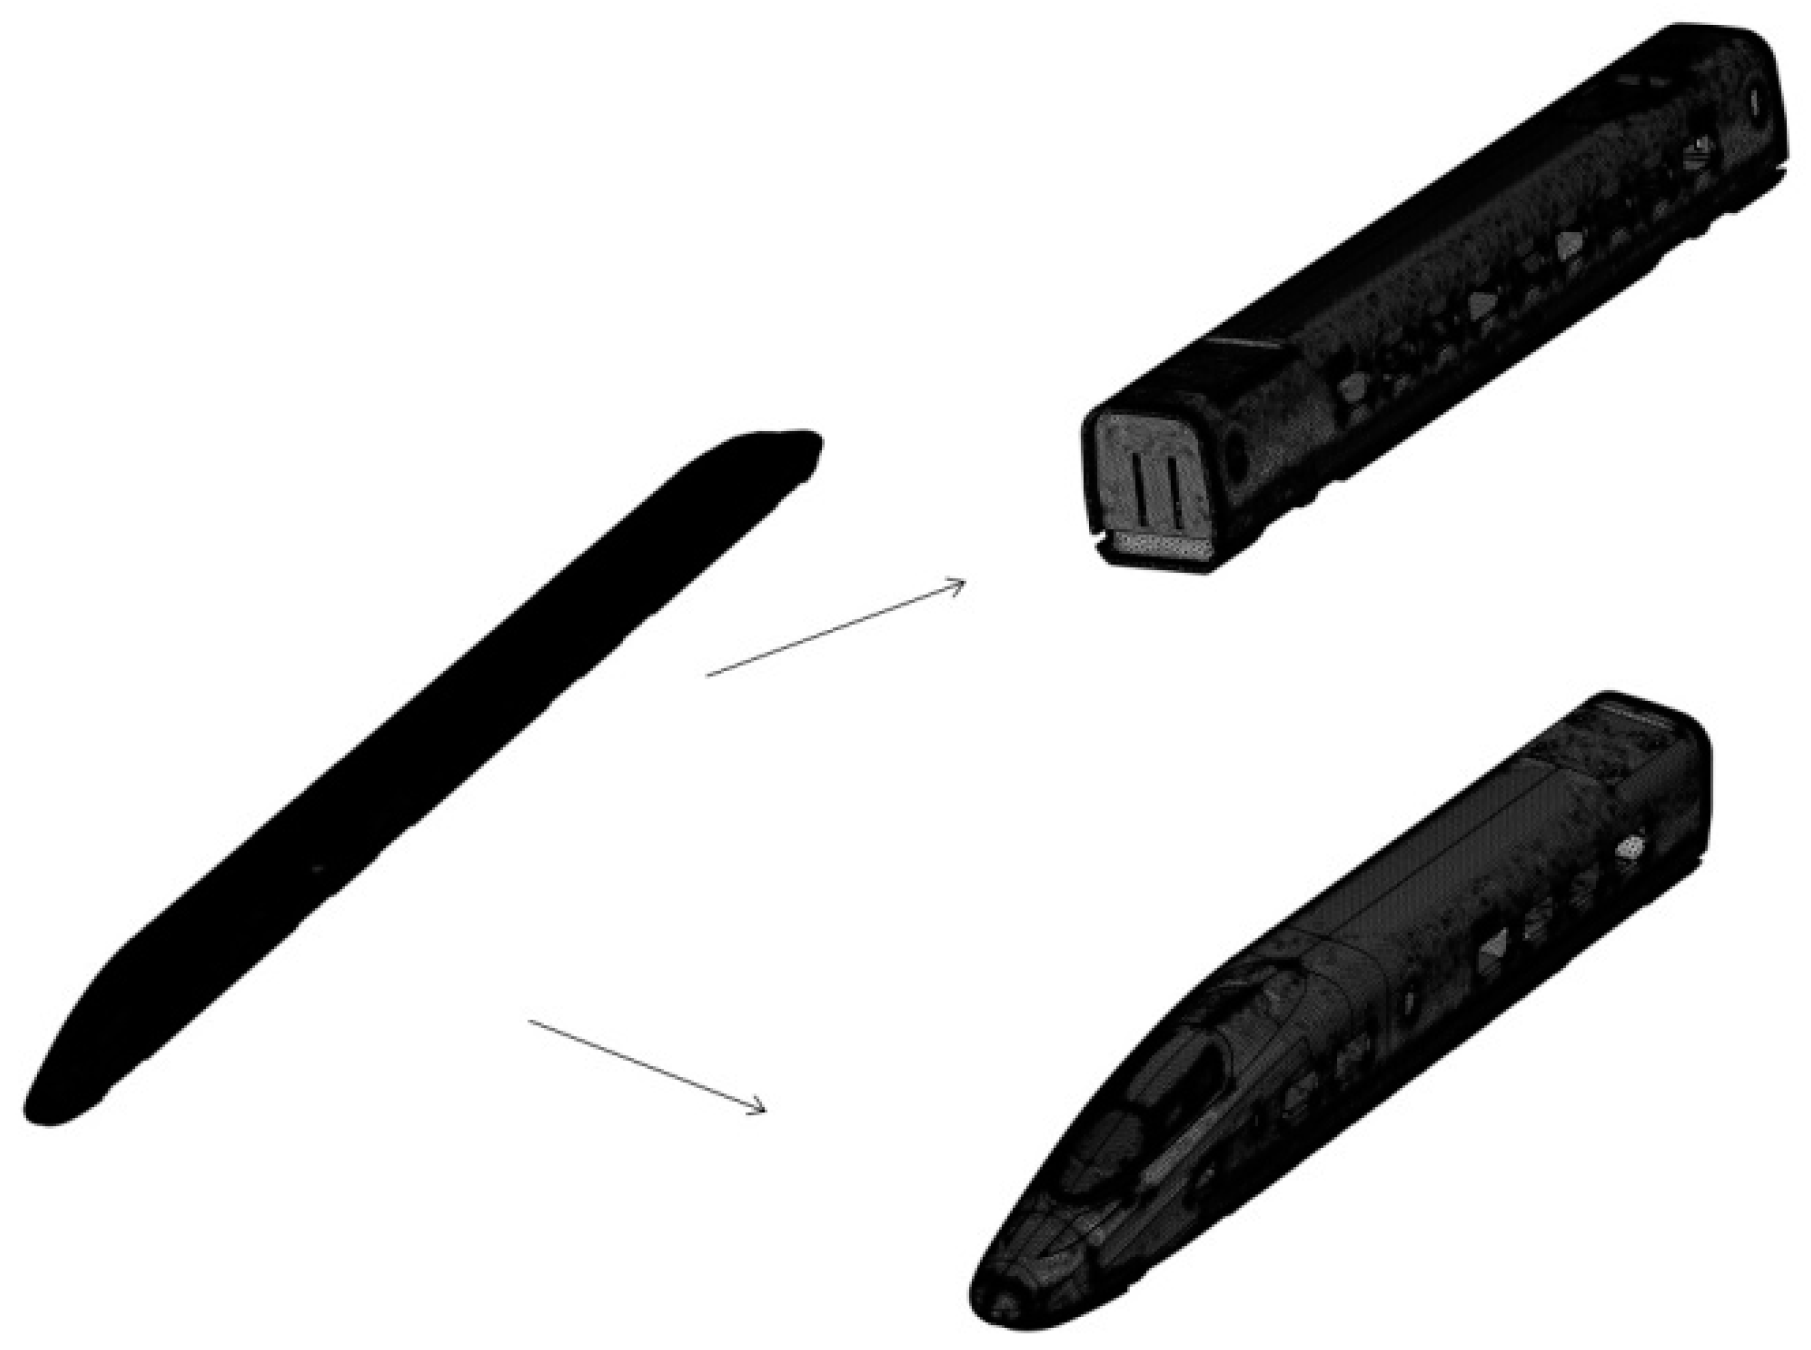
3.1. CR400AF EMU Model

CR400AF EMUs can be divided into three categories according to the roof mounting equipment: head cars, intermediate cars with pantographs, and intermediate cars without pantographs. The CR400AF-type EMU has the same driver’s cab with the same operation function at both ends of the EMU. The middle car body is mainly composed of end wall, underframe, side wall, and roof. Owing to the complex internal structure of the car body, the thickness of the side car, skin, and inner reinforcement is 50, 2.5, and 2.5 mm, respectively. To simplify the model and facilitate the calculation, the thickness of the unified car body was set as 50 mm. The main parameters of the car body are shown in Table 1.
The driver’s cab of the CR400AF type EMU has the characteristics of good strength and strong adaptability to the locomotive shape, and it uses new technology. The maximum width of the car body is 3.36 m, the height is 4.05 m, and the distance between the floor surface and the track surface is 1.26 m.
The Fuxing CR400AF high-speed railway EMU was modeled using Comsol6.0. To facilitate the computer simulation, we only modeled the head car and intermediate car on both sides and omitted the middle car seat and high-voltage electrical equipment under the car. Figure 2 shows the model of the CR400AF car body built using the 3D modeling software. The main material of the CR400AF body is aluminum alloy, and the material properties meet the provisions of TB/T3260, aluminum, and aluminum alloy for EMUs. The main section of the main body of the CR400AF-type EMU is 6A01-T5, the end underframe bearing profile and plate are 7B05-T5, and the plate is 5083. The catenary is a transmission line directly exposed to the air, and the pantograph conducts electric energy to drive the EMU. In this research, we mainly studied the radiation from the catenary electromagnetic environment of the car body and briefly modeled catenary. Lastly, in the existing literature, the distance between the contact line and rail surface is 5.7 m. The radius of the contact wire in the model is 6.93 mm.

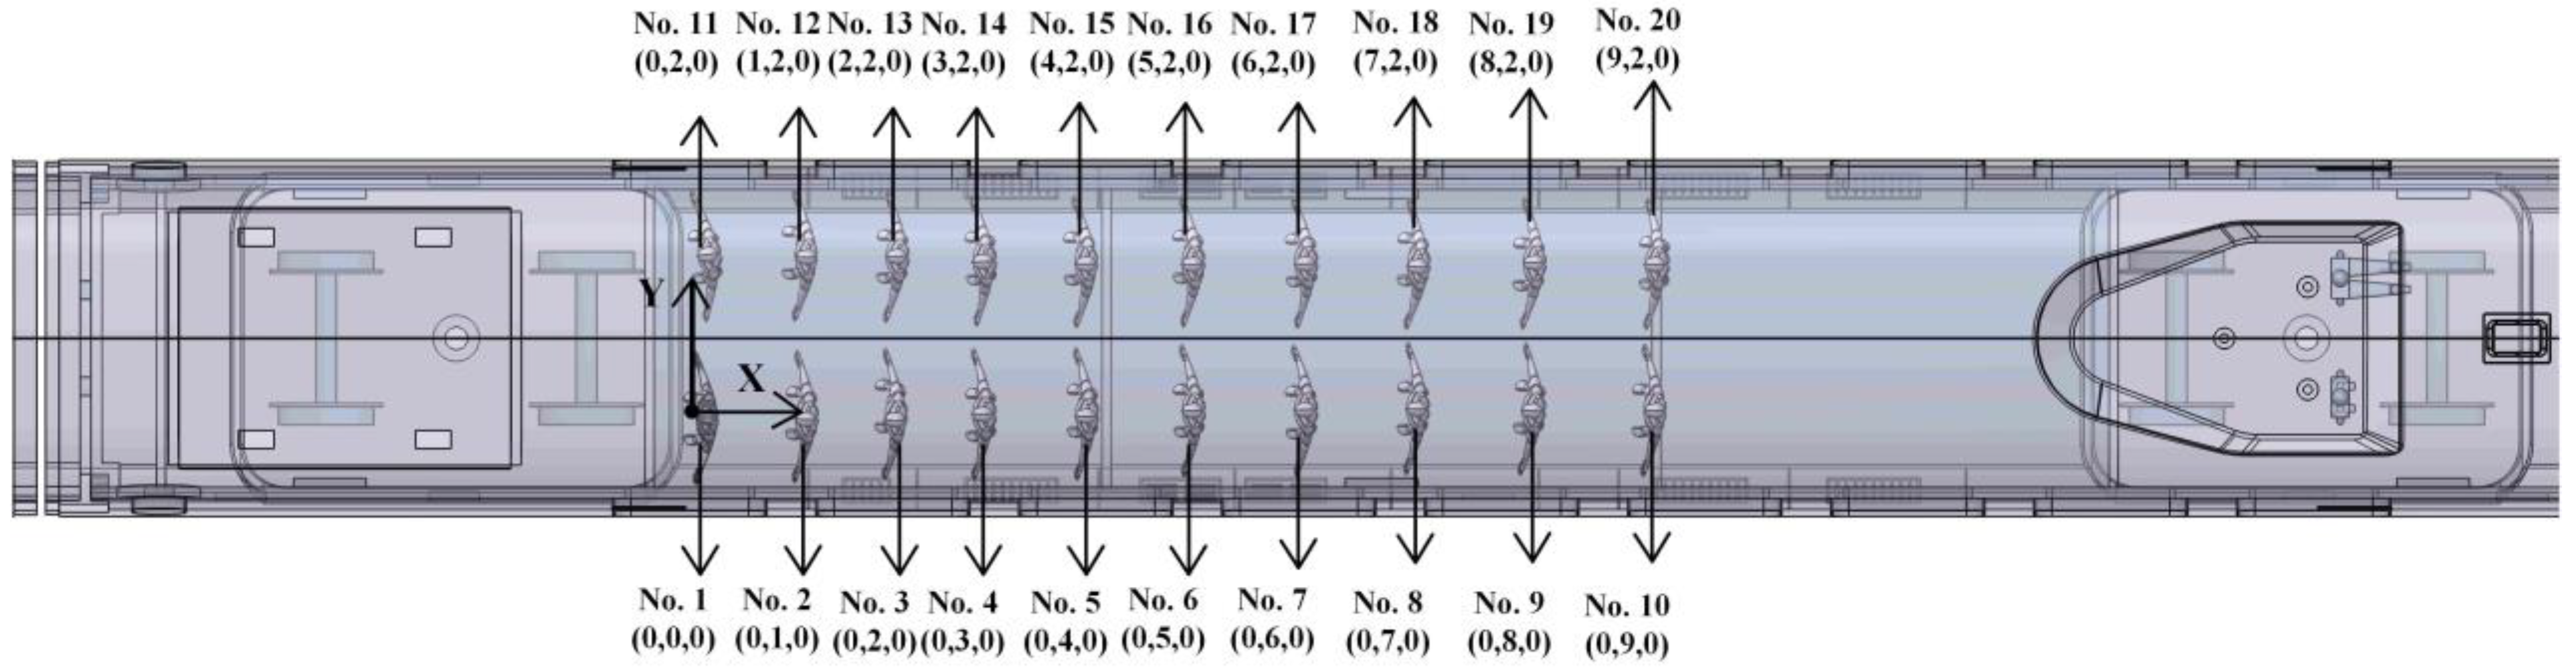
3.2. Passenger Model Building

We constructed simulated mannequins for the study in the 3D modeling software, rather than conducting real human trials. The team understands the importance of carrying out real human trials, but opted for a computer simulation approach based on ethical, regulatory, and safety considerations. We referred to many standards and high-level papers to obtain human parameters, as the main focus of this paper is the electromagnetic exposure of the brain. Simulating passengers’ brains in a simple way simplifies the handling of the brain, which is very complex in human beings, as it contains mainly white matter, gray matter, and spinal fluid, To make it easier to compute the brain’s dielectric constant, it is possible to make a reasonably close approximation taken as the average of the dielectric coefficient and conductivity value of the brain for the above mentioned tissues.
The dielectric constant and conductivity values for the human trunk were averaged over muscle, bone, and adipose tissue. Twenty mannequins were used according to the needs of the simulation [21,22,23]. The height of the mannequins was 1.74 m to represent the average Chinese male. The use of a uniform height simplifies the mathematical modeling and simulation process. In the simulation of electromagnetic fields, the use of uniform height reduces the complexity of the model, lowers the computational cost, and increases the efficiency of the study. Physiological parameters and properties of the human body are often studied and developed based on standard heights. The use of mannequins with uniform height facilitates adherence to these standards to ensure the reliability and comparability of study results. Uniform height mannequins are often used in risk assessment when developing safety standards and specifications for electromagnetic fields. This helps to ensure that the developed norms will protect people of different heights and will not pose an unreasonable risk to one group. In studies of biological effects, the use of uniform height mannequins helps to achieve consistency in the experimental conditions. This makes it easier to compare results between experiments and better understand the effects of electromagnetic exposure on living organisms.
In 1996, Gabriel et al. proposed a fourth-order Cole–Cole model to simulate the dielectric properties in a certain frequency range based on the relative permittivity and conductivity of 17 types of human biological tissue at a frequency of 10–20 GHz, while raising the prediction upper limit to 100 GHz [24,25,26,27,28]. In order to extract the dielectric constant of human biological tissue, the fourth-order Cole–Cole model of Equation (1) can be carried out [24,25,26,27,28,29].
ε r * = ε r j ε r = ε r + n = 1 4 Δ ε r n 1 + j ω τ n 1 α + σ i j ω ε 0
where ε r represents the complex relative permittivity, ε r indicates the relative permittivity (representing the real part of ε r ), ε r represents the loss factor (the imaginary part of ε r ), ε r indicates the relative permittivity value at the frequency of light, Δ ε r n represents the relative permittivity increment, τ n indicates the center relaxation time, α represents the time of relaxation distribution, which has a numeric value of 1 ( 0 α 1 ), σ i indicates ionic conductivity, ω indicates Angular frequency ( rad / s ), and ε 0 represents the vacuum dielectric constant ( F / m ).
The real part ε r and imaginary part ε r of the complex relative permittivity satisfy Equations (2) and (3), respectively:
ε = ε r
ω ε 0 ε = σ
where ε is the relative dielectric constant and σ is the conductivity of human tissue.
Along with Equations (1)–(3), the functional relationships (4) and (5) of relative dielectric constant ε and conductivity σ of human biological tissue with frequency can be obtained [30]:
ε = ε r + Δ ε n 1 + ω τ n 2 2 α n
σ = σ i + n = 1 4 ε 0 Δ ε r n ω 2 α n τ n 1 α n 1 + ω τ n 2 2 α n
According to Formulas (4) and (5) and the relevant data of [7], precise values for the relative permittivity and conductivity of human tissue at the corresponding frequencies can be obtained.
The working frequency of the contact line of the high-speed railway catenary is 50 Hz. In this study, we mainly focused on the influence of exposure to the electromagnetic field generated by the contact line on the human brain. The contents of human brain are extremely complex, mainly including white matter, gray matter, and cerebrospinal fluid. To facilitate the calculation, the dielectric constant of the brain can be reasonably estimated. The values of the dielectric constant and conductivity of the brain are the mean values of the aforementioned tissues. The dielectric constant and conductivity of the human torso were determined, and the mean values of the dielectric constant and conductivity of musculoskeletal and adipose tissue were taken.
Tissue permittivity and conductivity are calculated using Equation (1), in which all parameters were taken from [25,27,28]. The permittivity and conductivity of each tissue type are shown in Table 2.
After carrying out the modeling, the model of passengers in the motor train was established in the car body. Figure 3 shows a schematic of the passengers’ position and number.

3.3. Simulation Methodology and Model Mesh Segmentation

This study employed COMSOL Multiphysics, an advanced simulation software based on finite elements, to simulate real physical field phenomena by solving partial differential equations. The human body model, vehicle body, and radiation source were imported into the AC/DC module of the software, and material boundary conditions were configured. This allowed us to calculate the electromagnetic exposure experienced by passengers in the compartment due to the magnetic field generated by the railway contact line [30].
The body of the CR400AF-type EMU is composed of aluminum alloy materials, and finite element software was used to establish the EMU and human body models. For an accurate calculation, a sufficiently large air domain including the car and human body models should be established. Figure 4 and Figure 5 show meshing diagrams of the EMU and passenger body models, respectively [31,32]. The diameter of the catenary contact line in the model is 13.86 mm, and the size of the human head is at the millimeter level, which is smaller than the size of the bullet train. In this study, we used 5,855,227 tetrahedral grid cells, 2,645,312 human body cells, and 3,209,906 body and contact line cells.

4. Analysis of Numerical Solution Methods for Induced Electromagnetic Fields in the Human Body

When the passenger is in the power frequency magnetic field generated by the contact line of the catenary, an electric field and a magnetic field will be induced in the body due to the Faraday electromagnetic induction principle. The length of a train is much smaller than the wavelength of power frequency alternating current (6000 km), so the power frequency magnetic field generated by the catenary contact line in the environment where passengers ride is considered to be a quasi-static magnetic field. In order to analyze the effects of power frequency magnetic fields on the health of passengers, it is necessary to obtain information about low-frequency electromagnetic dosimetry, that is, the strength of the induced magnetic and electric field and the density of the induced current in various tissues of the human body. In practice, the parameters of these indicators in various tissues of the human body cannot be directly obtained by measurement, but it is feasible to obtain them by numerical calculation.
In this paper, the spatial magnetic field of the contact line of the high-speed rail catenary is solved using Maxwell’s Equations (6)–(10), and then the induced magnetic field strength.
× H = J + D t
× E = B t
B = 0
D = ρ
J = ρ t
where H is the magnetic field strength ( A / m ), J is the current density ( A / m 2 ), t is time, E is the induced electric field strength vector ( V / m ), D is the electric flux density ( C / m 2 ), B is the magnetic induction intensity ( T ), ρ is the charge density ( C / m 3 ), and is a three-dimensional gradient operator.
Since the contact line of the network is supplied with a single-phase voltage of 50 Hz, 25 kV, the influence of the rate of change of magnetic induction B t and displacement current D t can be disregarded; thus, we can obtain the quasi-static electric and magnetic fields generated by the contact line.
For the quasi-static electric field, the numerical calculation uses both sides of Equation (6) at the same time to obtain the dispersion:
ε E t + σ E = × H = 0
Because   E = ϕ
substituting Equation (12) into Equation (11), the left side of Equation (11) becomes
ε ϕ t + σ ϕ = 0
Equations (12) and (13) can be solved using the voltage generated by the electric field strength distribution, which can be obtained from the electric flux density, according to Equations (14)–(17) to determine the action of the external electric field on the human body after the distribution of the induced current.
P = D ε 0 ε r E
ρ V = P
ρ s b = P n
J = σ E
For quasi-static magnetic fields, numerical calculations are obtained by substituting B = × A into Maxwell’s system of equations:
× E + A t = 0
From Equation (18), E + A t is a spinless field, and we get:
E + A t = ϕ
2 A = μ J
2 ϕ = ρ ε
where A is the vector magnetic potential, W b / m ; ϕ is the potential, V .
D = ε E
To analyze and solve the distribution of the induced electromagnetic field in the quasi-static magnetic field in the human body, first we use Equation (20) with the value of the current to obtain the vector magnetic potential; then, according to that, we can obtain the distribution of the magnetic induction intensity; and then we use Equations (7) and (22) to find out the magnitude of the induced electric field and electric current in the human body.
Equations (1)–(5) are mainly used to find the exact values of the relative permittivity and conductivity of different human biological tissues at the corresponding frequencies. These values are then substituted into Equations (15) and (21) to find the distribution of induced currents, the induced electric field, and the magnitude of the induced currents in the human body after it is subjected to an external electric field.

5. Electromagnetic Expansion Criteria

Currently, two major mainstream international standards govern electromagnetic exposure: the ICNIRP standard [33,34,35] and the IEEE standard [36]. Table 3 lists the ICNIRP public exposure limits for time-varying electric and magnetic fields in the frequency range below 100 kHz. Table 4 outlines the IEEE basic limits of electric field strength, and Table 5 provides the maximum allowable exposure values for different tissues of the human body.

6. Result Analysis

The body of the CR400AF-type EMU is made of aluminum alloy material. In this study, we used finite element software to simulate and calculate the distribution of the induced electromagnetic field when the passengers in the carriage are exposed to the power frequency magnetic field under real conditions. The contact line of the high-speed rail catenary transmits electric energy to the EMU through the pantograph. The maximum current of the pantograph is 1000 A when it is safely operated. Hence, when the induced electromagnetic field distribution of the brain is distributed among 20 passengers, the current in the catenary is set to 1000 A [7], and then the simulation is calculated. The power frequency magnetic field generated by the catenary contact line enters the carriage in two ways. First, based on the principle of Faraday’s law, the electromagnetic field of the line generates an induced electromagnetic field in the carriage. Second, the magnetic field passes through the pores of the car body and enters the cabin.
The human brain contains a large part of the nervous system, which is easily affected by electromagnetic radiation. When passengers travel by bullet train, they are usually on the train for a long time. Accordingly, we simulated the distribution of electromagnetic fields induced in the heads of 20 passengers to determine whether the power frequency magnetic field generated by the catenary has an impact on the human brain. Figure 6, Figure 7, Figure 8, Figure 9, Figure 10, Figure 11, Figure 12, Figure 13, Figure 14, Figure 15, Figure 16, Figure 17, Figure 18, Figure 19, Figure 20, Figure 21, Figure 22, Figure 23, Figure 24, Figure 25 and Figure 26 show the magnetic field distribution on the surface of the brain of passengers 1 to 20, respectively, where (a) denotes the magnetic induction intensity distribution on the surface of the passengers’ brains, (b) denotes the magnetic induction intensity of the brains, (c) denotes the intensity of the induced electric field induced by the magnetic field, and (d) denotes the density of the electric current—(b), (c), and (d) refer to ZX sections of the human brain.
In the initial modeling, taking the position of the first passenger as the origin, the distance between the front and rear passengers is 1 m, and the distance between the left and right passengers is 2 m. The magnitude distribution of the magnetic induction intensity on the surface of the brains of passengers 1–20 is shown in Figure 6, Figure 7, Figure 8, Figure 9, Figure 10, Figure 11, Figure 12, Figure 13, Figure 14, Figure 15, Figure 16, Figure 17, Figure 18, Figure 19, Figure 20, Figure 21, Figure 22, Figure 23, Figure 24 and Figure 25; the maximum values are 7.5, 6.7, 6.33, 8.4, 7.03, 7.55, 7.0, 7.9, 8.4, 7.0, 5.59, 6.5, 4.1, 5.99, 5.2, 6.62, 4.54, 5.43, 8.41, and 6.7 μ T , respectively, and the minimum values are 0.03, 0.03, 0.04, 0.05, 0.04, 0.08, 0.07, 0.09, 0.06, 0.05, 0.03, 0.04, 0.06, 0.04, 0.05, 0.05, 0.02, 0.01, 0.05, and 0.06 μ T , respectively. Therefore, the magnetic flux on the surface of the passengers’ brains is still relatively uniform, and the magnetic induction intensity is slightly greater on the right side than the left side because of the existence of a window on the right side. This result also indicates that the shielding effect of the window is not as strong as the shielding effect of the aluminum alloy of the car body on the electromagnetic radiation of the catenary. Consequently, the electromagnetic radiation of the catenary when approaching the window will be slightly higher than the magnetic induction intensity of the surface of the side far away from the window.
Figure 26 shows the statistical charts of the maximum and minimum magnetic induction intensity on the brain surface of passengers 1–20.
Figure 26 shows that the maximum values of magnetic induction intensity on the surface of the 20 passengers’ brains are between 4 and 10 μ T , and Figure 27 shows that the minimum values are between 0.01 and 0.09 μ T . The limit of magnetic induction intensity under power frequency specified by ICNIRP is 200 μ T , and the maximum and minimum values shown in these figures are considerably below the specified value.
To further explore the influence of catenary radiation on passengers in the carriage, the magnetic induction intensity in the ZX cross-section of the passengers’ brains shown in Figure 6b, Figure 7b, Figure 8b, Figure 9b, Figure 10b, Figure 11b, Figure 12b, Figure 13b, Figure 14b, Figure 15b, Figure 16b, Figure 17b, Figure 18b, Figure 19b, Figure 20b, Figure 21b, Figure 22b, Figure 23b, Figure 24b and Figure 25b was obtained by cross-sectional processing. Accordingly, the maximum magnetic induction intensity of the ZX sections of passengers 1–20 is 4.59, 5.27, 3.45, 4.5, 4.56, 4.73, 3.71, 3.59, 4.94, 4.88, 5.59, 3.27, 3.68, 5.02, 3.97, 4.33, 3.31, 2.57, 3.96, and 4.16 μ T , respectively and the minimum intensity is 0.06, 0.06, 0.04, 0.04, 0.06, 0.005, 0.06, 0.07, 0.07, 0.01, 0.02, 0.03, 0.01, 0.02, 0.037, 0.02, 0.02, 0.02, 0.02, 0.03, and 0.02 μ T , respectively. Therefore, the maximum intensity occurs in the cerebral cortex of passengers under the catenary-induced electromagnetic field. Figure 28 and Figure 29 show the maximum and minimum statistical values of magnetic induction intensity in the ZX section of the brains of passengers 1–20.
Figure 28 shows that the maximum values of magnetic induction intensity in the ZX cross-section of the brains of the 20 passengers are between 3 and 9 μ T , and Figure 27 shows that the minimum values are between 0.05 and 0.07 μ T . ICNIRP stipulates that the magnetic induction intensity of power frequency should be limited to 200 μ T , and the maximum and minimum values shown in these figures are considerably below the specified value.
According to Faraday’s law of electromagnetic induction, the induced electric field intensity of the ZX section of the brains of passengers 1–20 was obtained. The maximum induced electric field intensity is 1110, 531, 515, 669, 783, 694, 533, 722, 680, 500, 700, 540, 135, 793, 498, 638, 233, 490, 790, and 430 μ V / m , respectively (Figure 6c, Figure 7c, Figure 8c, Figure 9c, Figure 10c, Figure 11c, Figure 12c, Figure 13c, Figure 14c, Figure 15c, Figure 16c, Figure 17c, Figure 18c, Figure 19c, Figure 20c, Figure 21c, Figure 22c, Figure 23c, Figure 24c and Figure 25c), and the minimum intensity is 50, 40, 50, 50, 40, 57, 60, 50, 50, 50, 50, 40, 10, 70, 50, 50, 30, 30, 50, and 40 μ V / m , respectively (Figure 6d, Figure 7d, Figure 8d, Figure 9d, Figure 10d, Figure 11d, Figure 12d, Figure 13d, Figure 14d, Figure 15d, Figure 16d, Figure 17d, Figure 18d, Figure 19d, Figure 20d, Figure 21d, Figure 22d, Figure 23d, Figure 24d and Figure 25d). Given that the influence of electromagnetic radiation generated by the catenary has a considerably uniform distribution of induced electric field intensity in the passengers’ brains, in the simulation calculation, under the condition of ensuring that the process is correct, the maximum value is not obvious in the figure. The reason is that the induced electric field intensity is caused by the magnetic induction intensity. The considerably small magnitude of the magnetic induction intensity causes the induced electric field intensity to change subtly in the actual cloud map. Figure 30 and Figure 31 show the maximum and minimum induced electric field intensity in the ZX section of the brains of passengers 1–20.
Figure 30 shows that the maximum values of the induced electric field of the passengers’ brains are between 1110 and 233 μ V / m , and Figure 31 shows that the minimum values are between 60 and 10 μ V / m . The ICNIRP stipulates that the intensity of an induced electric field for public exposure should be limited to 0.02 V / m . In this study, the maximum and minimum values of the induced electric field intensity in the brains of passengers are significantly smaller than the specified limit. Moreover, the power frequency magnetic field generated by the catenary will not affect passengers riding on the bullet train.
The ICNIRP power frequency public exposure limit also stipulates a limit for induced current density. The maximum values for induced current density in the ZX section of the brains of passengers 1–20 are 789, 377, 366, 475, 555, 492, 378, 512, 936, 753, 797, 383, 95.6, 563, 353, 453, 166, 347, 561, and 305 μ A / m 2 , respectively (Figure 6c, Figure 7c, Figure 8c, Figure 9c, Figure 10c, Figure 11c, Figure 12c, Figure 13c, Figure 14c, Figure 15c, Figure 16c, Figure 17c, Figure 18c, Figure 19c, Figure 20c, Figure 21c, Figure 22c, Figure 23c, Figure 24c and Figure 25c), and the minimum values are 80, 50, 30, 50, 30, 55, 40, 40, 60, 50, 60, 20, 5, 50, 30, 30, 10, 40, 60, 30, and 30 μ A / m 2 , respectively (Figure 6d, Figure 7d, Figure 8d, Figure 9d, Figure 10d, Figure 11d, Figure 12d, Figure 13d, Figure 14d, Figure 15d, Figure 16d, Figure 17d, Figure 18d, Figure 19d, Figure 20d, Figure 21d, Figure 22d, Figure 23d, Figure 24d and Figure 25d). Therefore, the induced current density in the brain is evenly distributed, and the maximum intensity occurs in the forebrain. Figure 32 and Figure 33 show the maximum and minimum induced current density in the ZX section of the brains of passengers 1–20.
Figure 32 shows that the maximum values of induced current density in the ZX section of the brains of the 20 passengers are between 1200 and 90 μ A / m 2 , and Figure 33 shows that the minimum values are between 80 and 10 μ A / m 2 . ICNIRP stipulates that the induced current density in the central nervous system should be limited to 2 mA / m 2 , and the maximum and minimum values shown in these figures are significantly below the specified value. That is, the power frequency magnetic field radiation generated by the catenary will not affect passengers riding on the bullet train.
In order to further assess the safety of the 20 passengers exposed to the low-frequency electromagnetic field, Table 6 provides the induced electric field values and induced magnetic field values in the brains of these passengers, located within the central nervous system.
Examining the data of all 20 passengers in Table 6, it is found that the maximum value of the induced magnetic field is 4.94 µT, and compared to the ICNIRP reference level of 50 Hz, 200 µT, this magnetic field is much smaller. The maximum value of the induced electric field is 1110 mV/m, and compared the ICNIRP reference level of 50 Hz, 400 mV/m, this value is also much smaller.
In order to further evaluate the safety of the 20 passengers exposed to low-frequency electromagnetic fields, we used the coordinates of their positions in the car, as shown in Figure 34. Taking the position of passenger 1 as the origin, the variations of the induced magnetic and electric fields in the human brain in the same horizontal coordinates were analyzed. Table 7 shows the electromagnetic data for the brains of passengers 1–10, and Table 8 shows the electromagnetic data for passengers 11–20.
It can be concluded from Table 7 and Table 8 that the electromagnetic data for the brain show a relatively stable or consistent trend without significant fluctuations or changes, regardless of whether passengers 1–10 or passengers 11–20 are in the same longitudinal coordinate situation, and all of them meet the ICNIRP criteria.
Our results in the electromagnetic data of the passenger’s brain are consistent with the results of Tian Rui et al. [7]. Table 9 shows the comparison of the results of this paper with the previous data. The reason for the error with the previous results is mainly due to the different accuracy in the grid dissection process and the fact that the models studied are different, but overall, the results are consistent and all meet the ICNIRP limits.

7. Conclusions

In this paper, the distribution of an electromagnetic field induced by the contact line of the catenary at the 25 kV voltage level in the brains of 20 passengers in a CR400AF-type EMU carriage is simulated. The simulation results show the following:
(1)
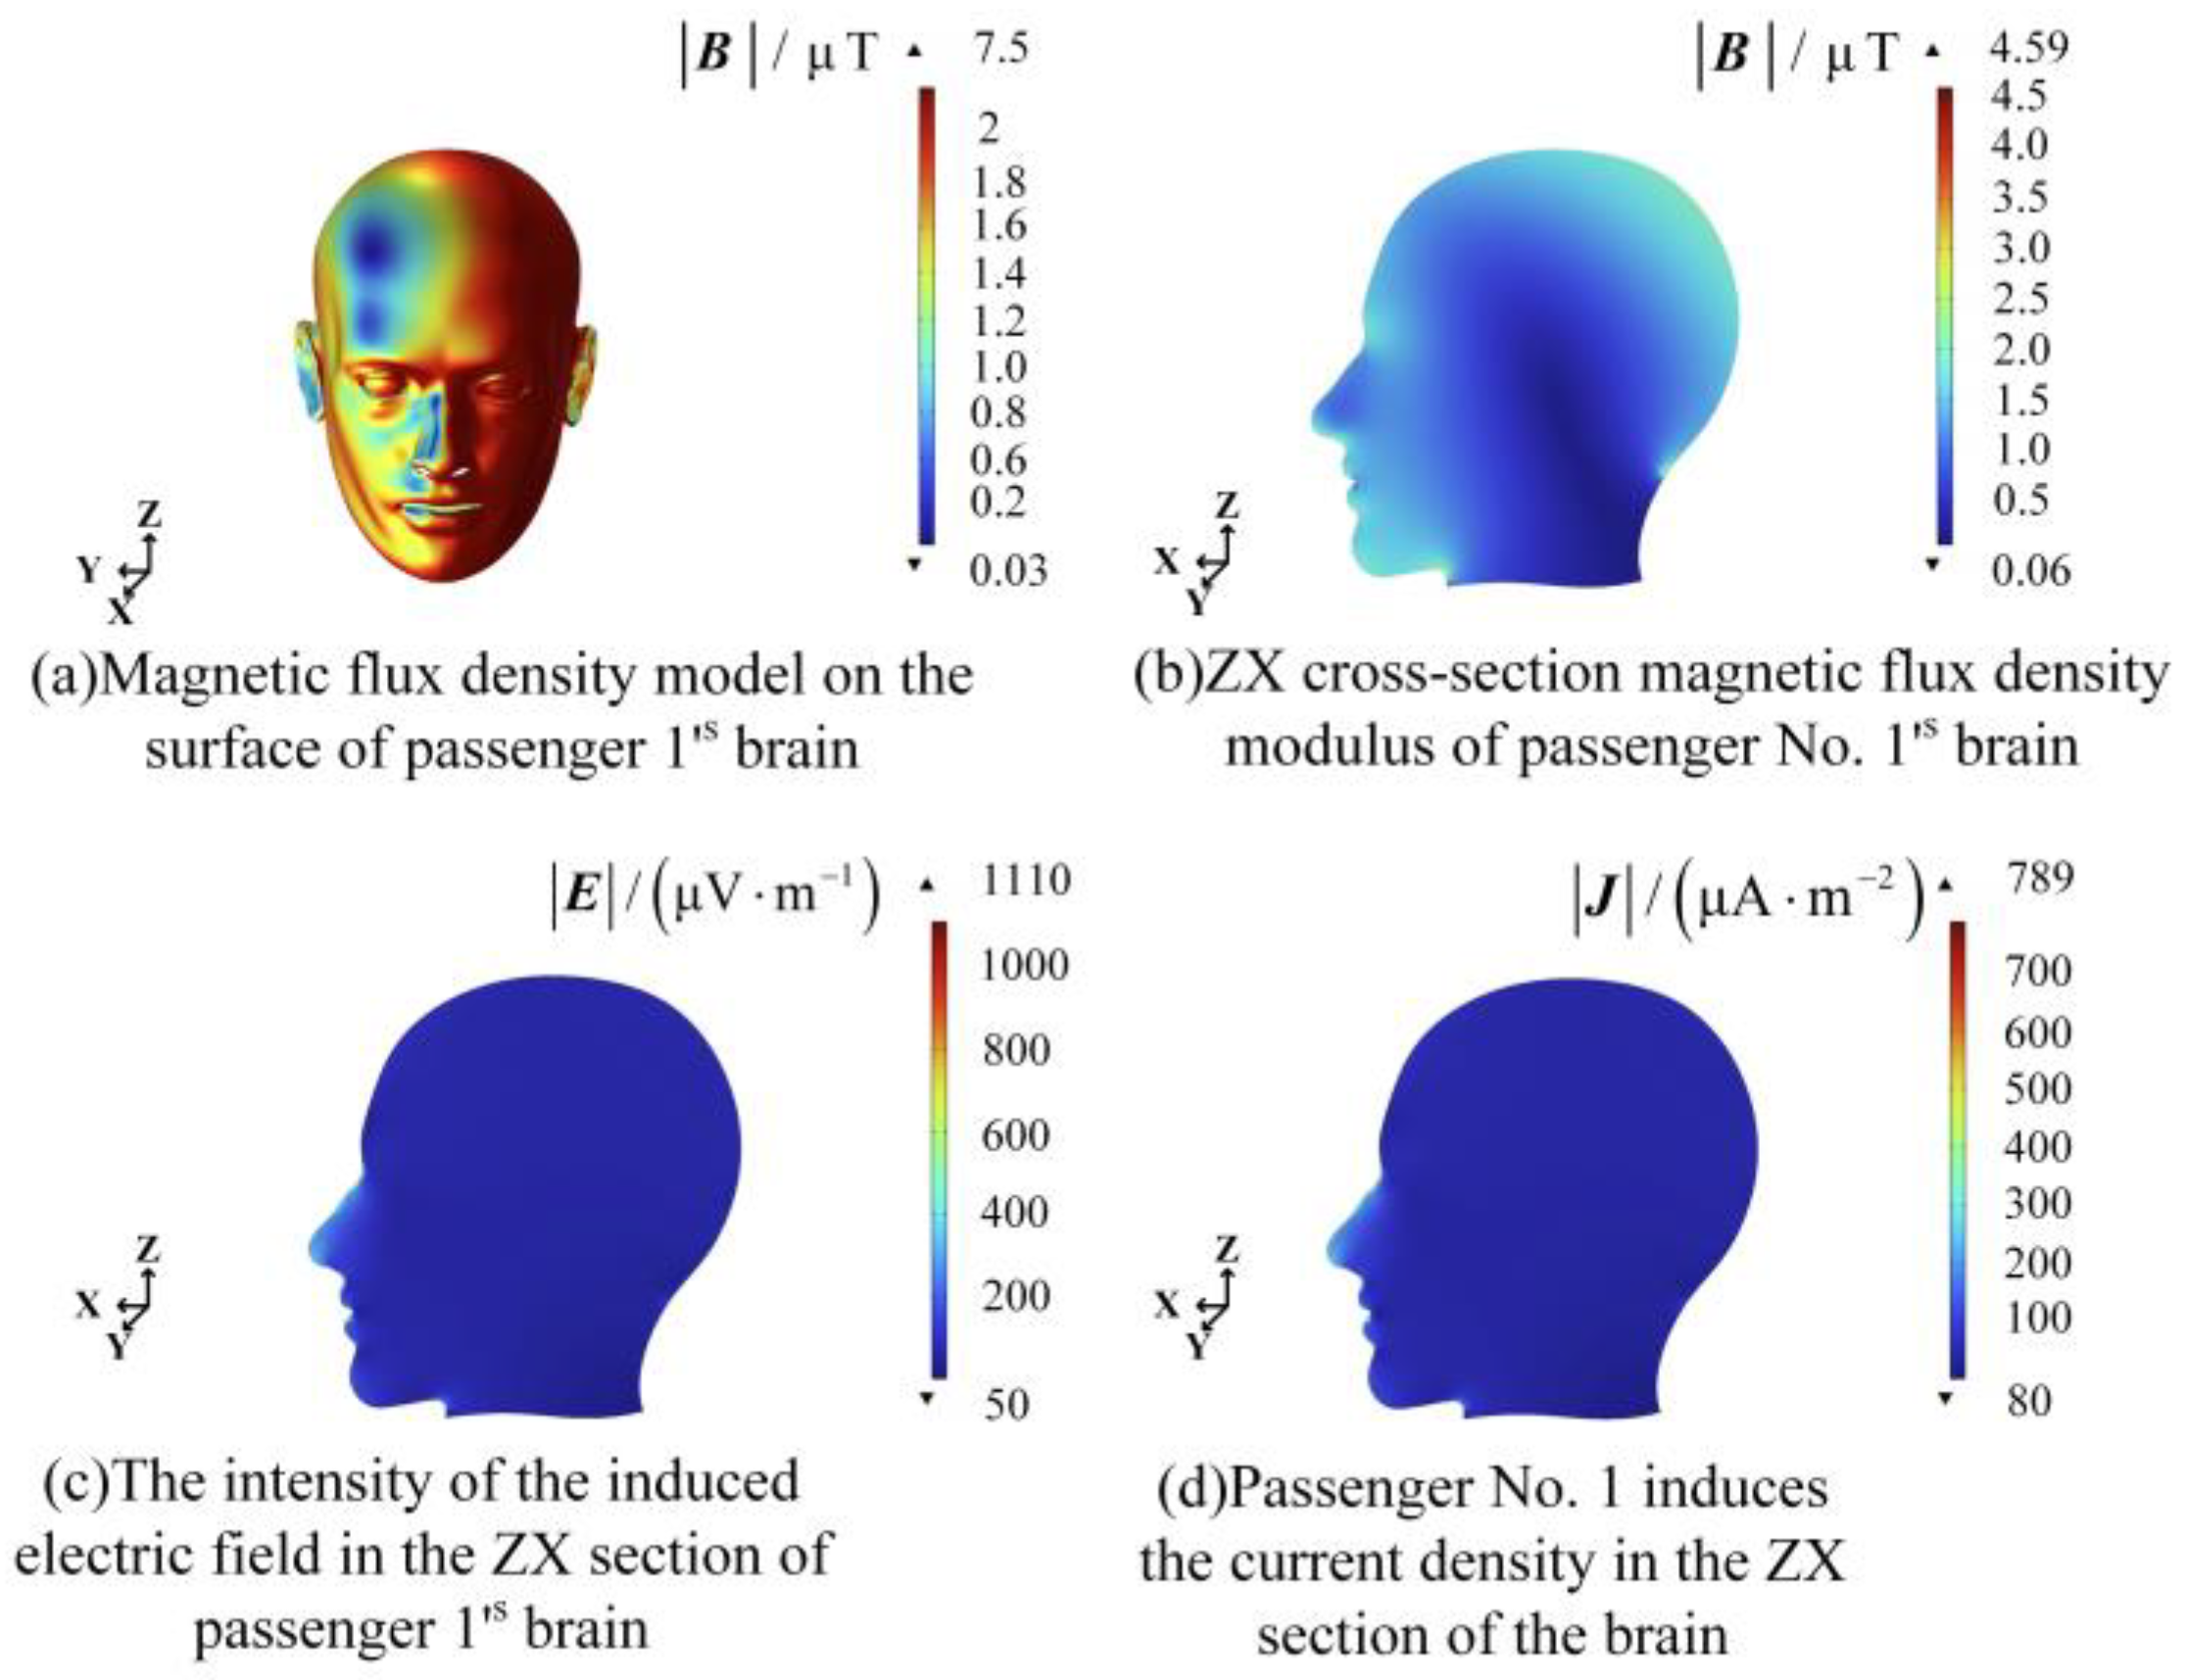
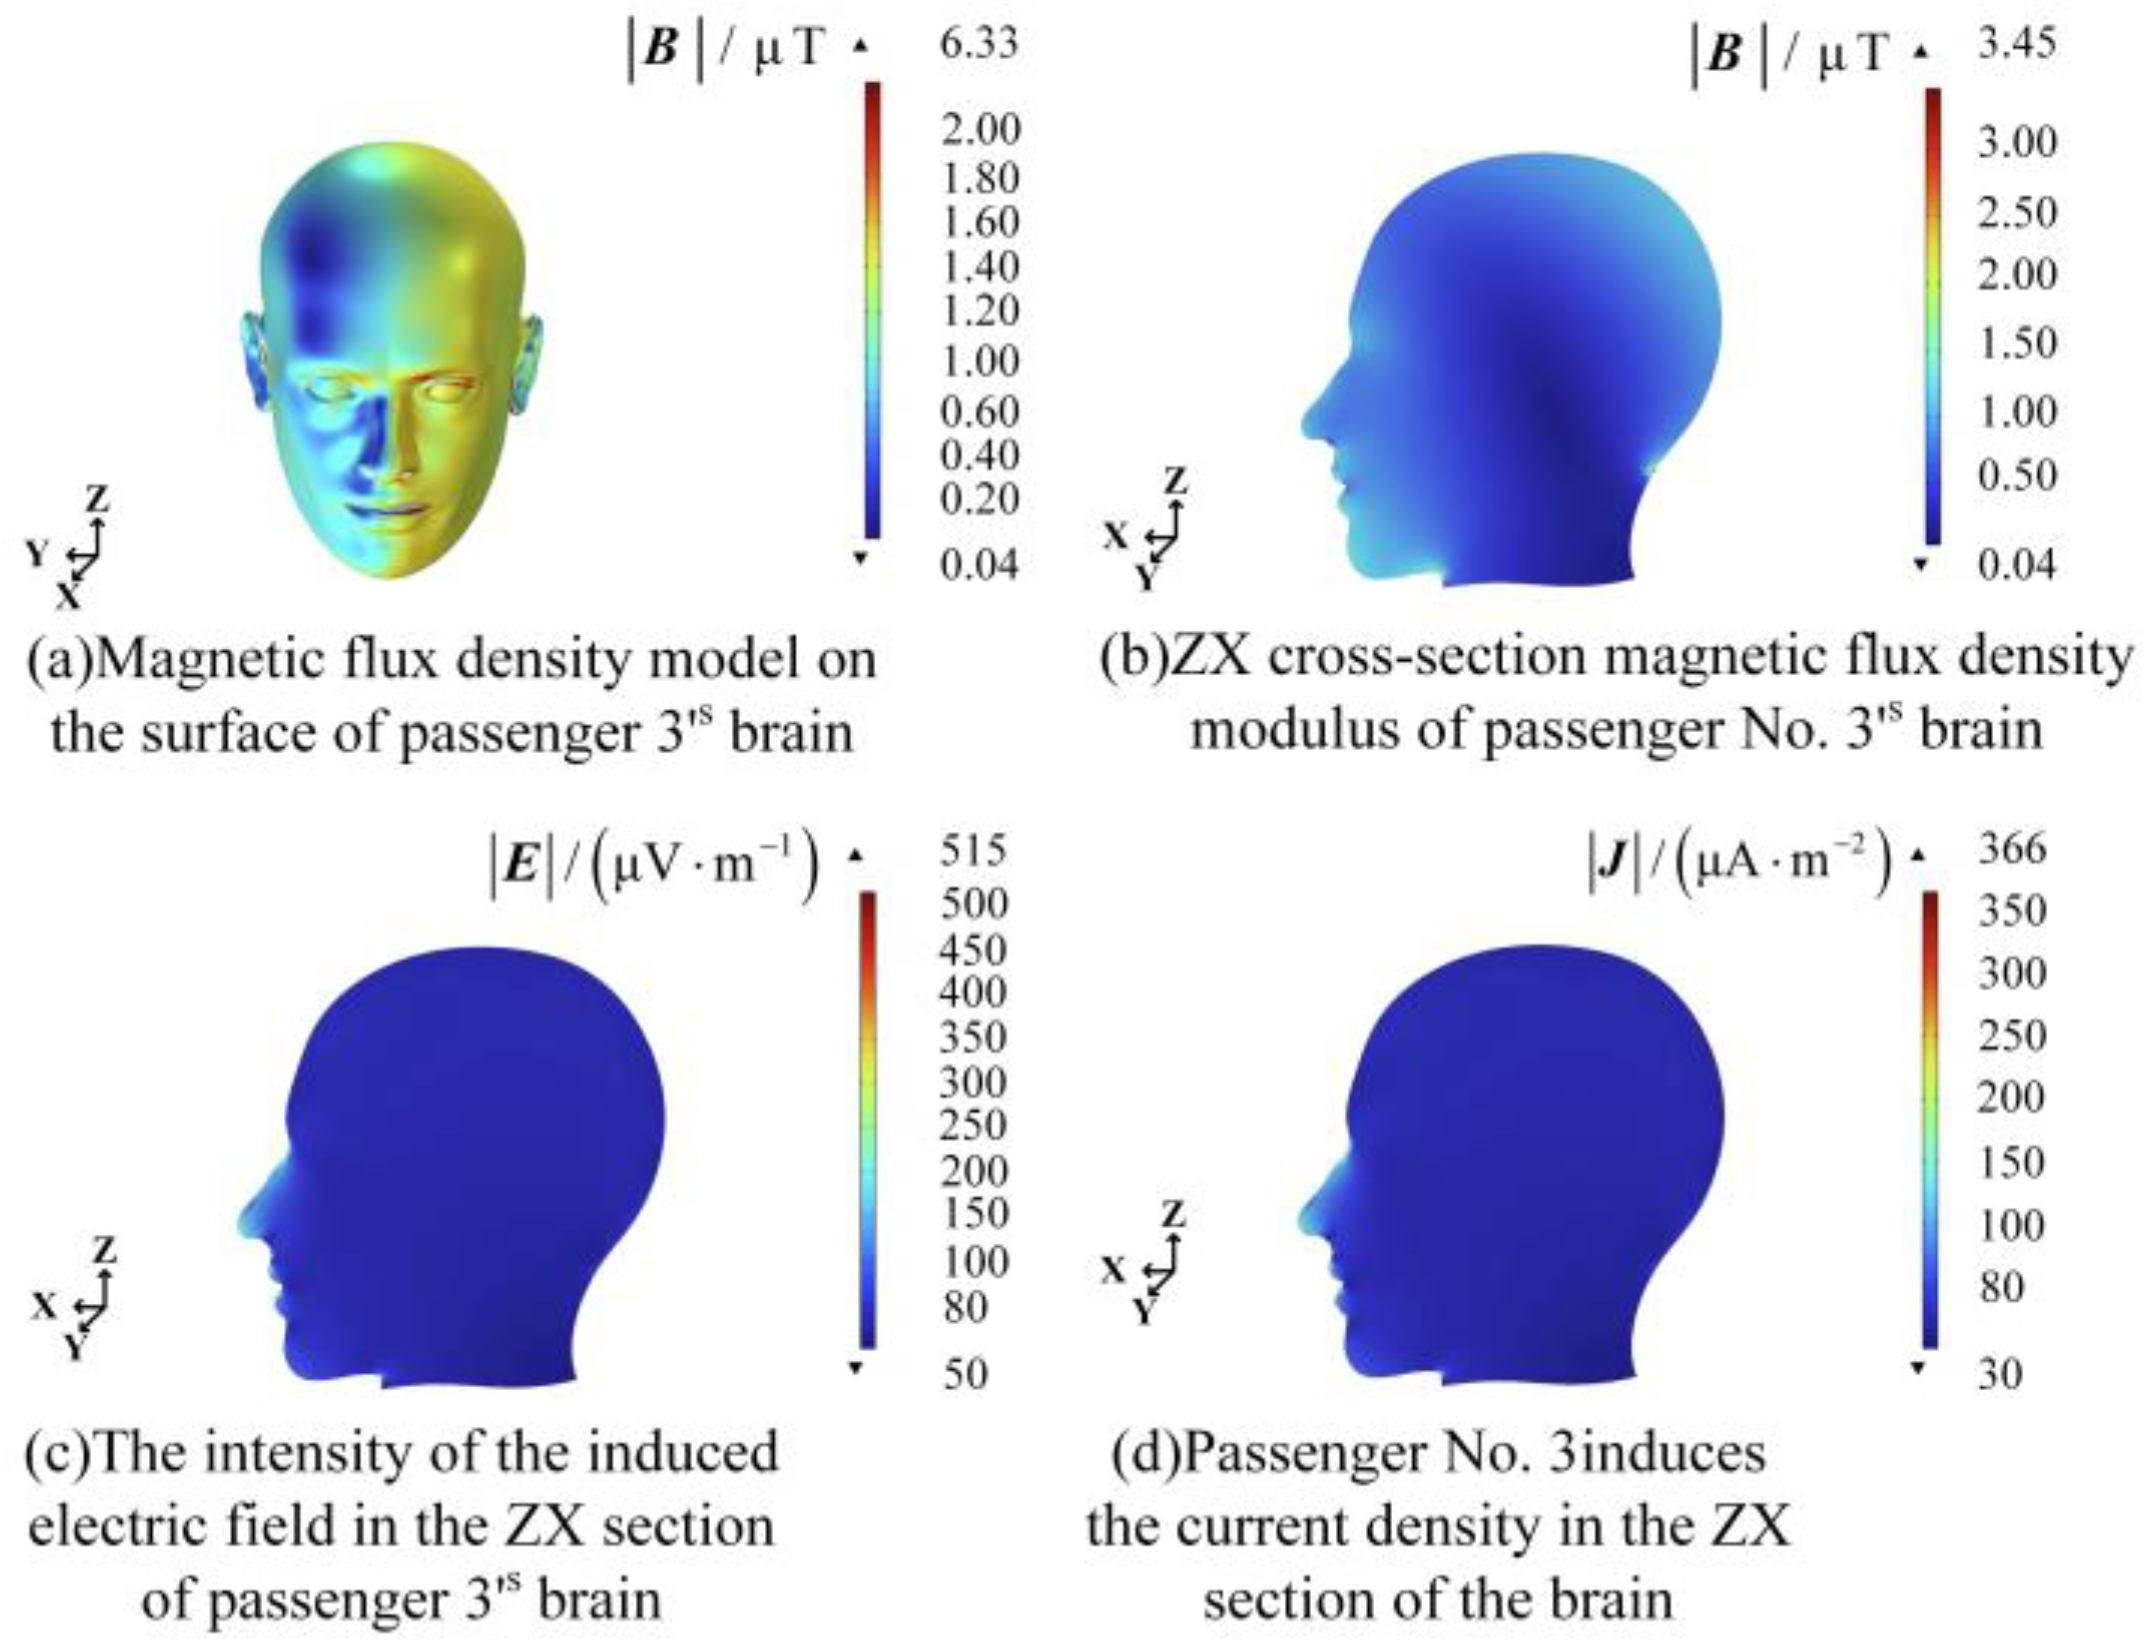
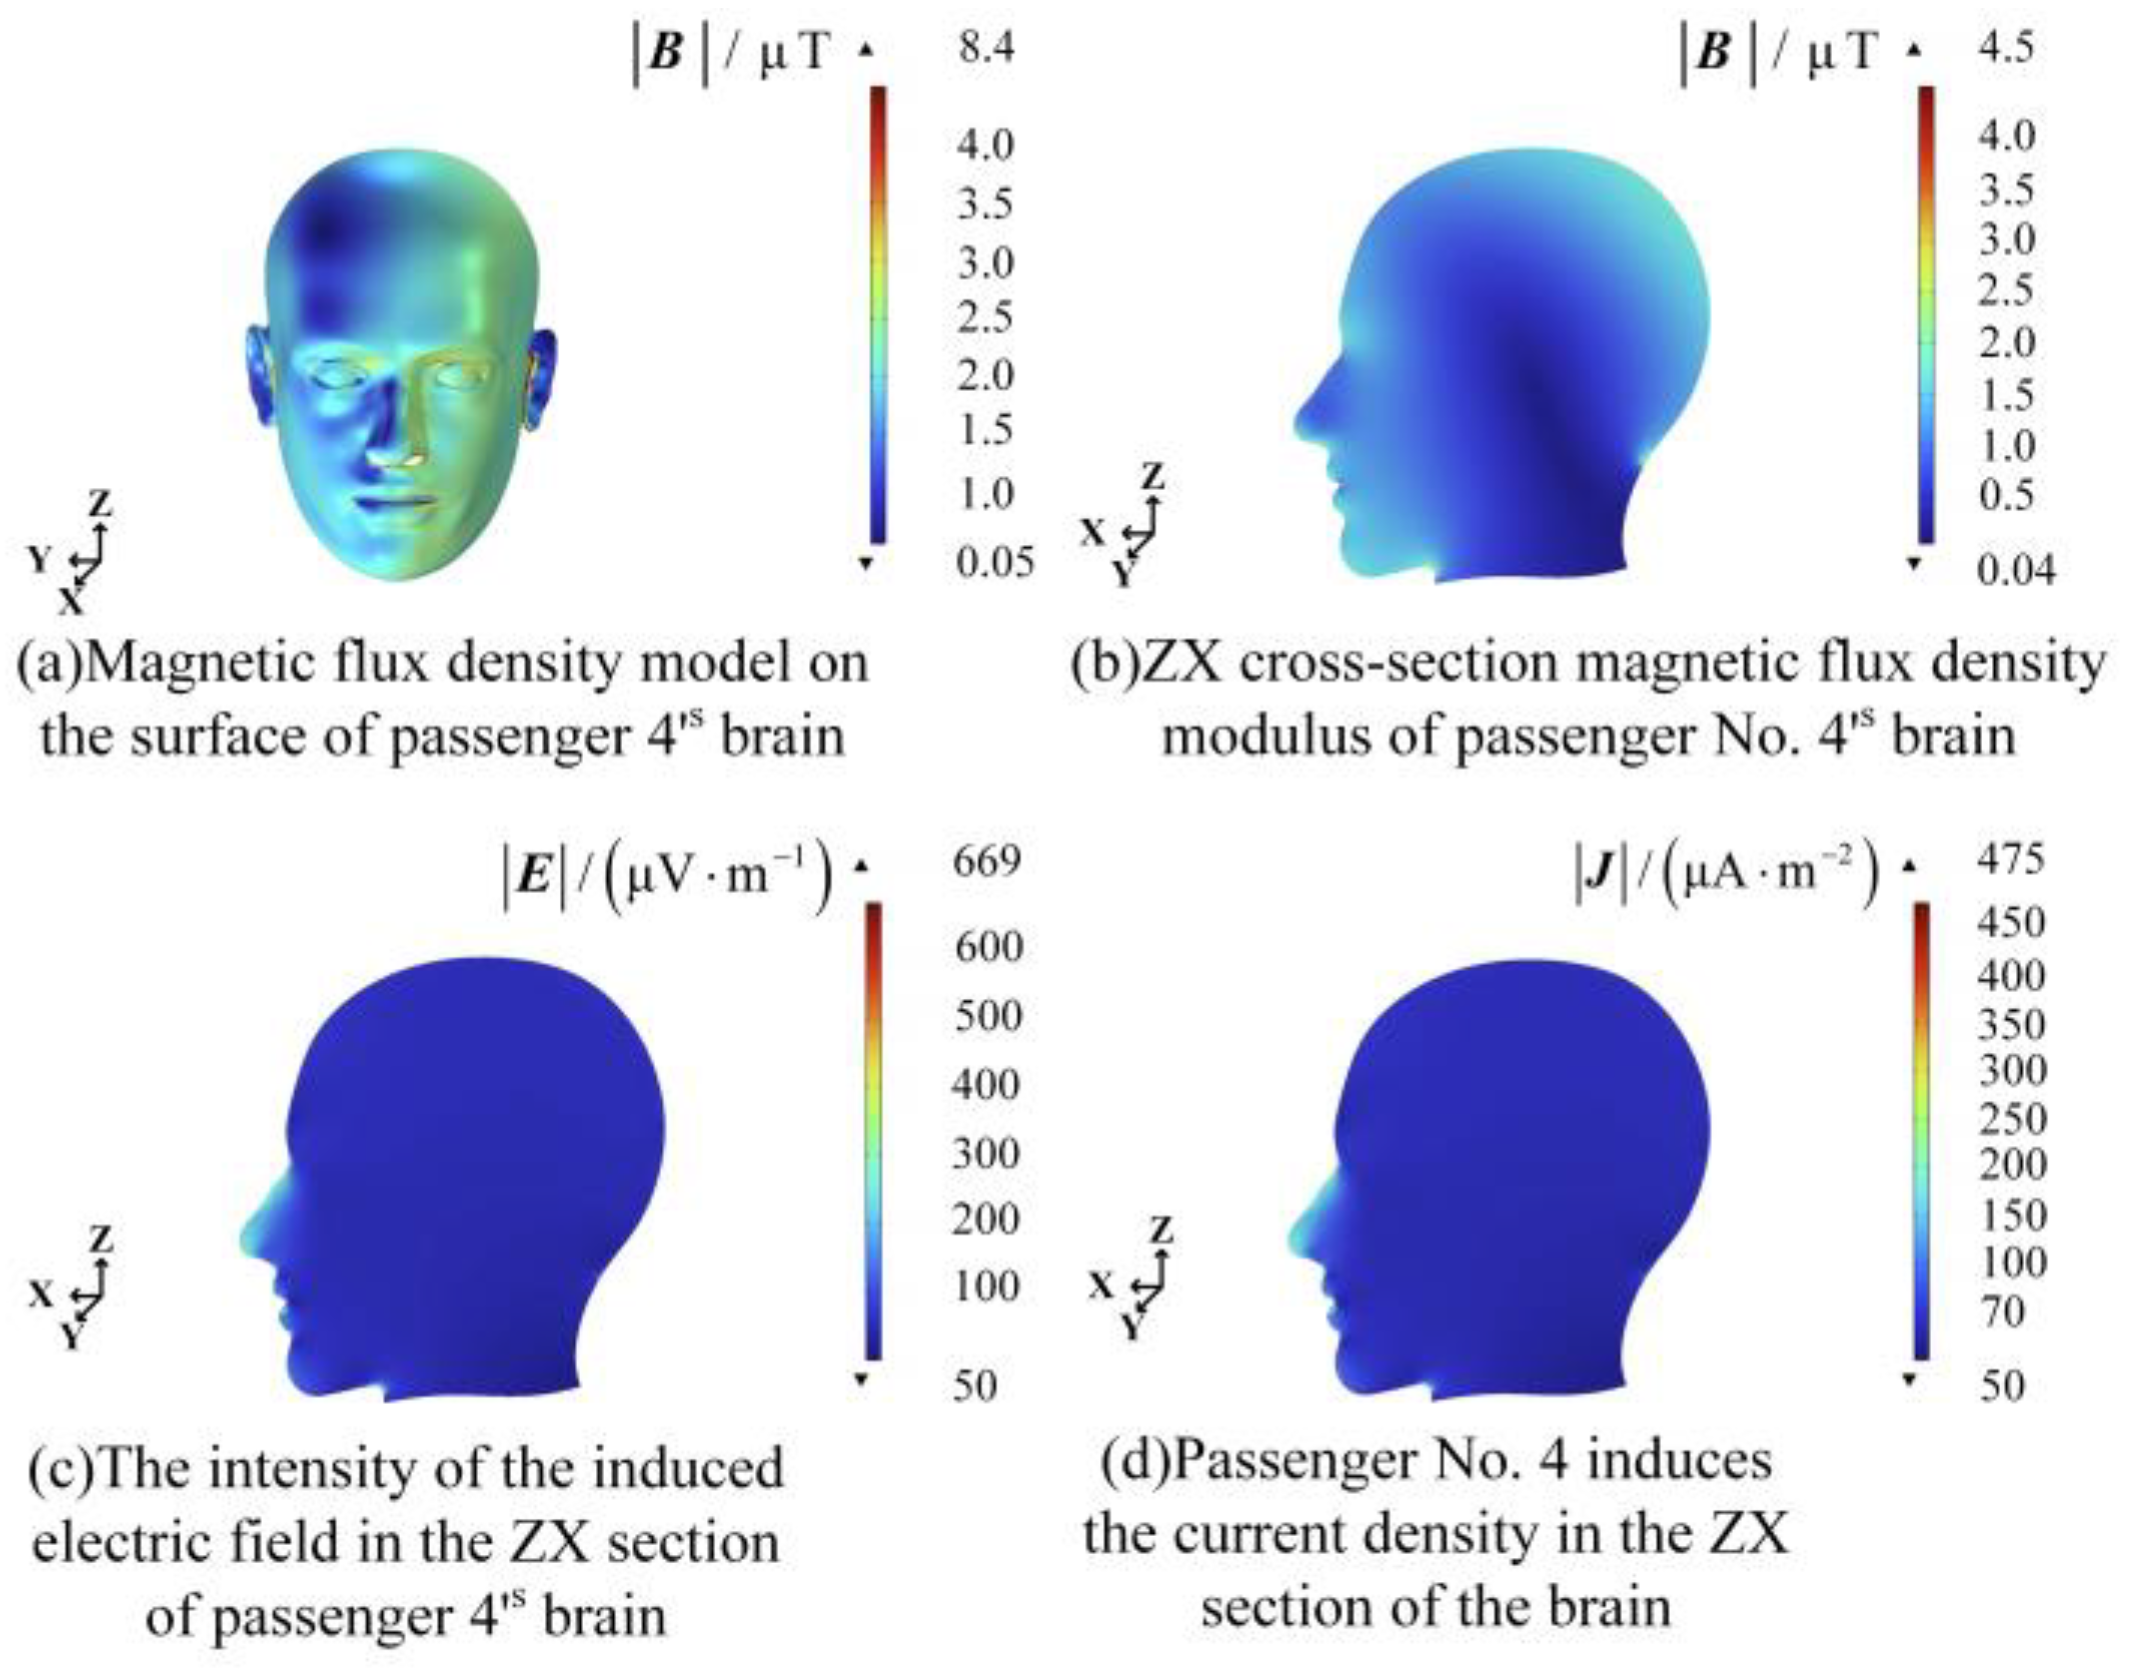
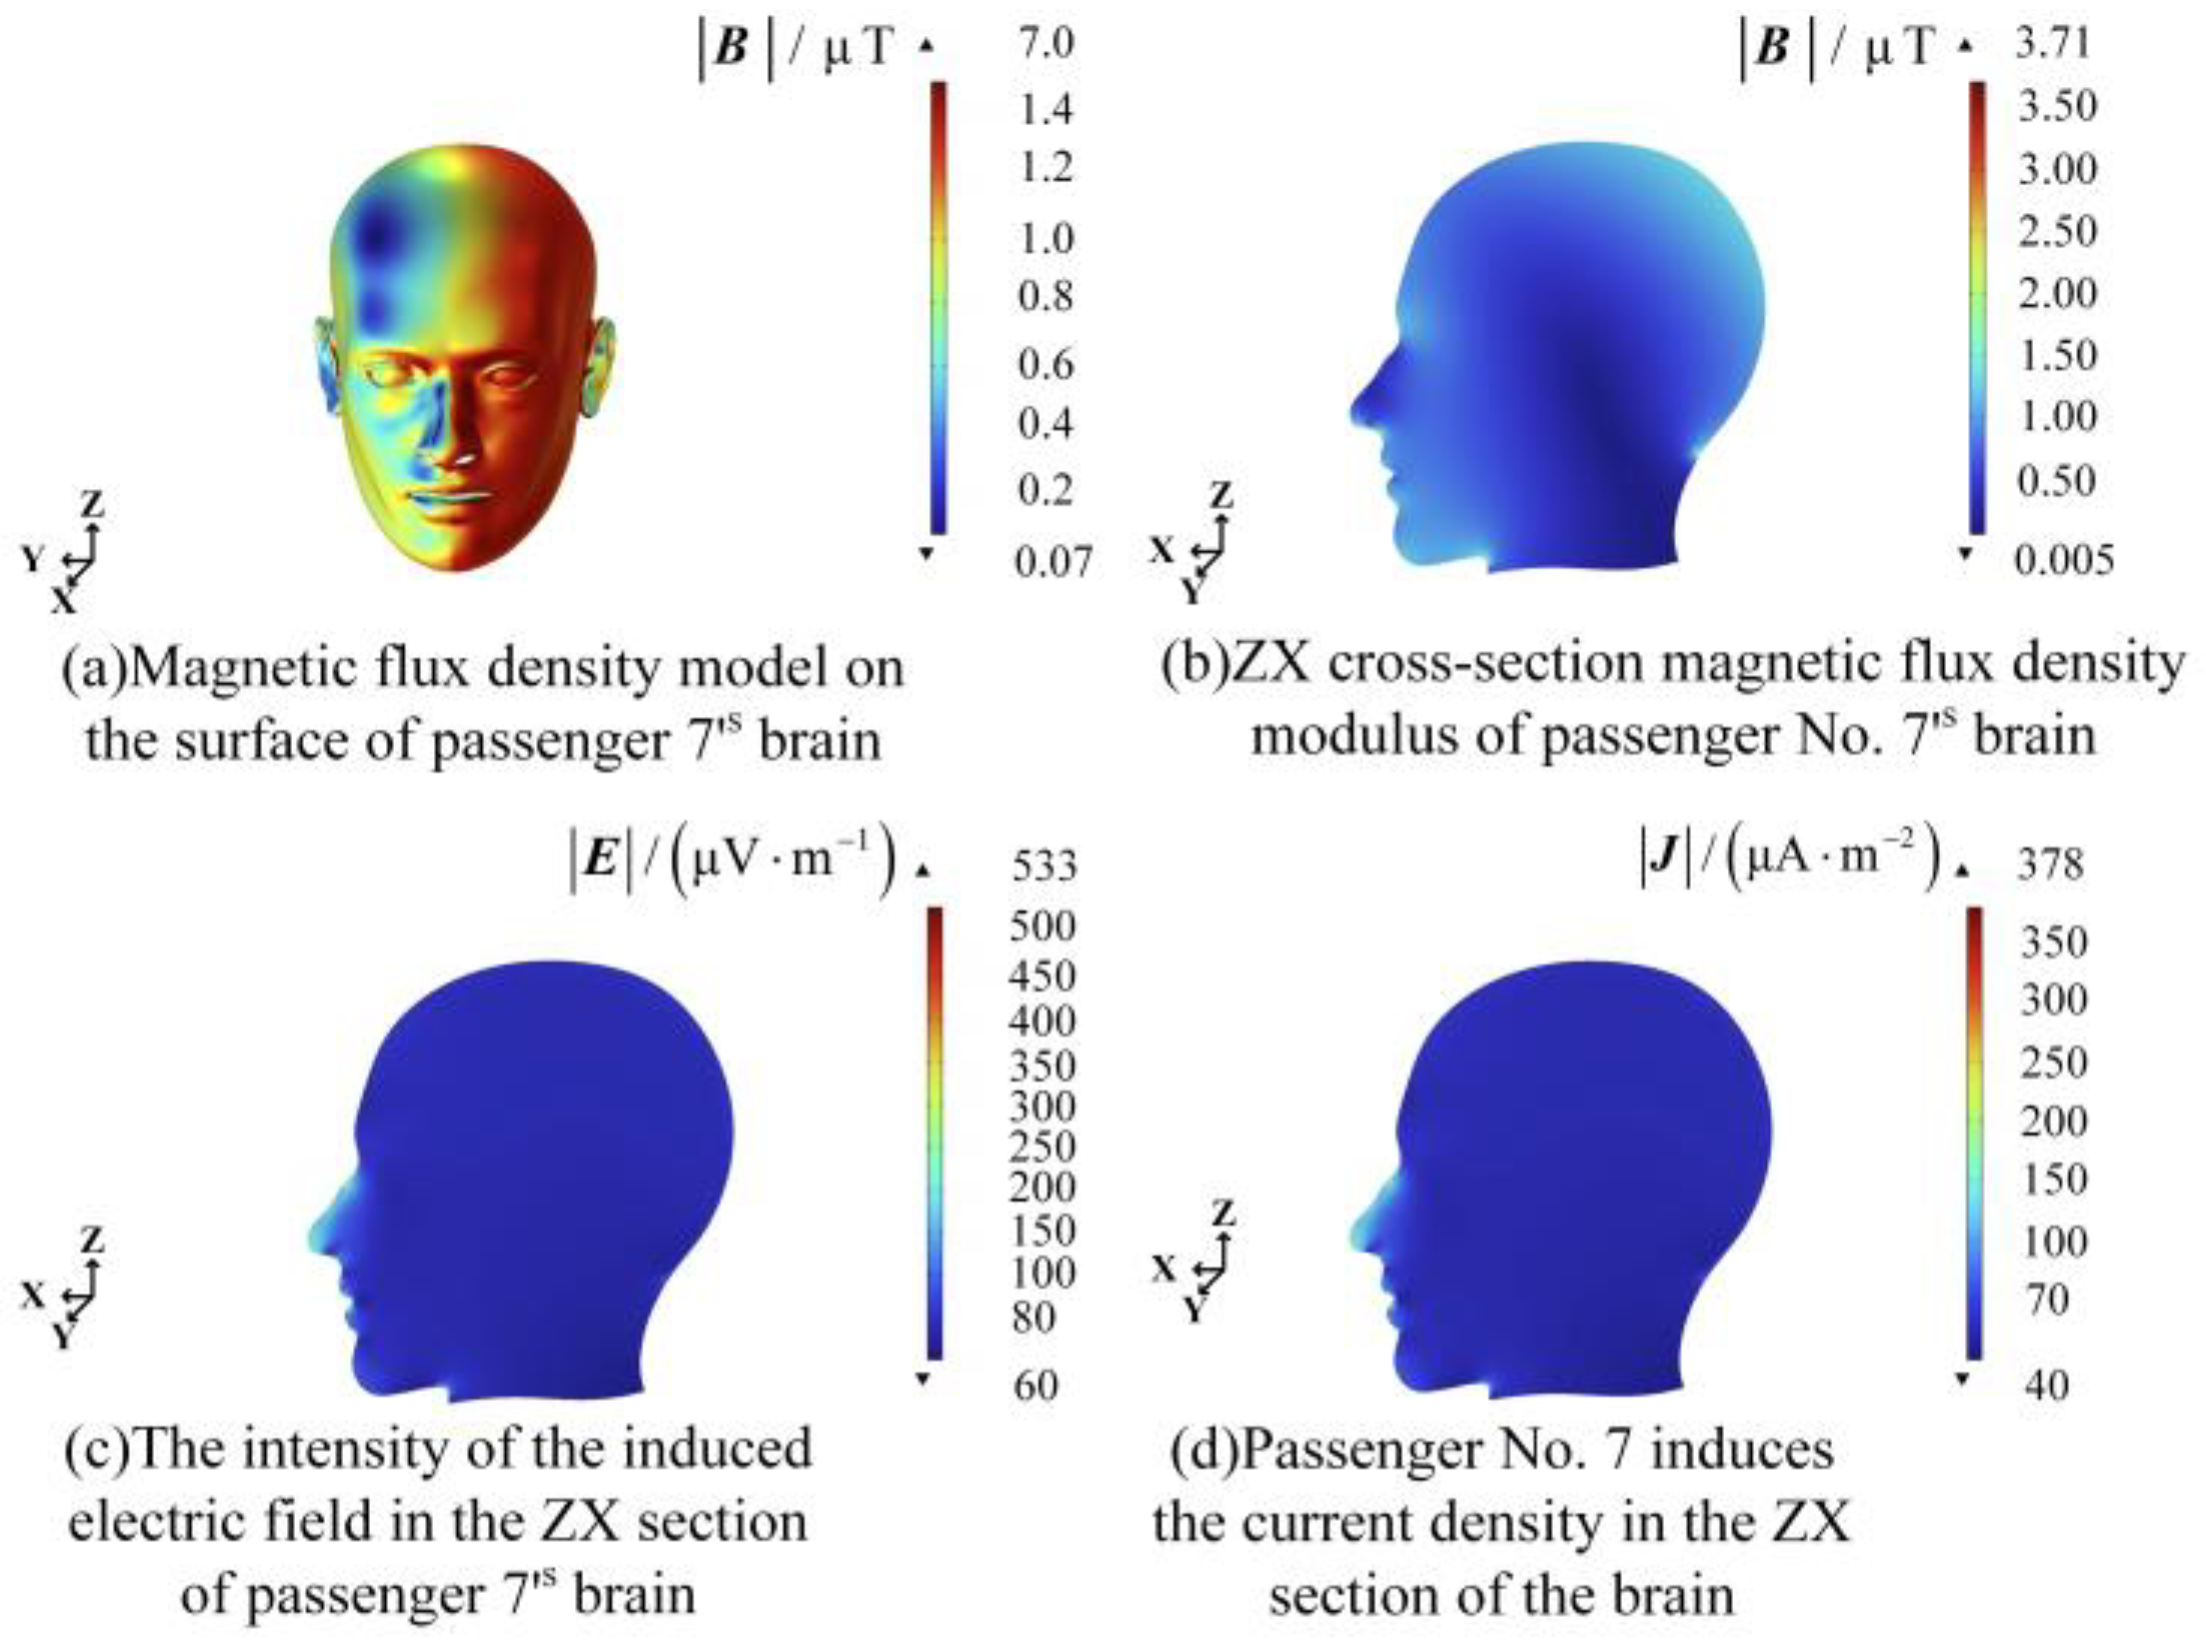
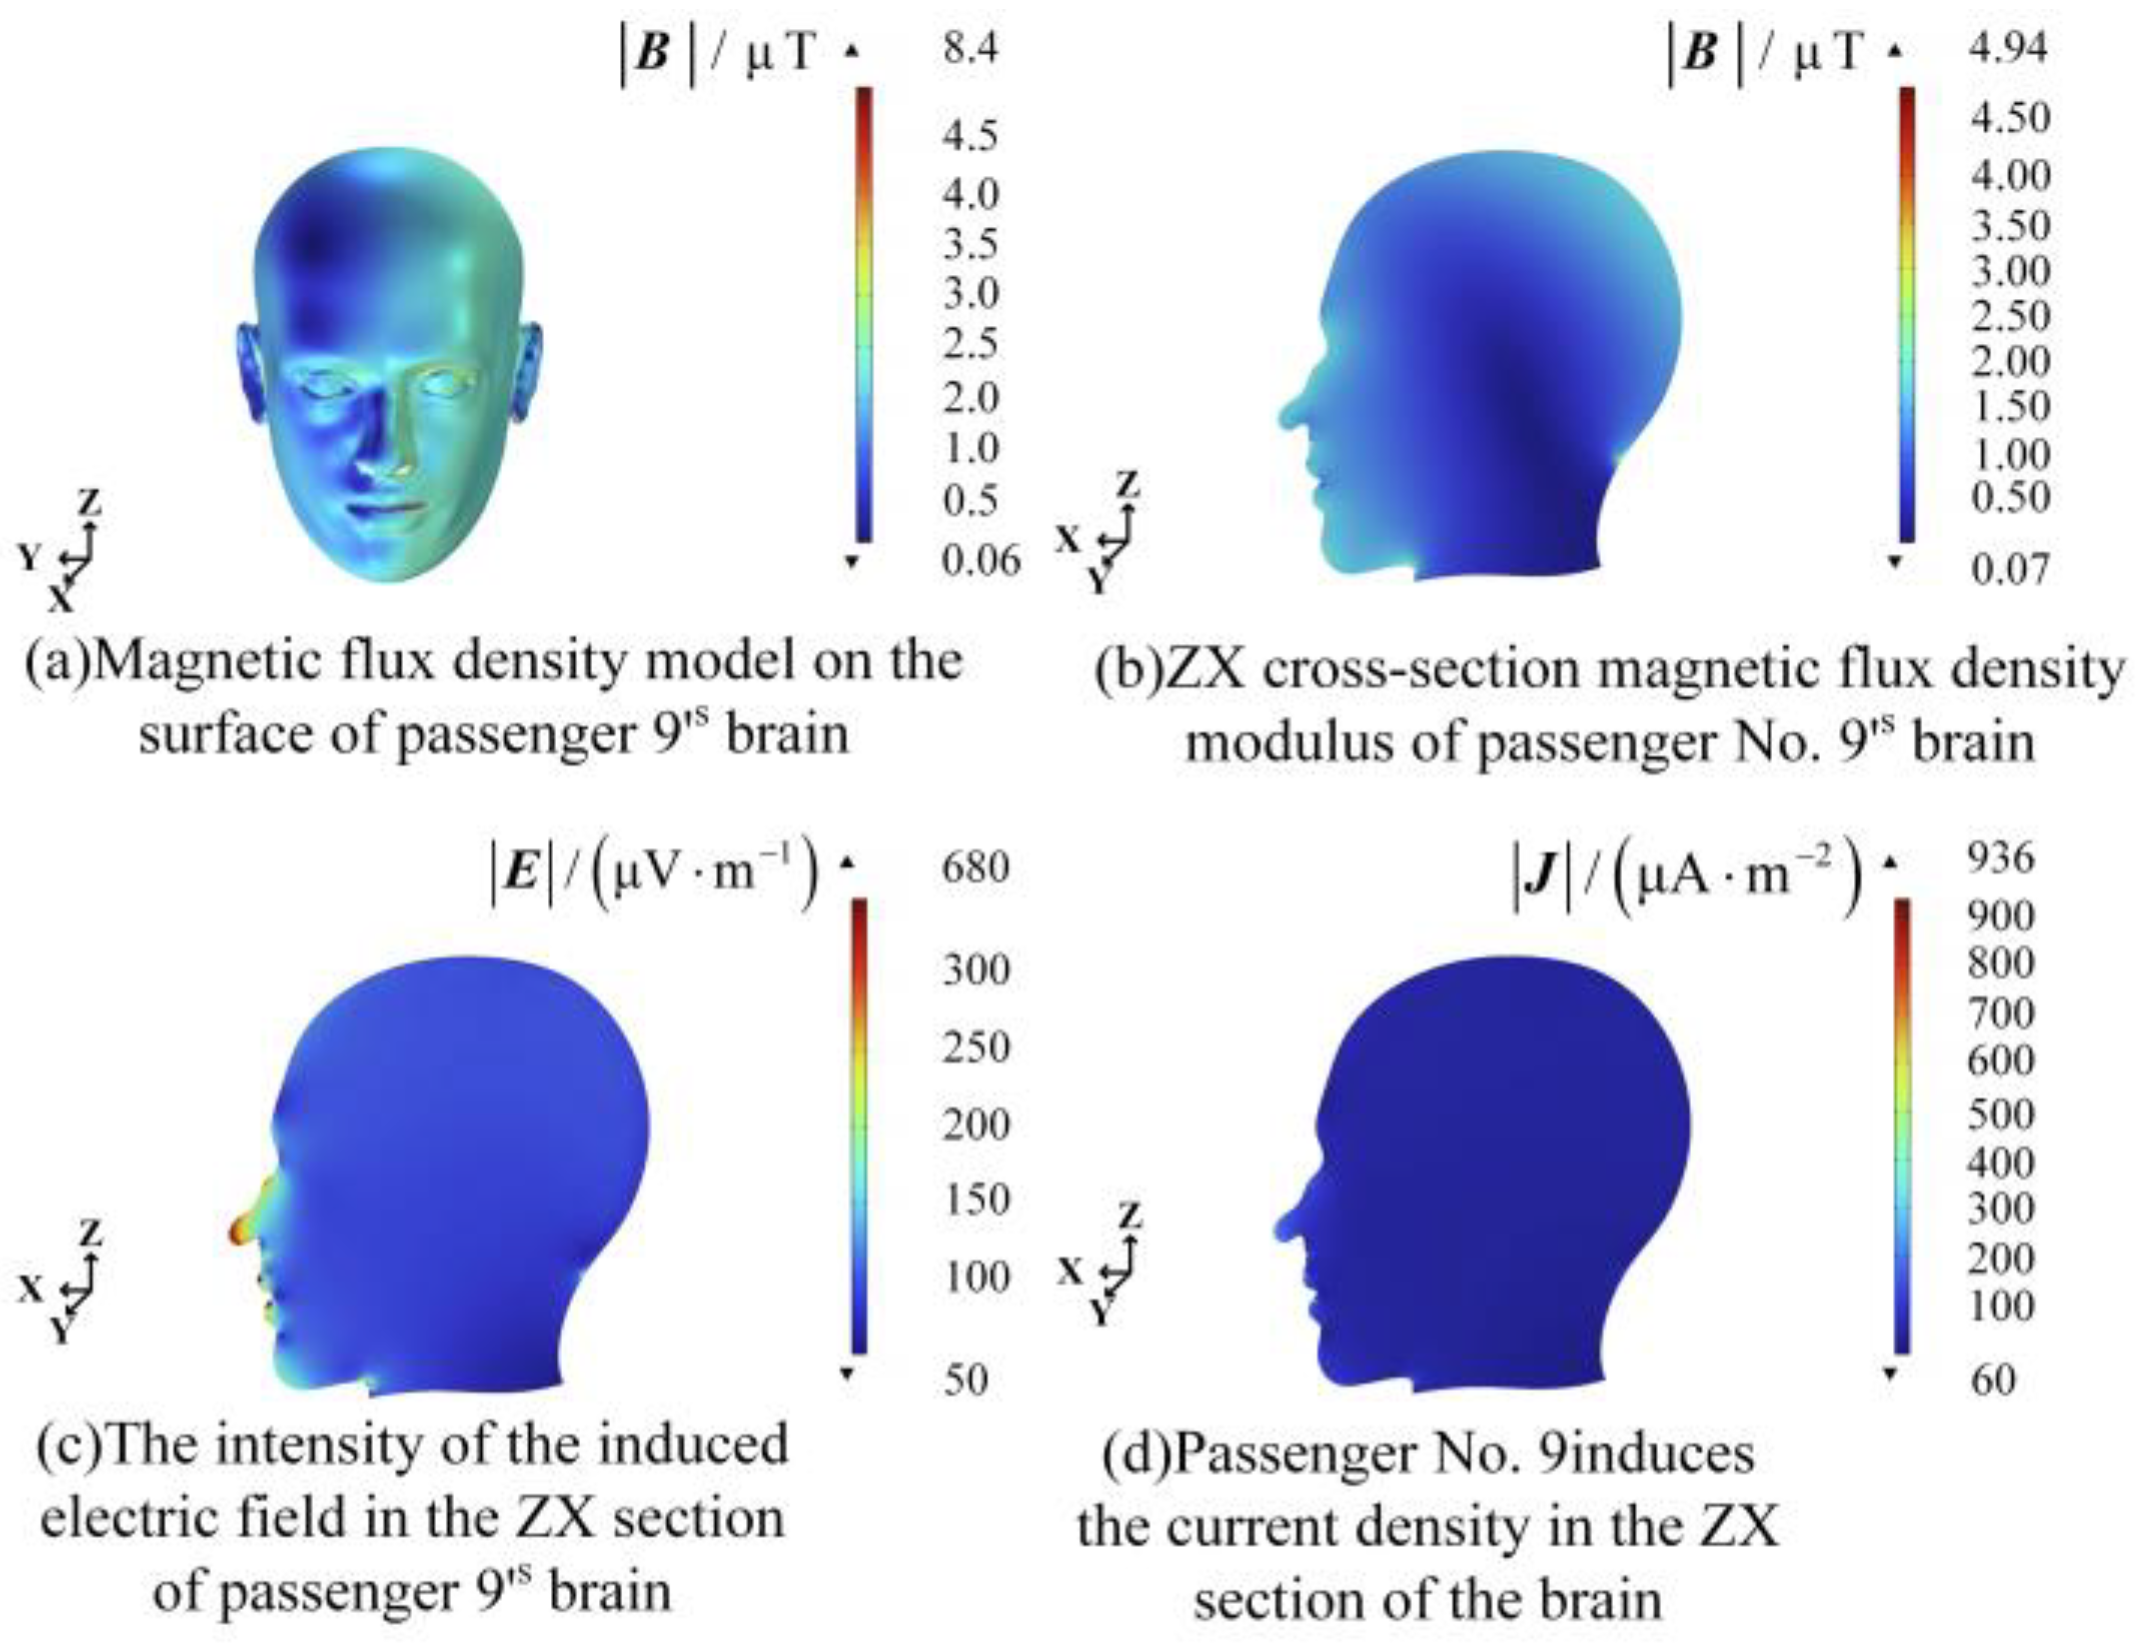
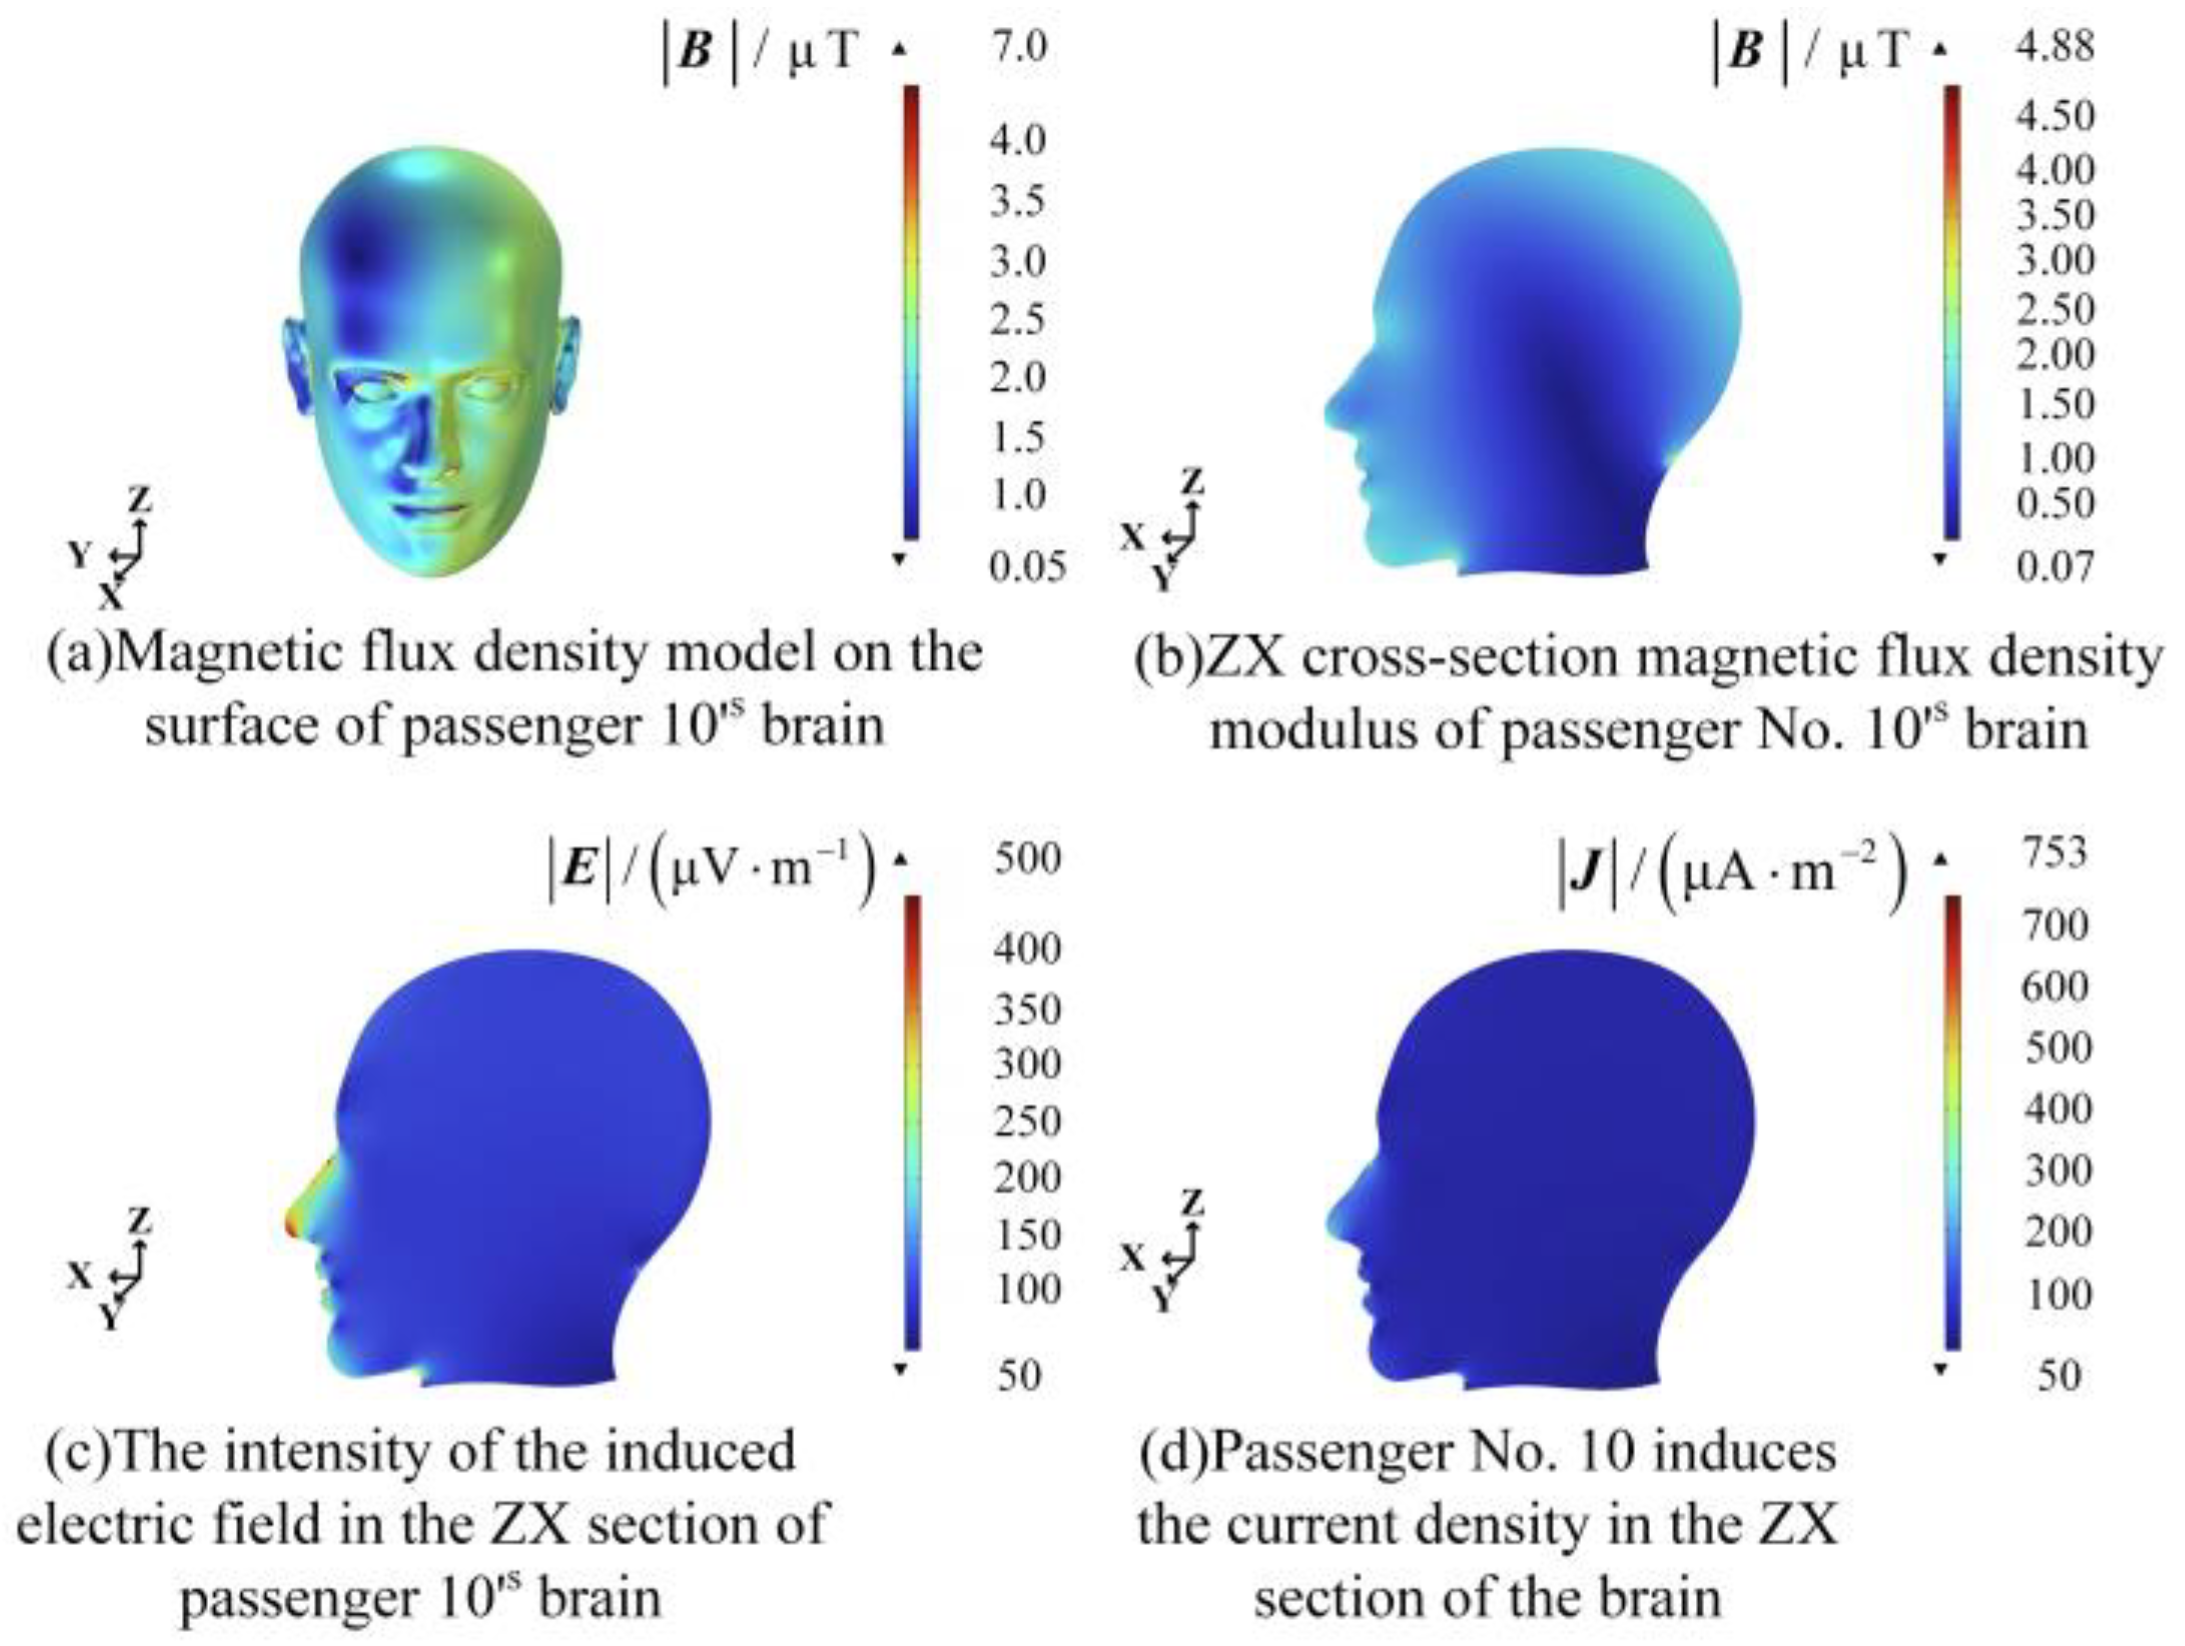
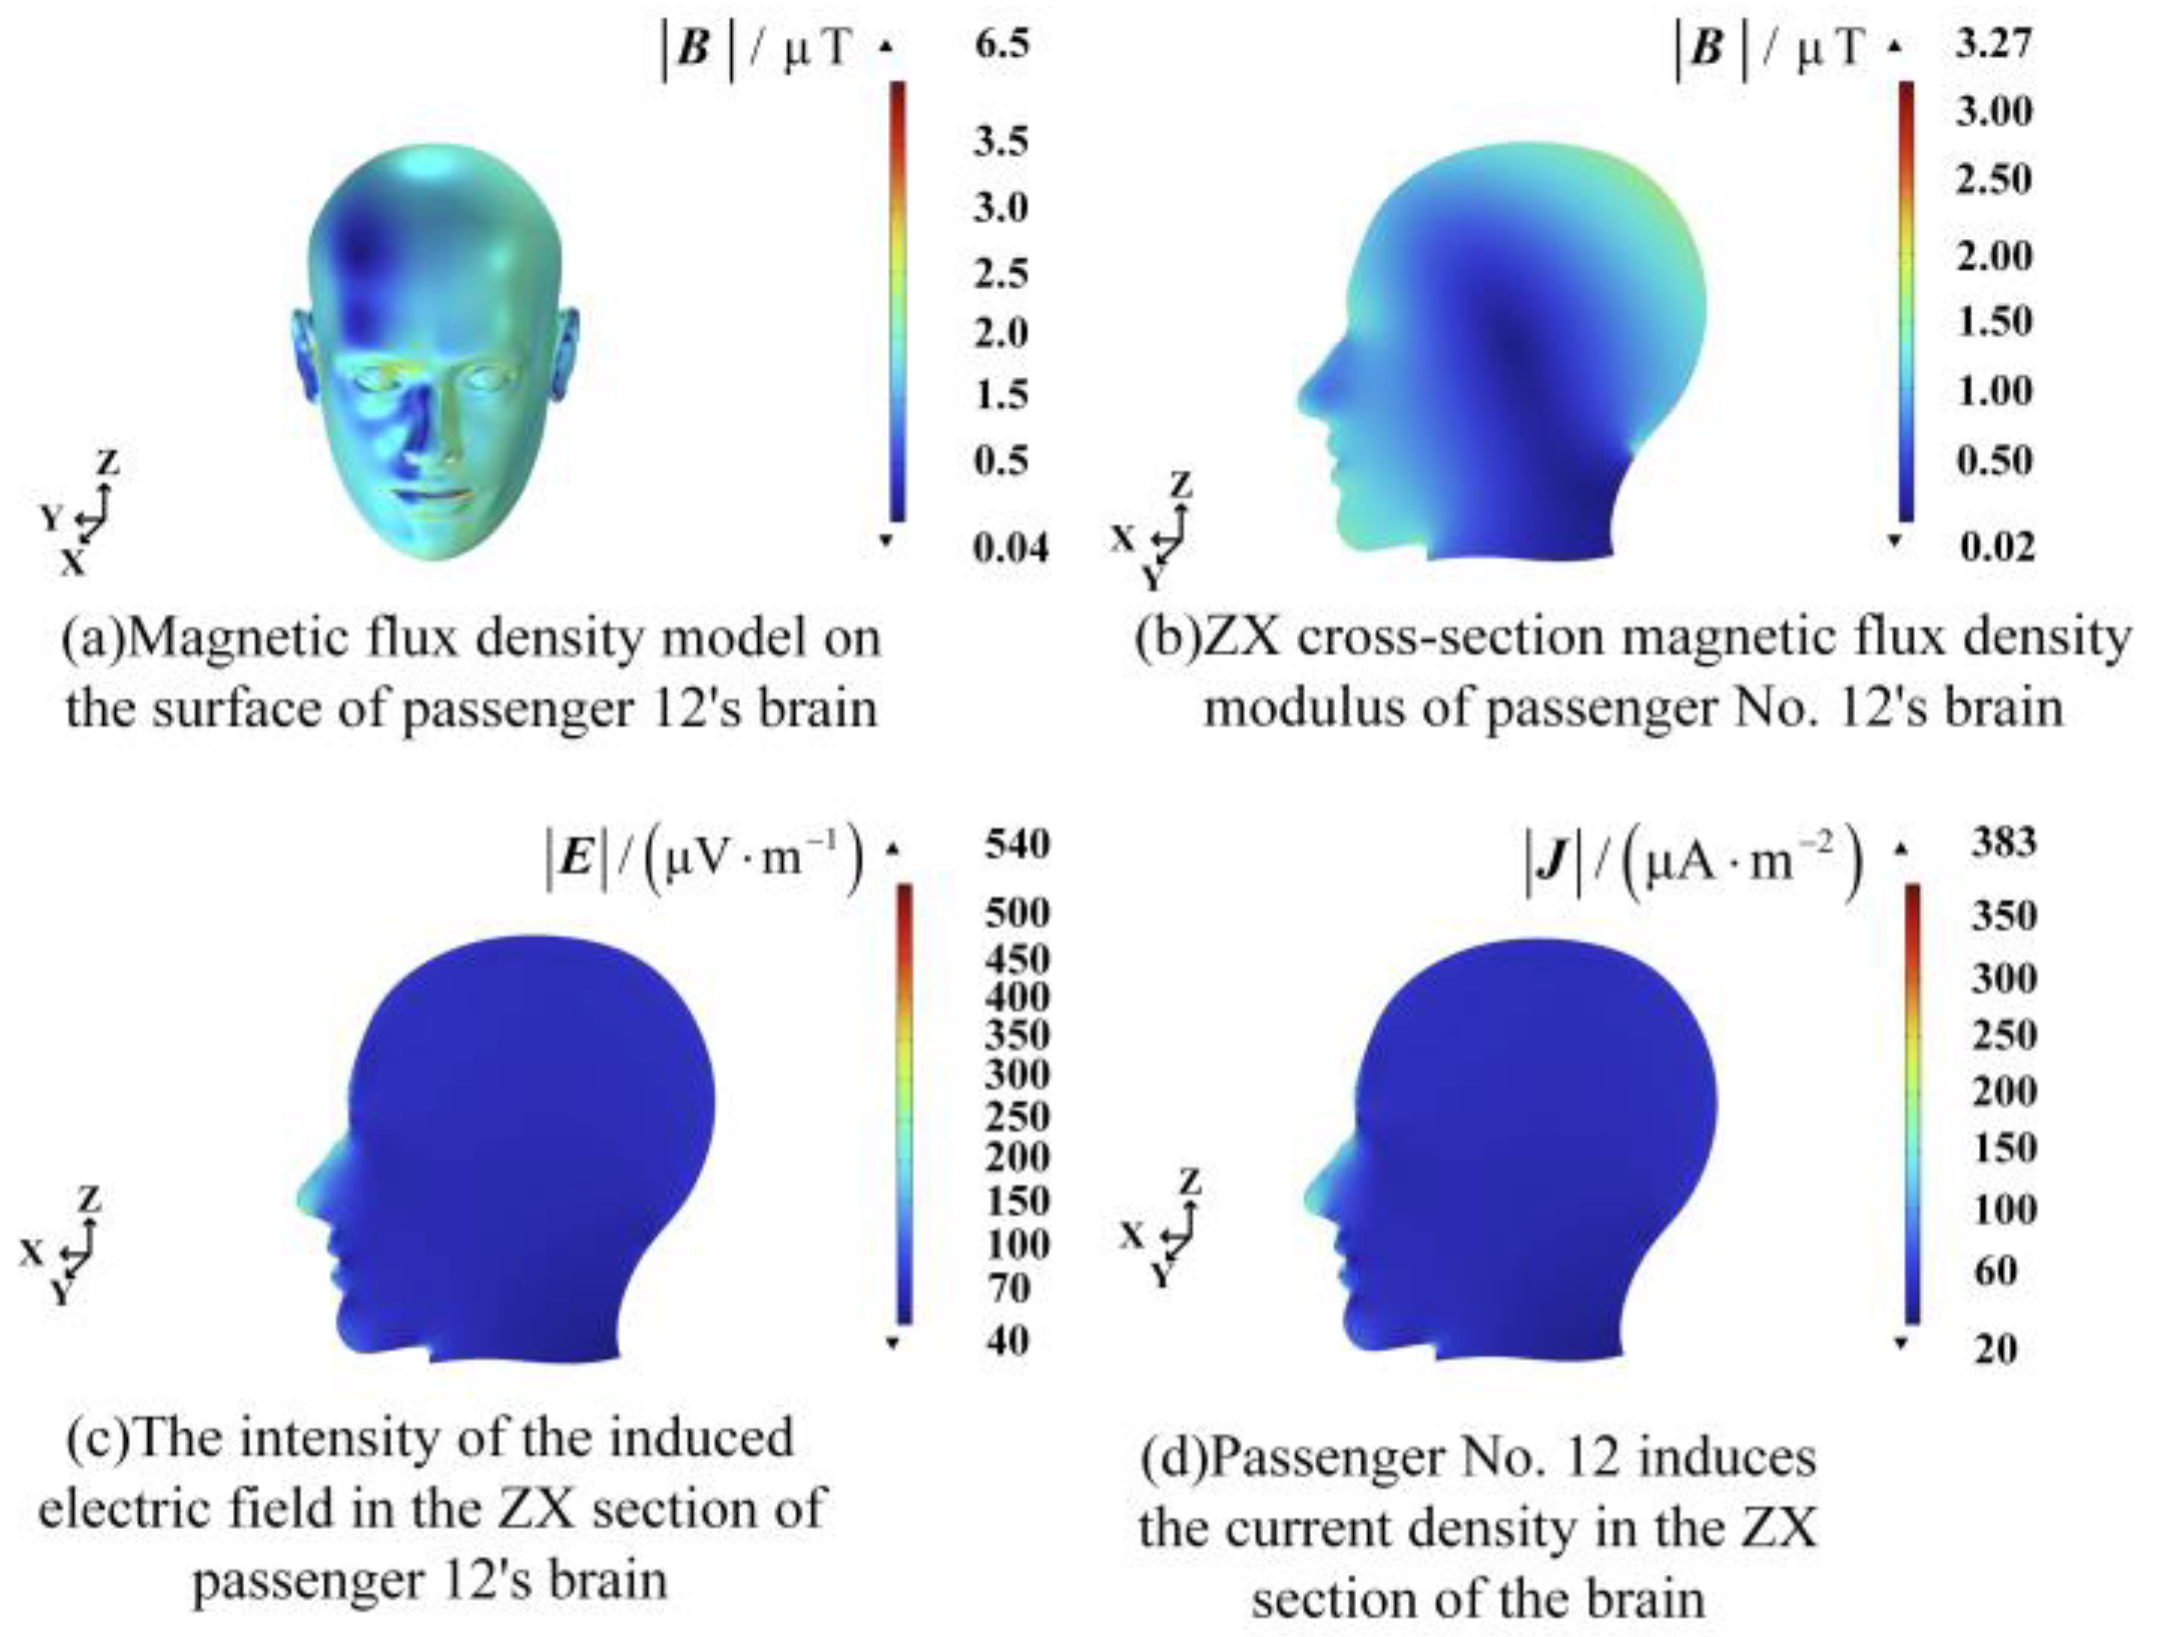
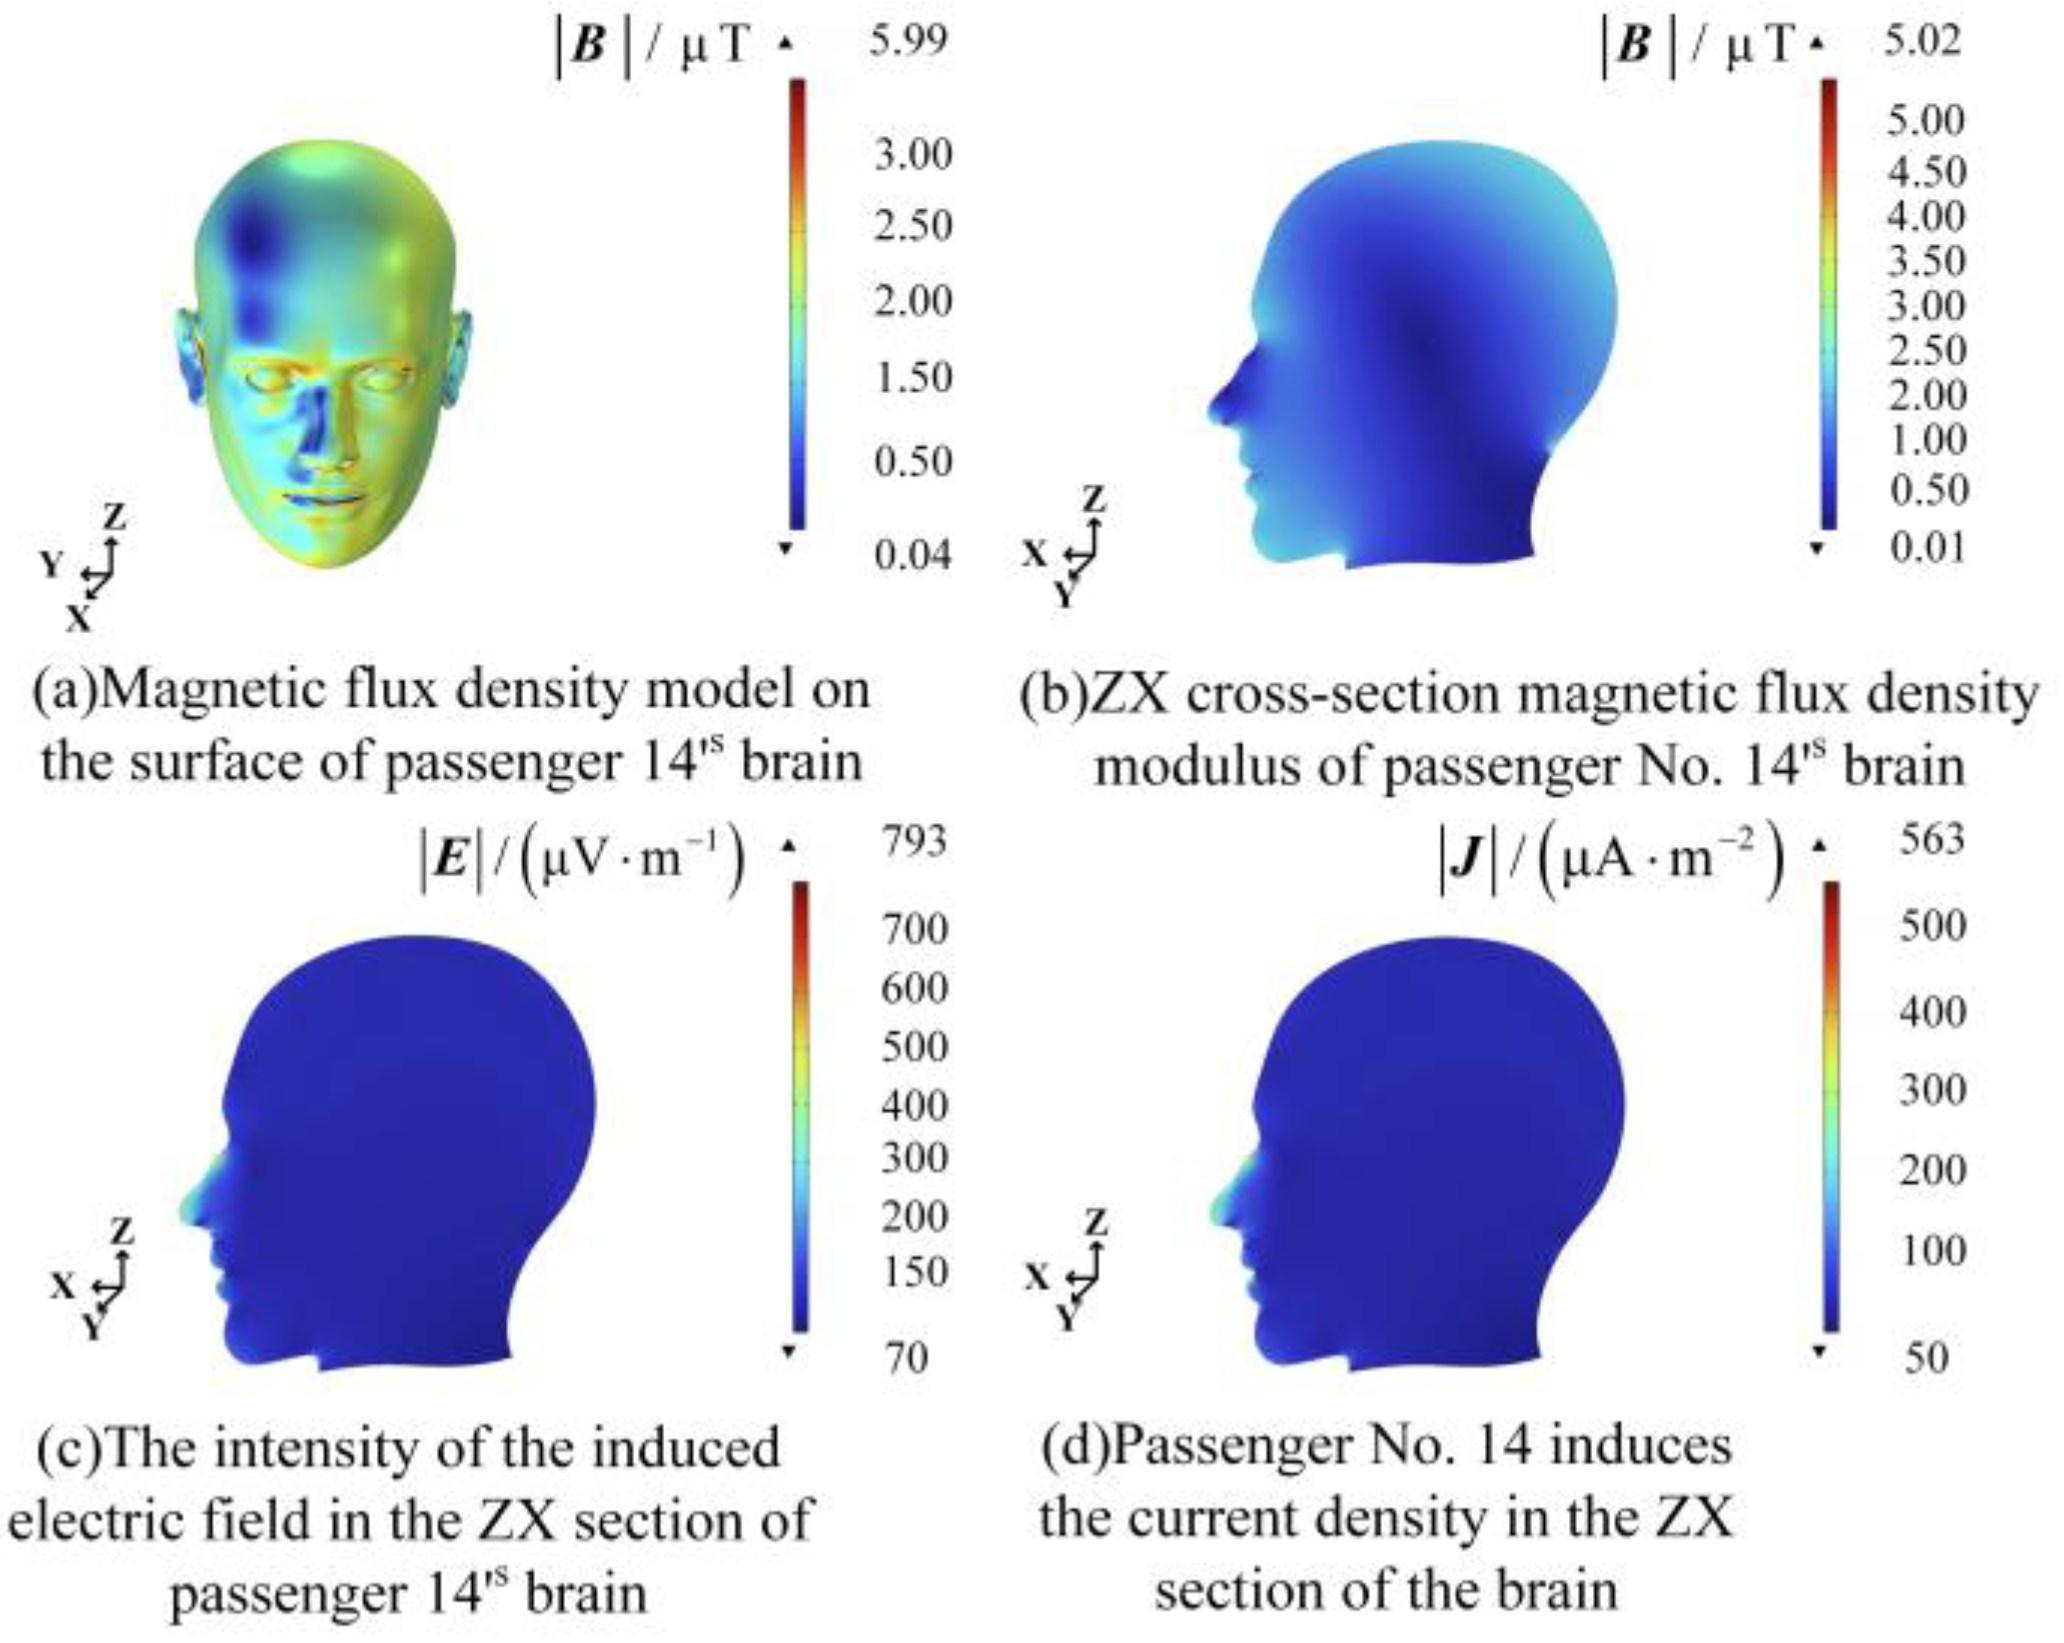
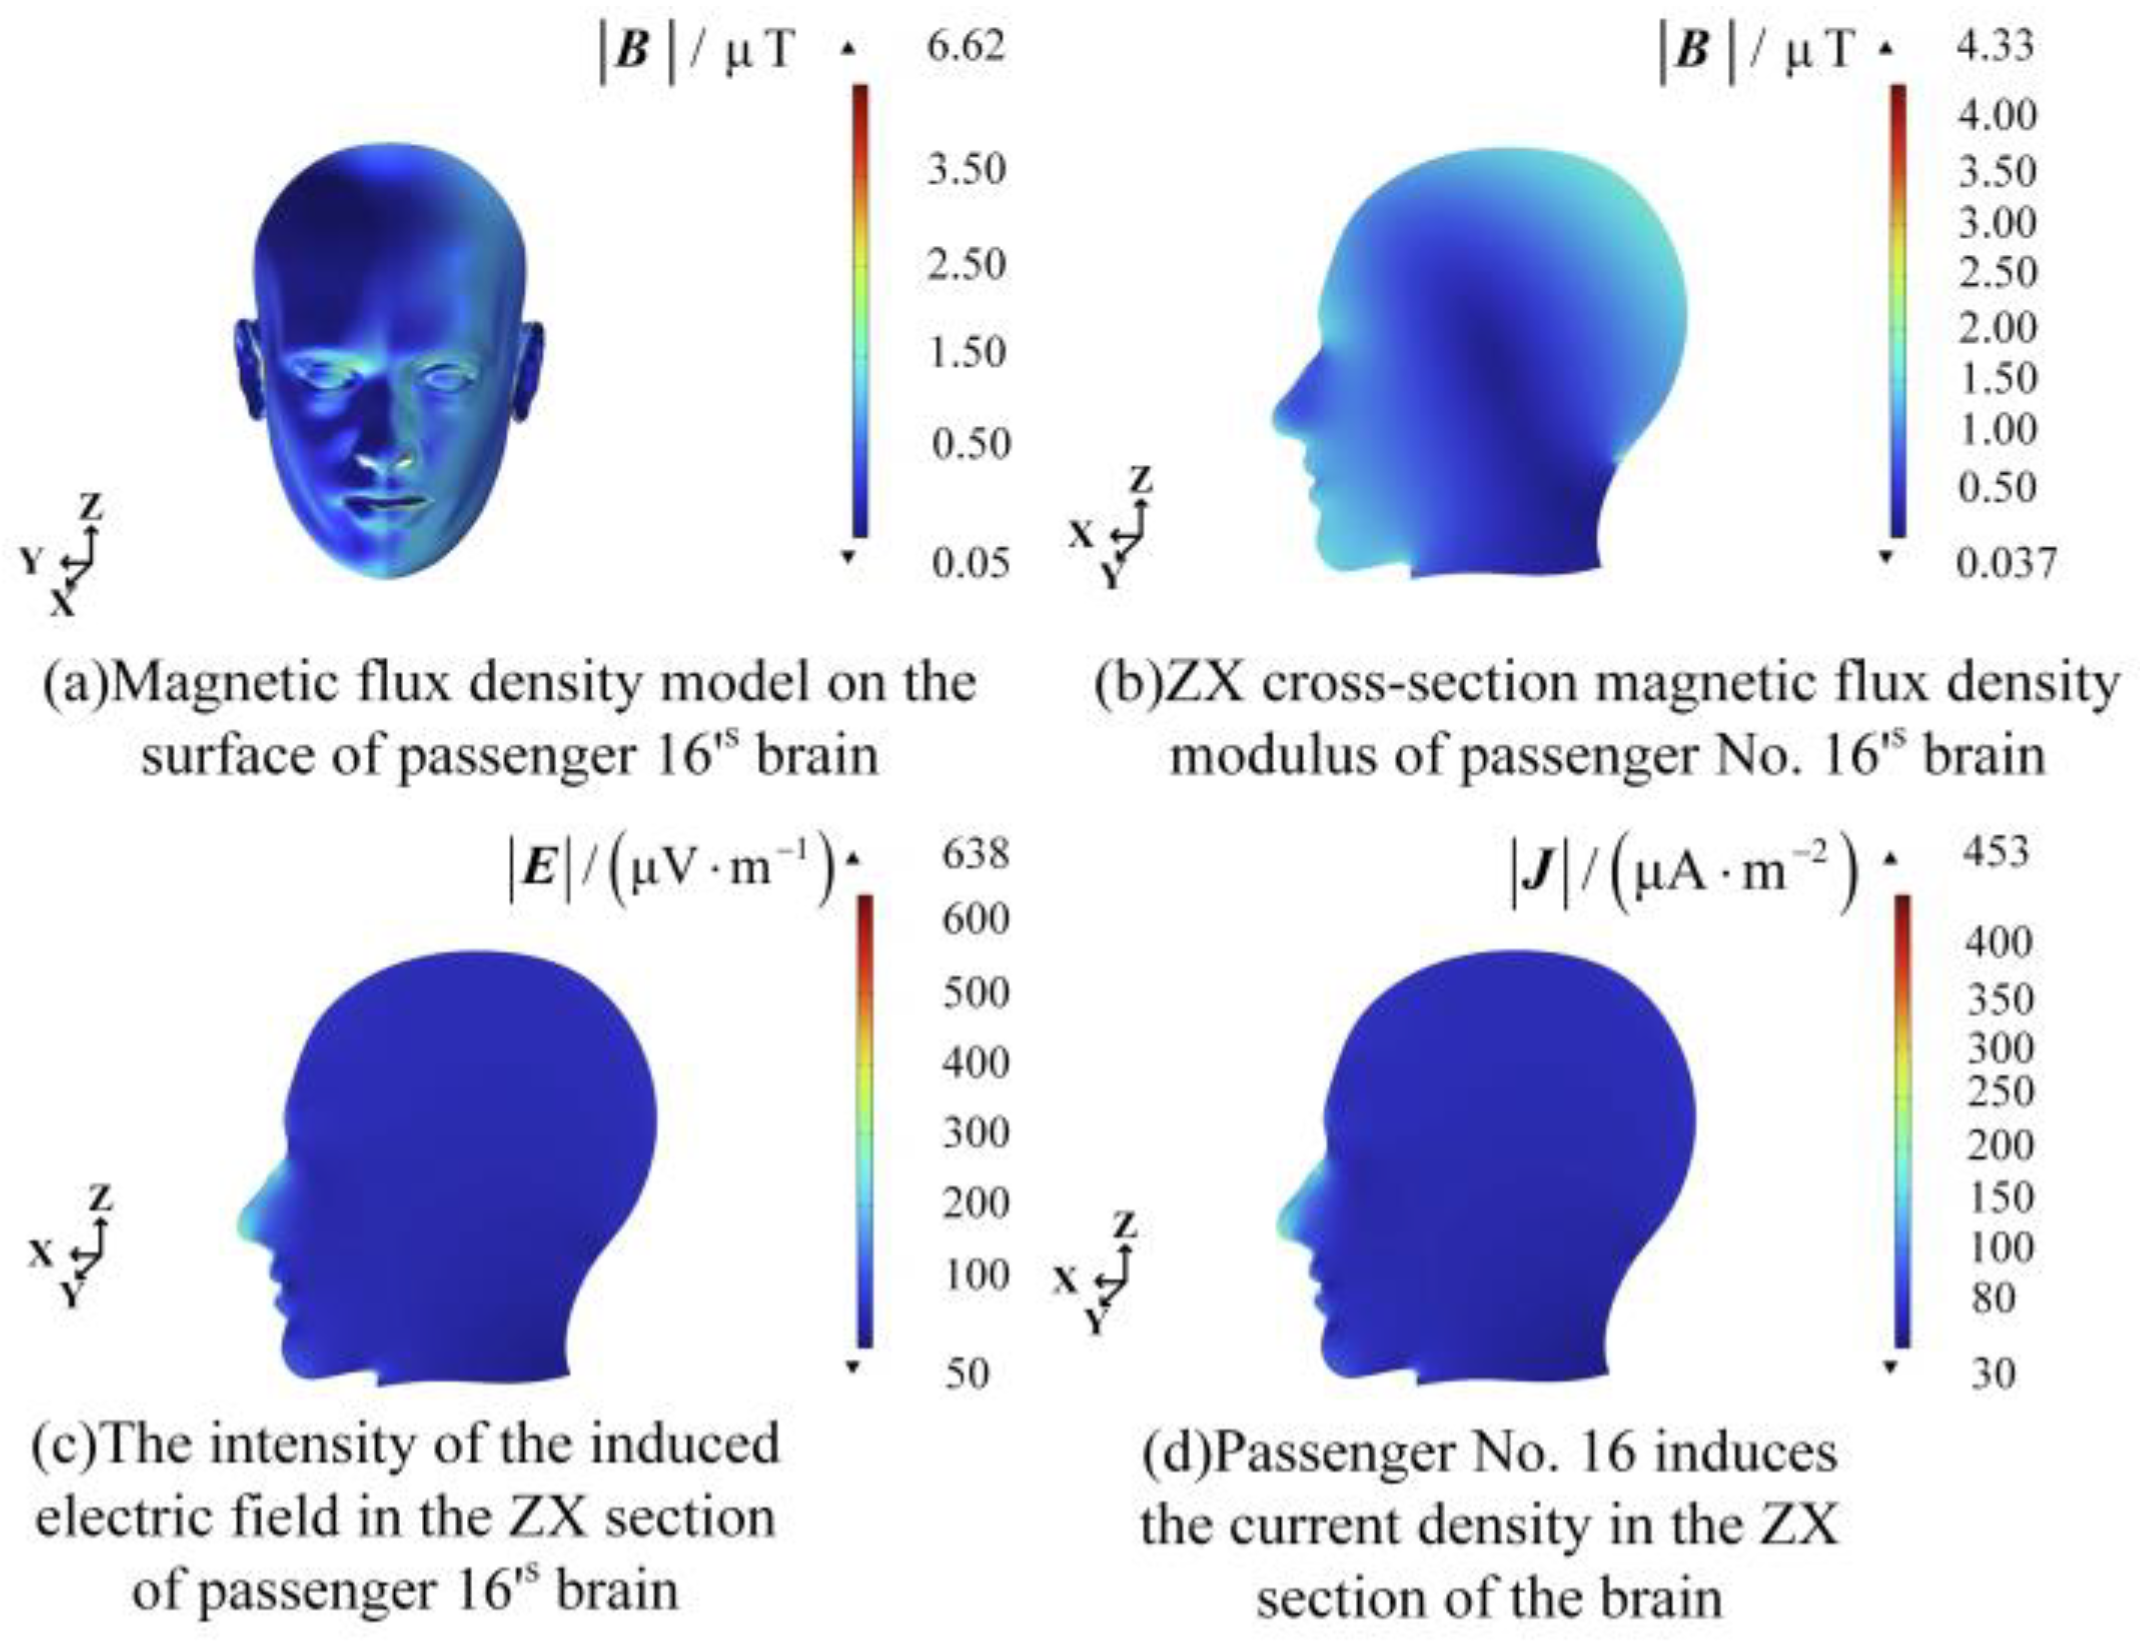
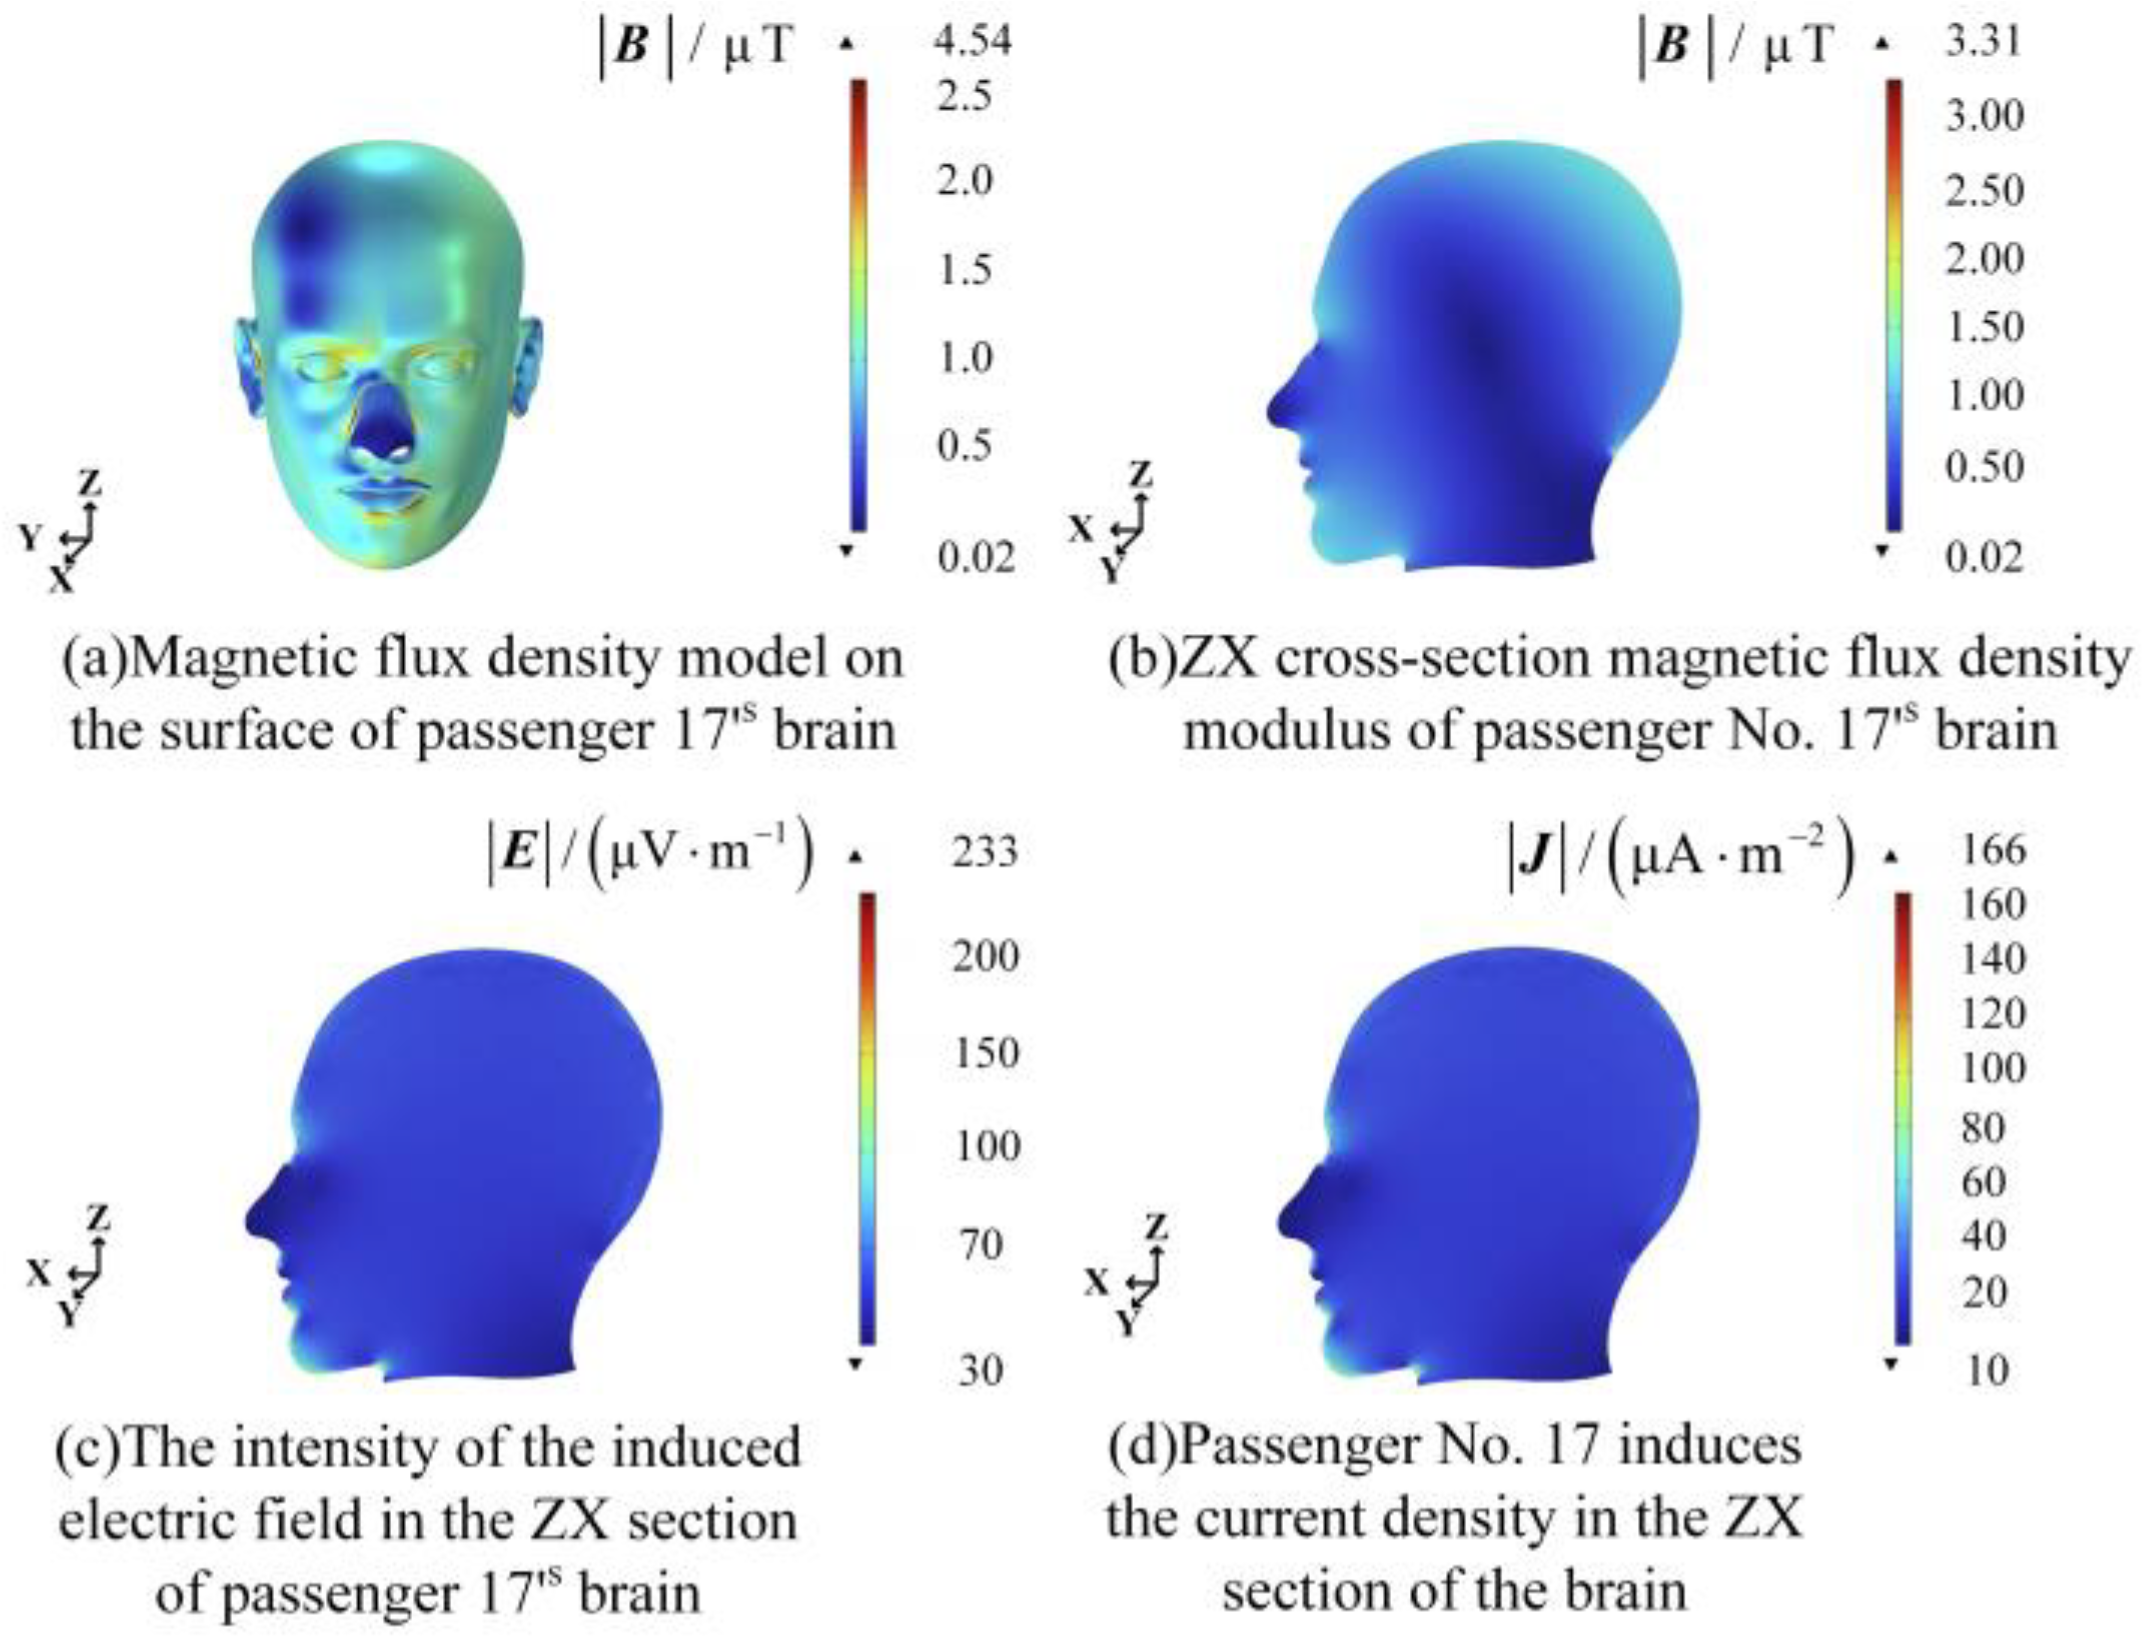
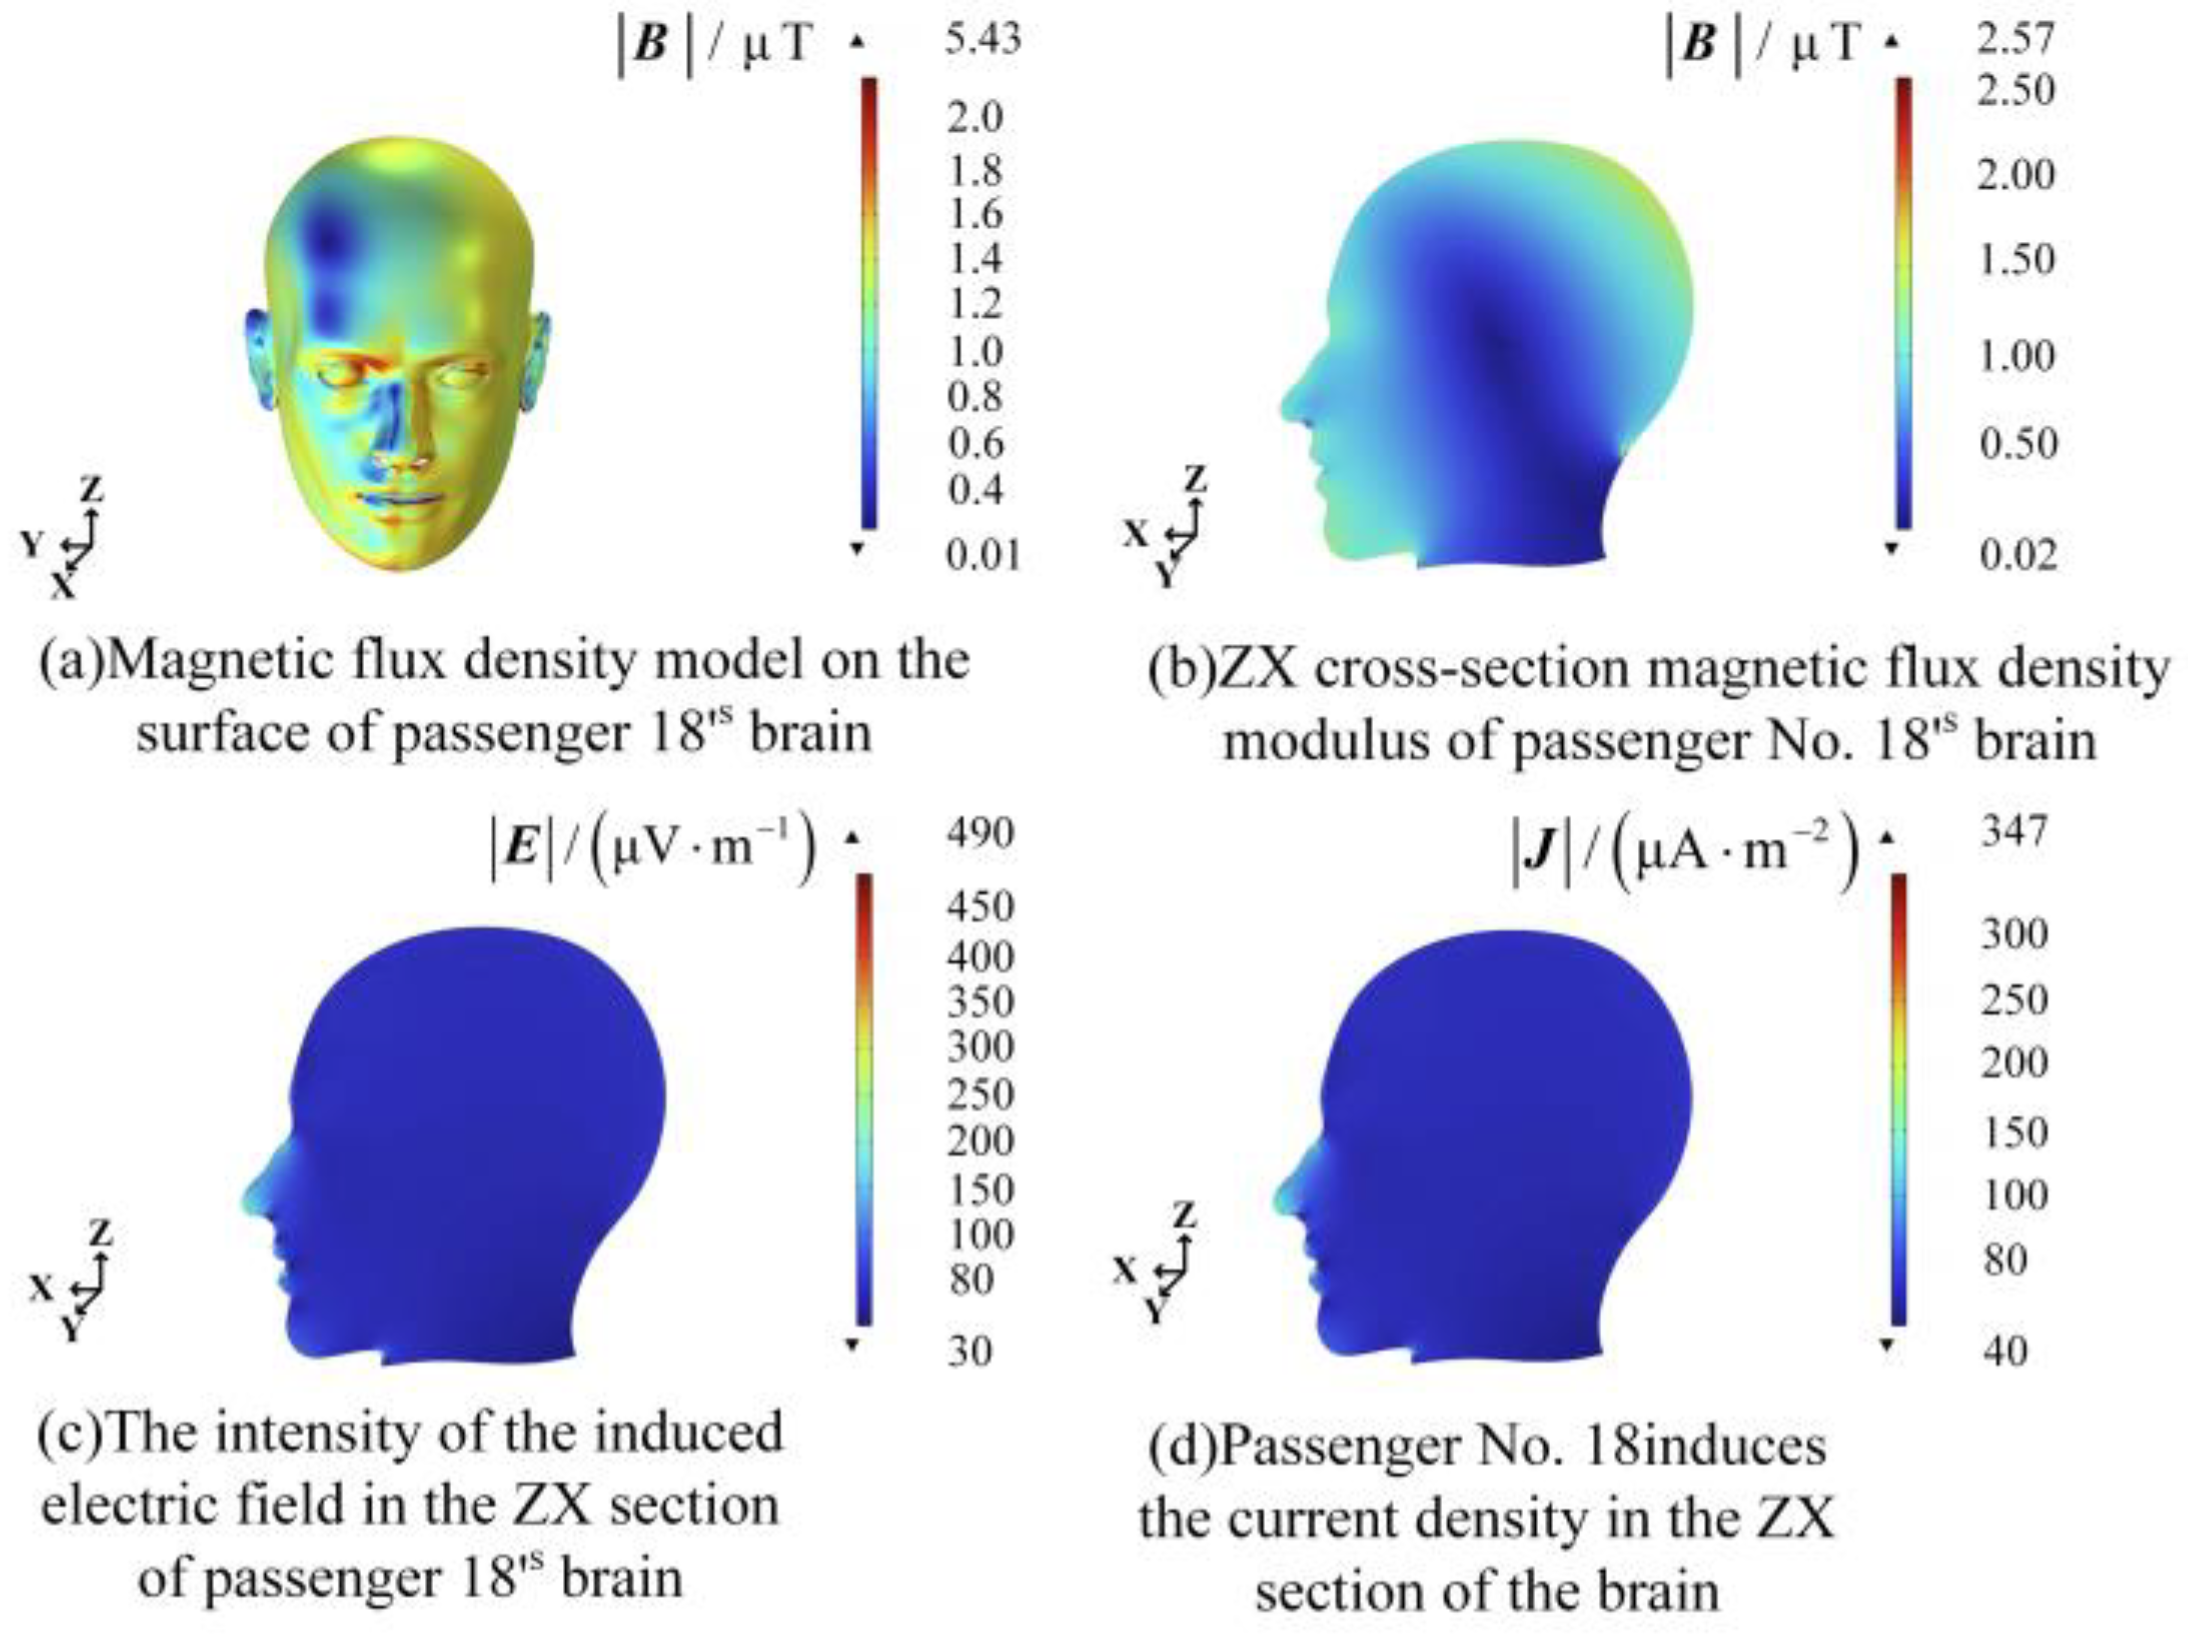
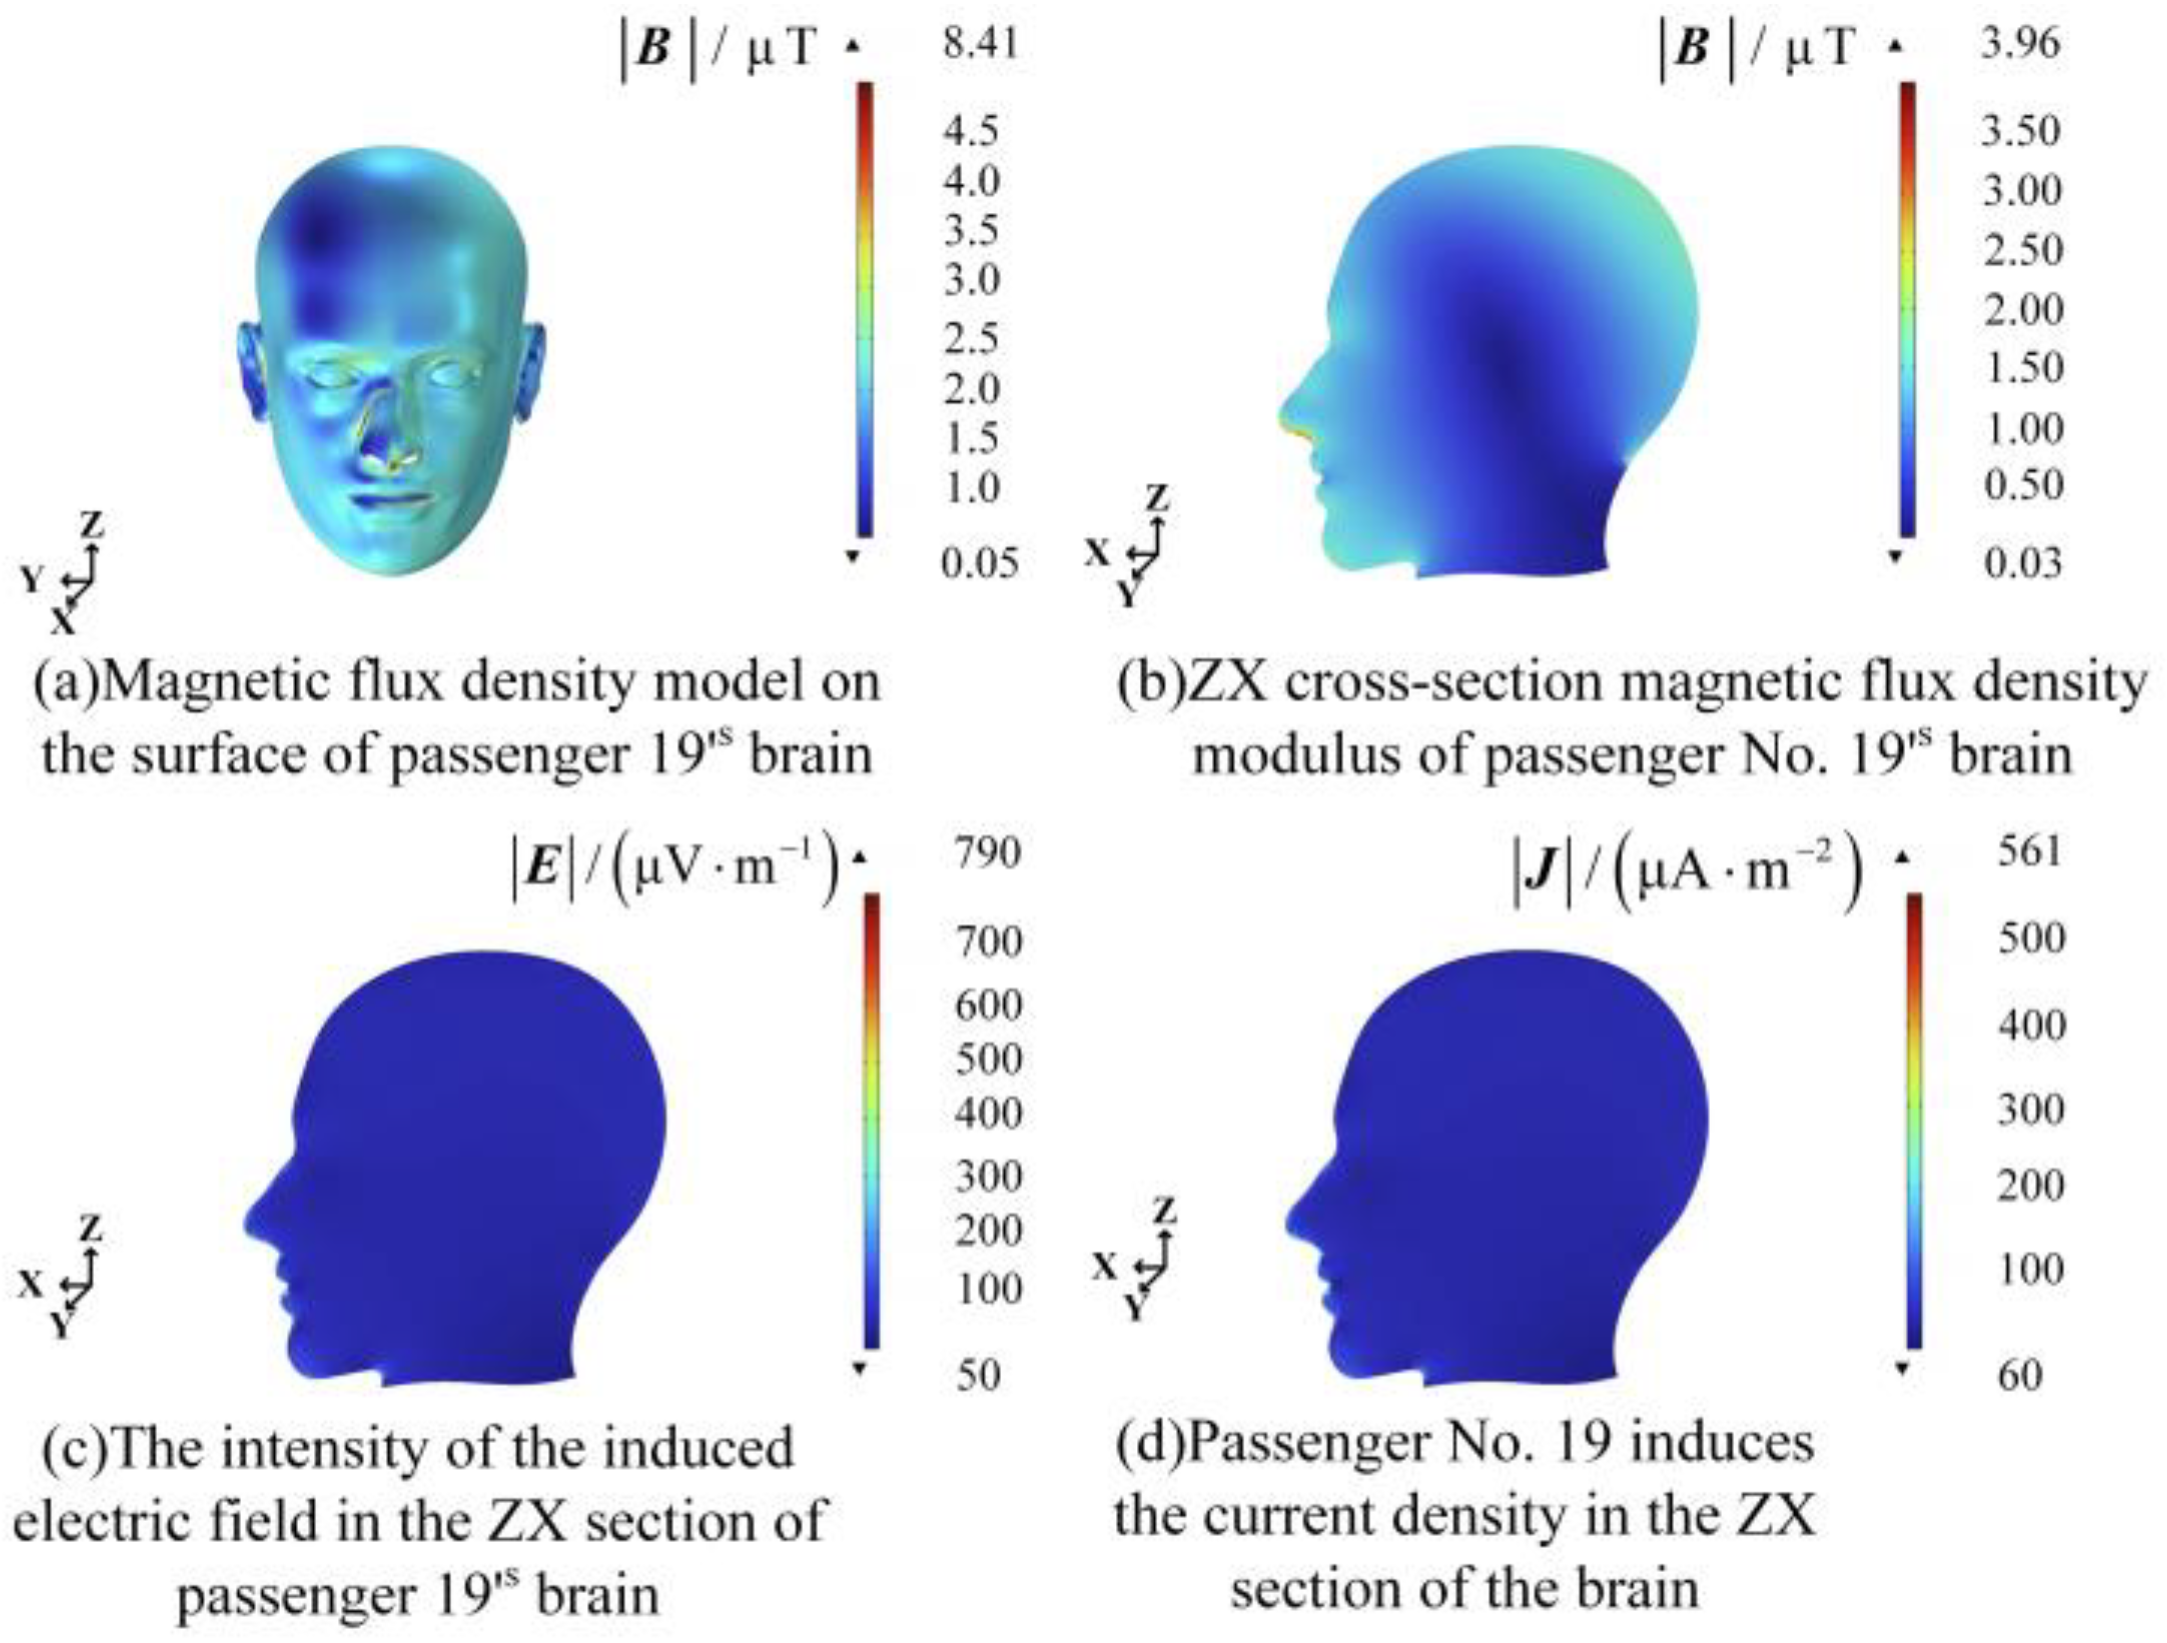
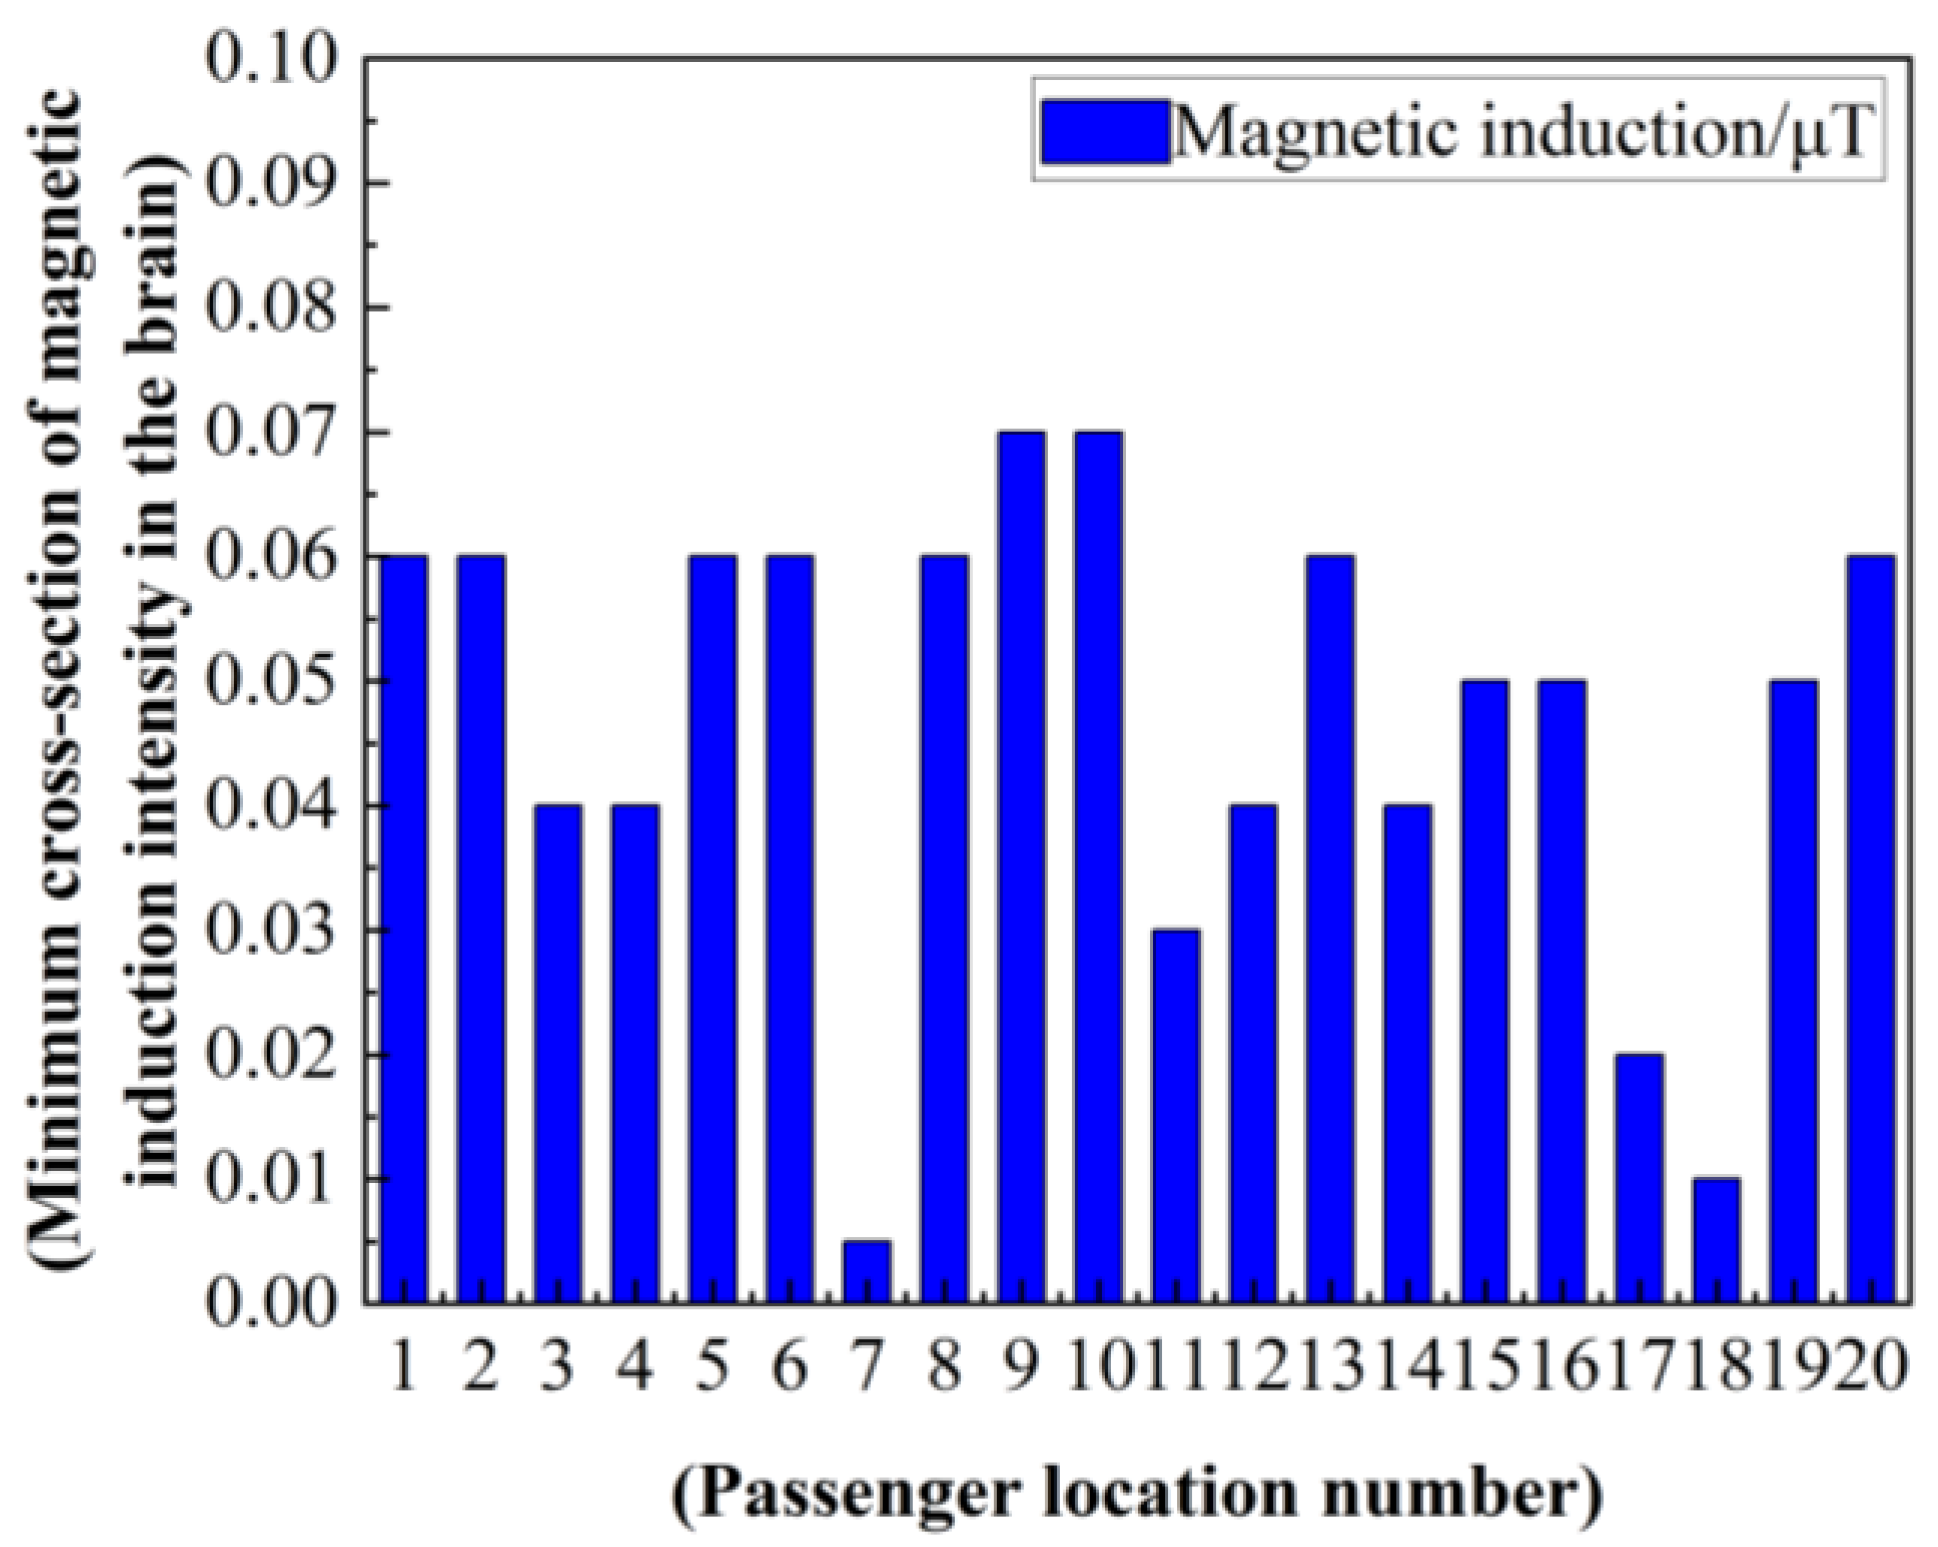
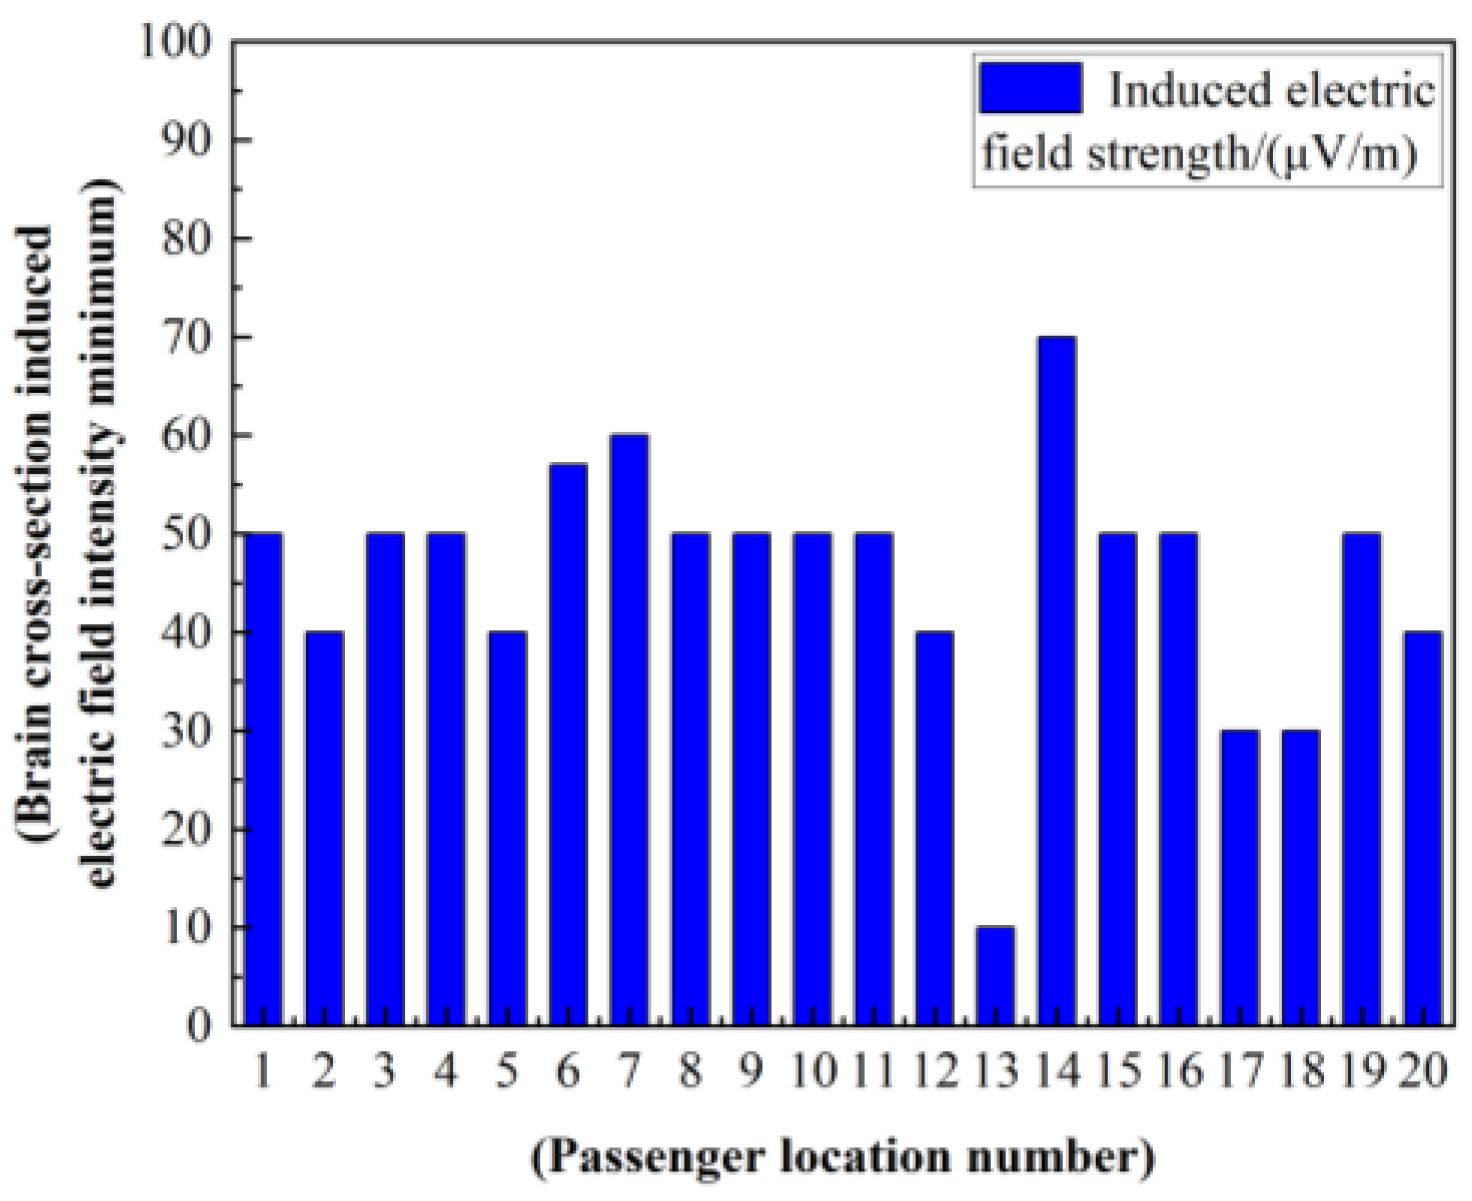
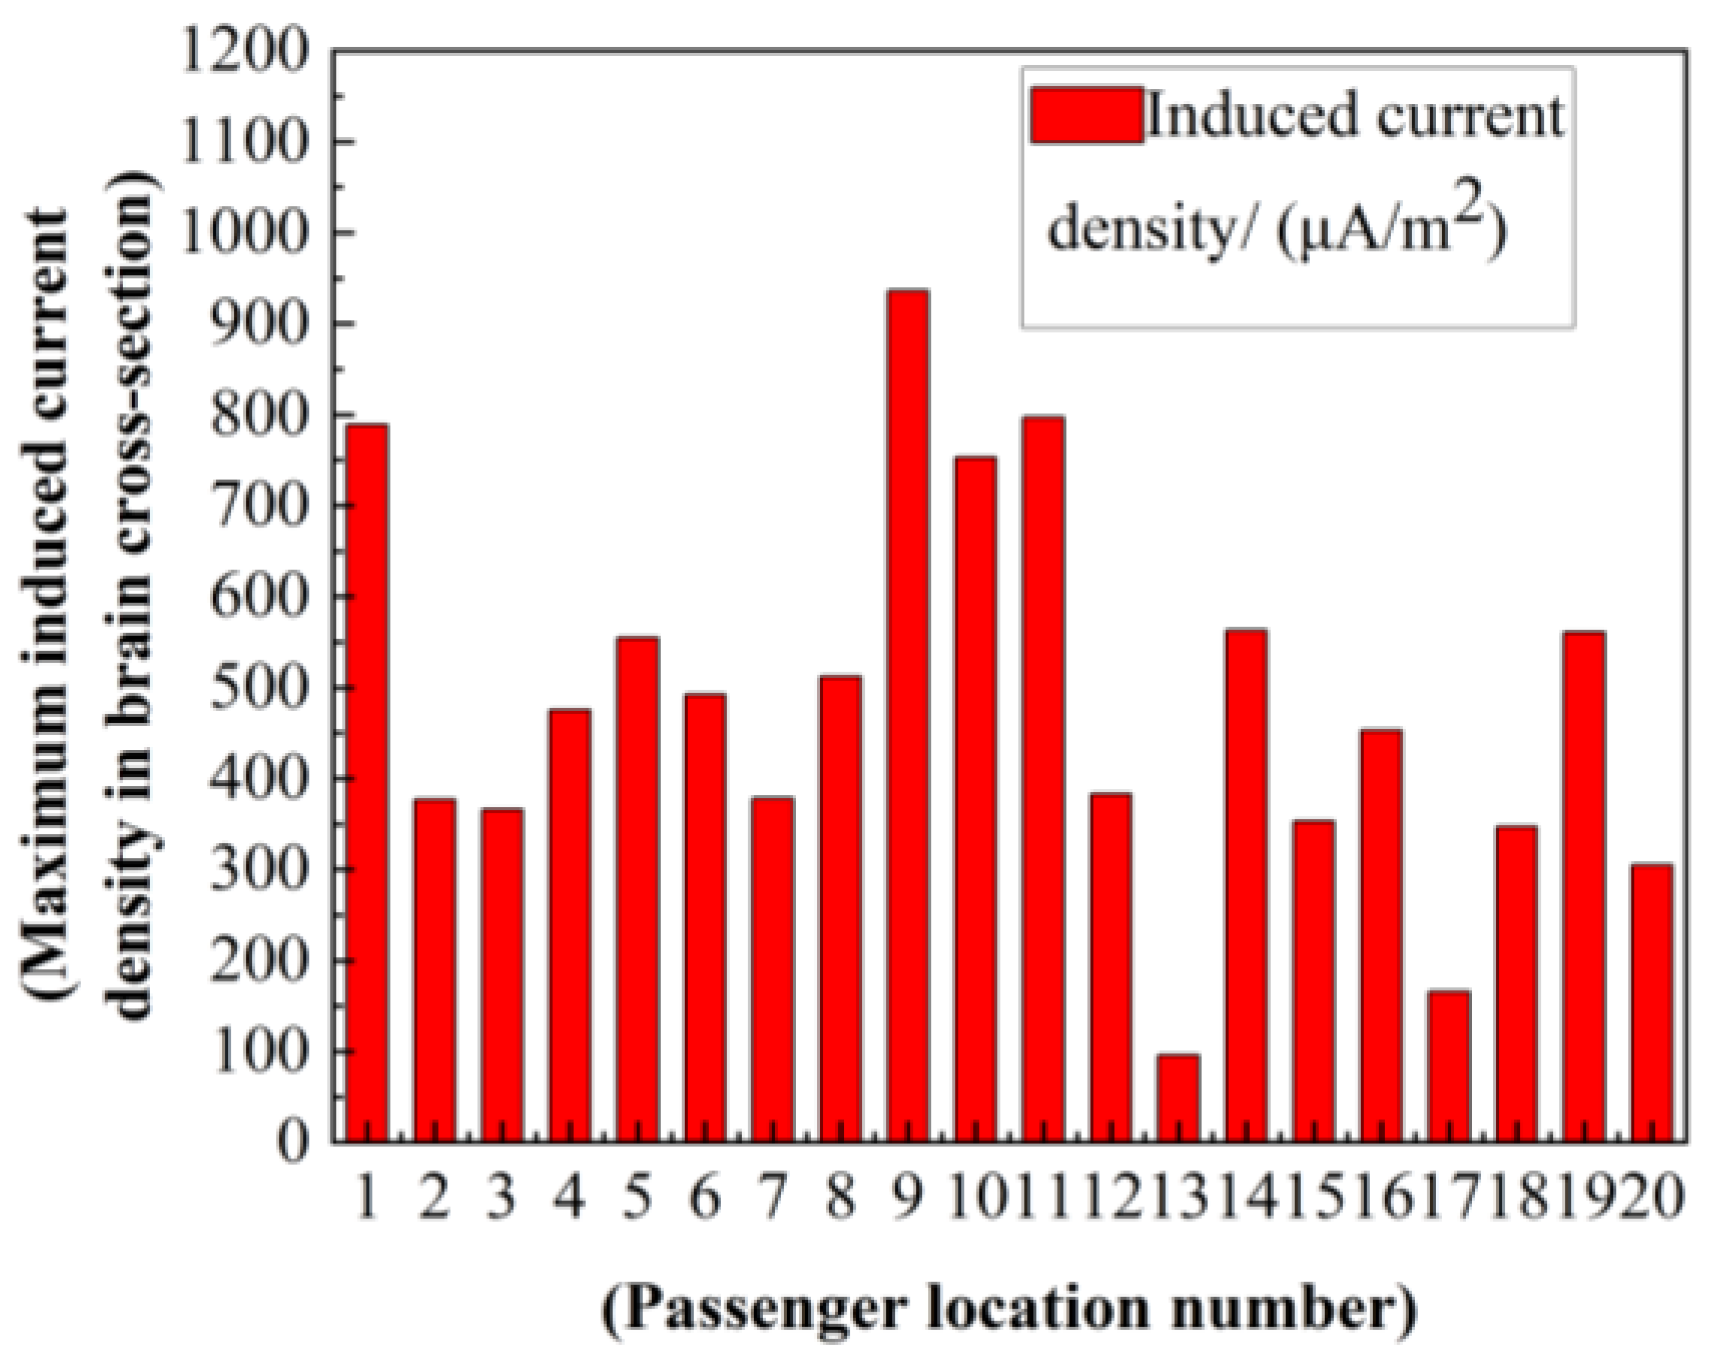
Through the comparison results, it is found that the values of the passengers’ brain on the side closer to the window are greater than the values of the passengers’ brain far away from the window, indicating that the shielding effect of the window on the electromagnetic radiation generated by the catenary is not as good as that of the aluminum alloy car body on the catenary.
(2)
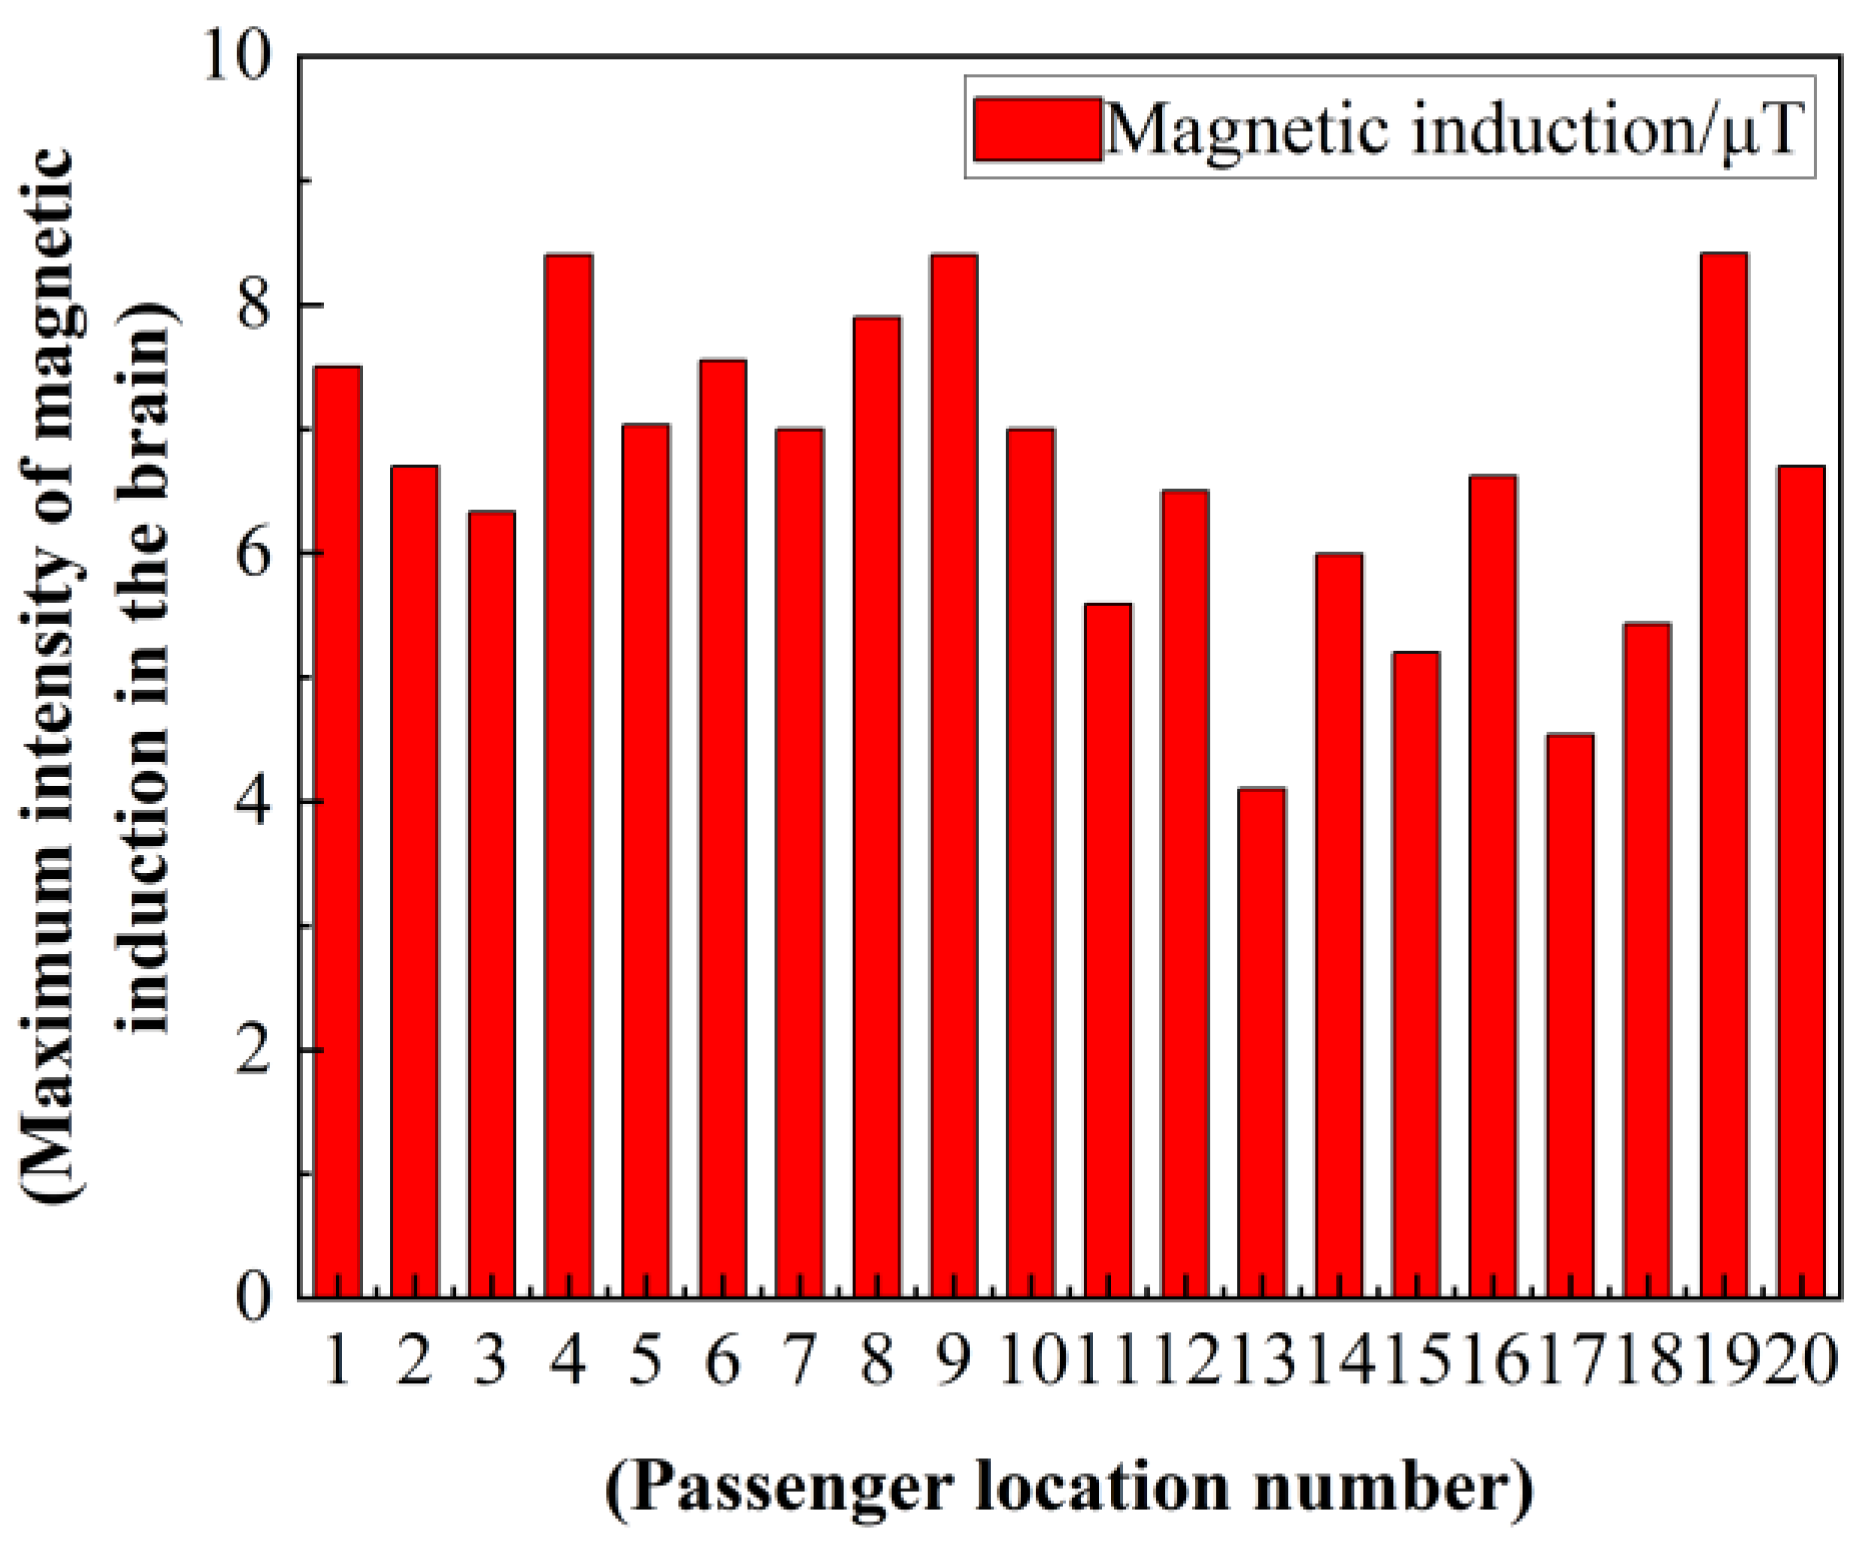
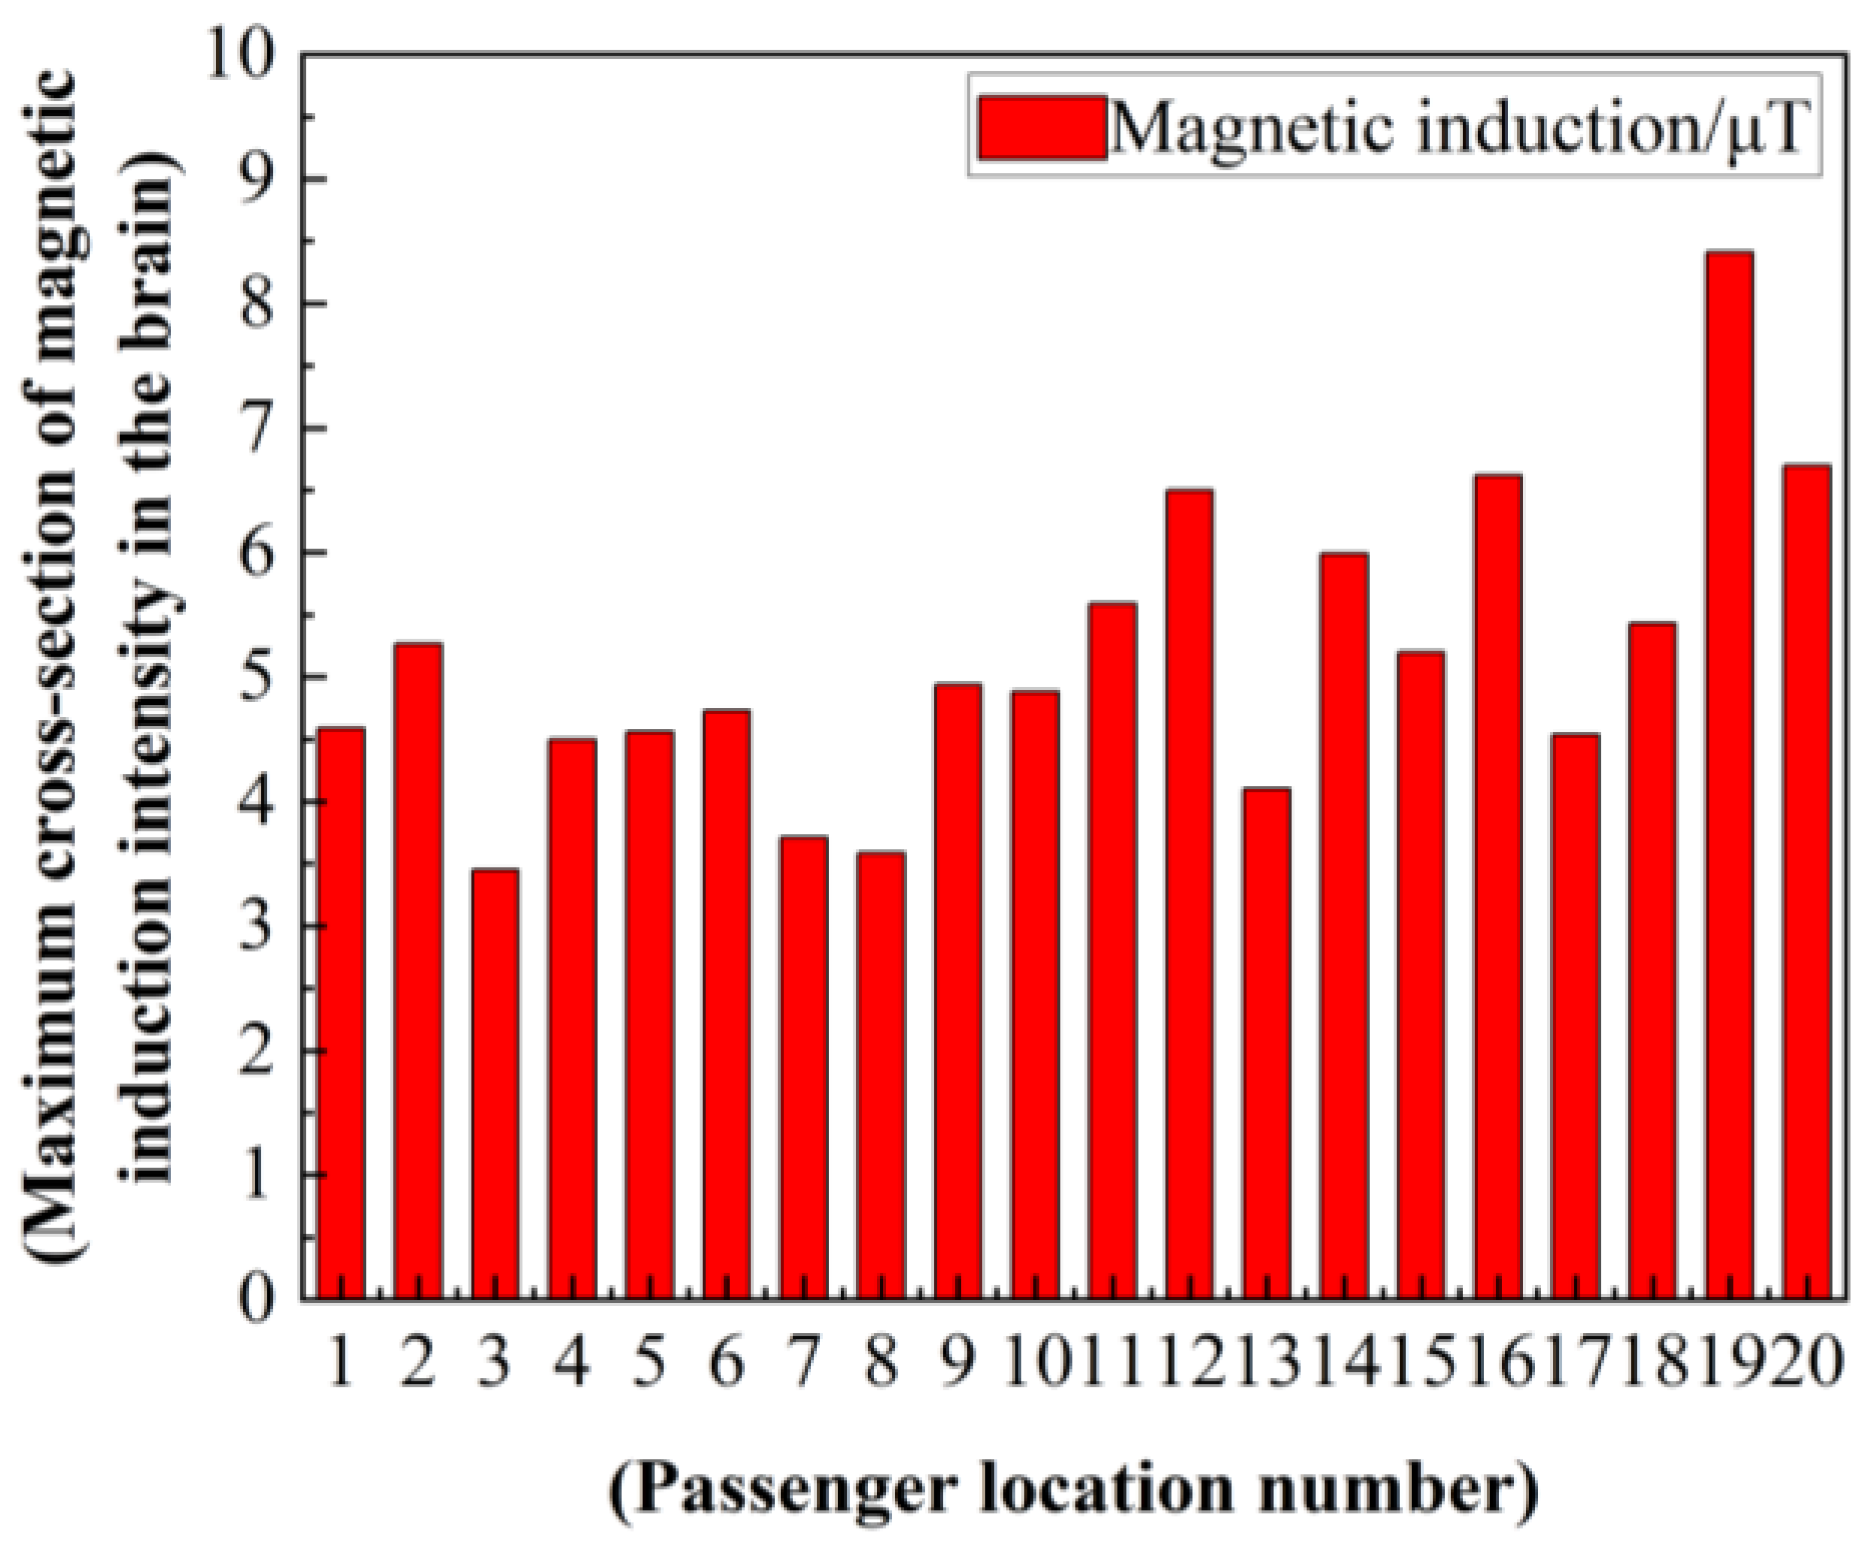
The maximum and minimum values for magnetic induction intensity, induced electric field intensity, and induced current density in the brain of 20 passengers were extracted. The maximum and minimum values of magnetic induction intensity were 8.41 and 0.01 μ T , respectively. The maximum and minimum values of induced electric field intensity were 1110 and 10 μ V / m , respectively. The maximum and minimum values of induced current density were 1200 and 10 μ A / m 2 , respectively. We also found that the values of induced magnetic and induced electric fields in the brains of all passengers were below the ICNIRP safety standard.
(3)
The final results show that the power frequency magnetic field generated by the catenary does not pose a threat to the health of passengers when the CR400AF bullet train is running. The internal electromagnetic environment is safe during the normal operation of the train.
In summary, the power frequency electromagnetic field generated at the contact line of the high-speed rail catenary will not cause damage to the health of passengers on CR400AF-type EMUs.

8. Discussion and Future Directions

The ultimate goal of this paper was to fill the research gap in the safety assessment of low-frequency electromagnetic exposure in high-speed EMU carriages. In future research work, the team will also conduct in-depth research and analysis on the following aspects:
(1)
The electromagnetic radiation of high-current and high-voltage traction equipment. Research will focus on the safety of low-frequency electromagnetic exposure caused by high-power electrical equipment such as traction transformers as radiation sources.
(2)
Based on the existing simulation research of CR400AF-type EMUs, the focus is on the latest maglev train and safety issues regarding its electromagnetic environment. Based on in-depth research and analysis, the future development direction of China’s high-speed rail shows a trend of ultra-high-speed vacuum pipeline transportation based on magnetic levitation technology. In addition to the problems with electromagnetic radiation caused by various electronic devices, the impact of magnetic force on the surrounding environment caused by the “levitation” state cannot be ignored, and this will become an unavoidable practical problem that will require in-depth research.
(3)
For high-speed rail, further research is needed on how increased electromagnetic radiation caused by continuously increasing speed will impact safety standards, and for future maglev trains, a comprehensive electromagnetic impact study is needed on the process of moving from laboratory to practical application to ensure that this type of train becomes a safe and reliable carrier for humans and leads to a better future for mankind. It can be said that this study has significant and far-reaching implications.
(4)
At present, there are still controversies and challenges in research on low-frequency electromagnetic exposure. Firstly, there is a need to enhance the consistency of results in epidemiological studies, particularly when there are variations in the methodologies and parameters across studies. Secondly, in-depth studies exploring the mechanisms are necessary to comprehend how electromagnetic fields interact with living organisms, giving rise to potential biological effects. Additionally, establishing standardized assessment criteria and limits for low-frequency electromagnetic field exposure remains an urgent concern.

Author Contributions

The method was proposed by L.S. The simulation work and manuscript writing were carried out by J.L. and Y.L. The data were processed by Y.Z. and X.L. Manuscript editing was carried out by J.L. All authors have read and agreed to the published version of the manuscript.

Funding

This research was supported by the Natural Science Foundation of Gansu Province (21JR7RA292).

Data Availability Statement

The data presented in this study are available in this article.

Conflicts of Interest

The authors declare no conflicts of interest.

References

  1. Hu, H. Research on Key Technologies of Intrusion Monitoring for High-Speed Rail Running Environment Safety. Ph.D. Thesis, China Academy of Railway Sciences, Beijing, China, 2022. [Google Scholar]
  2. Ma, W. China’s high-speed railway: The world’s first in terms of total operating mileage. Xiaokang 2017, 23, 20–23. [Google Scholar]
  3. Farag, A.S.; Dawoud, M.M.; Cheng, T.C.; Cheng, J.S. Occupational exposure assessment for power frequency electromagnetic fields. Electr. Power Syst. Res. 1999, 48, 151–175. [Google Scholar] [CrossRef]
  4. Psenakova, P.Z.; Benova, M.; Mydlova, J. Passenger Exposure of Electromagnetic Field in the Train. In Proceedings of the 2020 IEEE 21st International Conference on Computational Problems of Electrical Engineering (CPEE), (Online Conference), Poland, 16–19 September 2020; pp. 1–4. [Google Scholar]
  5. Zhu, F.; Niu, D.P.; Xu, C.W. Measurement and analysis on ambient magnetic fieid inside the bodywork of CRH1. J. Electr. Power Sci. Technol. 2012, 27, 42–46. [Google Scholar]
  6. Ma, Y.; Liu, Z.; Ma, L. Electromagnetic Disturbance Source Model of Discharge upon Pantograph-Catenary Disconnection of EMU. China Railw. Sci. 2013, 34, 76–81. [Google Scholar]
  7. Tian, R. Research on Safety Assessment of Low Frequency Electromagnetic Exposure for High-Speed Train Passengers. Ph.D. Thesis, Lanzhou Jiaotong University, Lanzhou, China, 2018. [Google Scholar]
  8. Yang, C.; Lu, M. Safety Assessment of Electromagnetic Exposure of Electric Locomotive’s Pantograph-Catenary Arc to Ground Crew. In Proceedings of the 2020 5th Asia Conference on Power and Electrical Engineering (ACPEE), Chengdu, China, 4–7 June 2020; pp. 1756–1761. [Google Scholar]
  9. Yuan, X.; Tian, R.; Lu, M. Research on radiation of high-speed railway station catenary power frequency electric field to staff. Adv. Technol. Electr. Eng. Energy 2022, 41, 80–88. [Google Scholar]
  10. Li, L.; Xiong, D.F.; Liu, J.W.; Li, Z.X.; Zeng, G.C.; Li, H.L. No effects of power line frequency extremely low frequency electromagnetic field exposure on selected neurobehavior tests of workers inspecting transformers and distribution line stations versus controls. Australas. Phys. Eng. Sci. Med. 2014, 37, 37–44. [Google Scholar] [CrossRef] [PubMed]
  11. Lorich, D.G.; Brighton, C.T.; Gupta, R.; Corsetti, J.R.; Levine, S.E.; Gelb, I.D.; Seldes, R.; Pollack, S.R. Biochemical pathway mediating the response of bone cells to capacitive coupling. Clin. Orthop. Relat. Res. 1998, 350, 246–256. [Google Scholar] [CrossRef]
  12. Zhou, J.; Ming, L.-G.; Ge, B.-F.; Wang, J.-Q.; Zhu, R.-Q.; Wei, Z.; Ma, H.-P.; Xian, C.J.; Chen, K.-M. Effects of 50 Hz sinusoidal electromagnetic fields of different intensities on proliferation, differentiation and mineralization potentials of rat osteoblasts. Bone 2011, 49, 753–761. [Google Scholar] [CrossRef]
  13. Håkansson, N.; Gustavsson, P.; Johansen, C.; Floderus, B. Neurodegenerative diseases in welders and other workers exposed to high levels of magnetic fields. Epidemiology 2003, 14, 420–426; discussion 427–428. [Google Scholar] [CrossRef]
  14. Wang, Y. Study on the Influences of Power Frequency Electromagnetic Field on Pupil’s Health Indicators. Master’s Thesis, Wuhan University of Science and Technology, Wuhan, China, 2015. [Google Scholar]
  15. Bao, J. Health effects of extremely low frequency electromagnetic fields. High Volt. Eng. 2015, 41, 2550–2561. [Google Scholar]
  16. Bao, J.; Hu, Y. Health effects of radio-frequency electromagnetic fiels. High Volt. Eng. 2016, 42, 2465–2478. [Google Scholar]
  17. Qu, M.; Bi, Z.; Tang, Y. Application of bio-electromagnetic technique and its related health risk assessment strategy. High Volt. Eng. 2015, 41, 2625–2634. [Google Scholar]
  18. Jia, Z.; Sun, F.; Yang, W. Organize safety evaluation of high power medical holmium laser therapeutic machine on canine bladderlithotripsy. High Volt. Eng. 2014, 40, 3799–3811. [Google Scholar]
  19. Song, P. Modeling and Simulation Analysis of Electromagnetic Environment of High Speed EMU Body. Master’s Thesis, Qingdao University, Qingdao, China, 2018. [Google Scholar]
  20. Qi, Y.; Zhou, L. The Fuxing: The China Standard EMU. Engineering 2020, 6, 227–233. [Google Scholar] [CrossRef]
  21. Yang, W.; Xu, Y.; Wang, C.; Lin, F.; Dong, L. An Electromagnetic Safety Study about Human Body in Electric Locomotive Wireless Charging System. Trans. China Electrotech. Soc. 2022, 37, 2665–2672. [Google Scholar]
  22. GB10000-88; People’s Republic of China Adult Human Body Size Standard. State Bureau of Technical Supervision; China Standard Press: Beijing, China, 1989.
  23. GB13547-1992; The People’s Republic of China Workspace Human Body Size. State Bureau of Technical Supervision; China Standard Press: Beijing, China, 1992.
  24. Taflove, A.; Hagness, S.C.; Piket-May, M. Computational Electromagnetics: The Finite-Difference Time-Domain Method. Electr. Eng. Handb. 2005, 3, 629–670. [Google Scholar]
  25. Gabriel, S.; Lau, R.W.; Gabriel, C. The dielectric properties of biological tissues, III: Parametric models for the dielectric spectrum of tissues. Phys. Med. Biol. 1996, 41, 2271–2293. [Google Scholar] [CrossRef]
  26. Li, L.; Lu, M. Comparative study on electromagnetic exposure of adults and minors from 1000 kV ultra-high voltage AC transmission power lines. J. Radiat. Res. Radiat. Process. 2019, 37, 020601. [Google Scholar]
  27. Gabriel, C.; Corthout, E.; Gabriel, S. The Dielectric Properties of Biological Tissues: I. Literature Survey. Phys. Med. Biol. 1996, 41, 2231–2249. [Google Scholar] [CrossRef]
  28. Gabriel, S.; Lau, R.W.; Gabriel, C. The dielectric properties of biological tissues: II. Measurements in the frequency range 10 Hz to 20 GHz. Phys. Med. Biol. 1996, 41, 2251–2269. [Google Scholar] [CrossRef]
  29. Gosselin, M.C.; Neufeld, E.; Moser, H.; Huber, E.; Farcito, S.; Gerber, L.; Kuster, N. Development of a New Generation of High-Resolution Anatomical Models for Medical Device Evaluation: The Virtual Population 3.0. Phys. Med. Biol. 2014, 41, 5287–5303. [Google Scholar] [CrossRef] [PubMed]
  30. Chen, D.; Lu, M. Exposure characteristics of 5G mobile phone antenna and its temperature field distribution in the human head. J. Radiat. Res. Radiat. Process. 2021, 39, 030601. [Google Scholar]
  31. Jin, H. Simulation and Analysis of Magnetic Field in EMU Trains. Master’s Thesis, Beijing Jiaotong University, Beijing, China, 2021. [Google Scholar]
  32. Tian, R.; Lu, M. Safety Assessment of Electromagnetic Exposure in High-Speed Train Carriage with Full Passengers. Ann. Work Expo. Health 2020, 64, 838–851. [Google Scholar] [CrossRef] [PubMed]
  33. The International Commission on Non-Ionizing Radiation Protection. Guidelines for limiting exposure to time-varying electric, magnetic, and electromagnetic fields (up to 300 GHz). Health Phys. 1998, 74, 494–522. [Google Scholar]
  34. The International Commission on Non-Ionizing Radiation Protection. Guidelines for limiting exposure to time-varying electric and magnetic fields (1 Hz to 100 kHz). Health Phys. 2010, 99, 818–836. [Google Scholar] [CrossRef]
  35. The International Commission on Non-Ionizing Radiation Protection. Guidelines for limiting exposure to time-varing electric, magnetic and electromagnetic fields (100 kHZ to 300 GHz). Health Phys. 2020, 118, 483–524. [Google Scholar] [CrossRef]
  36. IEEE Std C95.1-2019; IEEE Standard for Safety Levels with Respect to Human Exposure to Electric, Magnetic, and Electromagnetic Fields, 0 Hz to 300 GHz. Revision of IEEE Std C95.1-2005/Incorporates IEEE Std C95.1-2019/Cor 1-2019; IEEE: New York, NY, USA, 2019; pp. 1–312.
Figure 1. CR400AF formation and electromagnetic emission diagrams.
Electronics 13 00740 g001
Figure 2. CR 400AF and contact line.
Electronics 13 00740 g002
Figure 3. Schematic of passenger location and number.
Electronics 13 00740 g003
Figure 4. Meshing diagram of EMU model.
Electronics 13 00740 g004
Figure 5. Meshing diagram of passenger body model.
Electronics 13 00740 g005
Figure 6. Schematic of brain results of passenger 1.
Electronics 13 00740 g006
Figure 7. Schematic of brain results of passenger 2.
Electronics 13 00740 g007
Figure 8. Schematic of brain results of passenger 3.
Electronics 13 00740 g008
Figure 9. Schematic of brain results of passenger 4.
Electronics 13 00740 g009
Figure 10. Schematic of brain results of passenger 5.
Electronics 13 00740 g010
Figure 11. Schematic of brain results of passenger 6.
Electronics 13 00740 g011
Figure 12. Schematic of brain results of passenger 7.
Electronics 13 00740 g012
Figure 13. Schematic of brain results of passenger 8.
Electronics 13 00740 g013
Figure 14. Schematic of brain results of passenger 9.
Electronics 13 00740 g014
Figure 15. Schematic of brain results of passenger 10.
Electronics 13 00740 g015
Figure 16. Schematic of brain results of passenger 11.
Electronics 13 00740 g016
Figure 17. Schematic of brain results of passenger 12.
Electronics 13 00740 g017
Figure 18. Schematic of brain results of passenger 13.
Electronics 13 00740 g018
Figure 19. Schematic of brain results of passenger 14.
Electronics 13 00740 g019
Figure 20. Schematic of brain results of passenger 15.
Electronics 13 00740 g020
Figure 21. Schematic of brain results of passenger 16.
Electronics 13 00740 g021
Figure 22. Schematic of brain results of passenger 17.
Electronics 13 00740 g022
Figure 23. Schematic of brain results of passenger 18.
Electronics 13 00740 g023
Figure 24. Schematic of brain results of passenger 19.
Electronics 13 00740 g024
Figure 25. Schematic of brain results of passenger 20.
Electronics 13 00740 g025
Figure 26. Maximum induction intensity on the surface of the passengers’ brains.
Electronics 13 00740 g026
Figure 27. Minimum induction intensity on the surface of the passengers’ brains.
Electronics 13 00740 g027
Figure 28. Maximum magnetic induction intensity in the ZX section of the passengers’ brains.
Electronics 13 00740 g028
Figure 29. Minimum magnetic induction intensity in the ZX cross-section of the passengers’ brains.
Electronics 13 00740 g029
Figure 30. Maximum induced electric field intensity in the ZX section of the passengers’ brains.
Electronics 13 00740 g030
Figure 31. Minimum induced electric field intensity in the ZX section of the passengers’ brains.
Electronics 13 00740 g031
Figure 32. Maximum induced current density in the ZX section of the passengers’ brains.
Electronics 13 00740 g032
Figure 33. Minimum induced current density in the ZX section of the passengers’ brains.
Electronics 13 00740 g033
Figure 34. Coordinates of the positions of the 20 passengers.
Electronics 13 00740 g034
Table 1. CR400AF car body parameters.
ParameterHead CarIntermediate Car with Pantograph
Length (m)27.225
Width (m)3.363.36
Height (m)4.054.05
Vehicle spacing (m)17.817.8
Vehicle weight (t)12.011.7
Table 2. Dielectric parameters of different types of human tissues at a frequency of 50 Hz.
Human Tissue TypeRelative Dielectric Constant Electrical   Conductivity   ( m S × m 1 )
Scalp51,2740.427190
Skull8867.820.05500
Cerebrospinal fluid1092000
Alba5,289,80053.274
Ectocinerea12,107,00075.258
Cerebrum5,798,969.672128.532
Muscle17,719,000233.29
Skeleton8867.8200.55
Trunk6,400,222.6151.131667
Table 3. ICNIRP time-varying electric and magnetic field public exposure limits.
Frequency Range (f)Electric Field Strength (kV/m)Magnetic Field Strength (A/m)Magnetic Field Density (T)
1–8 Hz53.2 × 104/f 24 × 10−2/f 2
8–25 Hz54 × 103/f5 × 10−3/f
25–50 Hz51.6 × 1022 × 10−4
50–400 Hz2.5 × 102/f1.6 × 1022 × 10−4
400–3 kHz2.5 × 102/f6.4 × 104/f8 × 10−2/f
Table 4. IEEE basic limits of electric field strength for different tissues of the human body.
Exposed TissueF (Hz)PublicControlled Environment
Electric Field Strength (V/m)Electric Field Strength (V/m)
Head≤205.89 × 10−31.77 × 10−2
Respiratory system≤1670.9430.943
Hand, wrist, foot, ankle≤33502.102.10
Other ≤33500.7012.10
Table 5. IEEE maximum permissible exposures for different tissues of the human body.
Exposed TissueFrequency RangesPublicControlled Environment
Headf (Hz)B (mT)H (A/m)B (mT)H (A/m)
f ≤ 0.1531189.39 × 1043532.81 × 105
0.153 < f ≤ 2018.2/f1.44 × 104/f54.3/f4.32 × 104/f
20 < f ≤ 7590.9047192.712.16 × 105
759 < f ≤ 3000687/f5.47 × 105/f2060/f1.64 × 106/f
Arm, legf ≤ 10.7353353
10.7 < f ≤ 30003790/f3790/f
Table 6. Induced electric and magnetic field values in the brains of the 20 passengers.
Passenger NumberMaximum Value of Magnetic Fields Induced in the Brain (μT)Minimum Value of Magnetic Field Induced in the Brain
(μT)
Maximum Value of Induced Electric Field in the Brain (μV/m)Minimum Value of Induced Electric Field in the Brain (μV/m)
14.590.06111050
25.270.0653140
33.450.0451550
44.50.0466950
54.560.0678340
64.730.00569457
73.710.0653360
83.590.0772250
94.940.0768050
104.880.0150050
115.590.0270050
123.270.0354040
133.680.0113510
145.020.0279370
153.970.03749850
164.330.0263850
173.310.0223330
182.570.0249030
193.960.0379050
204.160.0243040
Table 7. Electromagnetic data for the brains of passengers 1–10.
Passenger Location Number12345678910
Maximum value of induced magnetic
fields in the brain (μT)
4.595.273.454.54.564.733.713.594.944.88
Minimum value of induced magnetic
field in the brain (μT)
0.060.060.040.040.060.0050.060.070.070.01
Maximum value of induced electric
field in the brain (μV/m)
1110531515669783694533722680500
Minimum value of induced electric
field in the brain (μV/m)
50405050405760505050
Table 8. Electromagnetic data for the brains of passengers 11–20.
Passenger Location Number11121314151617181920
Maximum values of magnetic fields induced in the brains of passengers (μT)5.593.273.685.023.974.333.312.573.964.16
Minimum value of magnetic field induced in the brain of passengers (μT)0.020.030.010.020.0370.020.020.020.030.02
Maximum value of induced electric field in the brains of passengers (μV/m)700540135793498638233490790430
Minimum value of induced electric field in the brains of passengers (μV/m)50401070505030305040
Table 9. Comparison with data from previous studies.
DataResults of This PaperResults of Previous Studies
Maximum value of induced magnetic field in the brains of passengers (μT)5.593.63
Minimum value of induced magnetic field in the brains of passengers (μT)0.0050.04
Maximum value of induced electric field in the brains of passengers (mV/m)1.113.64
Minimum value of induced electric field in the brains of passengers (mV/m)0.0010.00285
Disclaimer/Publisher’s Note: The statements, opinions and data contained in all publications are solely those of the individual author(s) and contributor(s) and not of MDPI and/or the editor(s). MDPI and/or the editor(s) disclaim responsibility for any injury to people or property resulting from any ideas, methods, instructions or products referred to in the content.

