Abstract
The purpose of this paper is to explore the implementation of retrieval-augmented generation (RAG) technology with open-source large language models (LLMs). A dedicated web-based application, PaSSER, was developed, integrating RAG with Mistral:7b, Llama2:7b, and Orca2:7b models. Various software instruments were used in the application’s development. PaSSER employs a set of evaluation metrics, including METEOR, ROUGE, BLEU, perplexity, cosine similarity, Pearson correlation, and F1 score, to assess LLMs’ performance, particularly within the smart agriculture domain. The paper presents the results and analyses of two tests. One test assessed the performance of LLMs across different hardware configurations, while the other determined which model delivered the most accurate and contextually relevant responses within RAG. The paper discusses the integration of blockchain with LLMs to manage and store assessment results within a blockchain environment. The tests revealed that GPUs are essential for fast text generation, even for 7b models. Orca2:7b on Mac M1 was the fastest, and Mistral:7b had superior performance on the 446 question–answer dataset. The discussion is on technical and hardware considerations affecting LLMs’ performance. The conclusion outlines future developments in leveraging other LLMs, fine-tuning approaches, and further integration with blockchain and IPFS.
1. Introduction
The advent of LLMs is changing the paradigm in natural language processing (NLP) toward improved classification, generation, and understanding of texts. However, general-purpose LLMs often require further adaptation to advance their performance in specific tasks or specialized domains. This has led to the development of different approaches to enhancing the performance of the models. Their goal has been to overcome the inherent limitations of pre-trained large-scale models. In this regard, the following models can be mentioned: full fine-tuning, parameter-efficient fine-tuning (PEFT), prompt engineering, and retrieval-augmented generation (RAG).
Full fine-tuning [1] is a method in which tuning occurs by adjusting all LLM parameters to specific data for a single task. This requires less data and offers greater accuracy and robustness of the results. The large scale of LLMs, however, makes the method’s implementation computationally expensive, requiring significant memory, time, and expertise.
Parameter-efficient fine-tuning (PEFT) [2] emerged simultaneously, outlining an alternative strategy. The method focuses on modifying a selected number of parameters. The results are better (faster) learning performance and knowledge retention from pre-training. However, the performance of PEFT depends on the complexity of the task and the technique chosen, as it updates far fewer parameters in comparison to full fine-tuning.
In [3], the prompt engineering method is presented. This technique does not involve training network weights. To influence the desired output, it involves crafting the input to the model. This approach includes zero-shot prompting, few-shot prompting, and chain-of-thought prompting, each offering a way to guide the model’s response without direct modification of its parameters. This method leverages the flexibility and capability of LLM and provides a tool to adapt the model without the computational cost of retraining.
RAG, introduced in [4], enhances language models by combining prompt engineering and database querying to provide context-rich answers, reducing errors and adapting to new data efficiently. The main concepts involve a combination of pre-trained language models with external knowledge retrieval, enabling dynamic, informed content generation. It is cost-effective and allows for traceable responses, making it interpretable. The development of retrieval-augmented generation (RAG) represents a significant advancement in the field of natural language processing (NLP). However, for deeper task-specific adaptations, like analysing financial or medical records, fine-tuning may be preferable. RAG’s integration of retrieval and generation techniques addresses LLM issues like inaccuracies and opaque logic, yet incorporating varied knowledge and ensuring information relevance and accuracy remain challenges [5].
Each method offers a specific approach to improving LLM performance. Choosing between them depends on the desired balance between the required results, the available resources, and the nature of the tasks set.
In fact, there are other different methods in this field. They are founded on these basic approaches or applied in parallel. For example, dense passage retrieval (DPR) [6] and the retrieval-augmented language model (REALM) [7] refine retrieval mechanisms similar to RAG. Fusion-in-decoder (FiD) [8] integrates information from multiple sources into the decoding process. There are various knowledge-based modelling and meta-learning approaches. Each of these models reflects efforts to extend the capabilities of pre-trained language models and offer solutions for a wide range of NLP tasks.
The purpose of this paper is to explore the implementation of retriever-augmented generation (RAG) technology with open-source large language models (LLMs). In order to support this research, a web-based application PaSSER that allows the integration, testing and evaluation of such models in a structured environment has been developed.
The paper discusses the architecture of the web application, the technological tools used, the models selected for integration, and the set of functionalities developed to operate and evaluate these models. The evaluation of the models has two aspects: operation on different computational infrastructures and performance in text generation and summarization tasks.
The domain of smart agriculture is chosen as the empirical domain for testing the models. Furthermore, the web application is open-source, which promotes transparency and collaborative improvement. A detailed guide on installing and configuring the application, the datasets generated for testing purposes, and the results of the experimental evaluations are provided and available on GitHub [9].
The application allows adaptive testing of different scenarios. It integrates three of the leading LLMs, Mistral:7b, Llama2:7b, and Orca2:7b, which do not require significant computational resources. The selection of the Mistral:7b, Llama2:7b, and Orca2:7b models is driven by an approach aimed at balancing performance and affordability. The selected models were determined due to their respective volume parameters that allow installation and operation in mid-range configurations. Given the appropriate computational resources, without further refinement, the PaSSER application allows the use of arbitrary open-source LLMs with more parameters.
A set of standard NLP metrics—METEOR, ROUGE, BLEU, Laplace and Lidstone’s perplexity, cosine similarity, Pearson correlation coefficient, and F1 score—was selected for a thorough evaluation of the models’ performance.
In this paper, RAG is viewed as a technology rather than a mere method. This distinction is due to the paper’s emphasis on the applied, practical, and integrative aspects of RAG in the field of NLP.
The paper contributes to the field of RAG research in several areas:
- By implementing the PaSSER application, the study provides a practical framework that can be used and expanded upon in future RAG research.
- The paper illustrates the integration of RAG technology with blockchain, enhancing data security and verifiability, which could inspire further exploration into the secure and transparent application of RAG systems.
- By comparing different LLMs within the same RAG framework, the paper provides insights into the relative strengths and capabilities of the models, contributing knowledge on model selection in RAG contexts.
- The focus on applying and testing within the domain of smart agriculture adds to the understanding of how RAG technology can be tailored and utilized in specific fields, expanding the scope of its application and relevance.
- The use of open-source technologies in PaSSER development allows the users to review and trust the application’s underlying mechanisms. More so, it enables collaboration, provides flexibility to adapt to specific needs or research goals, reduces development costs, facilitates scientific accuracy by enabling exact replication of research setups, and serves as a resource for learning about RAG technology and LLMs in practical scenarios.
The paper is organized as follows: Section 2 provides an overview of the development, implementation, and functionalities of the PaSSER Web App; Section 3 discusses selected standard NLP metrics used to measure RAG performance; Section 4 presents the results of tests on the models; Section 5, the limitations and influencing factors highlighted during the testing are discussed; and Section 6 summarizes the results and future directions for development.
2. Web Application Development and Implementation
This section describes the development, implementation, and features of the PaSSER Web App, which henceforward will be referred to as the PaSSER App.
The PaSSER App is a complementary project to the Smart crop production data exchange (SCPDx) platform, described in detail in [10,11]. The platform aims to support the integration of exchanging information and data acquired or generated as a result of the use of different technologies in smart agriculture. An underlying blockchain and distributed file system, eosio blockchain and InterPlanetary file system (IPFS), were selected [12]. The networks were deployed as private, permissionless. Later, in 2022, due to the hard fork, eosio blockchain was renamed to Antelope.io [13], which forced the migration of the blockchain network. The development of the SCPDx platform was preceded by a number of studies related to the choice of blockchain platform [14], blockchain-enabled supply-chain modelling for a smart crop production framework [15], and blockchain oracles integration [16].
The framework outlined in Figure 1 represents the PaSSER App’s core infrastructure, the server side, the application itself, and the integration with the blockchain and IPFS of the SCPDx platform infrastructure.
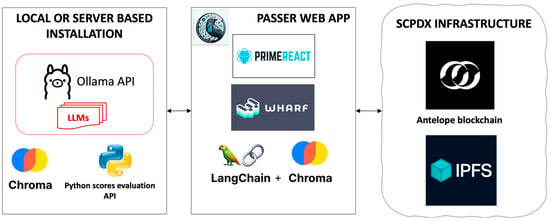
Figure 1.
PaSSER App framework.
There are different ways and techniques to work with LLMs and the RAG technology (Python scripts, desktop or web apps), but from a user’s perspective, it is most convenient to use a web interface as it is independent of software platforms, where access to external resources is implemented through APIs. This is why the PaSSER App was developed as a web application.
The PaSSER App communicates with Ollama [17], ChromaDB [18], Python scripts, Antelope blockchain, and IPFS through their respective APIs. Currently, the IPFS network is not utilized within the framework; however, future enhancements aim to incorporate it to enable storage and content distribution, which will support the fine-tuning processes of LLMs.
The PaSSER App is developed in JavaScript, leveraging the PrimeReact library [19] for its user interface components. To facilitate interaction with the Antelope blockchain network, it employs the WharfKit library [20]. The LangChain library [21] is integrated for engagement with RAG and LLMs. The application is hosted on an Apache web server, enabling communication between the PaSSER App, the LLMs, and the SCPDx infrastructure.
The server component of the PaSSER App includes a vector database, LLM API, and a score evaluation API. Ollama’s API supports different operating systems (UBUNTU, Windows, and macOS) and is used as an interface with different LLMs. This API grants users the flexibility to manage and interact with different open-source LLMs. Specifically, Ollama is deployed on an Ubuntu server equipped with 128 GB RAM, not utilizing a GPU, and also configured locally on a Mac Mini M1 with 16 GB RAM and a 10-core GPU.
ChromaDB is used to work with vector databases. ChromaDB is an open-source vector database for applications that utilize large language models (LLMs). It supports multiple programming languages such as Python, JavaScript, Ruby, Java, Go, and others. The database is licensed under the Apache 2.0 license. ChromaDB architecture is suited for applications that require semantic search capabilities. An embedding refers to the transformation of text, images, or audio into a vector of numbers, which represents the essence of the content in a way that can be processed and understood by machine learning models. In this implementation, ChromaDB was installed on a macOS-based server and locally on a Mac Mini M1 16 GB RAM 10 GPU.
Two Python scripts are developed: one for computing various evaluation metrics using libraries such as NLTK [22], torch [23], numpy [24], rouge [25], transformers [26], and scipy [27], and the other for logging model performance data, both using the Pyntelope library [28] for blockchain interactions. These scripts are operational on an Ubuntu server and are accessible via GitHub [9], facilitating the analysis and the recording of performance metrics within a blockchain framework to ensure data integrity and reproducibility of results.
2.1. LLMs Integration
In this implementation of PaSSER, Mistral:7b, Llama2:7b, and Orca2:7b models were selected. These models have the same volume parameters and are suitable to be installed and used on hardware configurations with medium computational capacity, while giving good enough results. A brief description of the models is presented below.
Mistral:7b “https://mistral.ai/news/announcing-mistral-7b/ (accessed on 23 March 2024)” is a language model developed by Mistral AI with a capacity of 7.3 billion parameters. It is available under the Apache 2.0 license, so it can be used without restrictions. The model can be downloaded and used anywhere, including locally, and deployed on any cloud (AWS/GCP/Azure) using the LLM inference server and SkyPilot.
It is structured to process language data, facilitating a wide range of text-based applications. This model incorporates specific attention mechanisms, namely grouped-query attention (GQA) and sliding window attention (SWA), aimed at optimizing the processing speed and managing longer text inputs. These technological choices are intended to improve the model’s performance while managing computational resources effectively [29,30,31].
Llama2:7b “https://llama.meta.com/llama2/ (accessed on 23 March 2024)” is a series of large language models developed by Meta, offering variations in size from 7 billion to 70 billion parameters. The 7 billion parameter version, Llama 2:7b, is part of this collection and is designed for a broad range of text-based tasks, from generative text models to more specific applications like chatbots. The architecture of Llama 2 models is auto-regressive, utilizing an optimized transformer structure. These models have been pre-trained on a mix of publicly available online data and can be fine-tuned for specific applications. They employ an auto-regressive language model framework and have been optimized for various natural language processing tasks, including chat and dialogue scenarios through supervised fine-tuning (SFT) and reinforcement learning with human feedback (RLHF) [32].
Llama2:7b models have been trained on significant computational resources and have a considerable carbon footprint, which Meta has committed to offsetting as part of their sustainability program. The 7b model specifically consumed 184,320 GPU hours and emitted an estimated 31.22 tCO2eq during its training, with all emissions directly offset. These models are intended for both commercial and research purposes, and while they have been primarily tested in English, they carry the potential for a broad array of applications. Meta has provided a custom commercial license for Llama 2, and details on accessing this license can be found on their website.
Orca2:7b, Orca 2 [33], developed by Microsoft, is a fine-tuned version of the Llama 2 model with two versions: one with 7 billion and the other with 13 billion parameters. It focuses on improving the reasoning abilities of smaller language models through enhanced training methods. By employing high-quality synthetic data for training, Orca 2 is designed to master various reasoning techniques such as step-by-step processing and recall-then-generate strategies. This synthetic training data is crafted to guide the model in adopting different solution strategies appropriate for varied tasks, aiming to optimize the model’s problem-solving approach.
The model is a result of research aimed at leveraging the advancements in large language models to boost the performance of smaller models, making them more efficient and versatile in handling tasks that require complex reasoning. The initiative behind Orca 2 is to provide a resource for research into the development, evaluation, and alignment of language models, particularly focusing on smaller models that can perform efficiently across a range of tasks.
Orca 2 is available for public use and research, underscoring Microsoft’s commitment to advancing the field of AI and language model technology. It represents an effort to explore how smaller models can be enhanced to approach a variety of tasks more effectively without the extensive computational and environmental costs associated with larger models.
2.2. PaSSER App Functionalities
The site map for the PaSSER App is depicted in Figure 2, detailing its core features. Figure 2 provides a structured flowchart of the PaSSER App’s user interface, mapping out the navigation pathways for various functionalities, such as the creation and management of a vector store, chat interactions, testing protocols, configuration settings, database management, and user authentication. Each section outlines the sequence of user actions and choices, from inputting data to exporting test results, configuring system settings, and maintaining the database. These include user authentication (login), system configuration (configuration setup), creation and management of vector stores from various sources (text, PDF files, and websites), and functionalities for engaging with the stored data through Q&A chat and RAG Q&A chat based on the established vector stores. Additionally, a testing module is outlined to evaluate the application’s functionalities and performance.
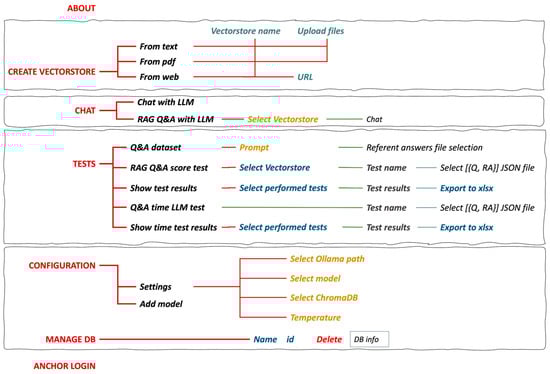
Figure 2.
PaSSER site map.
The ‘Create vectorstore’ feature, as depicted in Figure 3, outlines the process of converting raw textual data into a structured, queryable vector space using LangChain. This transformation of NLP and vector embedding techniques makes it possible to convert text into a format convenient for vector operations. Users can source textual data from text files, PDFs, and websites. The outlined procedure for vectorstore creation is standardized across these data types, ensuring consistency in processing and storage. At the current phase, automatic retrieval of information from websites (scrapping) is considered impractical due to the necessity for in-depth analysis of website structures and the requirement for extensive manual intervention to adequately structure the retrieved text. This process involves understanding varied and complex web layouts and imposing a tailored approach to effectively extract and organize data.
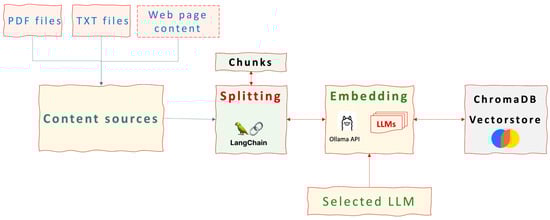
Figure 3.
Vectorstore construction workflow.
The process for creating a vectorstore involves the following steps, which are common to all three source types:
- Cleaning and standardizing text data. This is achieved by removing unnecessary characters (punctuation and special characters). Converting the text to a uniform size (usually lower case). Separating the text into individual words or tokens. In the implementation considered here, the text is divided into chunks with different overlaps.
- Vector embedding. The goal is to convert tokens (text tokens) into numeric vectors. This is achieved by using pre-trained word embedding models from selected LLMs (in this case, Misrtal:7b, Llama2:7b, and Orca2:7b). These models map words or phrases to high-dimensional vectors. Each word or phrase in the text is transformed into a vector that represents its semantic meaning based on the context in which it appears.
- Aggregating embeddings for larger text units to represent whole sentences or documents as vectors. It can be achieved by simple aggregation methods (averaging the vectors of all words in a sentence or document) or by using sentence transformers or document embedding techniques that take into account the more consistent and contextual nature of words. Here, transformers are used, which are taken from the selected LLMs.
- Create a vectorstore to store the vector representations in a structured format. The data structures used are optimized for operations with high-dimensional vectors. ChromaDB is used for the vectorstore.
Figure 4 defines the PaSSER App’s mechanisms for processing user queries and generating responses. Figure 4a represents a general Q&A chat workflow with direct input without the augmented context provided by a vectorstore. The corresponding LLM processes the query, formulates a response, and concurrently provides system performance data, including metrics such as total load and evaluation timeframes. Additionally, a numerical array captures the contextual backdrop of the query and the response, drawn from previous dialogue or related data, which the LLM utilizes similar to short-term memory to ensure response relevance and coherence. While the capacity of this memory is limited and not the focus of the current study, it is pivotal in refining responses based on specific contextual elements such as names and dates. The App enables saving this context for continued dialogue and offers features for initiating new conversations by purging the existing context.
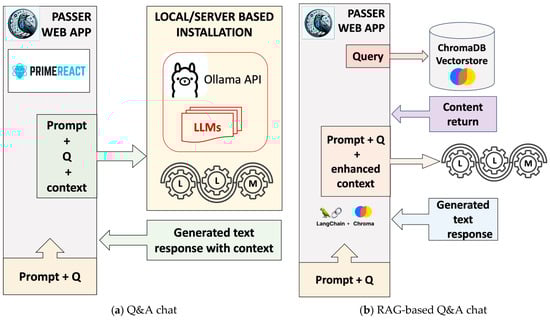
Figure 4.
Chat types workflow.
Figure 4b illustrates the workflow of a Q&A chat using the RAG technique, which employs a pre-built vectorstore for data retrieval and response generation. The ‘RAG Q&A chat’ feature facilitates interaction with an existing vectorstore. Users commence the chat by entering a query, triggering the LangChain library to fetch related data from the chosen vectorstore. This data informs the subsequent query to the LLM, integrating the original question, any prompts, and a context enriched by the vectorstore’s information. The LLM then generates a response. Within the app, a dedicated memory buffer recalls history, which the LLM utilizes as a transient context to ensure consistent and logical responses. The limited capacity of this memory buffer and its impact on response quality is acknowledged, though not extensively explored in this study. In the ‘RAG Q&A chat’, context-specific details like names and dates are crucial for enhancing the relevance of responses.
The ‘Tests’ feature is designed to streamline the testing of various LLMs within a specific knowledge domain. It involves the following steps:
- Selection of a specific knowledge base in a specific domain.
With ‘Create vectorstore’, the knowledge base is processed and saved in the vector database. In order to evaluate the performance of different LLMs for generating RAG answers on a specific domain, it is necessary to prepare a sufficiently large list of questions and reference answers. Such a list can be prepared entirely manually by experts in a specific domain. However, this is a slow and time-consuming process. Another widely used approach is to generate relevant questions based on reference answers given by a selected LLM (i.e., creating respective datasets). PaSSER allows the implementation of the second approach.
- 2.
- To create a reference dataset for a specific domain, a collection of answers related to the selected domain is gathered. Each response contains key information related to potential queries in that area. These answers are then saved in a text file format.
- 3.
- A selected LLM is deployed to systematically generate a series of questions corresponding to each predefined reference answer. This operation facilitates the creation of a structured dataset comprising pairs of questions and their corresponding answers. Subsequently, this dataset is saved in the JSON file format.
- 4.
- The finalized dataset is uploaded to the PaSSER App, initiating an automated sequence of response generation for each query within the target domain. Following that, each generated response is forwarded to a dedicated Python backend script. This script is tasked with assessing the responses based on predefined metrics and comparing them to the established reference answers. The outcomes of this evaluation are then stored on the blockchain, ensuring a transparent and immutable ledger of the model’s performance metrics.
To facilitate this process, a smart contract ‘llmtest’ has been created, managing the interaction with the blockchain and providing a structured and secure method for storing and managing the assessment results derived from the LLM performance tests.
The provided pseudocode outlines the structure ‘tests’ and its methods within a blockchain environment, which were chosen to store test-related entries. It includes identifiers (id, userid, and testid), a timestamp (created_at), numerical results (results array), and descriptive text (description). It establishes id as the primary key for indexing, with additional indices based on created_at, userid, and testid to facilitate data retrieval and sorting by these attributes. This structure organizes and accesses test records within the blockchain.
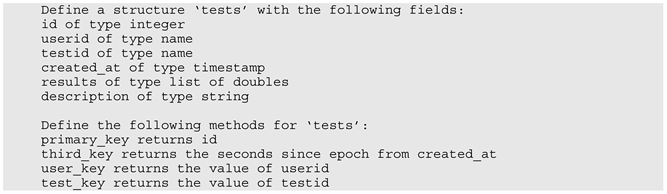
The pseudocode below defines an eosio::multi_index table ‘tests_table’ for a blockchain, which facilitates the storage and indexing of data. It specifies four indices: a primary index based on id and secondary indices using created_at, userid, and testid attributes for enhanced query capabilities. These indices optimize data retrieval operations, allowing for efficient access based on different key attributes like timestamp, user, and test identifiers, significantly enhancing the database’s functionality within the blockchain environment.
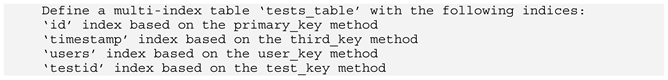
The provided pseudocode defines an EOSIO smart contract action named add_test, which allows adding a new record to the tests_table. It accepts the creator’s name, test ID, description, and an array of results as parameters. The action assigns a unique ID to the record, stores the current timestamp, and then inserts a new entry into the table using these details. This action helps in dynamically updating the blockchain state with new test information, ensuring that each entry is time-stamped and linked to its creator.
The pseudocodes provided above and in Section 3 are generated with GitHub Copilot upon the actual source code available at “https://github.com/features/copilot (accessed on 1 April 2024)”.
- 5.
- The results from the blockchain are retrieved for further processing and analysis.
To facilitate the execution of these procedures, the interface is structured into three specific features: ‘Q&A dataset’ for managing question and answer datasets, ‘RAG Q&A score test’ for evaluating the performance of RAG utilizing datasets, and ‘Show test results’ for displaying the results of the tests. Each submenu is designed to streamline the respective aspect of the workflow, ensuring a coherent and efficient user experience throughout the process of dataset management, performance evaluation, and result visualization.
Within the ‘Q&A dataset’, the user is guided to employ a specific prompt, aiming to instruct the LLM to generate questions that align closely with the provided reference answers, as described in step 2. This operation initiates the creation of a comprehensive dataset, subsequently organizing and storing this information within a JSON file for future accessibility and analysis. This approach ensures the generation of relevant and accurate questions, thereby enhancing the dataset’s utility for follow-up evaluation processes.
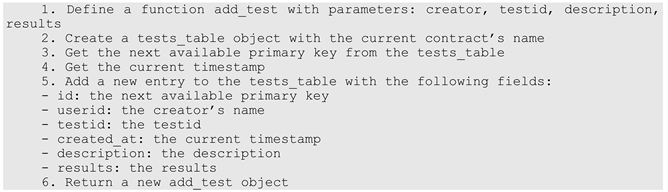
The ‘RAG Q&A score test’ is designed to streamline the evaluation of different LLMs’ performances using the RAG, as indicated in Figure 5. This evaluation process involves importing a JSON-formatted dataset and linking it with an established vectorstore relevant to the selected domain. The automation embedded within this menu facilitates a methodical assessment of the LLMs, leveraging domain-specific knowledge embedded within the vectorstore.
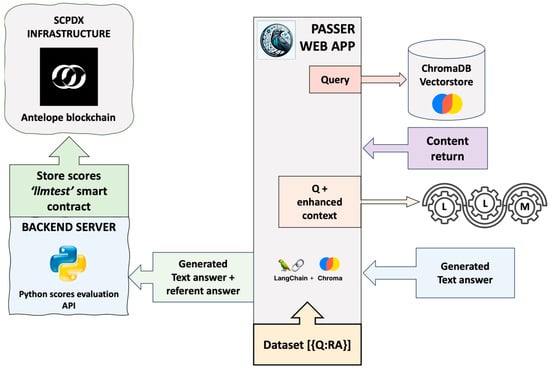
Figure 5.
Workflow diagram for RAG LLM query processing and score storage.
Vectorstores, once created using a specific LLM’s transformers, require the consistent application of the same LLM model during the RAG process. Within this automated framework, each question from the dataset is processed by the LLM to produce a corresponding answer. Then, both the generated answers and their associated reference answers are evaluated by a backend Python script. This script calculates performance metrics, records these metrics on the blockchain under a specified test series, and iterates this procedure for every item within the dataset.
The ‘Show test results’ feature is designed to access and display the evaluation outcomes from various tests as recorded on the blockchain, presenting them in an organized tabular format. This feature facilitates the visualization of score results for individual answers across different test series and also provides the functionality to export this data into an xlsx file format. The export feature makes it much easier for users to understand and study the data, helping with better evaluations and insights.
The ‘Q&A Time LLM Test’ feature evaluates model performance across various hardware setups using JSON-formatted question–answer pairs. Upon submission, the PaSSER App prompts the selected model for responses, generating detailed performance metrics like evaluation and load times, among others. These metrics are packed in a query to a backend Python script, which records the data on the blockchain via the ‘addtimetest’ action, interacting with the ‘llmtest’ smart contract to ensure performance tracking and data integrity.
The ‘Show time test results’ makes it easy to access and view LLM performance data, organized by test series, from the blockchain. When displayed in a structured table, these metrics can be examined for comprehensive performance assessment. There is an option to export this data into an xlsx file, thereby improving the process for further in-depth examination and analysis.
Authentication within the system (‘Login’) is provided through the Anchor wallet, which is compliant with the security protocols of the SCPDx platform. This process, described in detail in [34], provides user authentication by ensuring that testing activities are securely associated with the correct user credentials. This strengthens the integrity and accountability of the testing process within the platform ecosystem.
The ‘Configuration’ feature is divided into ‘Settings’ and ‘Add Model’.
The ‘Settings’ is designed for configuring connectivity to the Ollama API and ChromaDB API, using IP addresses specified in the application’s configuration file. It also allows users to select an LLM that is currently installed in Ollama. A key feature here is the ability to adjust the ‘temperature’ parameter, which ranges from 0 to 1, to fine-tune the balance between creativity and predictability in the output generated by the LLM. Setting a higher temperature value (>0.8) increases randomness, whereas a lower value enhances determinism, with the default set at 0.2.
The ‘Add Model’ enables adding and removing LLMs in the Ollama API, allowing dynamic model management. This feature is useful when testing different models, ensuring optimal use of computational resources.
The ‘Manage DB’ feature displays a comprehensive list of vectorstores available in ChromaDB, offering functionalities to inspect or interact with specific dataset records. This feature enables users to view details within a record’s JSON response. It provides the option to delete any vectorstore that is no longer needed, enabling efficient database management by removing obsolete or redundant data, thereby optimizing storage utilization.
A block diagram representation of the PaSSER App’s operational logic that illustrates the interactions between the various components is provided in Figure 6.
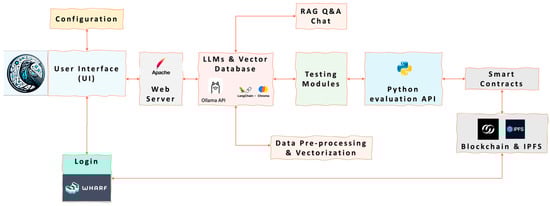
Figure 6.
PaSSER App block diagram.
The UI (web application) interacts with users for configuration, authentication, and operation initiation. It utilizes JavaScript and the PrimeReact library for UI components. Enables the user interactions for authentication (Login), configuration, and operations with the LLMs and blockchain.
The web server (Apache) hosts the web application, facilitating communication between the user interface and backend components.
The LLM API and Vector Database utilize the Ollama API for the management of different LLMs. It incorporates ChromaDB for storage and retrieval of vectorized data.
Data pre-processing and vectorization standardize and convert data from various sources (e.g., PDFs, websites) into numerical vectors for LLM processing using pre-trained models of selected LLMs.
The RAG Q&A chat facilitates query responses by integrating external data retrieval with LLM processing. It enables querying the LLMs with augmented information retrieval from the vector database for generating responses.
Testing modules utilize built-in testing modules to assess LLM performance across metrics, with results recorded on the blockchain.
The Python evaluation API calculates NLP performance metrics and interacts with the blockchain for recording the testing results via smart contracts.
Smart contracts manage test results recording on the blockchain.
3. Evaluation Metrics
The evaluation of RAG models within the PaSSER App was performed using a set of 13 standard NLP metrics. These metrics evaluated various dimensions of model performance, including the quality of text generation and summarization, semantic similarity, predictive accuracy, and consistency of generated content compared to reference or expected results. Metrics included METEOR, ROUGE (with ROUGE-1 and ROUGE-L variants), BLEU, perplexity (using Laplace and Lidstone smoothing techniques), cosine similarity, Pearson correlation coefficient, and F1 score.
The PaSSER App ran two main tests to assess LLM: “LLM Q&A Time Test” and “RAG Q&A Assessment Test”. The latter specifically applied the selected metrics to a created dataset of question–answer pairs for the smart agriculture domain. The test aimed to determine which model provides the most accurate and contextually relevant answers within the RAG framework and the capabilities of each model in the context of text generation and summarization tasks.
The ‘RAG Q&A chat’ was assessed using a set of selected metrics: METEOR, ROUGE, PPL (perplexity), cosine similarity, Pearson correlation coefficient, and F1 score [35].
An automated evaluation process was developed to apply these metrics to the answers generated using RAG. The process compared generated answers against the reference answers in the dataset, calculating scores for each metric.
All calculations were implemented in backEnd.py script in Python, available at: “https://github.com/scpdxtest/PaSSER/blob/main/scripts/backEnd.py (accessed on 1 April 2024)”.
The following is a brief explanation of the purpose of the metrics used, the simplified calculation formulas, and the application in the context of RAG.
3.1. METEOR (Metric for Evaluation of Translation with Explicit Ordering)
METEOR score is a metric used to assess the quality of machine-generated text by comparing it to one or multiple reference texts [36]. The calculating involves several steps:
- –
- Word alignment between candidate and reference translations based on exact, stem, synonym, and paraphrase matches, with the constraint that each word in the candidate and reference sentences can only be used once and aims to maximize the overall match between the candidate and references.
- –
- Calculation of Number of matched words in the candidate/Number of words in the candidate and Number of matched words in the candidate/Number of words in the reference:
Number of unigrams in the candidate translation that are matched with the reference translation.
Total number of unigrams in the candidate translation.
Total number of unigrams in the reference translation(s).
- –
- Calculation of Penalty for chunkiness, which accounts for the arrangement and fluency of the matched chunks (c) = Number of chunks of contiguous matched unigrams in the candidate translation and (m):
- –
- The final score is computed using the harmonic mean of Precision and Recall, adjusted by the penalty factor:
The implementation of the calculations of Equations (1)–(3) is conducted with the nltk library, single_meteor_score function, line 58 in Python script.
This pseudocode describes the process of splitting two texts into words and calculating the METEOR score between them.

In the context of RAG models, the METEOR score can be used to evaluate the quality of the generated responses. A high METEOR score indicates that the generated response closely matches the reference text, suggesting that the model is accurately retrieving and generating responses. Conversely, a low METEOR score could indicate areas for improvement in the model’s performance.
3.2. ROUGE (Recall-Oriented Understudy for Gisting Evaluation)
ROUGE [37] is a set of metrics used for evaluating automatic summarization and machine translation. It works by comparing an automatically produced summary or translation against one or more reference summaries (usually human-generated).
ROUGE has several variants: ROUGE-N, ROUGE-L, and ROUGE-W.
ROUGE-N focuses on the overlap of n-grams (sequences of n words) between the system-generated summary and the reference summaries. It is computed in terms of recall, precision, and F1 score:
- –
- is the ratio of the number of overlapping n-grams between the system summary and the reference summaries to the total number of n-grams in the reference summaries:
- –
- is the ratio of the number of overlapping n-grams in the system summary to the total number of n-grams in the system summary itself:
- –
- is the harmonic mean of precision and recall:
ROUGE-L focuses on the longest common subsequence (LCS) between the generated summary and the reference summaries. The LCS is the longest sequence of words that appears in both texts in the same order, though not necessarily consecutively. The parameters for ROUGE-L include:
- –
- is the length of the LCS divided by the total number of words in the reference summary. This measures the extent to which the generated summary captures the content of the reference summaries:
- –
- is the length of the LCS divided by the total number of words in the generated summary. This assesses the extent to which the words in the generated summary appear in the reference summaries:
- –
- is a harmonic mean of the LCS-based precision and recall:
ROUGE-W is an extension of ROUGE-L with a weighting scheme that assigns more importance to longer sequences of matching words. In this application, ROUGE-W is not applied.
The implementation of the calculations of Equations (4)–(9) is conducted with the rouge library, rouge.get_scores function, line 65 in Python script.
This pseudocode describes the process of initializing a ROUGE object and calculating the ROUGE scores between two texts.

The choice between a preference for precision, recall, or F1 scoring depends on the specific goals of the summarization task, such as whether it is more important to capture as much information as possible (recall) or to ensure that what is captured is highly relevant (precision).
In the context of RAG models, ROUGE metric serves as a tool for assessing the quality of the generated text, especially in summary, question answering, and content-generation tasks.
3.3. BLEU (Bilingual Evaluation Understudy)
The BLEU [38] score is a metric used to assess the quality of machine-generated text by comparing it to one or multiple reference texts. It quantifies the resemblance by analysing the presence of shared n-grams (sequences of n consecutive words).
The metric employs a combination of modified precision scores for various n-gram lengths and incorporates a brevity penalty to account for the adequacy and fluency of the translation. Below are the simplified formulas for estimating BLEU.
For each n-gram length , BLEU computes a modified precision score. The modified precision for n-grams is calculated as follows:
where, is a count of each n-gram in the candidate translation clipped by its maximum count in any single reference translation.
The brevity penalty (BP) is a component of the BLEU score that ensures translations are not only accurate but also of appropriate length. The BP is defined as:
where, is the total length of the candidate translation, and is the effective reference corpus length, which is the sum of the lengths of the closest matching reference translations for each candidate sentence.
if the candidate translation length is greater than the reference length , indicating no penalty.
if is less than or equal to , indicating a penalty that increases as the candidate translation becomes shorter relative to the reference.
The overall BLEU score is calculated using the following formula:
where, is the maximum n-gram length (typically 4), and is the weight for each n-gram’s precision score, often set equally such that their sum is 1 (e.g., for ).
This formula aggregates the individual modified precision scores for n-grams of length 1 to , geometrically averaged and weighted by , then multiplied by the brevity penalty to yield the final BLEU score.
The implementation of the calculations of Equations (10)–(12) is conducted with the nltk library, sentence_bleu and SmoothingFunction functions, lines 74–79 in Python script.
This pseudocode describes the process of splitting two texts into words, creating a smoothing function, and calculating the BLEU score between them.

In the context of RAG models, the BLEU score can be used to evaluate the quality of the generated responses. A high BLEU score would indicate that the generated response closely matches the reference text, suggesting that the model is accurately retrieving and generating responses. A low BLEU score could indicate areas for improvement in the model’s performance.
3.4. Perplexity (PPL)
Perplexity (PPL) [39] is a measure used to evaluate the performance of probabilistic language models. The introduction of smoothing techniques, such as Laplace (add-one) smoothing and Lidstone smoothing [40], aims to address the issue of zero probabilities for unseen events, thereby enhancing the model’s ability to deal with sparse data. Below are the formulas for calculating perplexity.
- –
- PPL with Laplace Smoothing adjusts the probability estimation for each word by adding one to the count of each word in the training corpus, including unseen words. This method ensures that no word has a zero probability. The adjusted probability estimate with Laplace smoothing is calculated using the following formula:
The of a sequence of words is given by:
The implementation of the calculations of Equations (13) and (14) is conducted with the nltk library, lines 84–102, in Python script.
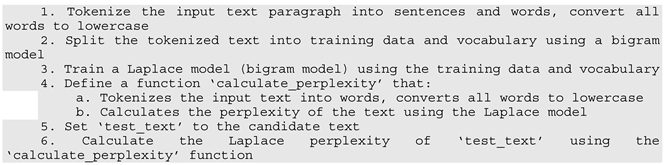
This pseudocode describes the process of tokenizing an input text paragraph, training a Laplace model (bigram model), and calculating the perplexity of a candidate text using the model.
- –
- PPL with Lidstone smoothing is a generalization of Laplace smoothing where instead of adding one to each count, a fraction (where ) is added. This allows for more flexibility compared to the fixed increment in Laplace smoothing. Adjusted Probability Estimate with Lidstone Smoothing:
The of a sequence of words is given by:
The implementation of the calculations of Equations (15) and (16) is conducted with the nltk library, lines 108–129, in Python script.
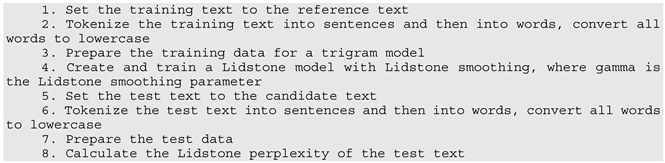
This pseudocode describes the process of tokenizing an input text paragraph, training a Lidstone model (trigram model), and calculating the perplexity of a candidate text using the model.
In both formulas, the goal is to compute how well the model predicts the test set . The lower perplexity indicates that the model predicts the sequence more accurately. The choice between Laplace and Lidstone smoothing depends on the specific requirements of the model and dataset, as well as empirical validation.
In the context of RAG models, both metrics are useful for assessing the quality and ability of models to deal with a variety of language and information. These metrics indicate how well they can generate contextually informed, linguistically coherent, and versatile text.
3.5. Cosine Similarity
Cosine similarity [41] is a measure of vector similarity and can be used to determine the distance of embeddings between the chunk and the query. It is a distance metric that approaches 1 when the question and chunk are similar and becomes 0 when they are different. The mathematics formulation of the metric is:
where, is the dot product of vectors and , and are the Euclidean norms (magnitudes) of vectors and , calculated with and , respectively, and is the dimensionality of the vectors, assuming and of the same dimension.
means the vectors are identical in orientation.
means the vectors are orthogonal (independent) to each other.
means the vectors are diametrically opposed.
The implementation of the calculation of Equation (17) is conducted with the transformers library, lines 133–164, in Python script.
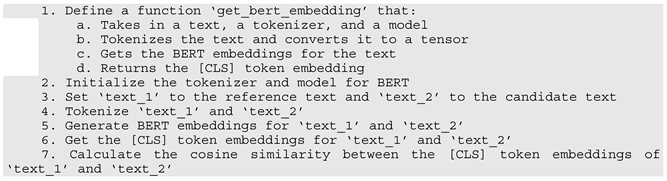
This pseudocode describes the process of tokenizing two texts, generating BERT embeddings for them, and calculating the cosine similarity between the embeddings. The [CLS] token is used as the aggregate representation for classification tasks.
In the RAG models, cosine similarity ensures that retrieved documents align closely with user queries, capturing relationships between the meaning of a user. This is particularly important in RAG models, as they leverage a retriever to find context documents. The use of cosine similarity between embeddings ensures that these retrieved documents align closely with user queries.
3.6. Pearson Correlation
The Pearson correlation coefficient ® is a statistical measure that calculates the strength and direction of the linear relationship between two continuous variables.
The formula for the Pearson correlation coefficient is as follows:
where, is the number of data points, and are the individual data points, and and are the means of the X and Y data sets, respectively.
The implementation of the calculation of Equation (18) is conducted with the transformers and script libraries, lines 167–178, in Python script.
This pseudocode describes the process of tokenizing two texts, generating BERT embeddings for them, and calculating the Pearson correlation coefficient between the embeddings. The mean of the last hidden state of the embeddings is used as the aggregate representation.
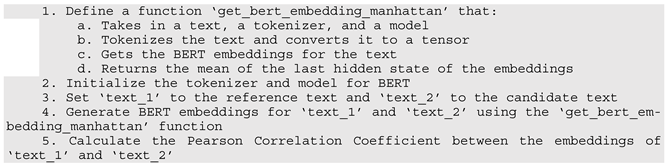
In the context of evaluating RAG models, the Pearson correlation coefficient can be used to measure how well the model’s predictions align with actual outcomes. A coefficient close to +1 indicates a strong positive linear relationship, meaning as one variable increases, the other also increases. A coefficient close to -1 indicates a strong negative linear relationship, meaning as one variable increases, the other decreases. A coefficient near 0 suggests no linear correlation between variables. In the evaluation of RAG models, a high Pearson correlation coefficient could indicate that the model is accurately retrieving and generating responses, while a low coefficient could suggest areas for improvement.
3.7. F1 Score
In the context of evaluating the performance of RAG models, the F1 score [42] is used for quantitatively assessing how well the models perform in tasks for generating or retrieving textual information (question answering, document summarization, or conversational AI). The evaluation often hinges on their ability to accurately and relevantly generate text that aligns with reference or ground truth data.
The F1 score is the harmonic mean of precision and recall. Precision assesses the portion of relevant information in the responses generated by the RAG model. High precision indicates that most of the content generated by the model is relevant to the query or task at hand, minimizing irrelevant or incorrect information. Recall (or sensitivity) evaluates the model’s ability to capture all relevant information from the knowledge base that should be included in the response. High recall signifies that the model successfully retrieves and incorporates a significant portion of the pertinent information available in the context.
The formula for calculating is:
Precision and Recall are defined as:
where, (True Positives) is the count of correctly retrieved relevant documents, (False Positives) is the count of incorrectly retrieved documents (i.e., the documents that were retrieved but are not relevant), and (False Negatives) is the count of relevant documents that were not retrieved.
The implementation of the calculations of Equations (19) and (20) occurs on lines 185–204 in Python script.
This pseudocode describes the process of tokenizing two texts, counting the common tokens between them, and calculating the F1 score.
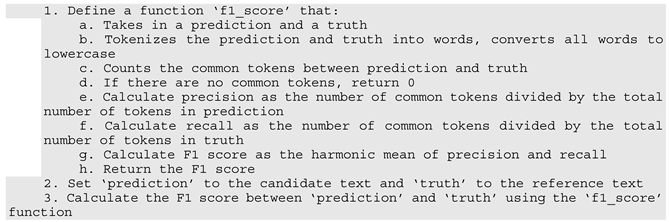
For tasks of question answering, the F1 score can be used to measure how well the generated answers match the expected answers, considering both the presence of correct information (high precision) and the completeness of the answer (high recall).
For tasks of document summarization, the F1 score might evaluate the overlap between the key phrases or sentences in the model-generated summaries and those in the reference summaries, reflecting the model’s efficiency in capturing essential information (recall) and avoiding extraneous content (precision).
For‚ conversational AI applications, the F1 score could assess the relevance and completeness of the model’s responses in dialogue, ensuring that responses are both pertinent to the conversation context and comprehensive in addressing users’ intents or questions.
4. Testing
The aim of the tests presented in this section is to evaluate the performance of the Misrtal:7b, Llama2:7b, and Orca2:7b models installed on two different hardware configurations and to assess the performance of these models in generating answers using RAG on the selected knowledge domain, smart agriculture.
The knowledge base used was retrieved from EU Regulation 2018/848 “https://eur-lex.europa.eu/legal-content/EN/TXT/PDF/?uri=CELEX:32018R0848 (accessed on 1 April 2024)” and Climate-smart agriculture Sourcebook “https://www.fao.org/3/i3325e/i3325e.pdf (accessed on 1 April 2024)”. These documents were pre-processed manually and vectorized using the transformers of Misrtal:7b, Llama2:7b, and Orca2:7b LLMs under the following parameters: chunk size—500, overlapping—100, temperature—0.2.
The dataset containing reference answers specific to smart agriculture was compiled and stored as a text file. The Mistral:7b model was deployed to formulate questions based on these reference answers. Initial trials indicated that Mistral:7b excelled in generating questions with high relevance within this particular domain. To initiate the question generation process, the following prompt was employed: “Imagine you are a virtual assistant trained in the detailed regulations of organic agriculture. Your task involves creating precise questions for a specific regulatory statement provided to you below. The statement comes directly from the regulations, and your challenge is to reverse-engineer the question that this statement answers. Your formulated question should be concise, clear, and directly related to the content of the statement. Aim to craft your question without implying the statement itself as the answer, and, where relevant, gear your question toward eliciting specific events, facts, or regulations.”
For testing purposes, two Ollama APIs installed on two different hardware configurations were used:
- -
- Intel Xeon, 32 Cores, 0 GPU, 128 GB RAM, Ubuntu 22.04 OS.
- -
- Mac Mini M1, 8 CPU, 10 GPU, 16 GB RAM, OSX 13.4.
In the PASSER App, the installed Ollama APIs that were to be used could be selected. This is set in the configuration->settings menu.
The two following tests were designed: testing via the ‘Q&A Time LLM Test’ and the ‘RAG Q&A score test’.
The ‘Q&A Time LLM Test’ evaluated LLM performance across two hardware configurations using a dataset of 446 questions for each model, focusing on seven specific metrics (evaluation time, evaluation count, load duration time, prompt evaluation count, prompt evaluation duration, total duration, and tokens per second). These metrics were integral for analyzing the efficiency and responsiveness of each model under different computational conditions. The collected data was stored on a blockchain, ensuring both transparency and traceability of the evaluation results.
The ‘RAG Q&A score test’ aimed to evaluate the performance of the models based on 13 metrics (METEOR, ROUGE-1, ROUGE-l, BLEU, perplexity, cosine similarity, Pearson correlation, and F1) applied to each of the 446 questions—reference answers—for which RAG obtained answers.
The ‘RAG Q&A score test’ evaluated the performance of different models in a chat environment with enhanced RAG Q&A, identifying differences and patterns in their ability to respond to queries. Its goal was to determine the model that best provided accurate, context-aware responses that defined terms and summarized specific content. This evaluation can be used to select a model that ensures the delivery of accurate and relevant information in the context of the specific knowledge provided.
The performance outcomes from the ‘Q&A Time LLM Test’ and ‘RAG Q&A score test’ for evaluating LLMs were stored on the blockchain via smart contracts. For analysis, this data was retrieved from the blockchain and stored in an xlsx file. This file was uploaded to GitHib “https://github.com/scpdxtest/PaSSER/blob/main/tests/TEST%20DATA_GENERAL%20FILE.xlsx (accessed on 1 April 2024)”.
In the upcoming section, the focus is solely on presenting and analysing the mean values derived from the test data. This approach eases the interpretation, enabling a summarized review of the core findings and trends across the conducted evaluations.
4.1. Q&A Time LLM Test Results
When using the ‘Q&A Chat’ feature, performance metrics are returned by the Ollama API along with each response. The metrics are reported in nanoseconds and converted to seconds for easier interpretation. They are used to evaluate the performance of different models under different hardware configurations.
Evaluation count is the number of individual evaluations performed by the model during a specific test. It helps to understand its capacity to process multiple prompts or tasks within a given timeframe, reflecting its productivity under varying workloads.
Load duration time is the time required for initializing and loading the language model into memory before it begins processing data. This metric is essential for assessing the start-up efficiency of the model, which can significantly impact user experience and operational latency in real-time applications.
Prompt evaluation count is the number of prompts the model evaluates within a specific test or operational period. It provides insights into the model’s interactive performance, especially relevant in scenarios where the model is expected to respond to user inputs or queries dynamically.
Prompt evaluation duration captures the time model used to evaluate a single prompt, from receiving the input to generating the output. It measures the model’s responsiveness and is particularly important for interactive applications where fast output is vital.
Total duration is the overall time for the entire evaluation process, incorporating all phases from initialization to the completion of the last prompt evaluation. This metric gives a complete view of the model’s operational efficiency over an entire test cycle.
Tokens per second quantifies the number of tokens (basic units of text, such as words or characters) the model can process per second. It is a key indicator of the model’s processing speed and computational throughput, reflecting its ability to handle large volumes of text data efficiently.
Figure 7 illustrates the performance metrics of the Mistral:7b on macOS and Ubuntu operating systems across the different indicators. The model demonstrates higher efficiency on macOS, as indicated by the shorter evaluation time, longer prompt evaluation count, and significantly higher tokens per second rate. Conversely, the model takes longer to process prompts on Ubuntu, as indicated by the extended duration of prompt evaluation, even though the operating system manages a greater number of prompt evaluations overall.
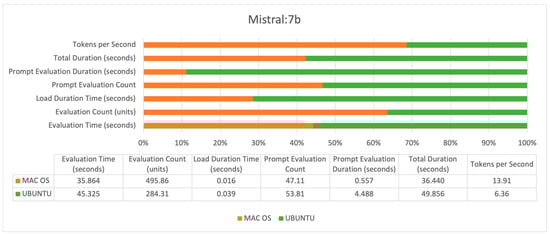
Figure 7.
A performance of Mistral:7b.
Figure 8 presents a comparison of the Llama2:7b performance. It reveals that MAC OS is the more efficient platform, processing a higher number of tokens per second and completing evaluations faster. Despite Ubuntu’s slightly higher prompt evaluation count, it shows longer prompt evaluation and total duration times.
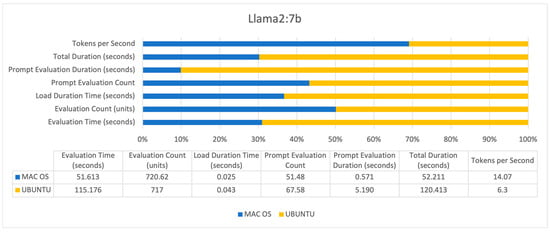
Figure 8.
A performance of Llama2:7b.
Figure 9 illustrates performance metrics for the Orca2:7b. MAC OS outperforms Ubuntu with faster evaluation times, shorter load durations, and notably higher tokens per second processing efficiency. While Ubuntu managed a higher prompt evaluation count, it lagged in prompt evaluation speed, as reflected in the longer prompt evaluation duration and extended total duration times.
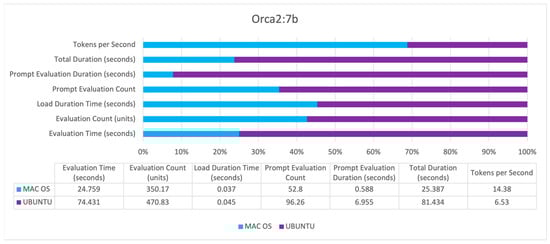
Figure 9.
A performance of Orca2:7b.
Across all models, several trends are evident (Figure 7, Figure 8 and Figure 9). UBUNTU generally shows longer evaluation times, indicating slower processing capabilities compared to MAC OS. Evaluation counts are relatively comparable, suggesting that the number of operations conducted within a given timeframe is similar across hardware configurations. Load duration times are consistently longer on UBUNTU, affecting readiness and response times negatively. UBUNTU tends to conduct more prompt evaluation count, but also takes significantly longer, which exposes efficiency issues. UBUNTU experiences longer total durations for all tasks, reinforcing the trend of slower overall performance. MAC OS demonstrates higher tokens per second across all models, indicating more efficient data processing capabilities.
The performance indicators (Table 1) suggest that across all models, the evaluation time on the Mac M1 system is significantly less than on the Ubuntu system with Xeon processors, indicating faster overall performance. In terms of tokens per second, the Mac M1 also performs better, suggesting it is more efficient at processing information regardless of having fewer CPU cores and less RAM.

Table 1.
Comparative performance metrics of Llama2:7b, Mistral:7b, and Orca2:7b LLMs on macOS M1 and Ubuntu Xeon Systems (w/o GPU).
Despite having a higher core count and more RAM, the evaluation time is longer, and the tokens per second rate are lower on the Ubuntu system. This suggests that the hardware advantages of the Xeon system are not translating into performance gains for these particular models. Notably, the Ubuntu system shows a higher prompt evaluation count for Orca2:7b, which might be leveraging the greater number of CPU cores to handle more prompts simultaneously.
Orca2:7b has the lowest evaluation time on the Mac M1 system, showcasing the most efficient utilization of that hardware. Llama2:7b shows a significant difference in performance between the two systems, indicating it may be more sensitive to hardware and operating system optimizations. Mistral:7b has a comparatively closer performance between the two systems, suggesting it may be more adaptable to different hardware configurations.
The table suggests that the Mac M1’s architecture provides a significant performance advantage for these language models over the Ubuntu system equipped with a Xeon processor. This could be due to several factors, including but not limited to the efficiency of the M1 chip, the optimization of the language models for the specific architectures, and the potential use of the M1’s GPU in processing.
4.2. RAG Q&A Score Test Results
In this section, the performance of the Mistral:7b, Llama2:7b, and Orca2:7b models is assessed through several key metrics: METEOR, ROUGE-1, ROUGE-L, BLEU, perplexity, cosine similarity, Pearson correlation coefficient, and F1 score. A summary of the average metrics is presented in Table 2.
Table 2.
A summary of performance metrics using RAG Q&A chat.
For a more straightforward interpretation of the results, the ranges of values of the different metrics are briefly described below.
The ideal METEOR score is 1. It indicates a perfect match between the machine-generated text and the reference translations, encompassing both semantic and syntactic accuracy. For ROUGE metrics (ROUGE-1 recall, precision, f-score, ROUGE-l recall, precision, f-score), the best possible value is 1. This value denotes a perfect overlap between the content generated by the model and the reference content, indicating high levels of relevance and precision in the captured information. The BLEU score’s maximum is also 1 (or 100 when expressed in percentage terms), representing an exact match between the machine’s output and the reference texts, reflecting high coherence and context accuracy. For perplexity, the lower the value, the better the model’s predictive performance. The best perplexity score would technically approach 1, indicating the model’s predictions are highly accurate with minimal uncertainty. The cosine similarity of 1 signifies maximum similarity between the generated output and the reference. A Pearson correlation of 1 is ideal, signifying a perfect positive linear relationship between the model’s outputs and the reference data, indicating high reliability of the model’s performance. An F1 score reaches its best at 1, representing perfect precision and recall, meaning the model has no false positives or false negatives in its output. For a better comparison of the models, Figure 10 is presented.
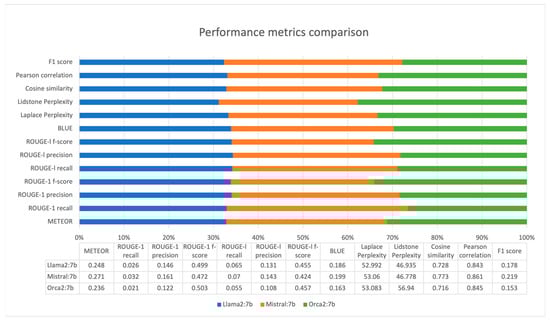
Figure 10.
A comparison of performance metrics.
The presented metrics provide a picture of the performance of the models on text generation and summarization tasks. The analysis for each metric is as follows.
METEOR evaluates the quality of translation by aligning the model output to reference translations when considering precision and recall. Mistral:7b scores highest, suggesting its translations or generated text are the most accurate.
ROUGE-1 recall measures the overlap of unigrams between the generated summary and the reference. A higher score indicates more content overlap. Mistral:7b leads, which implies it includes more of the reference content in its summaries or generated text.
ROUGE-1 precision (the unigram precision). Mistral:7b has the highest score, indicating that its content is more relevant and has fewer irrelevant inclusions.
ROUGE-1 F-score is the harmonic mean of precision and recall. Orca2:7b leads slightly, indicating a balanced trade-off between precision and recall in its content generation.
ROUGE-L recall measures the longest common subsequence and is good at evaluating sentence-level structure similarity. Mistral:7b scores the highest, showing it is better at capturing longer sequences from the reference text.
ROUGE-L precision. Mistral:7b again scores highest, indicating it includes longer, relevant sequences in its summaries or generated text without much irrelevant information.
ROUGE-L F-Score. Orca2:7b has a marginally higher score, suggesting a balance in precision and recall for longer content blocks.
BLEU assesses the quality of machine-generated translation. Mistral:7b outperforms the others, indicating its translations may be more coherent and contextually appropriate.
Laplace perplexity. For perplexity, a lower score is better as it indicates a model’s predictions are more certain. Llama2:7b has the lowest score, suggesting the best predictability under Laplace smoothing conditions.
Lidstone perplexity—Mistral:7b has the lowest score, indicating it is slightly more predictable under Lidstone smoothing conditions.
Cosine similarity measures the cosine of the angle between two vectors. A higher score indicates greater semantic similarity. Mistral:7b has the highest score, suggesting its generated text is most similar to the reference text in terms of meaning.
Pearson correlation measures the linear correlation between two variables. A score of 1 indicates perfect correlation. Mistral:7b has the highest score, showing its outputs have a stronger linear relationship with the reference data.
F1 score balances precision and recall. Mistral:7b has the highest F1 score, indicating the best balance between recall and precision in its outputs.
Based on the above analysis, the following summary can be concluded. For text generation and summarization, Mistral:7b appears to be the best-performing model in most metrics, particularly those related to semantic quality and relevance. Orca2:7b shows strength in balancing precision and recall, especially for longer content sequences. Llama2:7b demonstrates the best predictive capability under Laplace smoothing conditions, which may be beneficial in certain predictive text generation tasks. The selection of the best model would depend on the specific requirements of the text generation or summarization task.
4.3. Blockchain RAM Resource Evaluation
The integration of blockchain technologies to record test results aims to increase the confidence and transparency of the results obtained, support their traceability, and facilitate their documentation. This can also be implemented using classical databases (e.g., Mongo DB, Postgres, Maria DB, or others), but as the amount of data stored in the blockchain is relatively small (on average 1 kB per test), there is no obstacle to exploit the advantages of this technology.
In terms of blockchain performance, the platform used (Antelope) is characterized as one of the fastest—over 7000 transactions per second. Since the main time for running the tests is due to the generation of answers (with or without the use of RAG), it is multiple times longer than the time for recording the results in the blockchain (for example, about 1 min for generating an answer, and about 0.5 s for recording the results in the blockchain).
PaSSER App uses a private, permissionless blockchain network. Such a blockchain network can be installed by anyone with the required technical knowledge. Instructions for installing the Antelope blockchain can be found on GitHub at: “https://github.com/scpdxtest/PaSSER/blob/main/%23%20Installation%20Instructions.md (accessed on 1 April 2024)”. There are no plans to implement a public blockchain network in this project.
The blockchain (Antelope) must use a system token. The symbol (SYS), precision, and supply are set when the network is installed. All system resources (RAM, CPU, NET) are evaluated in SYS. Similar to other platforms (e.g., Bitcoin, Ethereum), to execute transactions and build blocks (to prevent denial of service attacks), Antelope charges a fee in SYS tokens.
The NET is used to measure the amount of data that can be sent per transaction as an average consumption in bytes over the last 3 days (72 h). It is consumed temporarily for each action/transaction.
The CPU limits the maximum execution time of a transaction and is measured as average consumption in microseconds, also for the last 3 days. It is also temporarily consumed when an action or transaction is sent. NET and CPU are together called bandwidth. In public networks, users can use the bandwidth resources if available, i.e., that are not mortgaged by other accounts. The price of mortgaged bandwidth (NET and CPU) resources varies, depending on how many SYS tokens are staked in total.
The RAM is the information that is accessible from application logic (order books, account balances). It limits the maximum space that can be occupied to store permanent data (in the block producers’ RAM). An account can exchange NET and CPU by mortgaging SYS tokens, but must buy RAM. RAM is not freed automatically. The only way to free up memory is to delete the data that is using the account (multi-index tables). Freed unused RAM can be sold and purchased at the market price, which is determined by the Bancor algorithm [43]. In detail, the entire RAM, CPU, NET evaluation procedure that applies here is described in [11].
In our case, the RAM price is extracted from the ‘rammarket’ table of the eosio system account by executing the cleos command from the command line with the appropriate parameters (date 23 March 2024, 14:05 h).
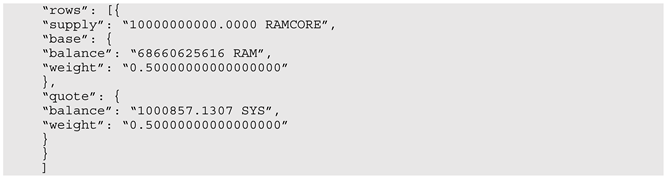
In order to apply the Bancor algorithm for RAM pricing to our private network, the following clarifications should be made. The Antelope blockchain network has a so-called RAM token. The PaSSER uses our private Antelope blockchain network, whose system token is SYS. In the context of the Bancor algorithm, RAM and SYS should be considered Smart Tokens. The Smart Token is a token that has one or more connectors with other tokens in the network. The connector, in this case, is a SYS token, and it establishes a relationship between SYS and RAM. Using the Bancor algorithm [43,44] could be presented as follows:
where: cb is for connector balance, Stos is for a Smart Token’s Outstanding Supply = base.balance, and STtv is for a Smart Token’s total value = Connector Balance = quote.balance.
The cost evaluation of RAM, CPU, and NET resources in SYS tokens during a test execution occurs as follows. The PaSSER App uses SYS tokens. The CPU price is measured in (SYS token/ms/Day) and is valid for a specific account on the network. The NET Price is measured in (SYS token/KiB/Day) and is valid for a specific account on the network.
This study only considers the cost of the RAM resources required to run the tests.
Data on the current market price of the RAM resource is retrieved from an oracle [16] every 60 min that runs within the SCPDx platform whose blockchain infrastructure is being used.
The current price of RAM is 0.01503345 SYS/kB as of 23 March 2024, 2:05 PM. Assuming the price of 1 SYS is equal to the price of 1 EOS, it is possible to compare the price of the RAM used if the tests are run on the public Antelope blockchain because there is a quote of the EOS RAM Token in USD and it does not depend on the account used. The quote is available at “https://coinmarketcap.com/ (accessed on 23 March 2024)”.
Table 3 shows that in terms of RAM usage and the associated costs in SYS and USD, the score tests require more resources than the timing tests. The total cost of using blockchain resources for these tests is less than 50 USD. This gives reason to assume that using blockchain to manage and document test results has promise. The RAM price, measured in SYS per kilobyte (kB), remains constant across different tests in the blockchain network.
Table 3.
Blockchain test costs.
This means that blockchain developers and users can anticipate and plan for the costs associated with their blockchain operations. The blockchain resource pricing model is designed to maintain a predictable and reliable cost structure. This predictability matters for the long-term sustainability and scalability of blockchain projects as it allows for accurate cost estimation and resource allocation. However, the real value of implementing blockchain must also consider the benefits of increased transparency, security and traceability against these costs.
5. Discussion
The PaSSER App testing observations reveal several aspects that affect the acquired results and the performance and can be managed. These are data cleaning and pre-processing, chunk sizes, GPU usage, and RAM size.
Data cleaning and pre-processing cannot be fully automated. In addition to removing special characters and hyperlinks, it is also necessary to remove non-essential or erroneous information, standardize formats, and correct errors from the primary data. This is done manually. At this stage, the PaSSER App processes only textual information; therefore, the normalization of data, handling of missing data, and detection and removal of deviations are not considered.
Selecting documents with current, validated, and accurate data is pivotal, yet this process cannot be entirely automated. What can be achieved is to ensure traceability and record the updates and origins of both primary and processed data, along with their secure storage. Blockchain and distributed file systems can be used for this purpose. Here, this objective is partially implemented since blockchain is used solely to record the testing results.
The second aspect is chunk sizes when creating and using vectorstores. Smaller chunks require less memory and computational resources. This is at the expense of increased iterations and overall execution time, which is balanced by greater concurrency in query processing. On the other hand, larger chunks provide more context but may be more demanding on resources and potentially slow down processes if not managed efficiently.
Adjusting the chunk size affects both the recall and precision of the results. Adequate chunk size is essential to ensure a balance between the retrieval and generation tasks in RAG, as over- or undersized chunks can negatively impact one or both components. In the tests, 500-character chunk sizes were found to give the best results. In this particular implementation, no metadata added (document type or section labels) is used in the vectorstore creation process, which would facilitate more targeted processing when using smaller chunks.
GPU usage and RAM size obviously affect the performance of the models. It is evident from the results that hardware configurations that do not use the GPU perform significantly slower on the text generation and summarization tasks. Models with fewer parameters (up to 13b) can run reasonably well on 16 GB RAM configurations. Larger models need more resources, both in terms of RAM and GPU resources. This is the reason, in this particular implementation, to use the selected small LLMs, which are suitable for standard and commonly available hardware configurations and platforms.
It is important to note that the choice of a model may vary depending on the specific requirements of a given task, including the desired balance between creativity and accuracy, the importance of fluency versus content fidelity, and the computational resources available. Therefore, while Mistral:7b appears to be the most versatile and capable model based on the provided metrics, the selection of a model should be guided by the specific objectives and constraints of the application in question.
While promising, the use of RAG-equipped LLMs requires caution regarding data accuracy, privacy concerns, and ethical implications. This is of particular importance in the healthcare domain, where the goal is to assist medical professionals and researchers by accessing the latest medical research, clinical guidelines, and patient data, as well as assisting diagnostic processes, treatment planning, and medical education. Pre-trained open-source models can be found on Huggingface [45]. For example, TheBloke/medicine-LLM-13B-GPTQ is used for medical question answering, patient record summarization, aiding medical diagnosis, and general health Q&A [46]. Another model is m42-health/med42-70b [47]. However, this application requires measures to ensure accuracy, privacy, and compliance with health regulations.
6. Conclusions
This paper presented the development, integration, and use of the PaSSER web application, designed to leverage RAG technology with LLMs for enhanced document retrieval and analysis. Despite the explicit focus on smart agriculture as the chosen specific domain, the application can be used in other areas.
The web application integrates Mistral:7b, Llama2:7b, and Orca2:7b LLMs, selected for their performance and compatibility with medium computational capacity hardware. It has built-in testing modules that evaluate the performance of the LLMs in real-time by a set of 13 evaluation metrics (ROUGE-1 recall, precision, f-score; ROUGE-l recall, precision, f-score; BLUE, Laplace perplexity, Lidstone perplexity, cosine similarity, Pearson correlation, F1 score).
The LLMs were tested via the ‘Q&A Time LLM Test’ and ‘RAG Q&A score test’ functionalities of the PaSSER App. The ‘Q&A Time LLM Test’ was focused on assessing LLMs across two hardware configurations. From the results of the ‘Q&A Time LLM Test’, it can be concluded that even when working with 7b models, the presence of GPUs is crucial for text generation speed. The lowest total duration times were shown by Orca2:7b on the Mac M1 system. From the results of the ‘RAG Q&A Score Test’ applied to the selected metrics over the dataset of 446 question–answer pairs, the Mistral:7b model exhibited superior performance.
The PaSSER App leverages a private, permissionless Antelope blockchain network for documenting and verifying results from LLMs’ testing. The system operates on a token-based economy (SYS) to manage RAM, CPU, and NET resources. RAM usage and associated costs, measured in SYS and USD, indicate that the total cost for blockchain resources for conducted tests remains below 50 USD. This pricing model guarantees reliability and predictability by facilitating accurate cost estimations and efficient resource distribution. Beyond the monetary aspects, the value of implementing blockchain encompasses increased transparency, security, and traceability, highlighting its benefits.
Future development will focus on leveraging other pre-trained open-source LLMs (over 40b) LLMs, exploring fine-tuning approaches, and further integration in the existing Antelope blockchain/IPFS infrastructure of the SCPDx platform.
Author Contributions
Conceptualization, I.R. and I.P.; methodology, I.R. and I.P.; software, I.R. and M.D.; validation, I.R. and M.D.; formal analysis, I.P. and I.R.; investigation, L.D.; resources, L.D.; data curation, I.R. and M.D.; writing—original draft preparation, I.R. and I.P.; writing—review and editing, I.R., I.P. and M.D.; visualization, I.R. and M.D.; supervision, I.P.; project administration, L.D.; funding acquisition, I.R, I.P. and L.D. All authors have read and agreed to the published version of the manuscript.
Funding
This work was supported by the Bulgarian Ministry of Education and Science under the National Research Program “Smart crop production” approved by the Ministry Council No. 866/26.11.2020.
Data Availability Statement
All data and source codes are available at: “https://github.com/scpdxtest/PaSSER (accessed on 1 April 2024). Git Structure: ‘README.md’—information about the project and instructions on how to use it; ‘package.json’- the list of project dependencies and other metadata; ‘src’- all the source code for the project; ‘src/components’—all the React components for the project; ‘src/components/configuration.json’—various configuration options for the app; ‘src/App.js’—the main React component that represents the entire app; ‘src/index.js’—JavaScript entry point file; ‘public’—static files like the ‘index.html’ file; ‘scripts’—Python backend scripts; ‘Installation Instructions.md’—contains instructions on how to install and set up the project.
Conflicts of Interest
The authors declare no conflicts of interest. The funders had no role in the design of the study; in the collection, analyses, or interpretation of data; in the writing of the manuscript; or in the decision to publish the results.
References
- Howard, J.; Ruder, S. Universal Language Model Fine-Tuning for Text Classification. In Proceedings of the 56th Annual Meeting of the Association for Computational Linguistics (Volume 1: Long Papers), Melbourne, Australia, 1 July 2018. [Google Scholar] [CrossRef]
- Houlsby, N.; Giurgiu, A.; Jastrzebski, S.; Morrone, B.; De Laroussilhe, Q.; Gesmundo, A.; Attariyan, M.; Gelly, S. Parameter-Efficient Transfer Learning for NLP. No. 97. In Proceedings of the 36th International Conference on Machine Learning, Long Beach, CA, USA, 9–15 June 2019; Chaudhuri, K., Salakhutdinov, R., Eds.; pp. 2790–2799. [Google Scholar]
- Brown, T.B.; Mann, B.; Ryder, N.; Subbiah, M.; Kaplan, J.; Dhariwal, P.; Neelakantan, A.; Shyam, P.; Sastry, G.; Askell, A.; et al. Language Models Are Few-Shot Learners. arXiv 2005, arXiv:2005.14165. Available online: https://arxiv.org/abs/2005.14165v4 (accessed on 26 March 2024).
- Lewis, P.; Perez, E.; Piktus, A.; Petroni, F.; Karpukhin, V.; Goyal, N.; Küttler, H.; Lewis, M.; Yih, W.; Rocktäschel, T.; et al. Retrieval-Augmented Generation for Knowledge-Intensive NLP Tasks. arXiv 2005, arXiv:2005.11401. Available online: http://arxiv.org/abs/2005.11401 (accessed on 2 February 2024).
- Gao, Y.; Xiong, Y.; Gao, X.; Jia, K.; Pan, J.; Bi, Y.; Dai, Y.; Sun, J.; Guo, Q.; Wang, M.; et al. Retrieval-Augmented Generation for Large Language Models: A Survey. arXiv 2023, arXiv:2312.10997. Available online: http://arxiv.org/abs/2312.10997 (accessed on 18 February 2024).
- Karpukhin, V.; Oguz, B.; Min, S.; Lewis, P.; Wu, L.; Edunov, S.; Chen, D.; Yih, W. Dense Passage Retrieval for Open-Domain Question Answering. In Proceedings of the 2020 Conference on Empirical Methods in Natural Language Processing (EMNLP), Online, 1 November 2020. [Google Scholar] [CrossRef]
- Guu, K.; Lee, K.; Tung, Z.; Pasupat, P.; Chang, M. Retrieval Augmented Language Model Pre-Training. Proc. Mach. Learn. Res. 2020, 119, 3929–3938. [Google Scholar]
- Izacard, G.; Grave, E. Leveraging Passage Retrieval with Generative Models for Open Domain Question Answering. In Proceedings of the 16th Conference of the European Chapter of the Association for Computational Linguistics: Main Volume, Online, 20 April 2021. [Google Scholar] [CrossRef]
- GitHub. GitHub—Scpdxtest/PaSSER. Available online: https://github.com/scpdxtest/PaSSER (accessed on 8 March 2024).
- Popchev, I.; Doukovska, L.; Radeva, I. A Framework of Blockchain/IPFS-Based Platform for Smart Crop Production. In Proceedings of the ICAI’22, Varna, Bulgaria, 6–8 October 2022. [Google Scholar] [CrossRef]
- Popchev, I.; Doukovska, L.; Radeva, I. A Prototype of Blockchain/Distributed File System Platform. In Proceedings of the IEEE International Conference on Intelligent Systems IS’22, Warsaw, Poland, 12–14 October 2022. [Google Scholar] [CrossRef]
- IPFS Docs. IPFS Documentation. Available online: https://docs.ipfs.tech/ (accessed on 25 March 2024).
- GitHub. Antelope. Available online: https://github.com/AntelopeIO (accessed on 11 January 2024).
- Ilieva, G.; Yankova, T.; Radeva, I.; Popchev, I. Blockchain Software Selection as a Fuzzy Multi-Criteria Problem. Computers 2021, 10, 120. [Google Scholar] [CrossRef]
- Radeva, I.; Popchev, I. Blockchain-Enabled Supply-Chain in Crop Production Framework. Cybern. Inf. Technol. 2022, 22, 151–170. [Google Scholar] [CrossRef]
- Popchev, I.; Radeva, I.; Doukovska, L. Oracles Integration in Blockchain-Based Platform for Smart Crop Production Data Exchange. Electronics 2023, 12, 2244. [Google Scholar] [CrossRef]
- Ollama. Available online: https://ollama.com. (accessed on 25 March 2024).
- GitHub. GitHub—Chroma-Core/Chroma: The AI-Native Open-Source Embedding Database. Available online: https://github.com/chroma-core/chroma (accessed on 26 February 2024).
- PrimeReact. React UI Component Library. Available online: https://primereact.org (accessed on 25 March 2024).
- WharfKit. Available online: https://wharfkit.com/ (accessed on 25 March 2024).
- LangChain. Available online: https://www.langchain.com/ (accessed on 25 March 2024).
- NLTK: Natural Language Toolkit. Available online: https://www.nltk.org/ (accessed on 26 February 2024).
- Paszke, A.; Gross, S.; Massa, F.; Lerer, A.; Bradbury, J.; Chanan, G.; Killeen, T.; Lin, Z.; Gimelshein, N.; Antiga, L.; et al. PyTorch: An Imperative Style, High-Performance Deep Learning Library. Adv. Neural Inf. Process. Syst. 2019, 32, 8024–8035. [Google Scholar]
- NumPy Documentation—NumPy v1.26 Manual. Available online: https://numpy.org/doc/stable/ (accessed on 26 February 2024).
- Paul Tardy. Rouge: Full Python ROUGE Score Implementation (Not a Wrapper). Available online: https://github.com/pltrdy/rouge (accessed on 1 April 2024).
- Contributors. T. H. F. Team (Past and Future) with the Help of All Our. Transformers: State-of-the-Art Machine Learning for JAX, PyTorch and TensorFlow. Available online: https://github.com/huggingface/transformers (accessed on 1 April 2024).
- SciPy Documentation—SciPy v1.12.0 Manual. Available online: https://docs.scipy.org/doc/scipy/ (accessed on 26 February 2024).
- Pyntelope. PyPI. Available online: https://pypi.org/project/pyntelope/ (accessed on 27 February 2024).
- Rastogi, R. Papers Explained: Mistral 7B. DAIR.AI. Available online: https://medium.com/dair-ai/papers-explained-mistral-7b-b9632dedf580 (accessed on 24 October 2023).
- ar5iv. Mistral 7B. Available online: https://ar5iv.labs.arxiv.org/html/2310.06825 (accessed on 6 March 2024).
- The Cloudflare Blog. Workers AI Update: Hello, Mistral 7B! Available online: https://blog.cloudflare.com/workers-ai-update-hello-mistral-7b (accessed on 6 March 2024).
- Hugging Face. Meta-Llama/Llama-2-7b. Available online: https://huggingface.co/meta-llama/Llama-2-7b (accessed on 6 March 2024).
- Mitra, A.; Corro, L.D.; Mahajan, S.; Codas, A.; Ribeiro, C.S.; Agrawal, S.; Chen, X.; Razdaibiedina, A.; Jones, E.; Aggarwal, K.; et al. Orca-2: Teaching Small Language Models How to Reason. arXiv 2023, arXiv:2311.11045. [Google Scholar]
- Popchev, I.; Radeva, I.; Dimitrova, M. Towards Blockchain Wallets Classification and Implementation. In Proceedings of the 2023 International Conference Automatics and Informatics (ICAI), Varna, Bulgaria, 5–7 October 2023. [Google Scholar] [CrossRef]
- Chen, J.; Lin, H.; Han, X.; Sun, L. Benchmarking Large Language Models in Retrieval-Augmented Generation. arXiv 2023, arXiv:2309.01431. [Google Scholar] [CrossRef]
- Banerjee, S.; Lavie, A. METEOR: An Automatic Metric for MT Evaluation with Improved Correlation with Human Judgments. In Proceedings of the ACL Workshop on Intrinsic and Extrinsic Evaluation Measures for Machine Translation and/or Summarization, Ann Arbor, MI, USA, 22 June 2005. [Google Scholar]
- Lin, C.-Y. ROUGE: A Package for Automatic Evaluation of Summaries; Association for Computational Linguistics: Barcelona, Spain, 2004. [Google Scholar]
- Papineni, K.; Roukos, S.; Ward, T.; Zhu, W.-J. Bleu: A Method for Automatic Evaluation of Machine Translation. In Proceedings of the 40th Annual Meeting of the Association for Computational Linguistics, Philadelphia, PA, USA, 6–12 July 2002. [Google Scholar] [CrossRef]
- Arora, K.; Rangarajan, A. Contrastive Entropy: A New Evaluation Metric for Unnormalized Language Models. arXiv 2016, arXiv:1601.00248. Available online: https://arxiv.org/abs/1601.00248v2 (accessed on 2 February 2024).
- Jurafsky, D.; Martin, J.H. Speech and Language Processing. Available online: https://web.stanford.edu/~jurafsky/slp3/ (accessed on 8 February 2024).
- Li, B.; Han, L. Distance Weighted Cosine Similarity Measure for Text Classification; Springer: Berlin/Heidelberg, Germany, 2013. [Google Scholar]
- Sokolova, M.; Japkowicz, N.; Szpakowicz, S. Beyond Accuracy, F-Score and ROC: A Family of Discriminant Measures for Performance Evaluation. Adv. Artif. Intell. 2006, 4304, 1015–1021. [Google Scholar]
- issuu. Bancor Protocol Whitepaper En. Available online: https://issuu.com/readthewhitepaper/docs/bancor_protocol_whitepaper_en (accessed on 24 March 2024).
- Medium; Binesh, A. EOS Resource Usage. Available online: https://medium.com/shyft-network/eos-resource-usage-f0a8098827d7 (accessed on 24 March 2024).
- Hugging Face. Models. Available online: https://huggingface.co/models (accessed on 23 March 2024).
- Cheng, D.; Huang, S.; Wei, F. Adapting Large Language Models via Reading Comprehension. arXiv 2024, arXiv:2309.09530. [Google Scholar] [CrossRef]
- Hugging Face. M42-Health/Med42-70b. Available online: https://huggingface.co/m42-health/med42-70b (accessed on 26 March 2024).


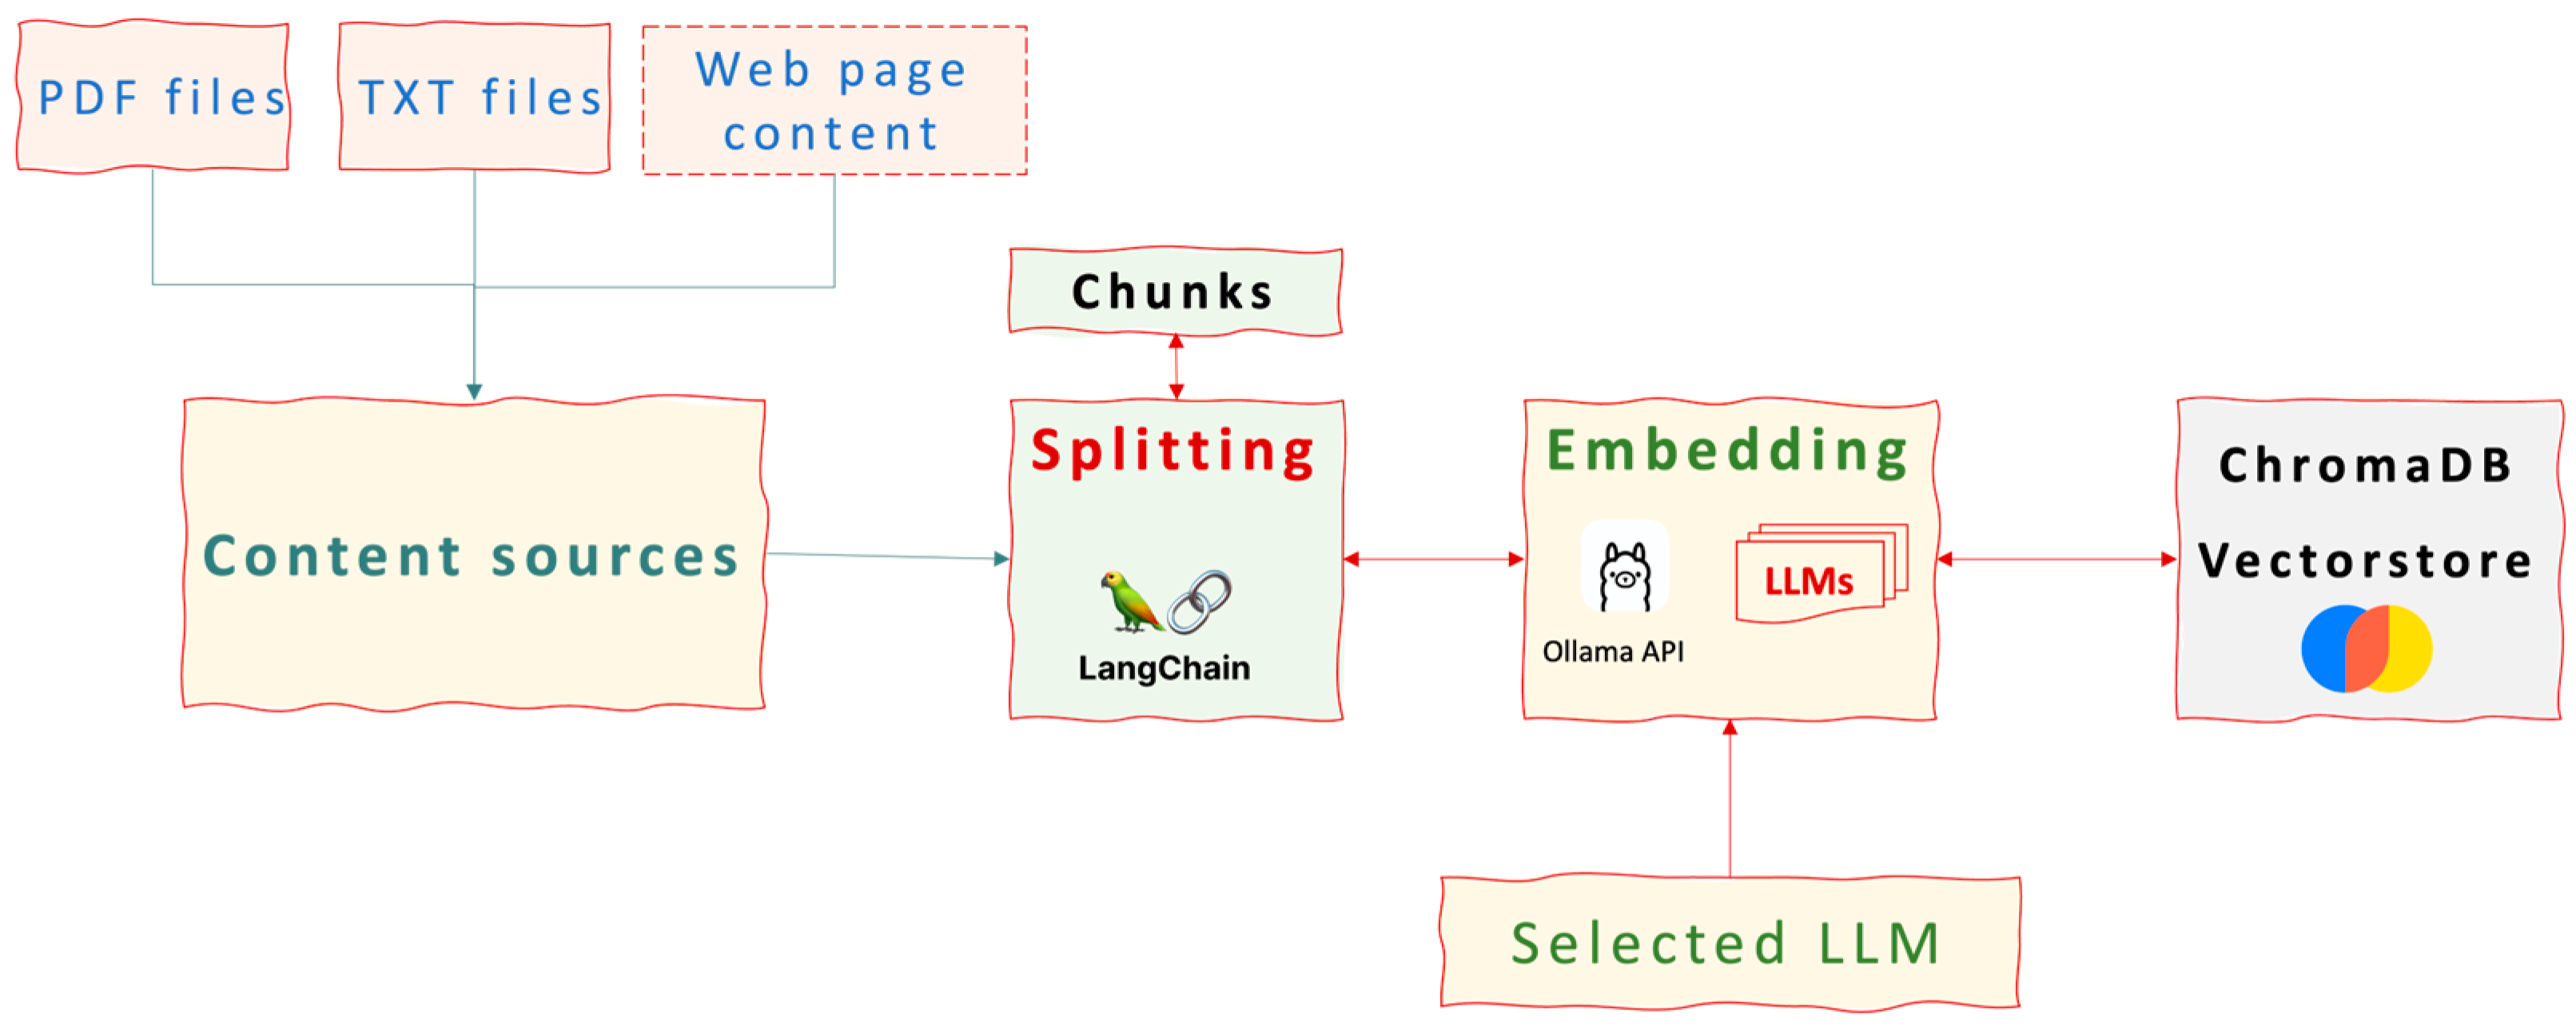
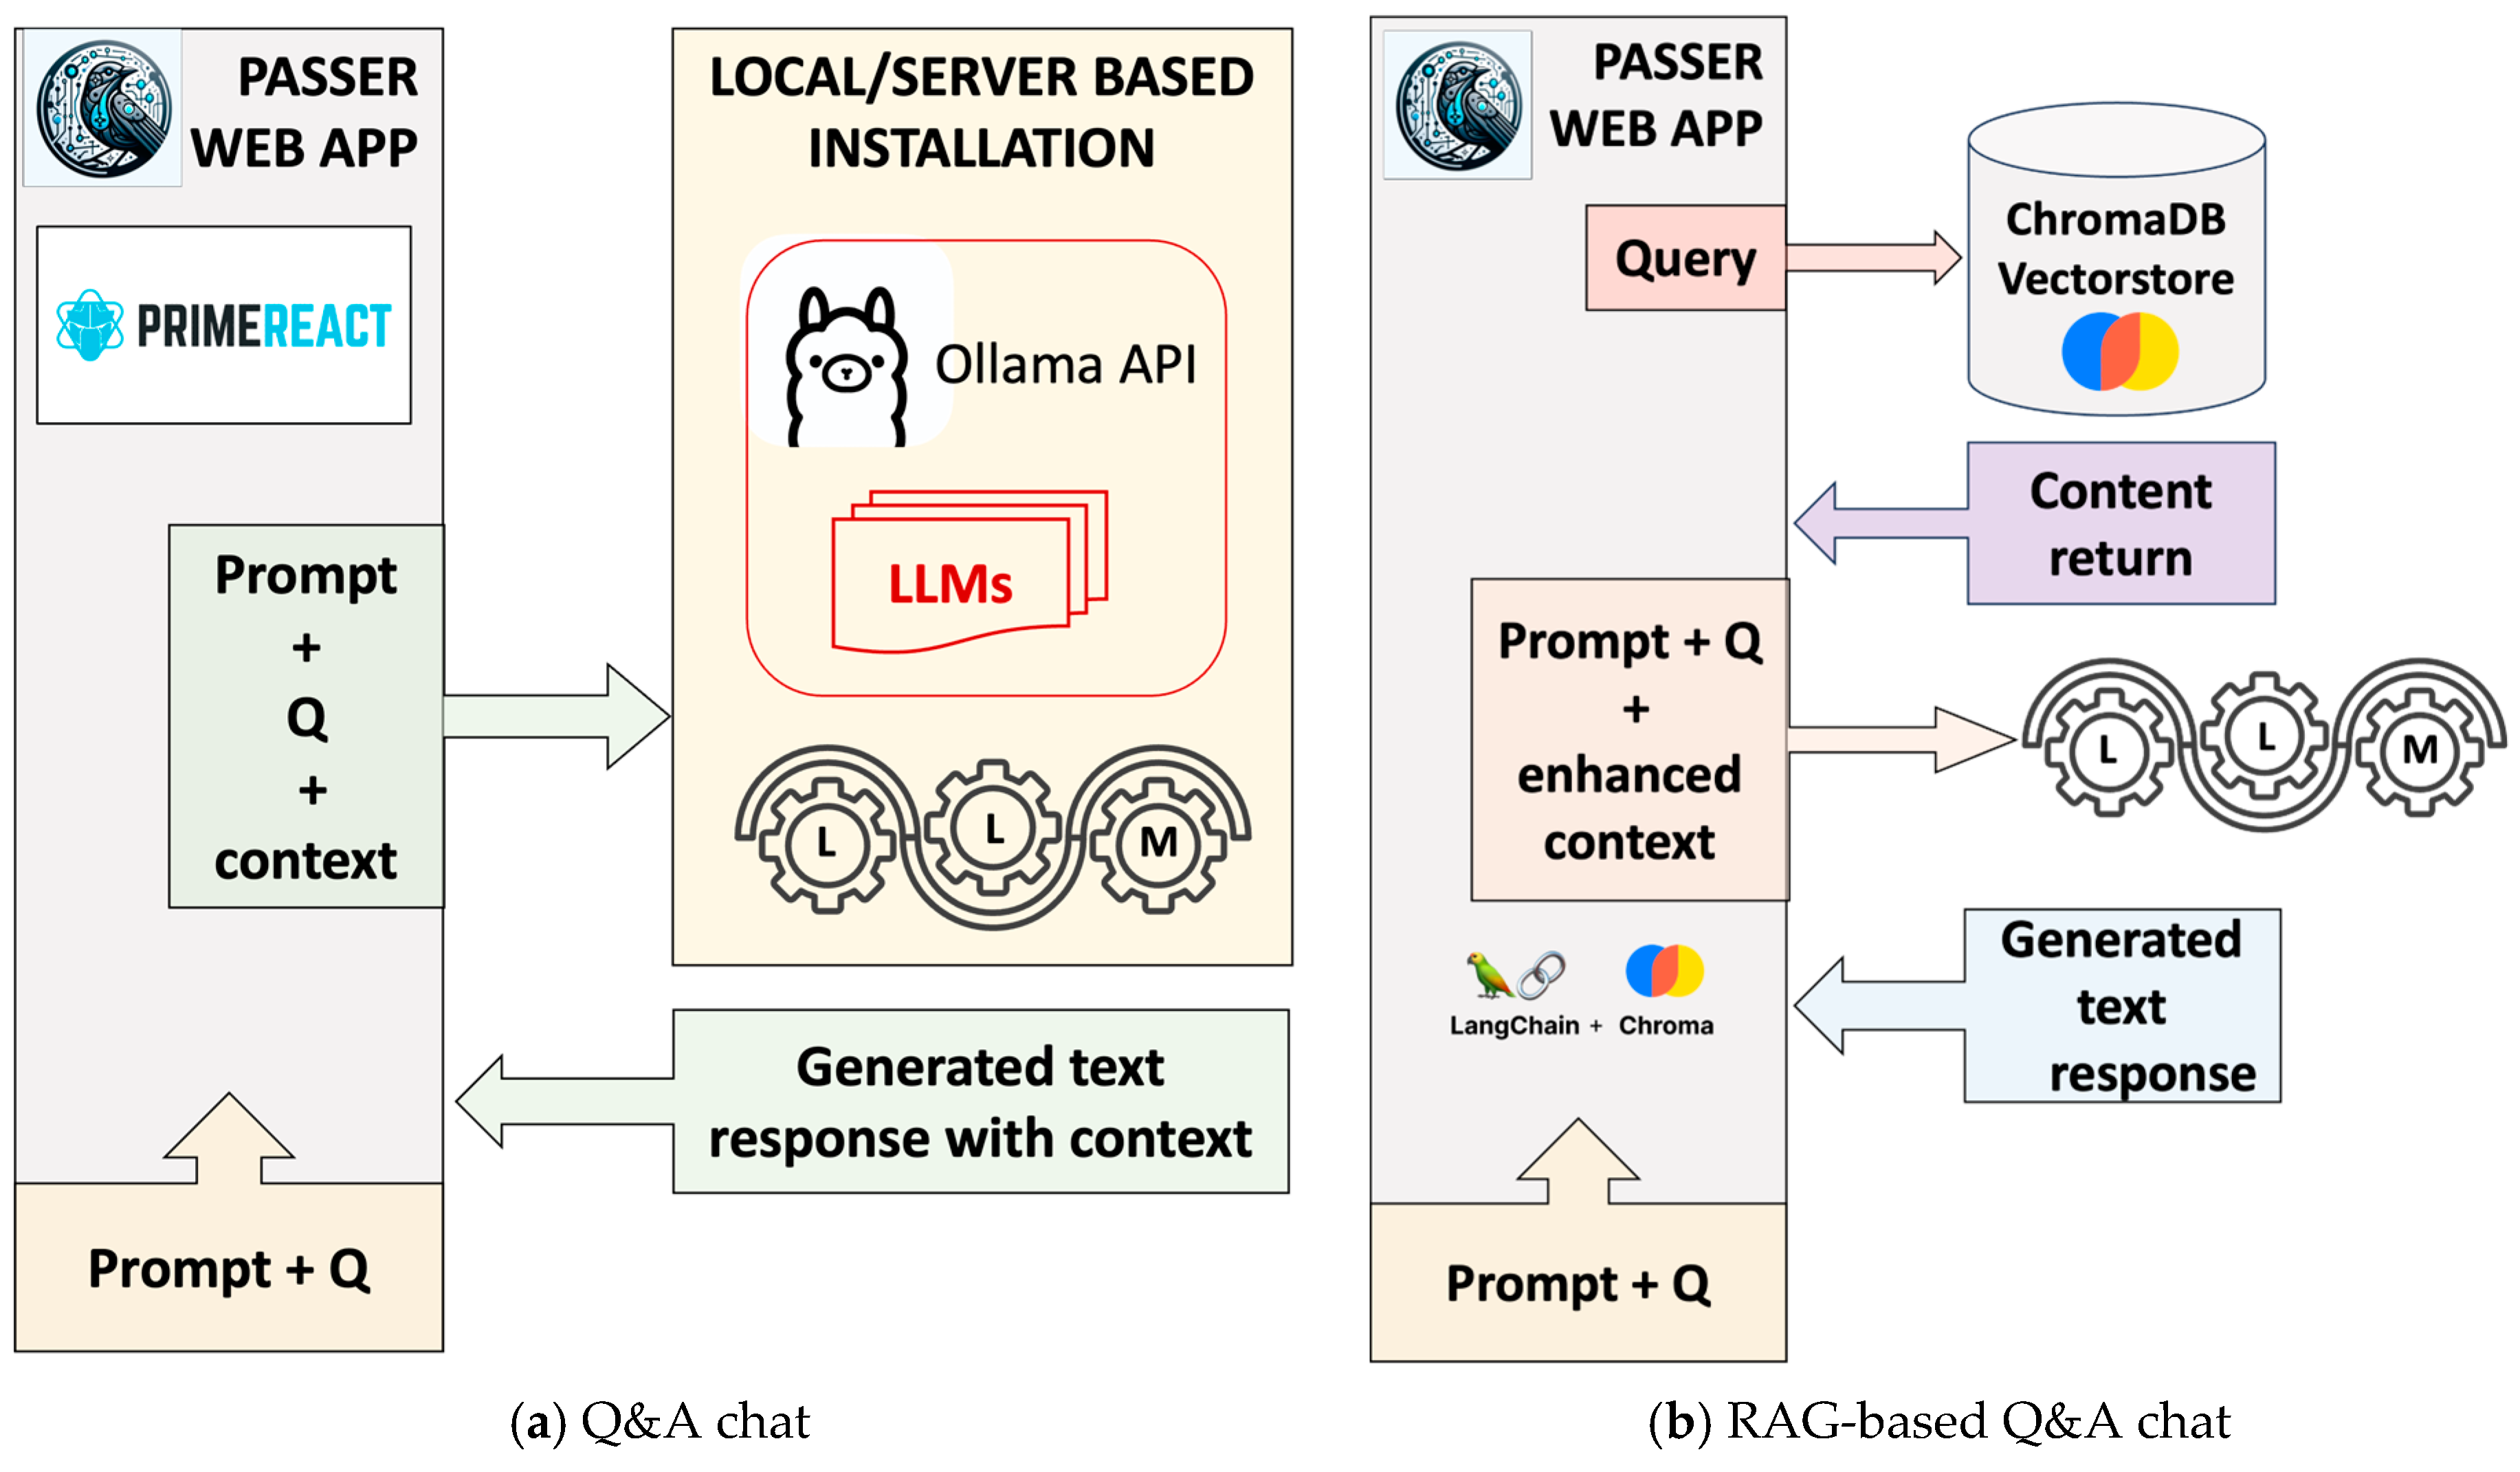

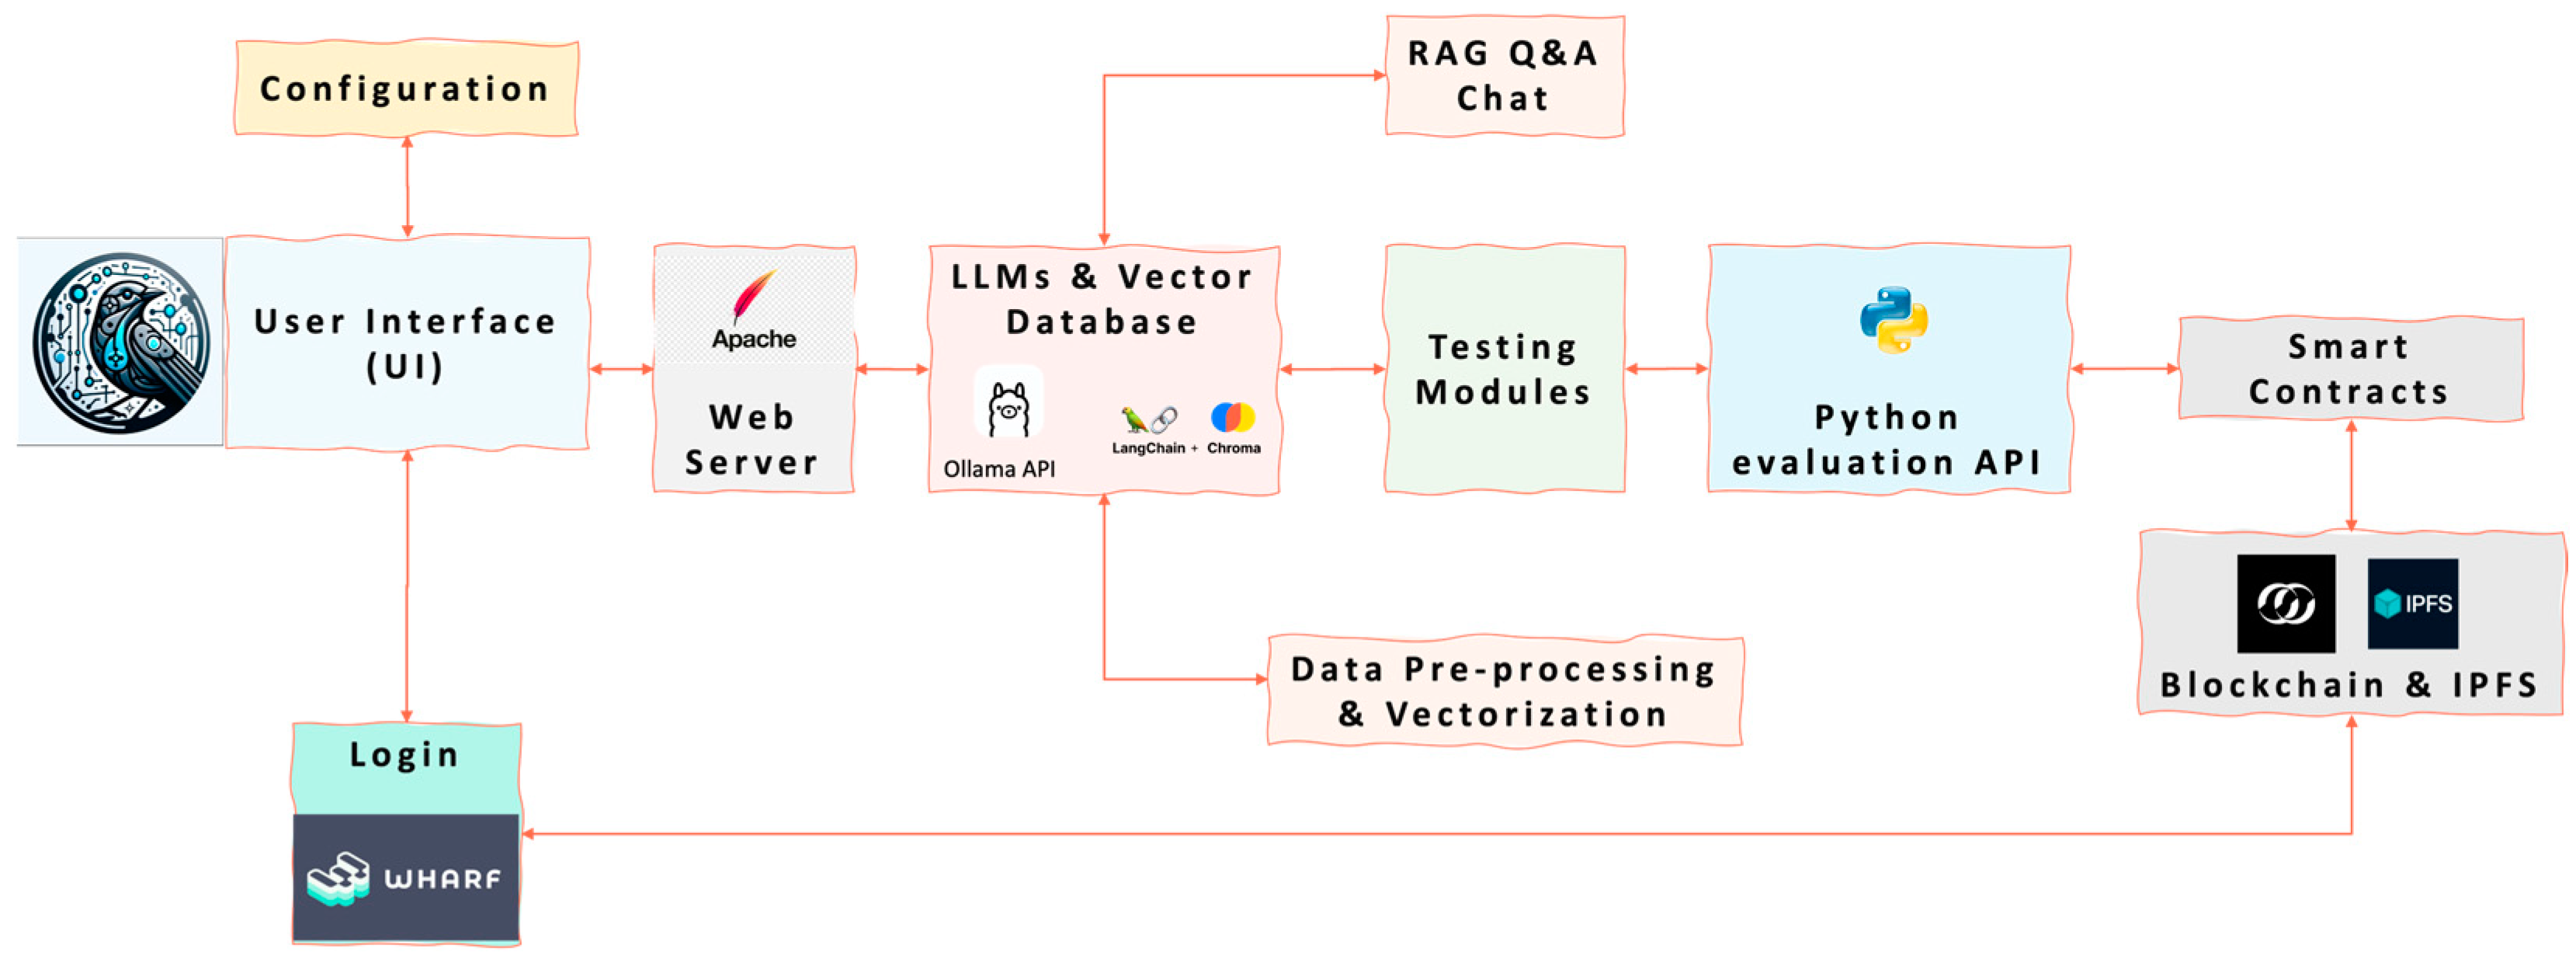

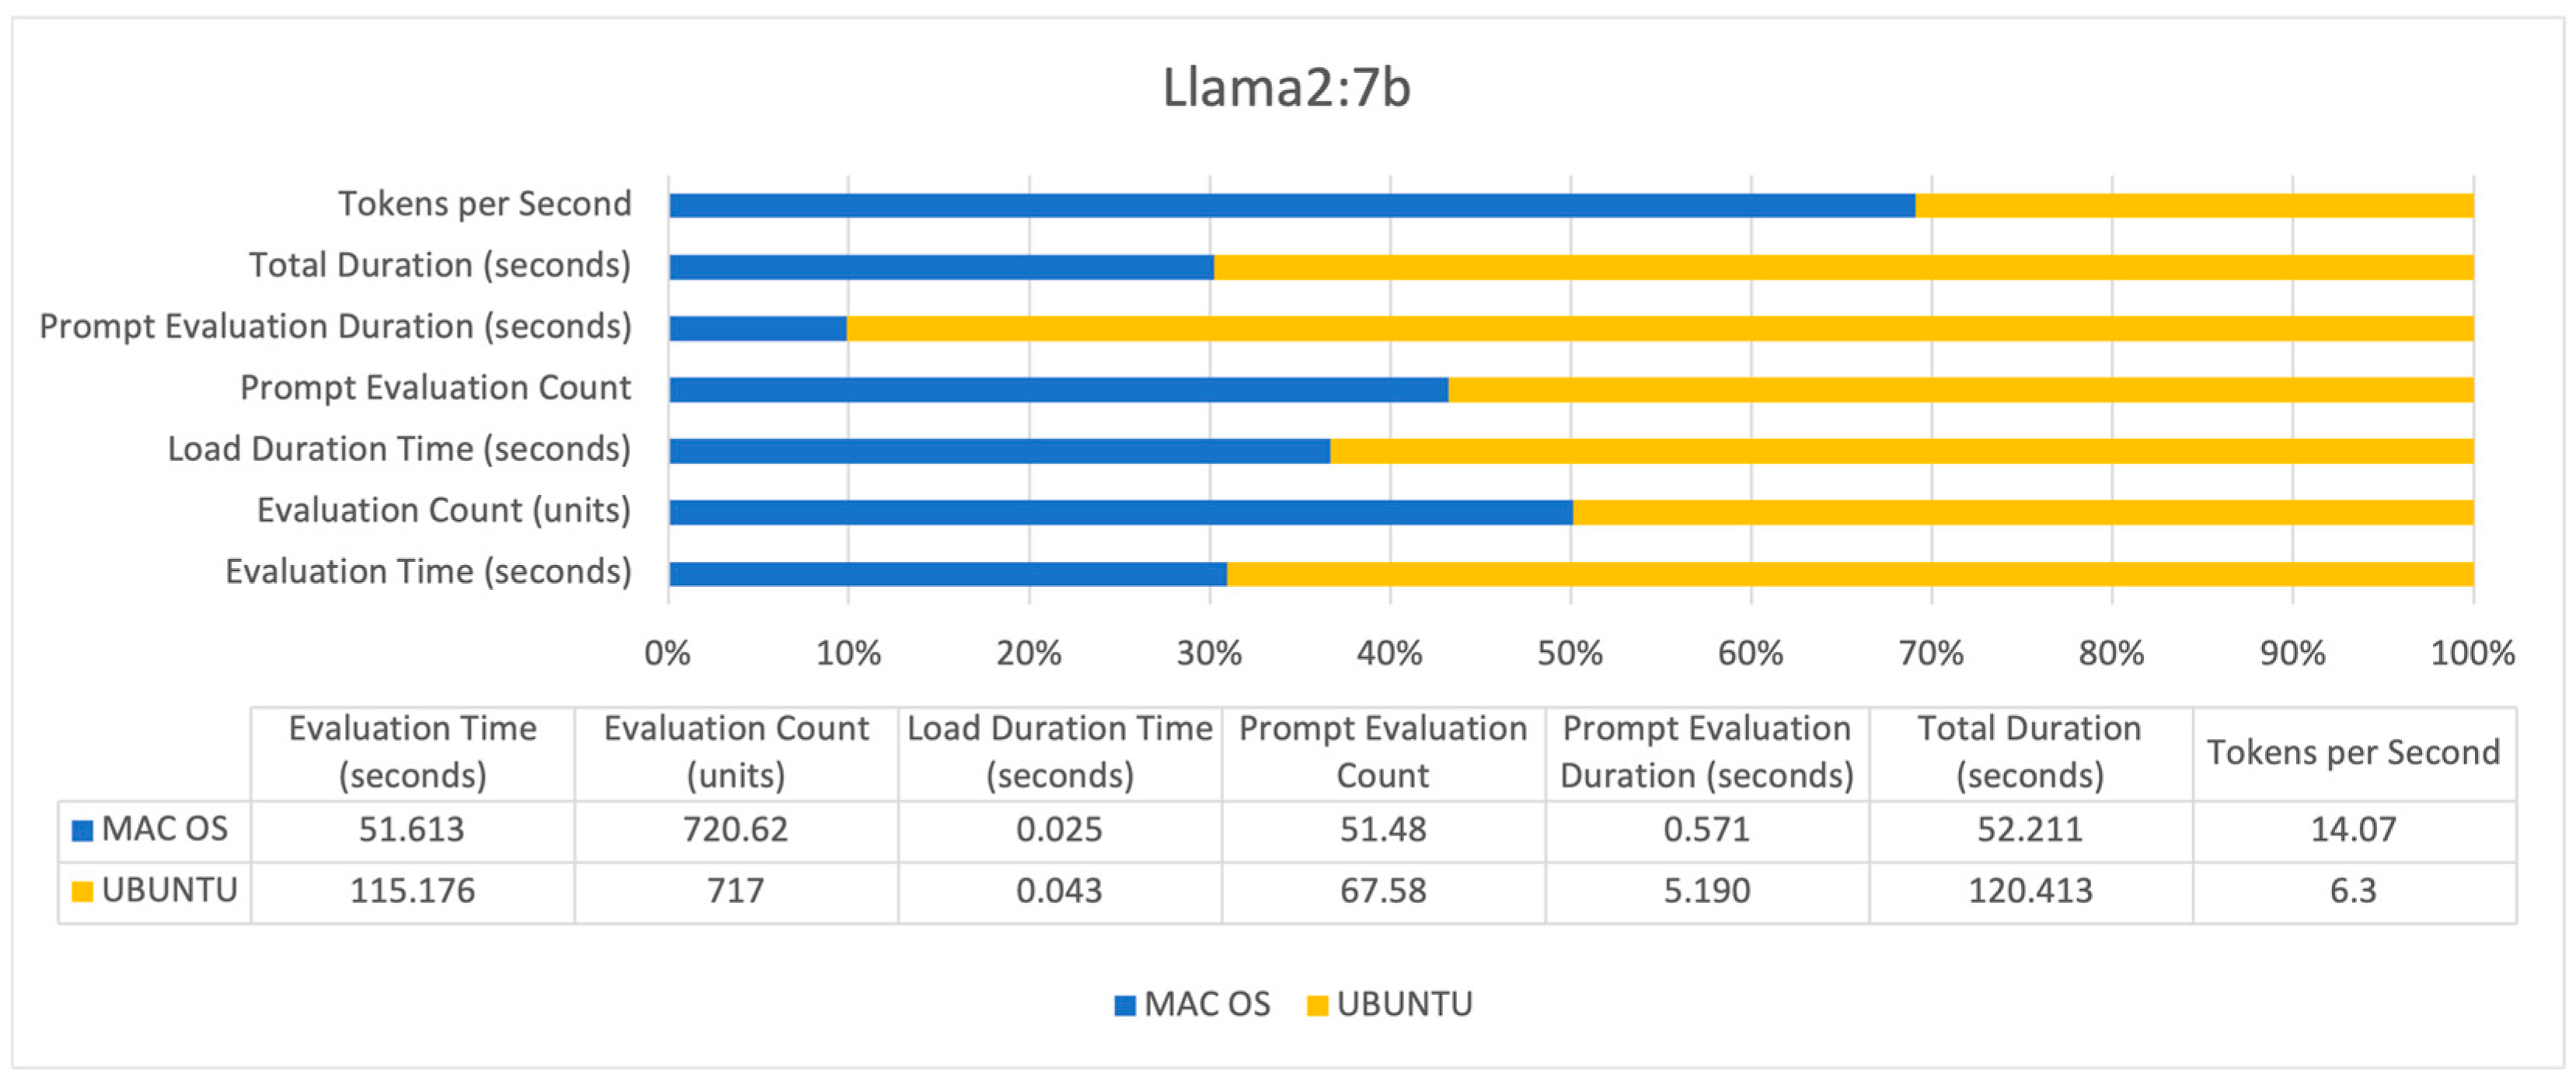
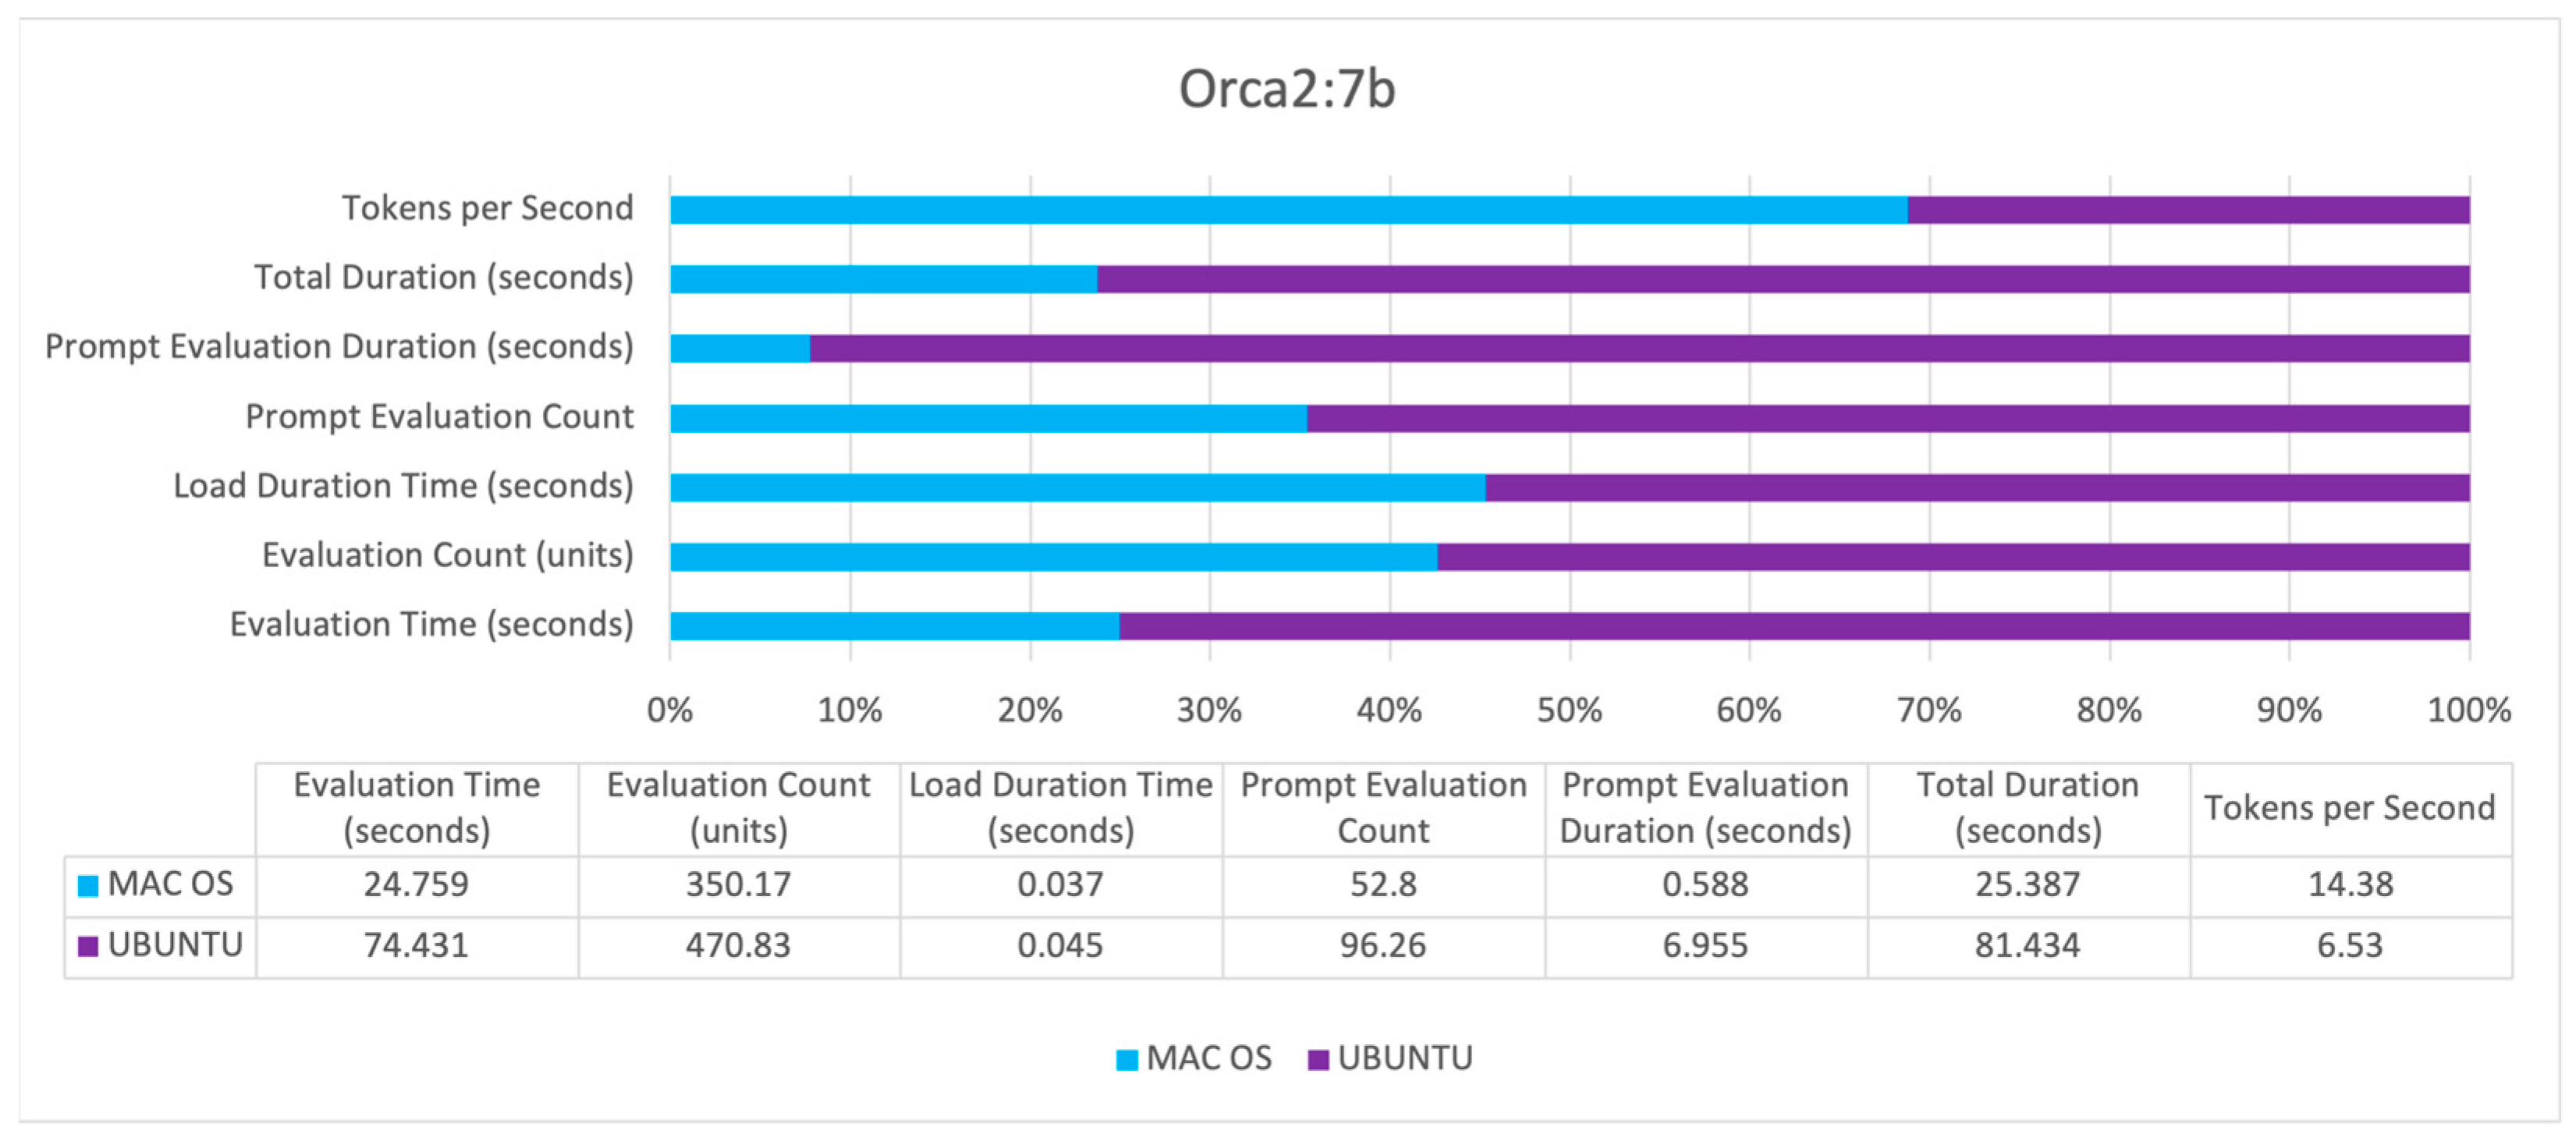
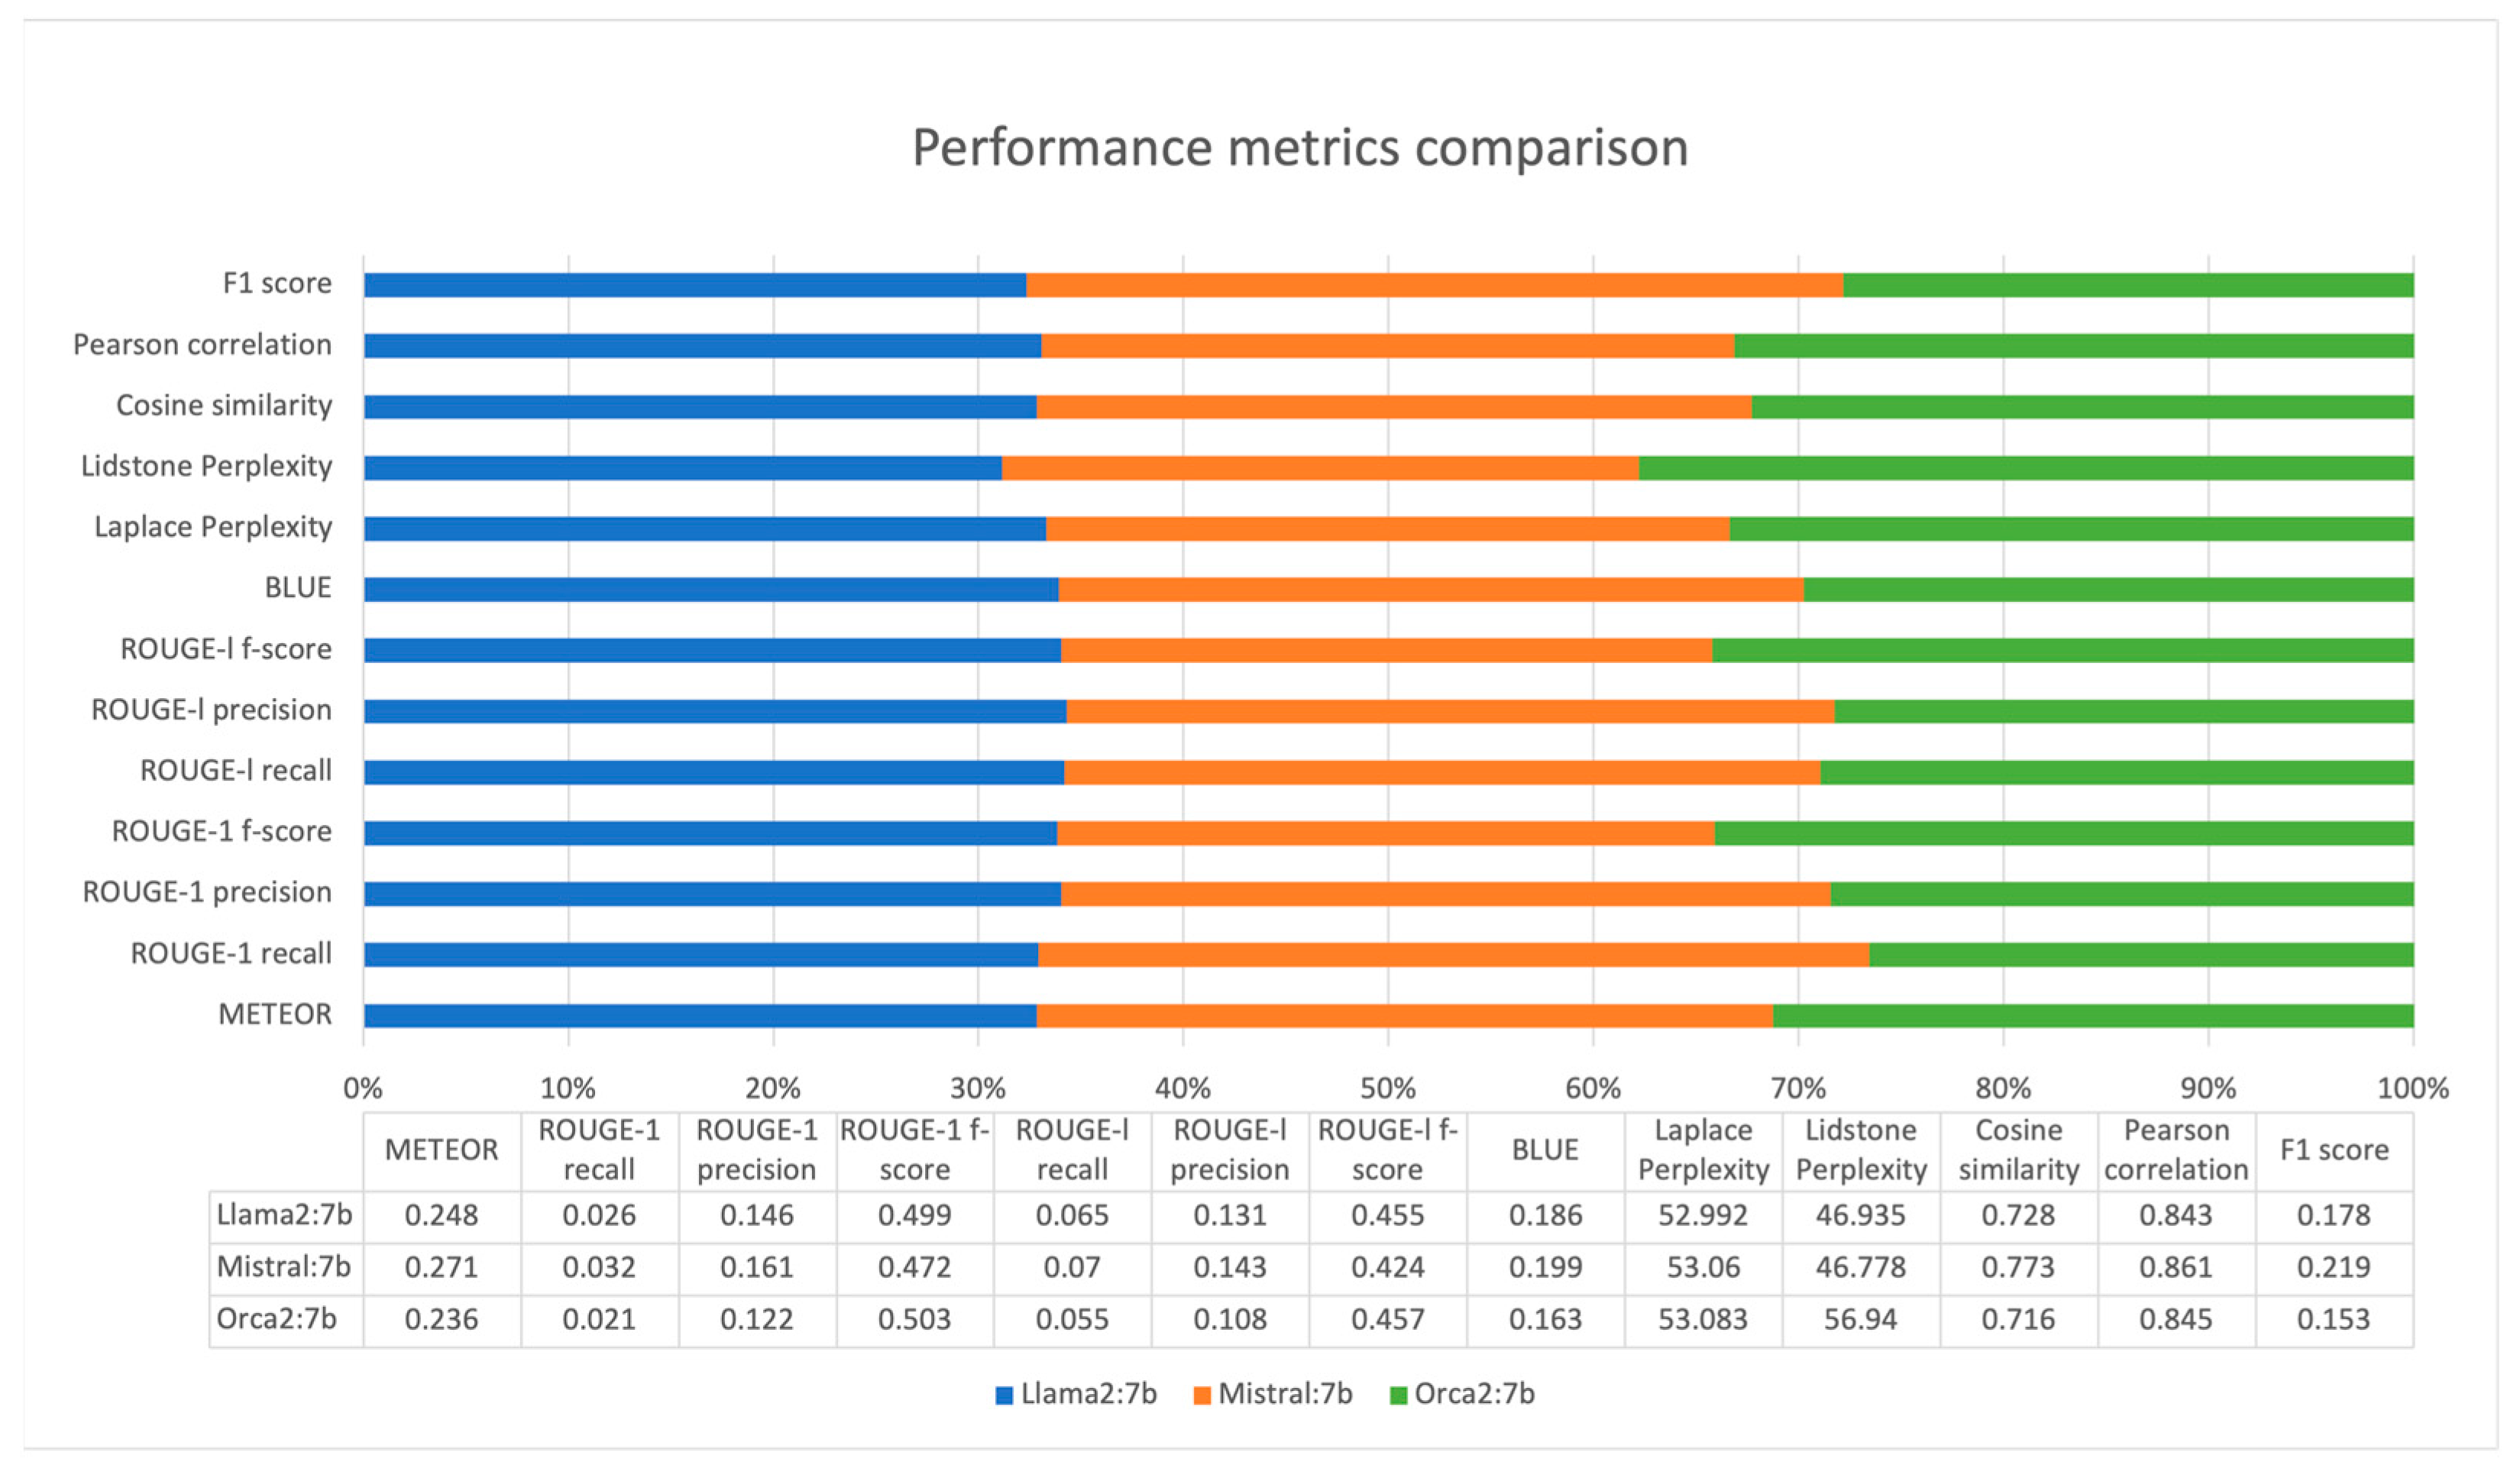
Disclaimer/Publisher’s Note: The statements, opinions and data contained in all publications are solely those of the individual author(s) and contributor(s) and not of MDPI and/or the editor(s). MDPI and/or the editor(s) disclaim responsibility for any injury to people or property resulting from any ideas, methods, instructions or products referred to in the content. |
© 2024 by the authors. Licensee MDPI, Basel, Switzerland. This article is an open access article distributed under the terms and conditions of the Creative Commons Attribution (CC BY) license (https://creativecommons.org/licenses/by/4.0/).