Article

Research on Wireless Power Transfer Method for Intelligent Sensing Device of Non-Directly Buried Distribution Cables

1
Institute of Electrical Engineering, Chinese Academy of Sciences, Beijing 100190, China
2
University of Chinese Academy of Sciences, Beijing 100049, China
3
State Grid Henan Electric Power Research Institute, Zhengzhou 450052, China
*
Author to whom correspondence should be addressed.
Electronics 2024, 13(8), 1411; https://doi.org/10.3390/electronics13081411
Submission received: 20 February 2024 / Revised: 29 March 2024 / Accepted: 29 March 2024 / Published: 9 April 2024
(This article belongs to the Special Issue Wireless Power Transfer Technology and Its Applications)

Abstract

:
This paper presents a study on the impact of circuit parameters on the transmission of electrical energy in wireless power transfer systems designed for intelligent sensing devices within the urban electric power Internet of Things (IoT). Relying on the essential principles of resonant mutual inductance models, the paper conducts an analytical investigation into the phenomena of power-frequency splitting characteristics, efficiency-frequency splitting characteristics, and efficacy synchronization characteristics within wireless energy transmission technologies. The investigation includes a detailed analysis of a wireless power transfer system model operating at 100 kHz, delineating how varying circuit parameters influence the system’s efficiency. Via the utilization of graphical software and computational programming for simulation modeling, this research delved into the dynamics between key parameters such as equivalent load and coupling coefficient and their influence on distinct splitting phenomena. This rigorous approach substantiated the validity of the proposed power-frequency and efficiency-frequency splitting characteristics outlined in the study. Based on the analytical results, it is shown that selecting an appropriate equivalent load or utilizing impedance matching networks to adjust the equivalent load to a suitable size is crucial in consideration of the system’s output power, voltage withstand level, and transmission efficiency. The research findings provide a theoretical basis for the design of wireless power supply systems for non-directly buried cable front-end sensing devices.

1. Introduction

As the prevalence of portable electronic products [1,2,3,4], high-performance electric vehicles (EVs) [5,6,7,8,9], and biomedically implanted sensors with rechargeable batteries [10,11,12] increases, the demand for periodic charging has emerged as a significant issue. Most devices continue to depend on traditional wired charging after battery depletion, a process often marked by inconvenience. Consequently, to enhance the portability of devices, there has been a growing shift towards wireless charging technologies. Wireless Power Transfer (WPT), as a form of contactless charging technology, not only offers safety and convenience but also contributes to the increased mobility and reliability of devices, all the while reducing costs. The operational mechanism of WPT is predicated upon the inductive coupling between two coils, wherein one coil functions as the transmitter and the other as the receiver. This principle is intricately linked to the phenomenon of electromagnetic induction. An alternating current (AC) flowing through the primary coil gives rise to a time-varying magnetic field. A fraction of this magnetic field from the primary coil permeates the adjacent secondary coil. The magnetic field emitted by the primary coil induces a voltage across the receiver coil, which, upon being connected to a load, results in a time-varying current.
In the process of constructing wireless cities, Wireless Power Transfer (WPT) technology, with its unique advantages, plays a pivotal role in advancing various aspects of sustainable urban development. Portable electronic devices, including laptops, mobile phones, and digital cameras, have become essential components of daily life [13]. In this context, Wireless Power Transfer (WPT) technology presents a solution to overcome the constraints of traditional wired charging and limited battery life by offering a wireless charging infrastructure [14]. Since its adoption in 2017, over 90 mobile phone models have incorporated this technology, demonstrating its widespread acceptance [15]. Within the realm of smart homes, the rapid development of smart city initiatives has leveraged WPT to enable more versatile and user-friendly positioning and power provision for household appliances, such as televisions and kitchen devices [16,17]. Xiaomi’s air charging technology, in particular, represents a significant advancement by facilitating long-distance charging for multiple devices simultaneously within a radius of several meters. In the robotics sector, WPT markedly enhances robots’ operational range and working hours, ensuring uninterrupted task execution and effectively addressing the constraints imposed by tethered charging solutions [18,19]. In the transportation industry, amid an ongoing energy transition, electric locomotives are swiftly supplanting conventional transportation methods. Here, WPT significantly contributes to reducing charging times and enhancing the flexibility of transportation systems [20,21]. Furthermore, in the power transmission field, WPT technologies, including far-field methods like Magnetic Power Transfer (MPT) and Optical Power Transfer (OPT), offer long-distance energy transmission capabilities. These advancements successfully tackle challenges associated with transmission distance, supply range limitations, and the complexities of power line installation and maintenance in both urban and remote locales [22,23]. Lastly, WPT technology proves to be invaluable in extreme environments, such as underwater or in mining operations, ensuring the safety and operational efficiency of power supplies and electrical equipment under such conditions [24].
Simultaneously, WPT offers a promising method for developing wireless power networks in urban areas. By promoting the integration of renewable energy sources, particularly solar power, into urban grids and combining distributed energy resources with controllable loads—including wind turbines, photovoltaic systems, diesel generators, and energy storage systems—within microgrid configurations, WPT technology speeds up the adoption of clean energy in urban planning. This helps mitigate the challenges posed by rapidly increasing energy demand [25,26]. Originating from the concept of Solar Power Satellites (SPS) introduced by Glaser in 1968, WPT has made the idea of transmitting electric power from space-based solar arrays to terrestrial grids possible. Techniques like Magnetic Power Transfer (MPT) and Optical Power Transfer (OPT) provide the technical foundation for such space-based photovoltaic power systems [27,28].
In the field of electric vehicle charging technology, ground-based photovoltaic power stations—the current primary form of solar power generation—are increasingly integrating with wireless charging technology, employing methods such as MCI-WPT, MCR-WPT, and MPT [29]. Additionally, because of land scarcity and increasing urbanization, rooftop photovoltaic installations have become crucial. WPT enables the efficient provision of energy to electric devices, including new-energy electric vehicles and intelligent Unmanned Aerial Vehicles (UAVs), prompting the development and implementation of charging infrastructure like vehicle charging stations and “charging highways”. This greatly improves the quality of life for residents and assists in reducing urban traffic congestion [30].
The rising deployment of electric vehicles supports the sustainability of energy systems and the environment at large. Simultaneously, WPT offers a secure and flexible method for energy transfer, effectively addressing safety concerns associated with charging electric vehicles [31]. Furthermore, WPT-enabled charging roads present an innovative solution to overcome the limitations of electric vehicle battery capacity and “range anxiety.” Thus, electric vehicles can recharge while in motion, maintaining continuous operation and alleviating concerns about extended charging times and restricted travel ranges, thereby paving the way for innovative developments in charging infrastructure [32]. The ongoing research into WPT solidifies its role as a key technology for the future of energy and transportation systems.
As urbanization progresses rapidly, the rate of cable deployment in non-direct buried urban distribution networks has also significantly increased, presenting substantial challenges to grid operation and maintenance (O&M). In the development of smart wireless cities, front-end monitoring technologies based on the Internet of Things (IoT) offer solutions for grid O&M. The energy supply for traditional distribution cable monitoring devices primarily relies on wired methods. However, this approach makes wired power systems vulnerable to external environmental threats due to challenges such as narrow and complex path environments, weak power and communication signals, high demands for economic viability, the need for precise timing in state control, and significant regional dispersion. This vulnerability hinders the timely detection and early warning of potential cable channel faults, posing a serious risk to network reliability [33]. Therefore, there is an urgent need to explore efficient and reliable wireless power transfer solutions to support the needs of future smart distribution grids.
In summary, the WPT system can be categorized into three concepts according to the technology, transmission, and applications: (1) near-contact or near-field WPT using electrical and/or magnetic induction, (2) mid-range WPT using coupled resonant circuits, and (3) far-field WPT using the microwave on RF rectifying circuits. Table 1 below gives a summary of the three WPT technologies [34,35,36,37,38].
In the complex underground environments of non-direct buried distribution cables, electromagnetic interference exists between the cables and the signals transmitted by front-end devices. Microwave power transmission is not considered due to its potential for electromagnetic interference and the excessive size of antennas. The main difference between inductive wireless charging and resonant wireless charging lies in the presence or absence of resonance between the coil’s inductance and capacitance. Inductive wireless charging, due to its non-resonant nature resulting in shorter charging distances, is also not considered [39,40,41,42,43]. Therefore, this paper focuses on the study of resonant wireless power transfer technology.
In resonant wireless power transfer (WPT) systems, coil resistance has a significant impact on the system’s power and efficiency. An increase in coil resistance can lead to a notable decrease in system efficiency, particularly when the coils are fabricated from materials with inferior conductivity [44]. The use of conductive materials with low resistivity, such as copper, for coil manufacturing can mitigate coil losses. Nonetheless, this mitigation is constrained by the skin effect, especially in coils of large dimensions, which markedly diminishes the system’s efficiency. However, the application of Litz wire can effectively lessen the skin effect; its thickness and rigidity render it unsuitable for small-sized coils, thus constraining its use in portable devices [45]. Innovations such as textile technologies and the deployment of metamaterials by optimizing coil structure design and material selection have paved new pathways for reducing coil resistance and improving efficiency [46]. Nevertheless, these approaches face their own set of challenges, including the electrical resistance of conductive materials used in textile technologies and complex manufacturing processes, alongside the necessity for further exploration into the practical applications of metamaterials [47,48,49]. Reference [50] delves into the influence of geometric parameters, such as coil dimensions, turn count, inter-planar spacing, and wire diameter, on the efficiency of periodic flat spiral coil WPT systems, with a particular focus on the skin effect’s impact. Analytical methods were promptly employed to ascertain critical parameters like system power and efficiency, whilst a parametric finite element model refined the computation process. This methodology streamlines modeling and hastens problem resolution, enabling straightforward parameter adjustments to yield novel outcomes, thus offering an effective resolution for designing WPT systems for the charging of mobile devices.
In the dynamics of systems, especially when resonance plays a crucial role, the emergence of chaos phenomena highlights the importance of temporal resolution. This led to the development of innovative techniques like SAC-DM, which diverge from traditional frequency-domain analysis to offer deep insights into the complex dynamics of fields such as nuclear physics and quantum transport via a focus on time-domain analysis [51,52,53]. Initially demonstrated in the research of Brushless DC motors, the utility of SAC-DM quickly expanded to areas like wireless power transfer and smart sensing, becoming a powerful tool for unveiling chaotic behaviors. Beyond SAC-DM, the field of time series analysis has evolved to incorporate various methods for exploring chaos within systems, including Phase Space Reconstruction, Mutual Information, False Nearest Neighbors, and Spectral Analysis. These approaches collectively enhance our understanding of chaotic phenomena in time series data, marking a significant shift towards employing chaos theory in the analysis of complex system dynamics.
This paper investigates wireless power supply technology for smart sensing devices attached to non-direct buried distribution cables. Based on the fundamental principles of resonant wireless power transfer (WPT) technology, a mutual inductance model of the wireless power supply device is established. Using theoretical analysis, the characteristics of power-frequency splitting characteristics and efficiency-frequency splitting characteristics of the wireless power supply technology are proposed. On this basis, a wireless power transfer system model at 100 kHz is constructed. By altering the system’s equivalent load and coupling coefficient and employing various signal analysis methodologies, the response curves of the system’s output power and transmission efficiency under different parameters were analyzed. This research utilized graphical software and computational programming for simulation modeling and calculation, validating the correctness of the discussed power-frequency splitting and efficiency-frequency splitting characteristics from multiple perspectives, thus providing theoretical support for system design.

2. Principle of WPT Technology

The front-end sensing devices are powered using a resonant energy transfer method. Based on the theory of mutual inductance in circuits, a series-series (S-S) resonant equivalent circuit for the wireless power transfer system is established with two coils, as shown in Figure 1:
In the above Figure 1, US is the ideal power electronic high-frequency power supply (no internal resistance), C1 and C2 are the primary and secondary side equivalent compensation capacitors, and L1 and L2 are the self-inductance of the transmitting and receiving coils, respectively. Define R1 as the primary-side coil resistance and R2 as the secondary-side coil resistance. i1 and i2 are the currents in the transmitting and receiving circuits, respectively; RL is the secondary-side equivalent load, and M is the mutual inductance between the two coils.
According to Figure 1, the loop equation for the series-series (s-s) resonant circuit is obtained.
U · S = I 1 · ( R 1 + j X 1 ) I 2 · j X M
0 = I 2 · R 2 + R L + j X 2 I 1 · j X M
Among Equations (1) and (2), X1 = ωL1 − 1/ωC1 and X2 = ωL2 − 1/ωC2 are the series of the resonant reactance of the primary and secondary sides, respectively, hereafter referred to as resonant reactance. XM = ωM is the mutual inductive resistance between the two coils. By combining the equations, the primary and secondary circuit currents are, respectively, solved as
I 1 · = R 2 + R L + j X 2 U S · R 1 + j X 1 R 2 + R L + j X 2 + X M 2
I 2 · = j X M U S · R 1 + j X 1 R 2 + R L + j X 2 + X M 2
Output power and transmission efficiency, respectively, is
P o u t = X M 2 U S 2 R L R 1 R 2 + R L + X M 2 X 1 X 2 2 + R 1 X 2 + R 2 + R L X 1 2
η = X M 2 R L R 1 R 2 + R L + X M 2 X 1 X 2 2 + R 1 X 2 + R 2 + R L X 1 2 R 2 + R L 2 + X 2 2
When R1 = R2 = R, L1 = L2 = L, the primary and secondary side circuit structures are symmetrical, Equations (5) and (6) become
P o u t = X M 2 U S 2 R L R R + R L + X M 2 X r e 2 2 + X r e 2 2 R + R L 2
η = X M 2 R L R R + R L + X M 2 X r e 2 2 + X r e 2 2 R + R L 2 R + R L 2 + X r e 2
Among them, the resonant reactance Xre = ωL − 1/ωC. When the power source frequency is consistent with the system’s inherent resonant frequency, the resonant reactance Xre = 0, Equations (7) and (8) become
P o u t = X M 2 U S 2 R L R R + R L + X M 2 2
η = X M 2 R L R R + R L + X M 2 R + R L
Based on the operating principles of the wireless power transmission system for cable detection and power supply in distribution networks, this paper will further explore key issues, including the power-frequency splitting characteristic and the efficiency-frequency splitting characteristic in the mutual inductance model.

3. Power and Efficiency Characterizations

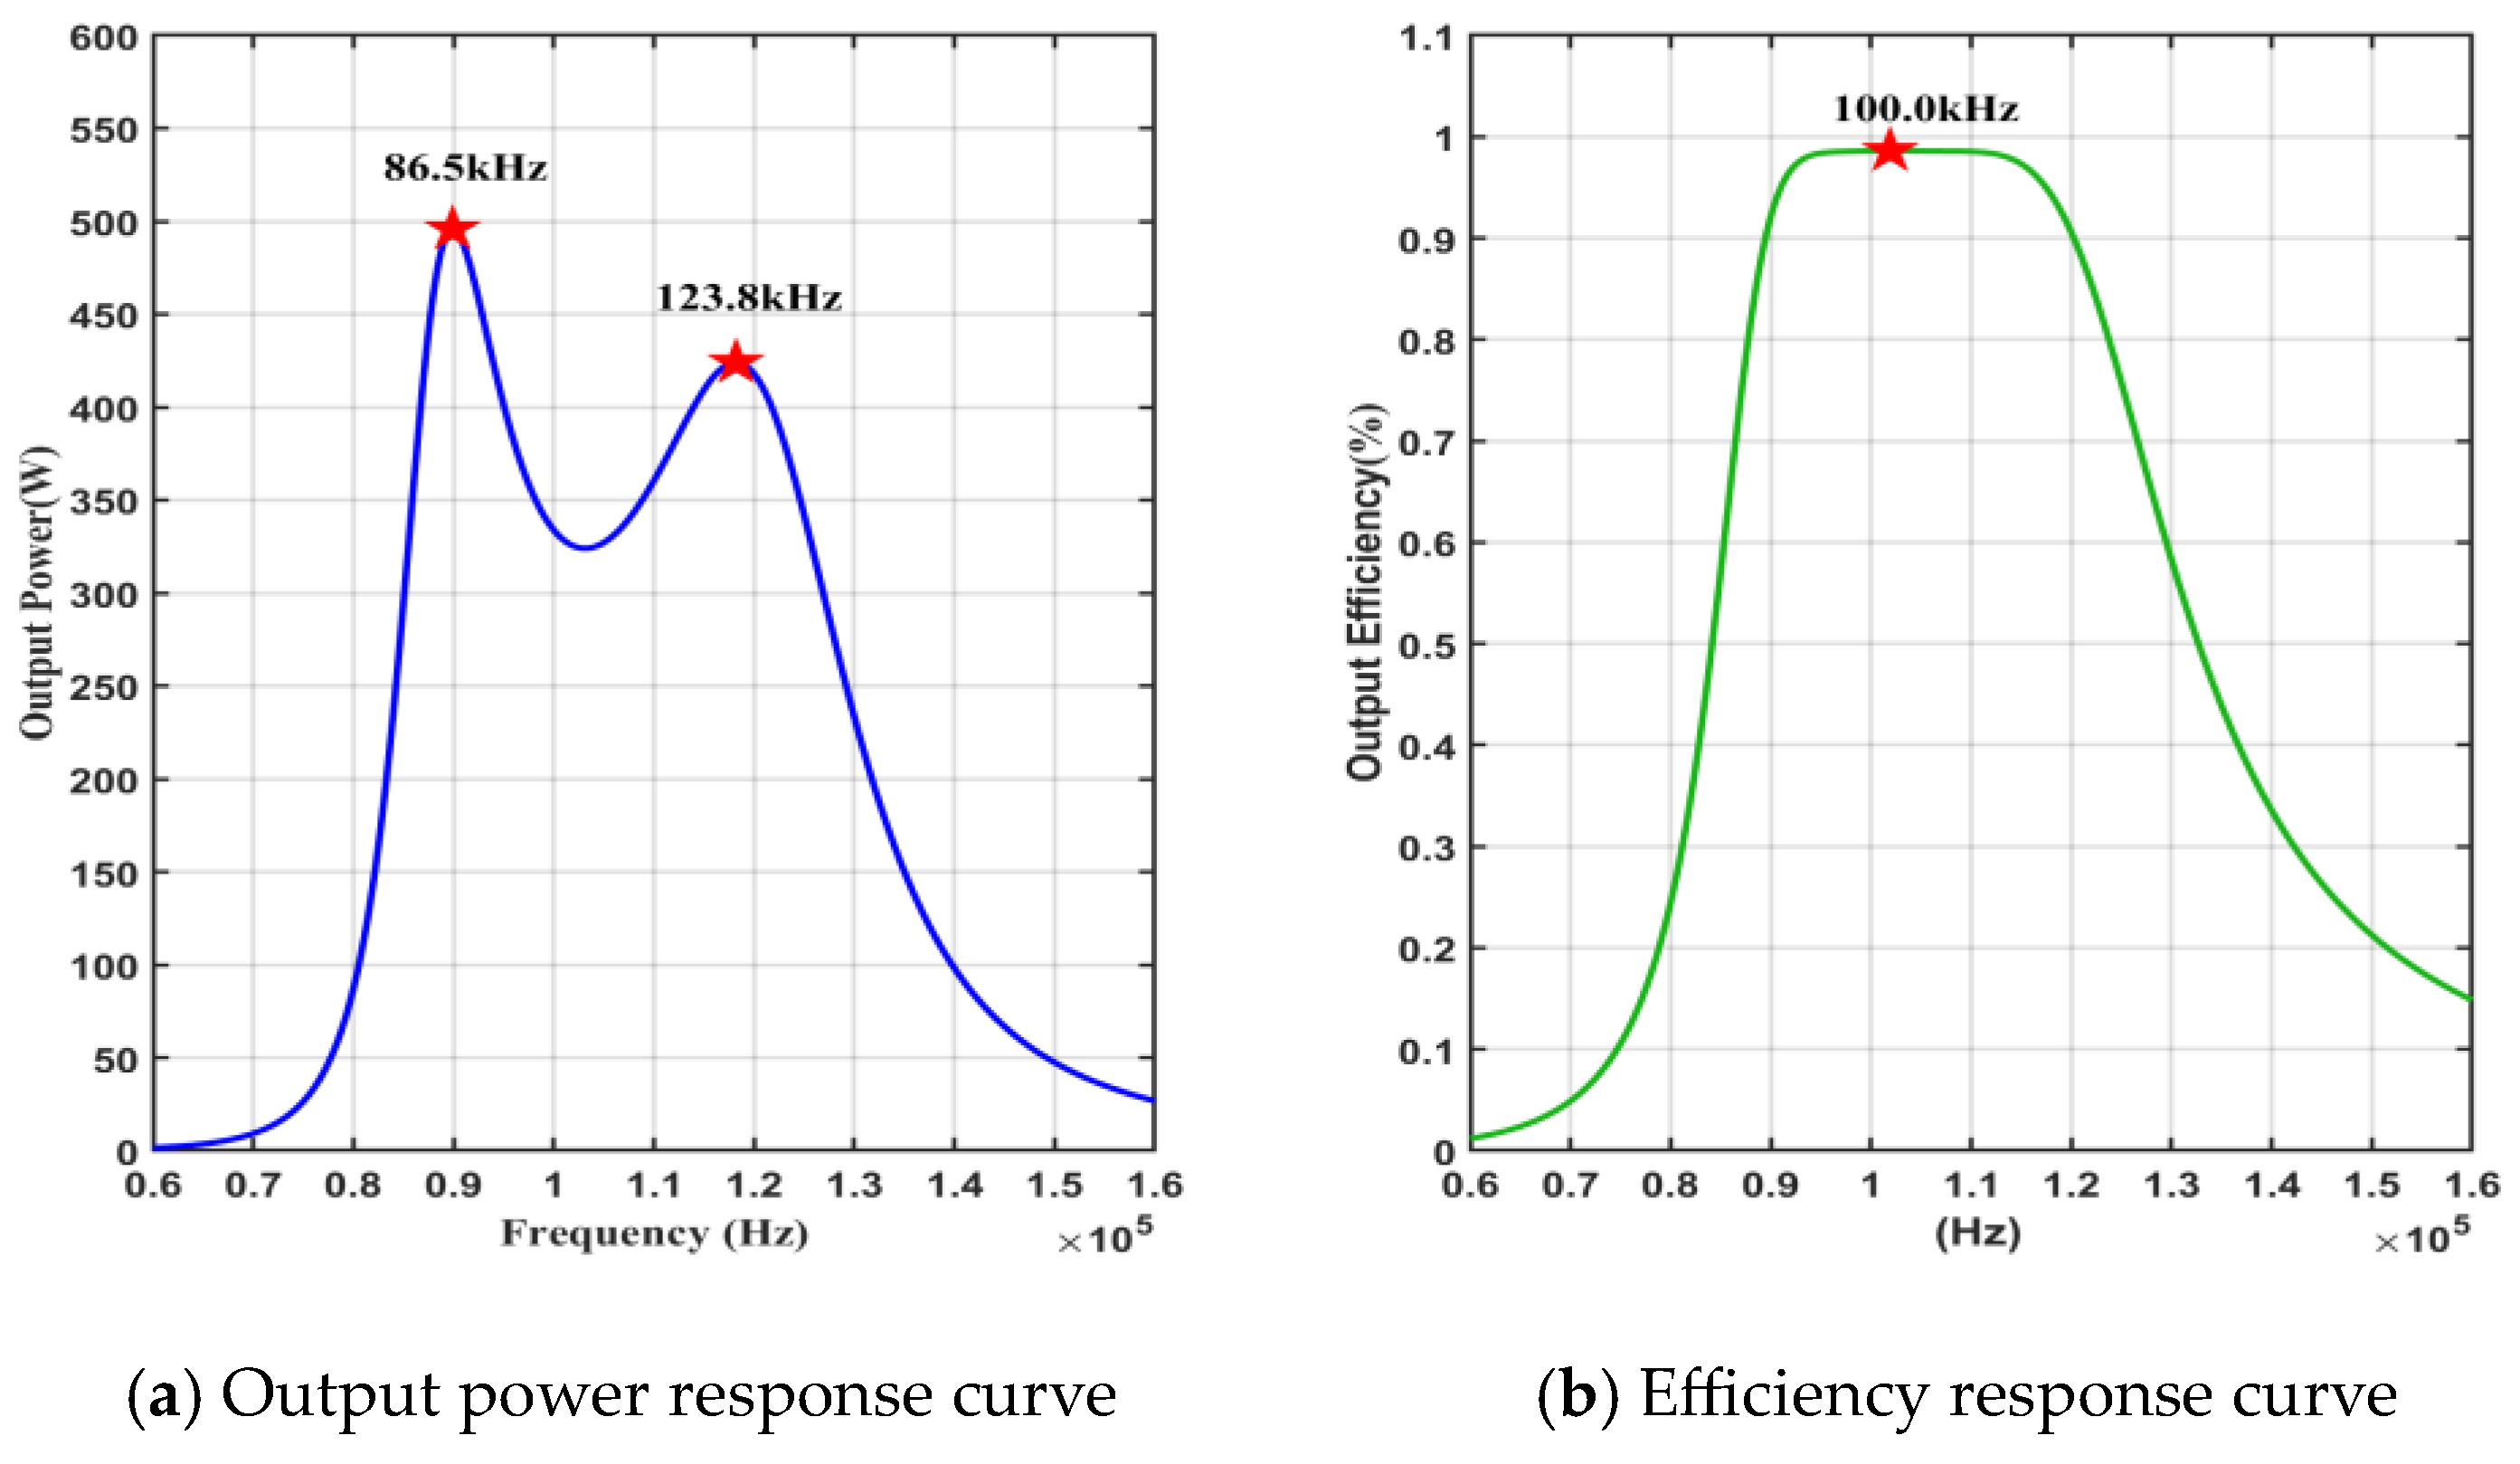
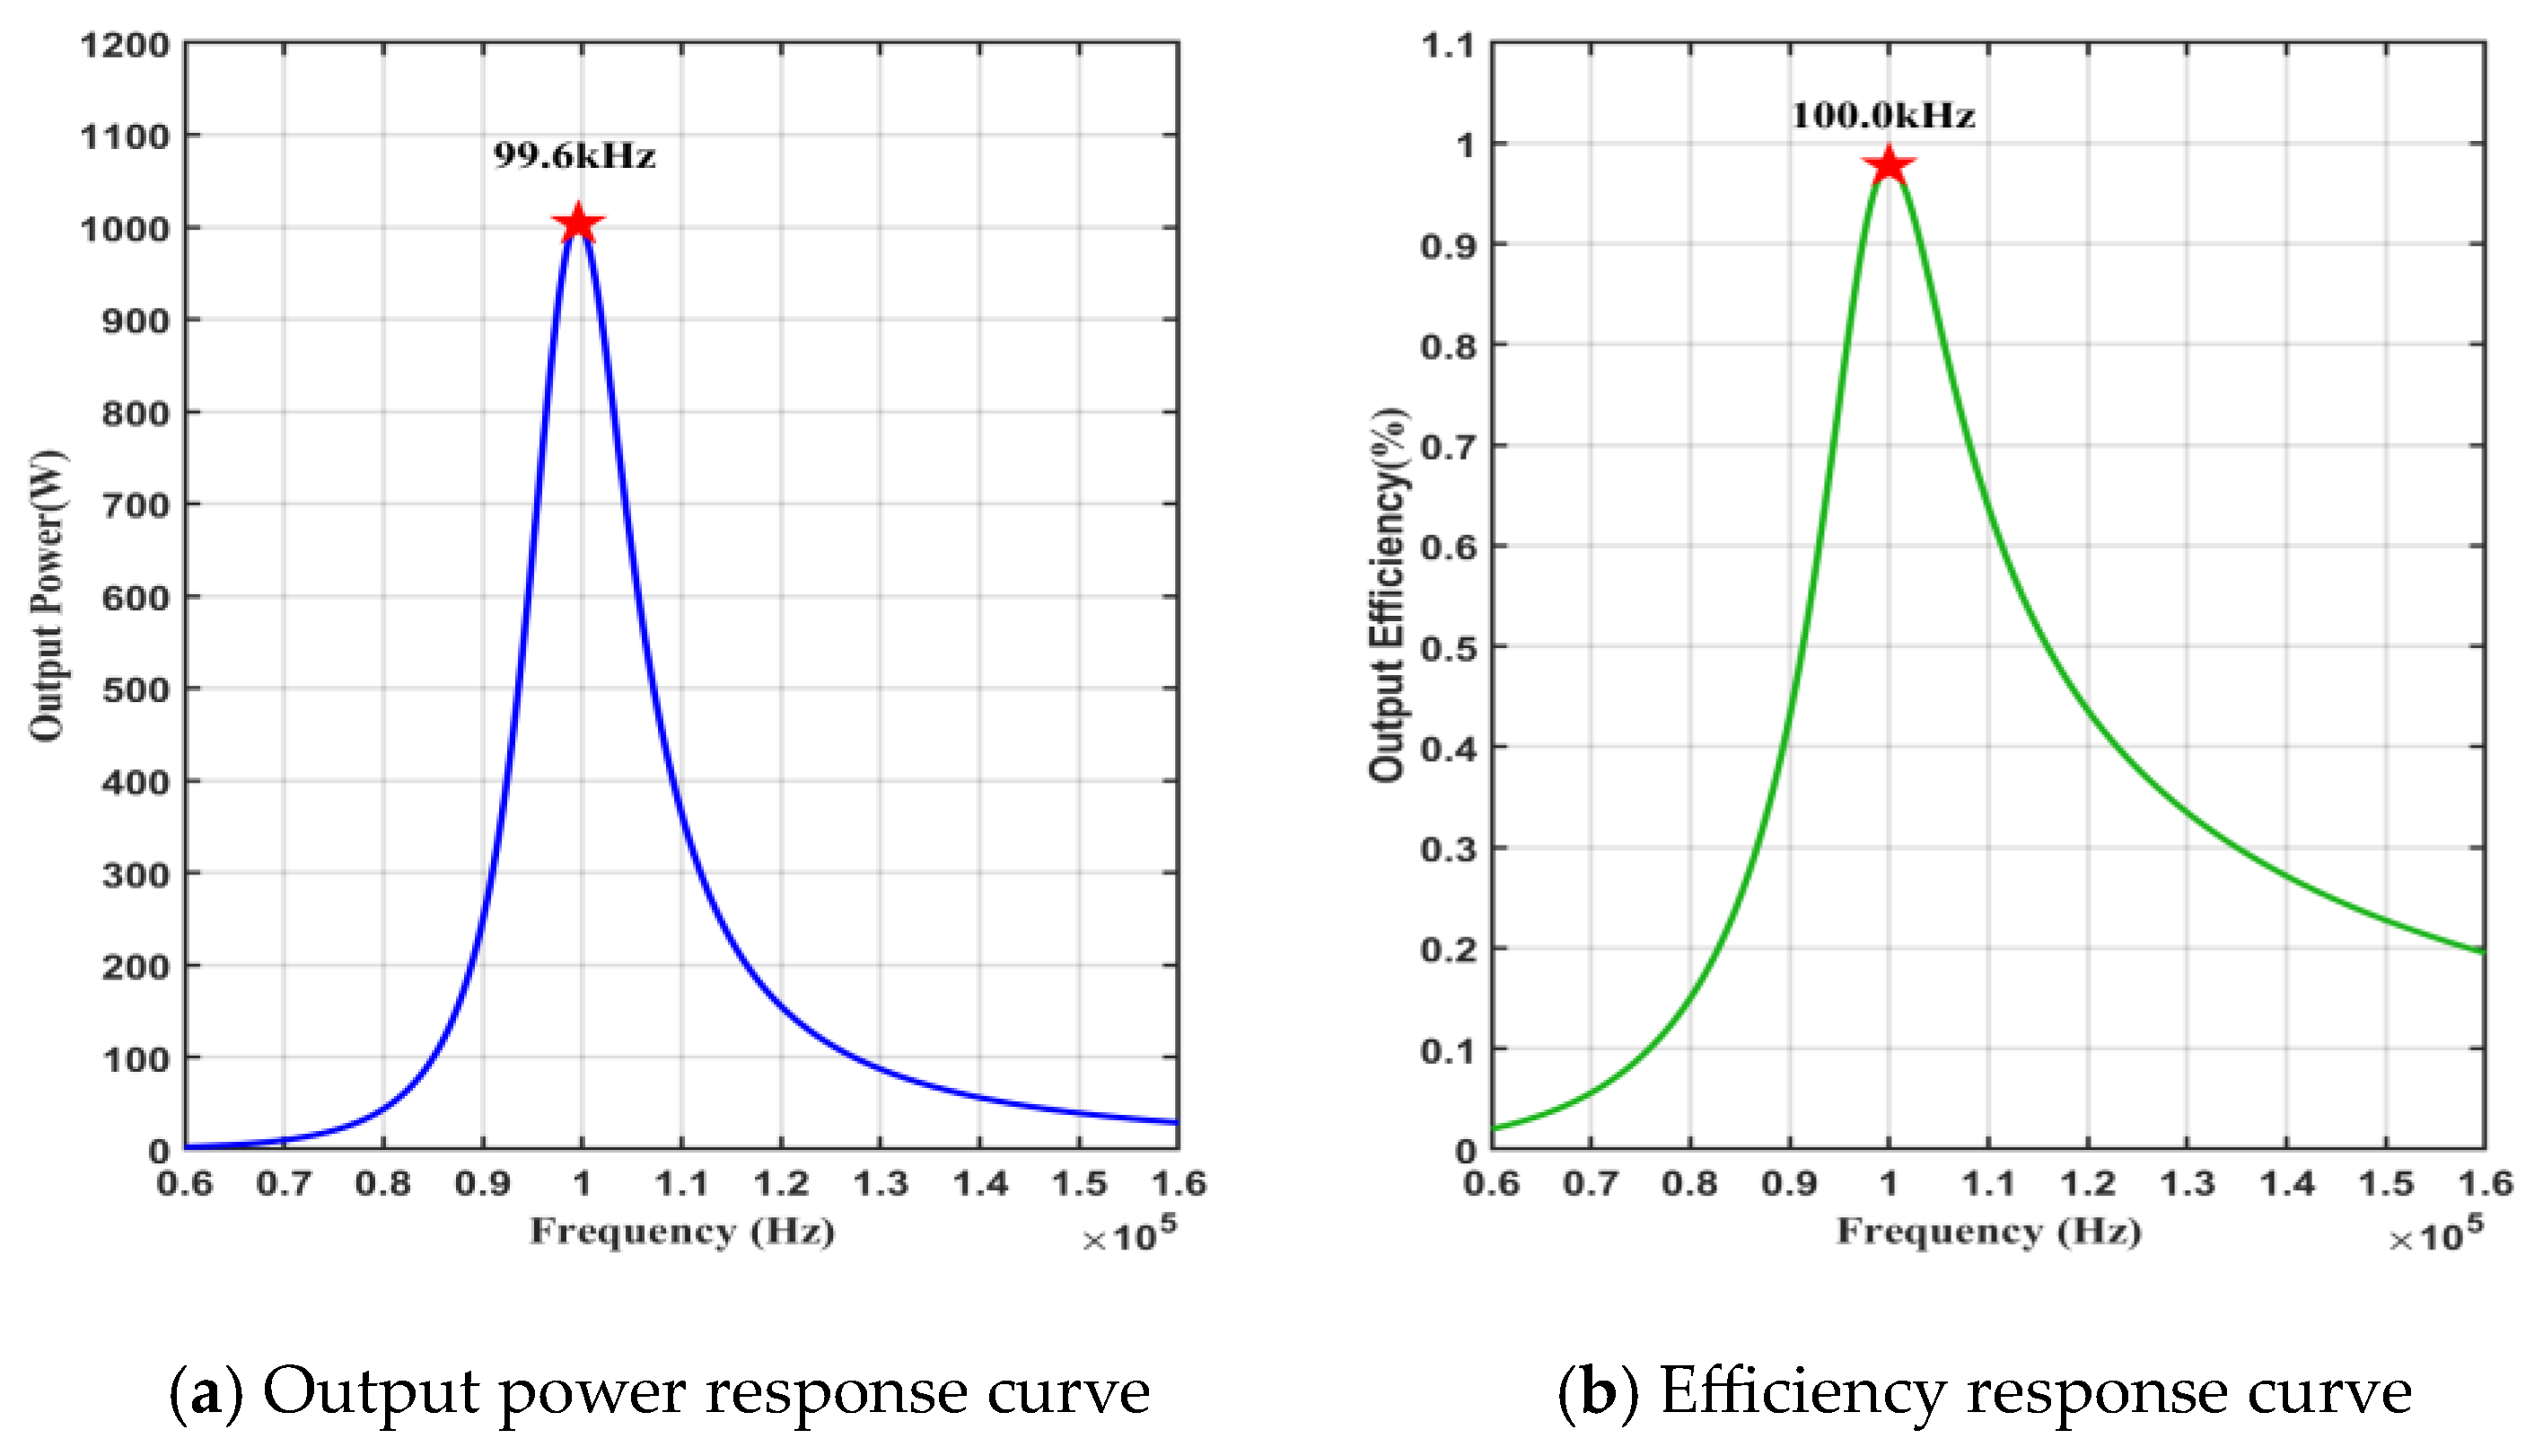
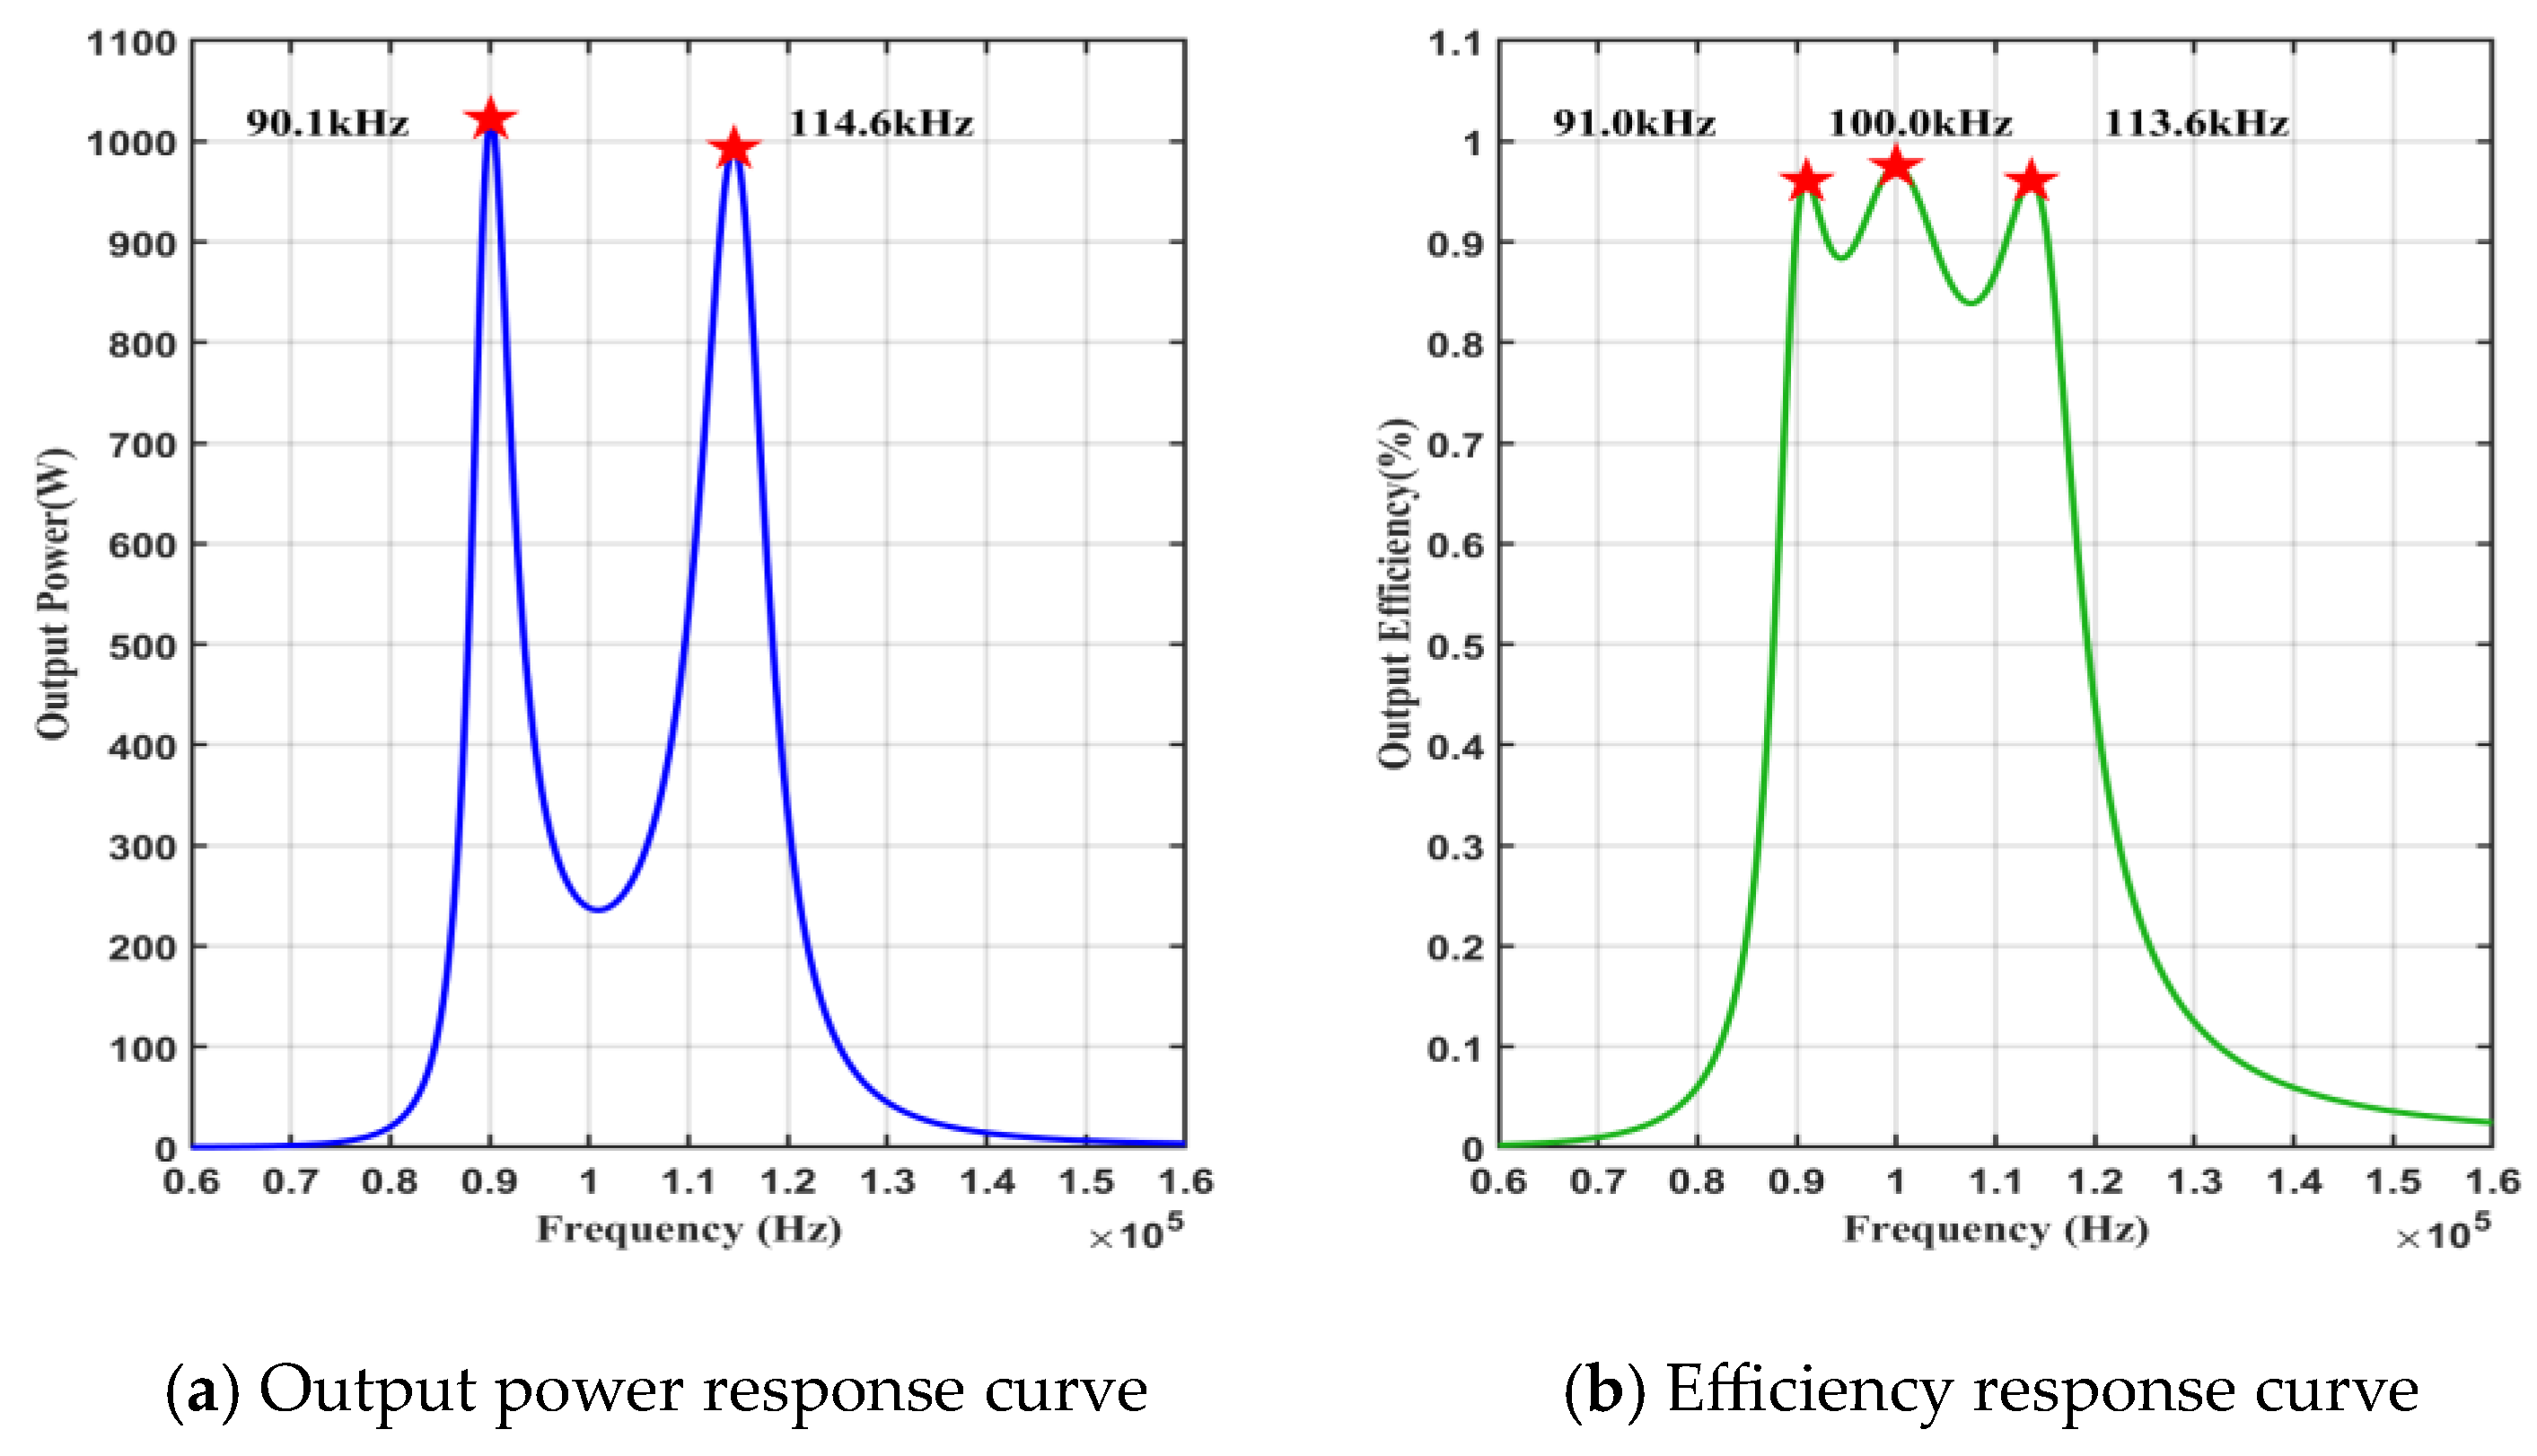
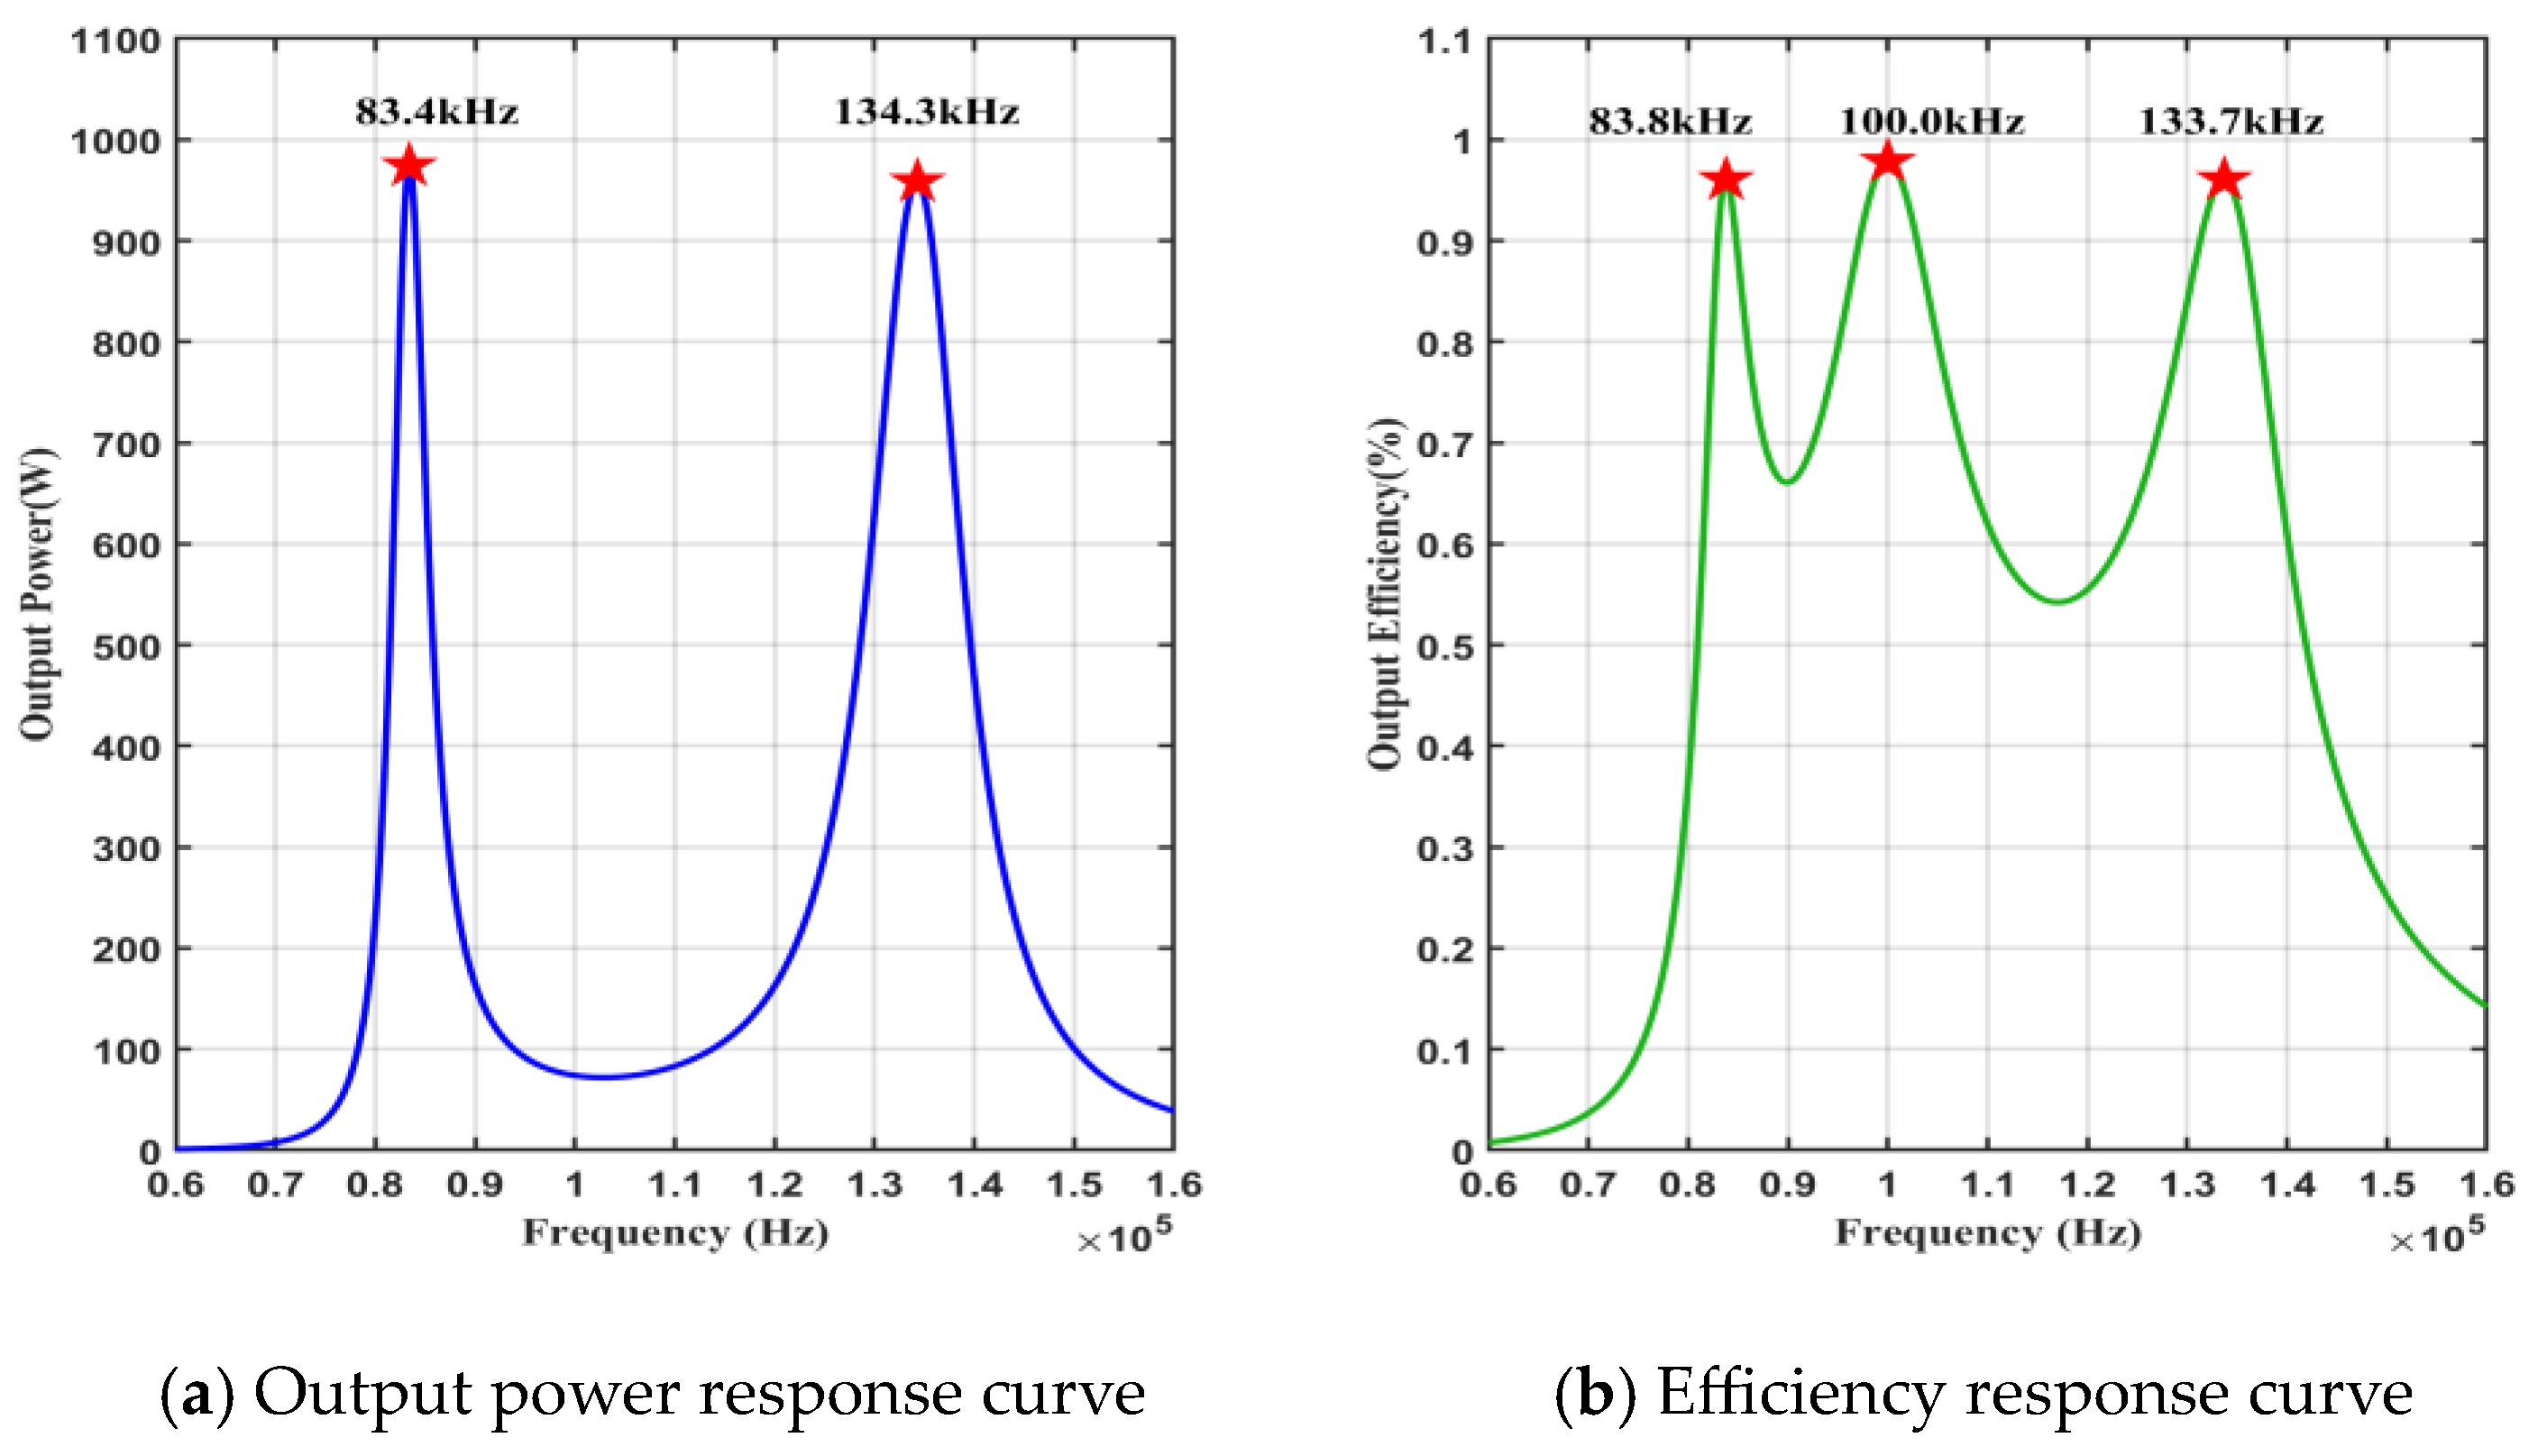
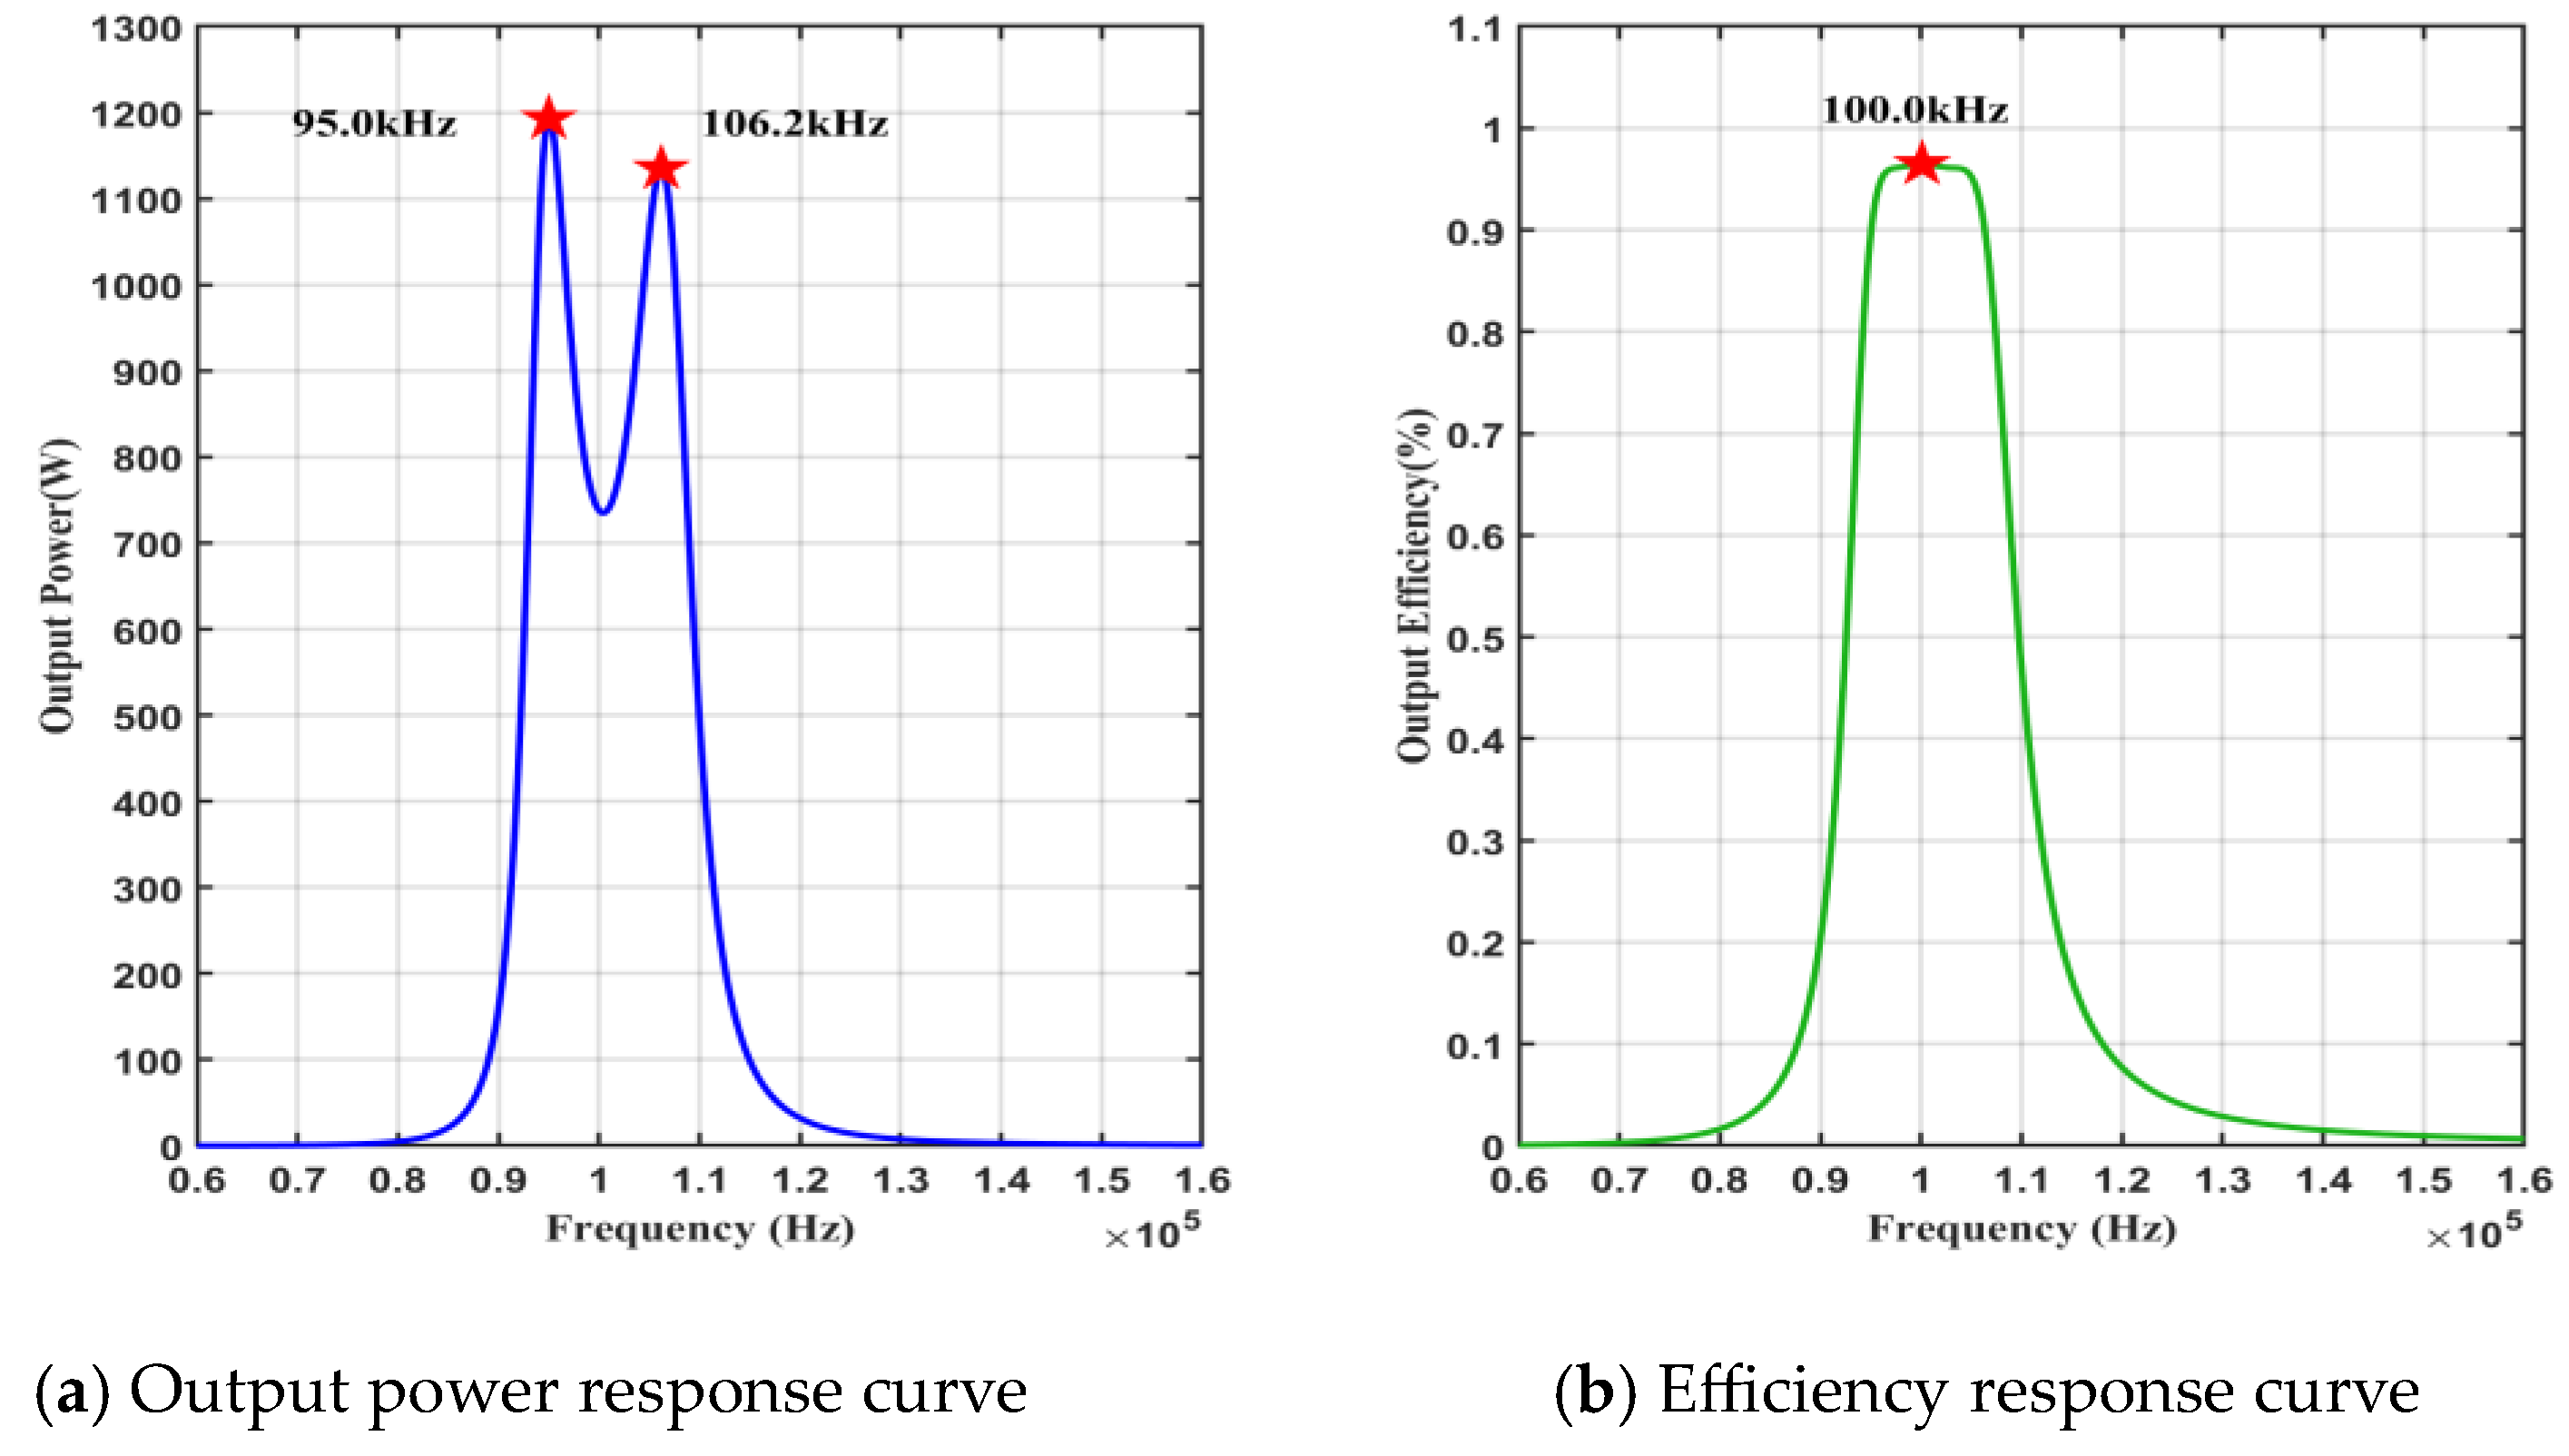
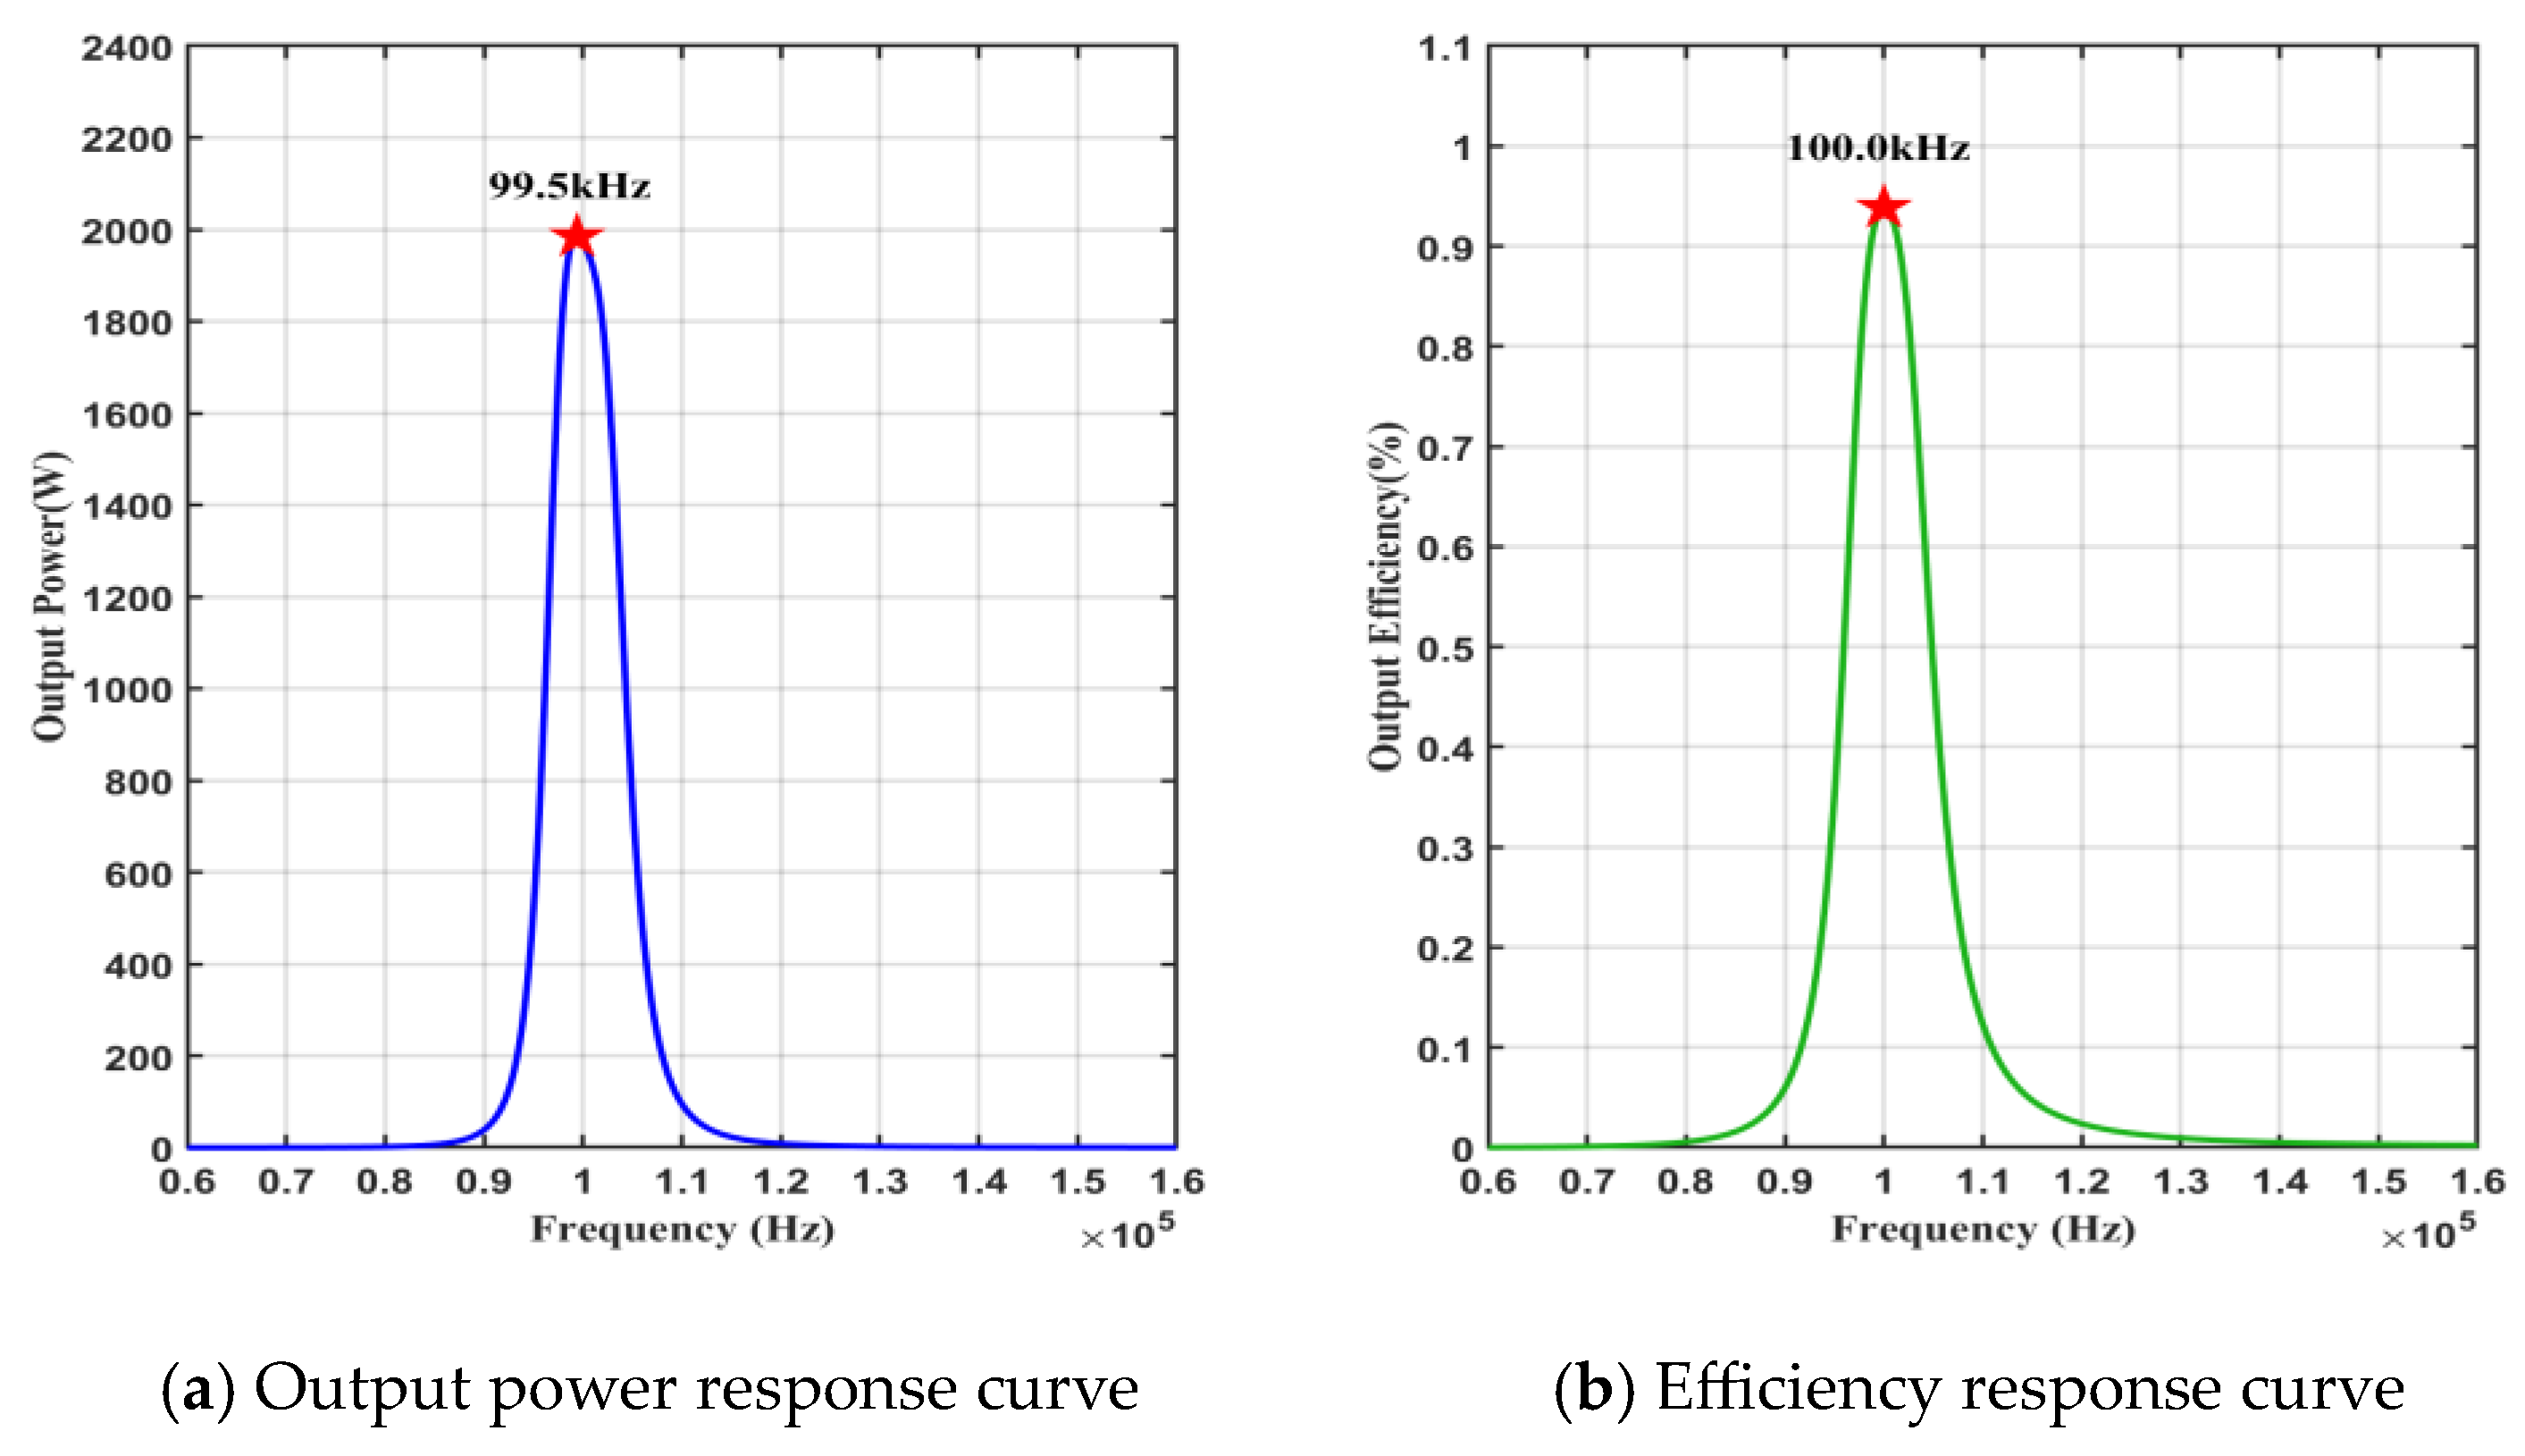
3.1. Power-Frequency Splitting Characteristics

Simulating the resonant wireless energy transmission system revealed that frequency splitting occurs at the point of maximum power in the over-coupled region. This phenomenon is defined as the power-frequency splitting characteristic here. A theoretical analysis of this phenomenon will be conducted next.
To simplify the analysis, assume that the primary and secondary circuit structures are symmetrical. When the power source frequency matches the system’s natural resonant frequency, the resonant reactance Xre = 0, Equation (9) can be deformed to
P o u t = U S 2 R L R R + R L X M + X M 2
According to the mean value inequality
P o u t = U S 2 R L R R + R L X M + X M 2 U S 2 R L 4 R R + R L
The condition for the equality to hold is
X M 2 = R R + R L
At this time, the system output power Pout achieves the maximum value. When the resonant reactance Xre 0, the output power value Pout is shown as Equation (13). In the Equation (13), the resonant reactance Xre and mutual inductive resistance XM are functions of the resonant angular frequency ω. If the Equation (7) is directly differentiated with respect to the ω, the calculation becomes quite complex. An indirect derivation idea is given here, Equation (7) can be transformed into
P o u t = U S 2 R L R R + R L + X M 2 X r e 2 2 X M 2 + X r e 2 2 R + R L 2 X M 2
Assume that the binary function
F P X r e , X M = R R + R L + X M 2 X r e 2 2 X M 2 + X r e 2 2 R + R L 2 X M 2
We have
R R + R L + X M 2 X r e 2 = 2 R + R L 2 2
After numerical calculations, it is found that the resonant frequency solved from the above equation satisfies the maximum power operating point under non-ideal resonance. Substituting the resonant reactance Xre and mutual inductive reactance XM into Equation (15) and simplifying the equation for the resonant angular frequency ωp satisfying the equation is obtained.
ω p 4 L 2 M 2 C 2 + ω p 2 R 2 + R R L + 0.5 R L 2 C 2 2 L C + 1 = 0
The above equation is called the power-frequency splitting equation under the non-ideal resonance. Solving this equation can get the two resonant angular frequencies ωp1 and ωp2, corresponding to the maximum value of the system’s output power under the non-ideal resonance state, where the power-frequency splitting equation has a solution provided that the equation
Δ p = R 2 + R R L + 0.5 R L 2 C 2 2 L C 2 4 L 2 M 2 C 2 0
Solving Equation (17), it can be obtained
2 1 Q 0 2 + 1 Q 0 Q L + 1 2 Q L 2 2 1 k 2
Among them
Q 0 = 1 R L C , Q L = 1 R L L C , k = M L
The solution to the Equation (16) is
ω p i 2 = 2 L C R 2 + R R L + 0.5 R L 2 C 2 2 L 2 M 2 C 2 ± R 2 + R R L + 0.5 R L 2 2 C 4 4 L C 3 R 2 + R R L + 0.5 R L 2 + 4 M 2 C 2 2 L 2 M 2 C 2
Among Equation (19), i = 1,2, ωp1 and ωp2 is the power-frequency splitting points under the non-ideal resonance of the resonant wireless energy transmission system, at which the maximum system output power can be achieved at this corner frequency. To represent the degree of power-frequency splitting of the system in the over coupling region, the power-frequency splitting bandwidth is defined as δωp. Let δωp = |ωp1ωp2|, from the Vedda’s theorem
ω p 1 2 + ω p 2 2 = 2 L C R 2 + R R L + 0.5 R L 2 C 2 L 2 M 2 C 2
ω p 1 2 ω p 2 2 = 1 L 2 M 2 C 2
δ ω p = ω p 1 2 + ω p 2 2 2 ω p 1 ω p 2 = 2 L C R 2 + R R L + 0.5 R L 2 C 2 C L 2 M 2 L 2 M 2 C 2
When the parameters of the resonant wireless power transmission system satisfy Equation (18), the frequency splitting at the maximum power point occurs in the over-coupling region. From Equation (22), it can be seen that the degree of frequency splitting at the end of maximum power is related to the coil quality factor, the equivalent load resistance on the secondary side, and the coupling coefficient of the two coils.

3.2. Efficiency-Frequency Splitting Characteristics

Similarly, when the parameters of the resonant wireless power transmission system meet certain conditions, frequency splitting also occurs at the point of maximum efficiency. This phenomenon is defined as the efficiency-frequency splitting characteristic. A theoretical analysis of this phenomenon will be conducted next.
When the structures of the primary and secondary circuits are symmetrical, and the power source frequency is consistent with the system’s natural resonant frequency, the resonant reactance Xre = 0, Equation (10) can be deformed as:
η = X M 2 R R L + R 3 + R X M 2   R L + 2 R 2 + X M 2
With the equivalent load resistance as the sole variable, according to the mean inequality, the point of maximum efficiency under ideal resonance is
R L 2 = R 2 + X M 2
When the resonant reactance Xre ≠ 0, the value of transmission efficiency η is shown in Equation (8). In the formula, the resonant reactance Xre and the mutual reactance XM are both functions of the resonant angular frequency ω. If Equation (8) is directly differentiated with respect to the resonant angular frequency ω, similar to Equation (7), the calculation is quite complex. To determine the point of maximum efficiency for the system under non-ideal resonance, the physical quantity of input impedance Zin is introduced. The expression for the input impedance Zin is
Z i n = U S · I 1 · = R 1 + j X 1 + X M 2 R 2 + R L + j X 2
Performing complex number operations on the above equation, we can obtained
Z i n = R 1 + X M 2 R 2 + R L R 2 + R L 2 + X 2 2 + j X 1 X M 2 X 2 R 2 + R L 2 + X 2 2
When the imaginary part of the input impedance Zin is 0, the system is purely resistive, and the power supply only provides active power. At this time, the transmission efficiency can reach the maximum value. If the primary and secondary side structure is symmetrical so that the imaginary part of the input impedance Zin is 0, there are
X r e X M 2 X r e R + R L 2 + X r e 2 = 0
Solving this equation involves two scenarios pertaining to the resonant reactance Xre = 0 and Xre ≠ 0. When the resonant reactance is Xre = 0, the power source frequency coincides with the system’s inherent resonant frequency, and the system operates in an ideal resonant state, achieving maximum transmission efficiency. In the case of resonant reactance Xre 0, there are
X M 2 = R + R L 2 + X r e 2
Equation (28) is the maximum efficiency operating point of the wireless energy transmission system at non-ideal resonance. Substituting the resonant reactance Xre = ωL − 1/ωC and the mutual inductive reactance XM = ωM into Equation (28) and simplifying, we can solve the equation for the resonant angular frequency ωη satisfying this equation:
ω η 4 L 2 M 2 C 2 + ω η 2 R + R L 2 C 2 2 L C + 1 = 0
Called the above equation for the non-ideal resonance of the efficiency-frequency Splitting equation, the equation can be solved for the system’s non-ideal resonance state under the maximum transmission efficiency value corresponding to the two resonance angular frequencies ωη1 and ωη2. Where the efficiency-frequency splitting equation has a solution provided that equation
Δ η = R + R L 2 C 2 2 L C 2 4 L 2 M 2 C 2 0
It can be obtained
2 1 Q 0 2 + 2 Q 0 Q L + 1 Q L 2 2 1 k 2
The solution to the Equation (29) is
ω η i = 2 L C R + R L 2 C 2 ± R + R L 4 C 4 4 L C 3 R + R L 2 + 4 M 2 C 2 2 L 2 M 2 C 2
Among them, i = 1,2, ωη1 and ωη2 is the frequency splitting point of the resonant wireless energy transmission system under the non-ideal resonance, and the system transmission efficiency can be maximized at this angular frequency. To represent the degree of effect frequency splitting of the system in the over-coupling region, the effect frequency splitting bandwidth is defined here as δωη. Let δωη = |ωη1ωη2|, from the Vedda’s theorem
ω η 1 2 + ω η 2 2 = 2 L C R + R L 2 C 2 L 2 M 2 C 2
ω η 1 2 ω η 2 2 = 1 L 2 M 2 C 2
δ ω η = ω η 1 2 + ω η 2 2 2 ω η 1 ω η 2 = 2 L C R + R L 2 C 2 C L 2 M 2 L 2 M 2 C 2
Frequency splitting at maximum efficiency occurs when the parameters of the system satisfy Equation (4). From Equation (35), it can be seen that the degree of frequency splitting at maximum efficiency is related to the coil quality factor, the equivalent load resistance on the secondary side, and the coupling coefficient of the two coils.

3.3. Synchronous Power-Efficiency Characteristics

As previously mentioned, in a resonant wireless power transmission system, frequency splitting occurs at the points of maximum power and maximum efficiency under conditions meeting the criteria of Equations (18) and (31), respectively. Importantly, the conditions for these two types of frequency splitting do not coincide with the same coupling coefficient. The extent of power-frequency and efficiency-frequency splitting can be quantified by the bandwidths (a) and (b), respectively, with wider bandwidths indicating a greater degree of frequency splitting.
Evidently, by examining Equations (19) and (32), it can be seen that the solutions for the points of power-frequency splitting and efficiency-frequency splitting share similarities, yet they are not identical; that is, the points of power-frequency splitting and efficiency-frequency splitting do not occur at the same angular frequency. To explore the consistency of the resonant angular frequencies at the system’s power-frequency splitting and efficiency-frequency splitting points, a power-efficiency synchronization coefficient ξ is introduced. In conjunction with the previous discussion, the power-efficiency synchronization coefficient can be expressed as
ξ = 2 1 Q 0 2 + 2 Q 0 Q L + 1 Q L 2 1 k 2 2 1 Q 0 2 + 1 Q 0 Q L + 1 2 Q L 2 1 k 2
From the above expression, it is apparent that the power-efficiency synchronization coefficient is related to the equivalent load on the secondary side, the quality factor of the coil, and the coupling coefficient between the two coils. An increase in the coupling coefficient and coil quality factor, as well as a decrease in the equivalent load, will all lead to an increase in the power-efficiency synchronization coefficient. This means that the points of power-frequency splitting and efficiency-frequency splitting are becoming increasingly “closer” to each other.

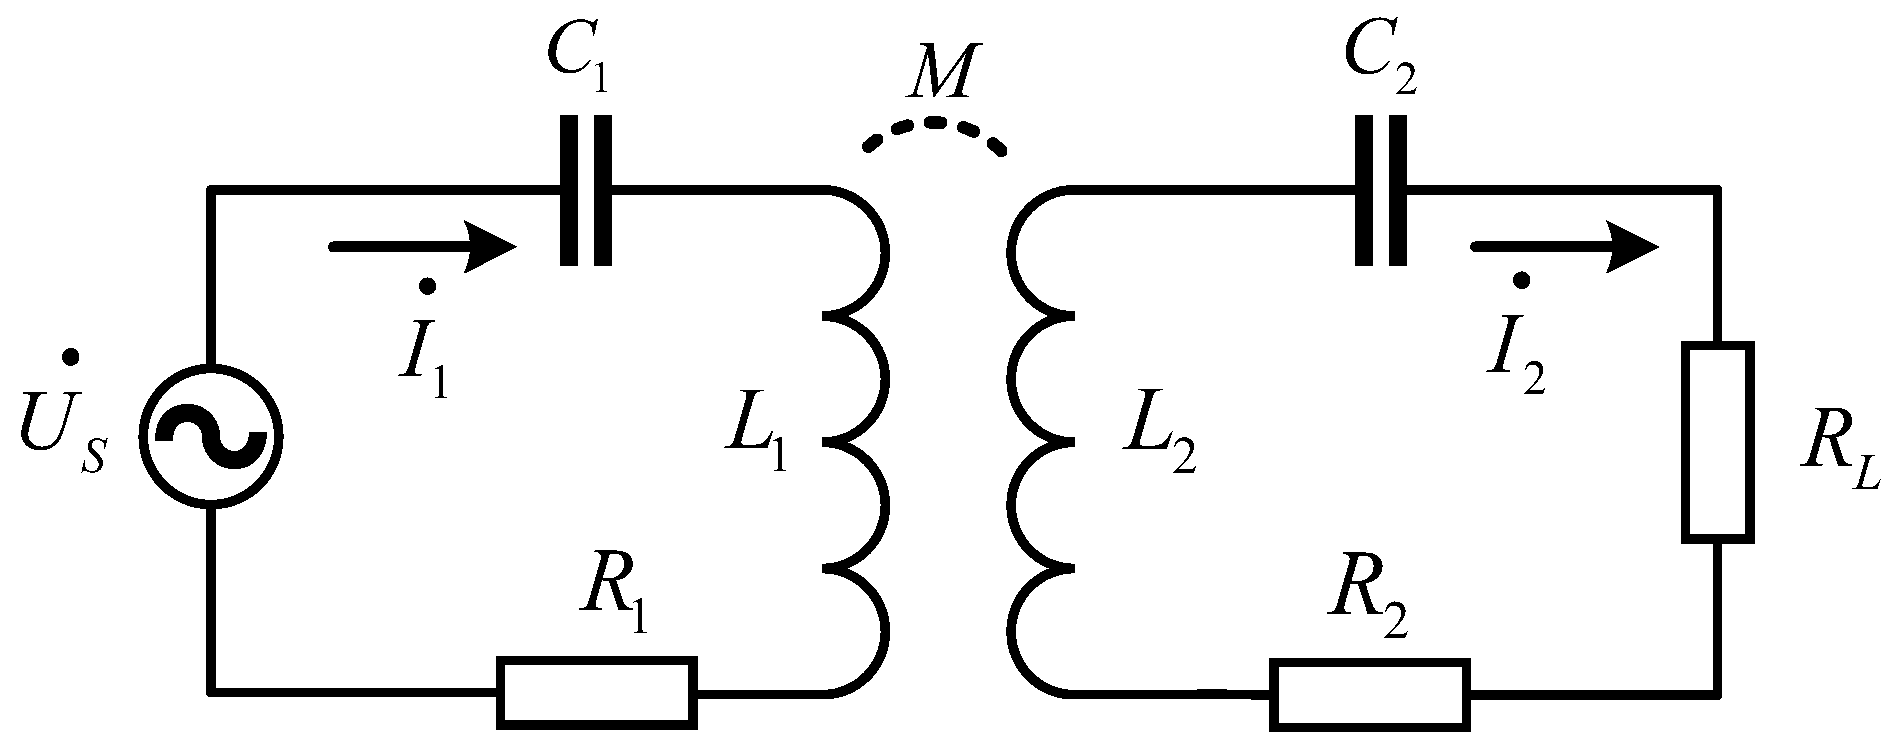
4. Parameter Analysis and Calculation of WPT Systems

4.1. Modeling and Simulation of WPT Systems

This study presents a resonant circuit model developed using MATLAB’s RF Toolbox (version 23.2.0.2365128 (R2023b)) to simulate wireless power delivery to sensors aimed at non-directly buried electrical distribution cables. Our model evaluates how changes in load resistance and coupling coefficients affect the output power and transmission efficiency, with the goal of optimizing the system.
The physical parameters of the simulation were established by assigning specific values to the circuit’s components, and the parameters of the wireless electric power transmission system for the sensing device are shown in Table 2. The ‘ode45’ solver in MATLAB (version 23.2.0.2365128 (R2023b)), with its adaptive step-size feature, effectively tackled the differential equations capturing the circuit’s dynamics, aligning the model’s degrees of freedom with the circuit’s electrical attributes for a detailed depiction. To preserve computational efficiency, we simplified the model by assuming ideal performance for components and overlooking minor losses, which do not substantially impact the key performance indicators. With the RF Toolbox, detailed modeling and parametric studies were conducted, focusing on the implications of varying load resistance and coupling coefficients. Utilizing the ‘rfparam’ function enabled the extraction of parameters and facilitated the analysis of the network’s response across different operational states. We presented the simulation outcomes, including the output power (Pout) and transmission efficiency (η), as functions of the supply frequency (f) using MATLAB’s plotting capabilities (version 23.2.0.2365128 (R2023b)). The Signal Processing Toolbox was also employed for filtering and noise analysis, underscoring the importance of signal integrity in practical environments. Integrating the evaluation of Lyapunov exponents into the analysis of frequency solution stability significantly enhances the reliability of research, especially in exploring chaotic behavior. Lyapunov exponents serve as a critical indicator of a system’s responsiveness to initial conditions by revealing its chaotic characteristics using the analysis of responses to slight disturbances. Implementing this analysis in MATLAB (version 23.2.0.2365128 (R2023b)) requires the use of the ode45 solver to numerically solve the system’s dynamic equations, thereby tracking the evolution of system states over time. Subsequently, when Lyapunov exponents are calculated from the obtained data, a positive exponent indicates the system’s chaotic dynamics, which is crucial for identifying its nonlinear dynamic behaviors. This method not only improves the representation of signal integrity in the model but also delves deeper into the system’s performance under specific chaotic conditions. Combining Lyapunov exponents with the ode45 solver for chaos analysis allows for more accurate capture of circuit dynamics, further investigating critical shifts in system performance and its underlying nonlinear dynamics, significantly enhancing the stability of frequency solutions in chaos analysis.
With an equivalent load resistance of RL = 2.3 Ω and coupling coefficient k = 0.35, the response curves of output power Pout and transmission efficiency η to the power supply frequency f are shown in Figure 2.
In Figure 2, the occurrence of frequency splitting is evident in both the output power and the transmission efficiency. The response curve of the output power to the power source frequency exhibits two peaks and one trough, where the peaks represent two distinct power-frequency splitting points, and the trough corresponds to the system’s inherent resonant frequency. The transmission’s efficiency response curve presents three peaks and two troughs, where the frequencies 86.9 kHz and 123.2 kHz represent two separate efficiency-frequency splitting points. The characteristic resonant frequency at 100.0 kHz corresponds to a transmission efficiency marginally higher than that at the efficiency-frequency splitting frequencies of 86.9 kHz and 123.2 kHz. Moreover, upon a comparison of graphs (a) and (b), it is evident that with a fixed equivalent load and coupling coefficient, the power-frequency splitting bandwidth δωp is broader than the efficiency-frequency splitting bandwidth δωη, signifying that the extent of power-frequency splitting is more pronounced than that of efficiency-frequency splitting. This observation holds significant implications for the design and optimization of wireless power transmission systems in scientific and engineering applications.
To investigate the relationship between the degree of power-frequency splitting, efficiency-frequency splitting, and the equivalent load coupling coefficient, the response curves of the output power and transmission efficiency to the power supply frequency are made for the fixed load, the variable coupling coefficient, and the fixed coupling coefficient and the variable load, respectively.

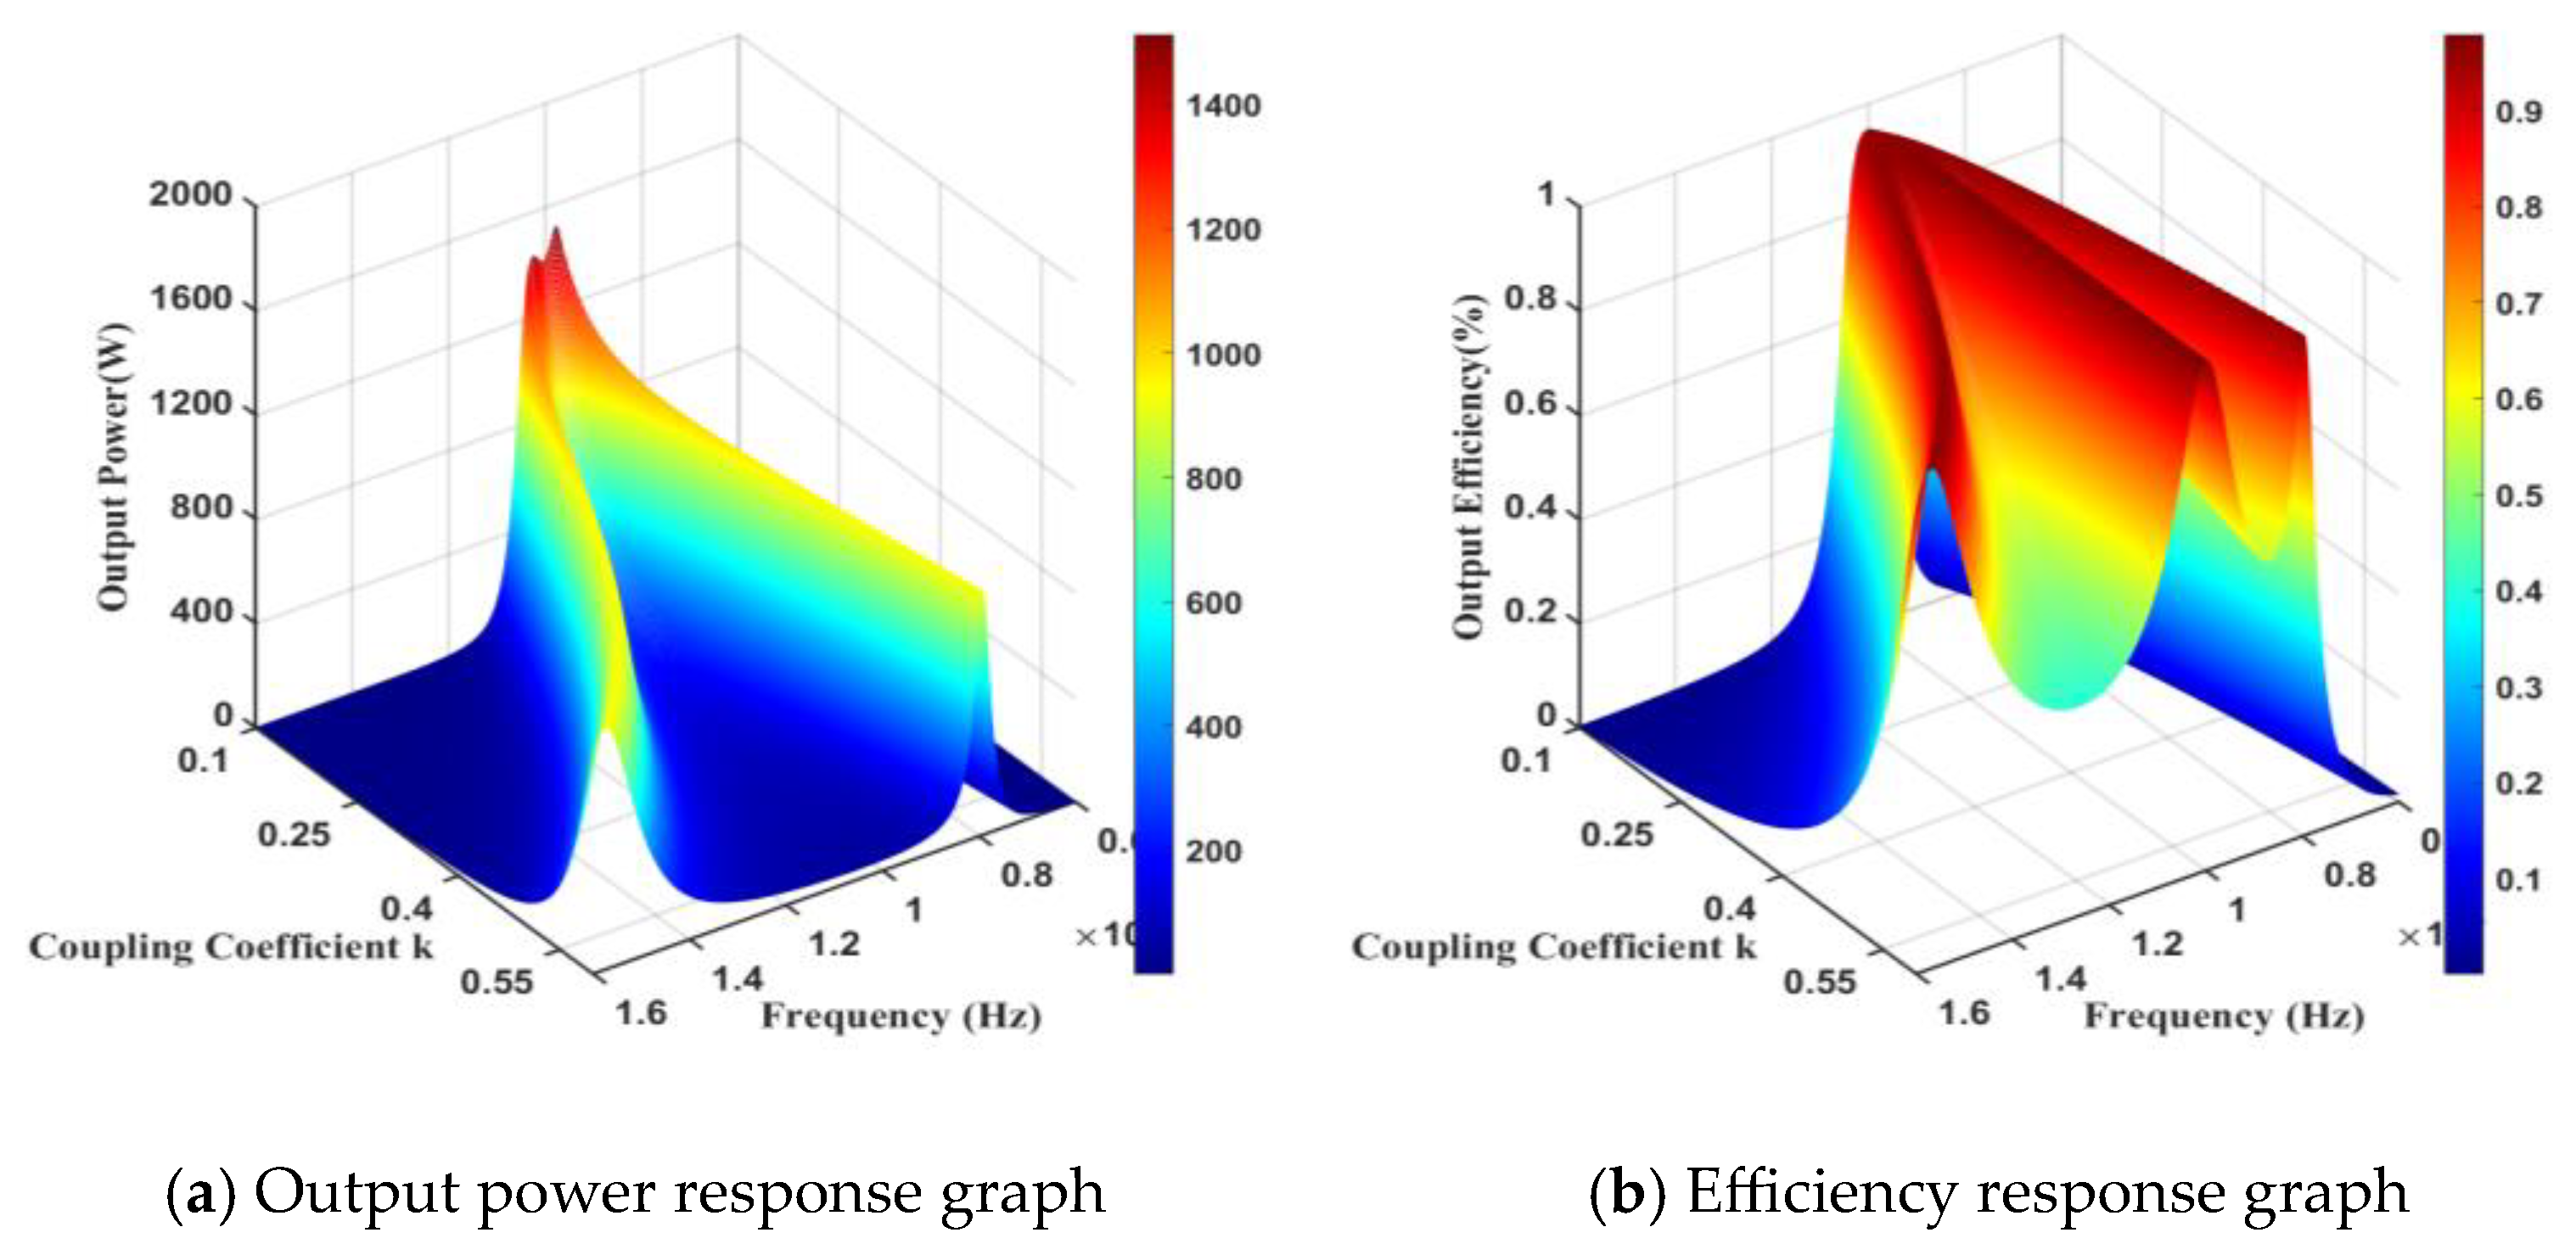
4.2. Effect of Equivalent Loads

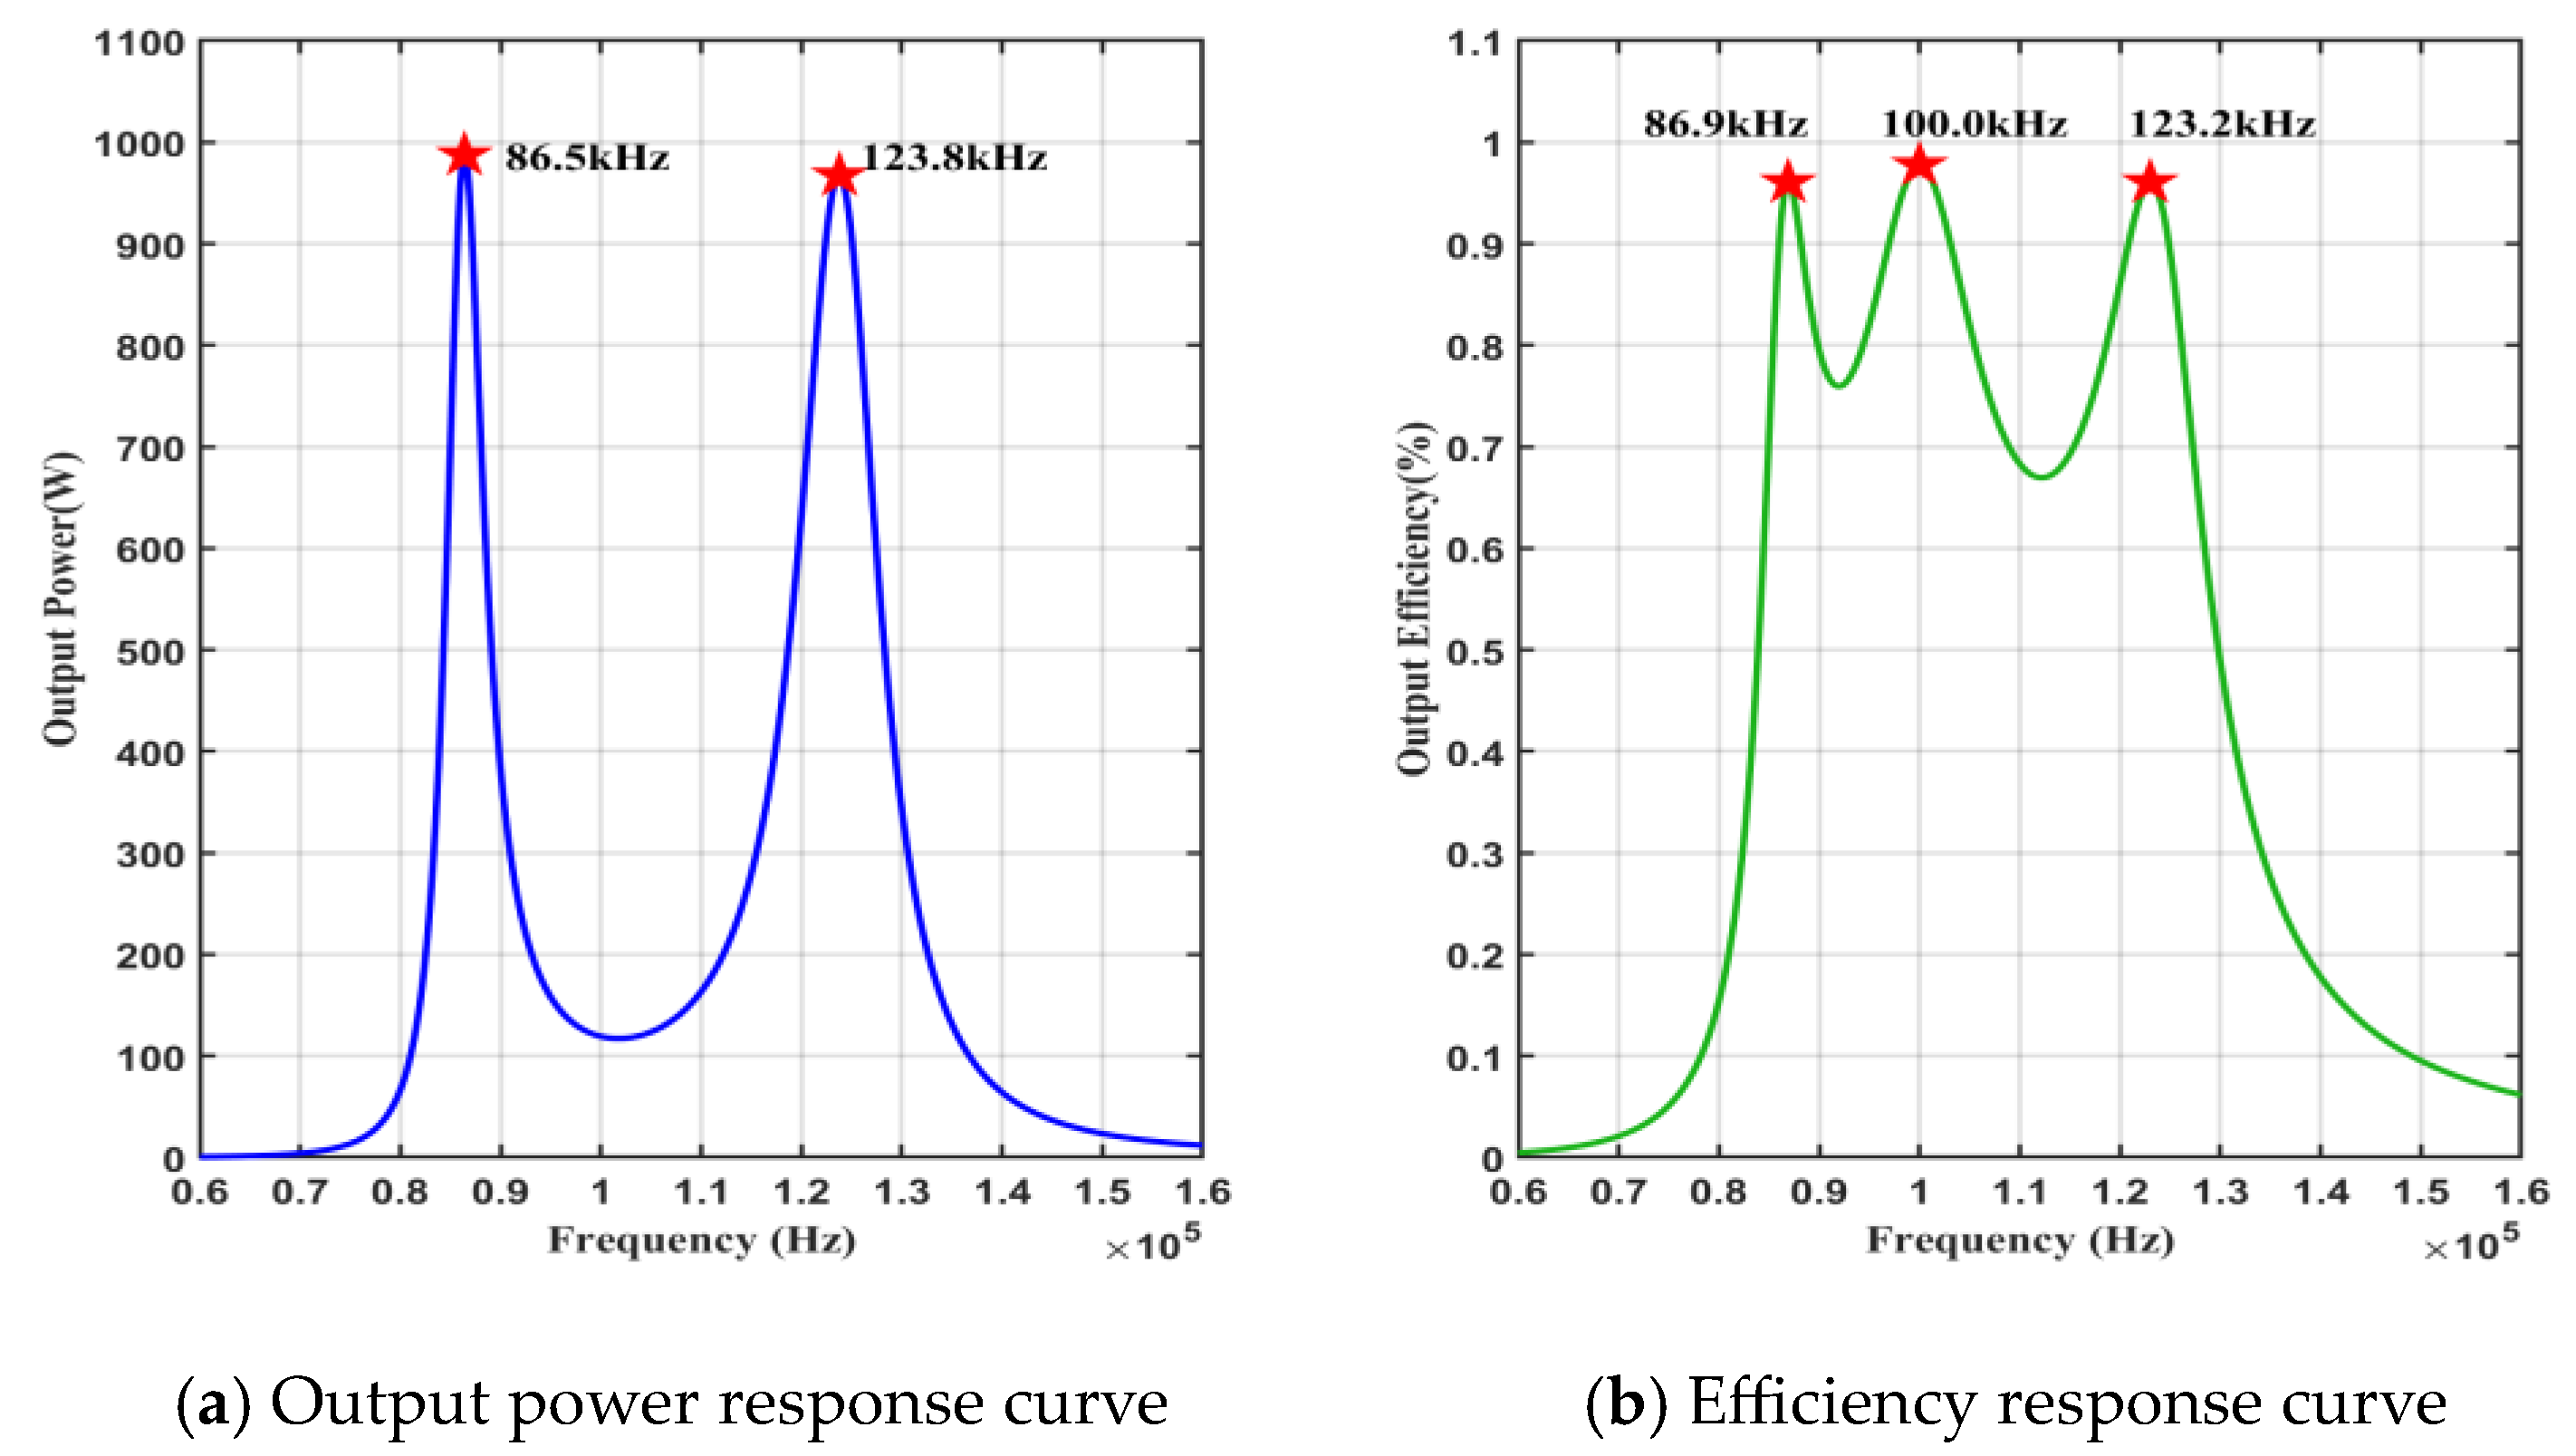
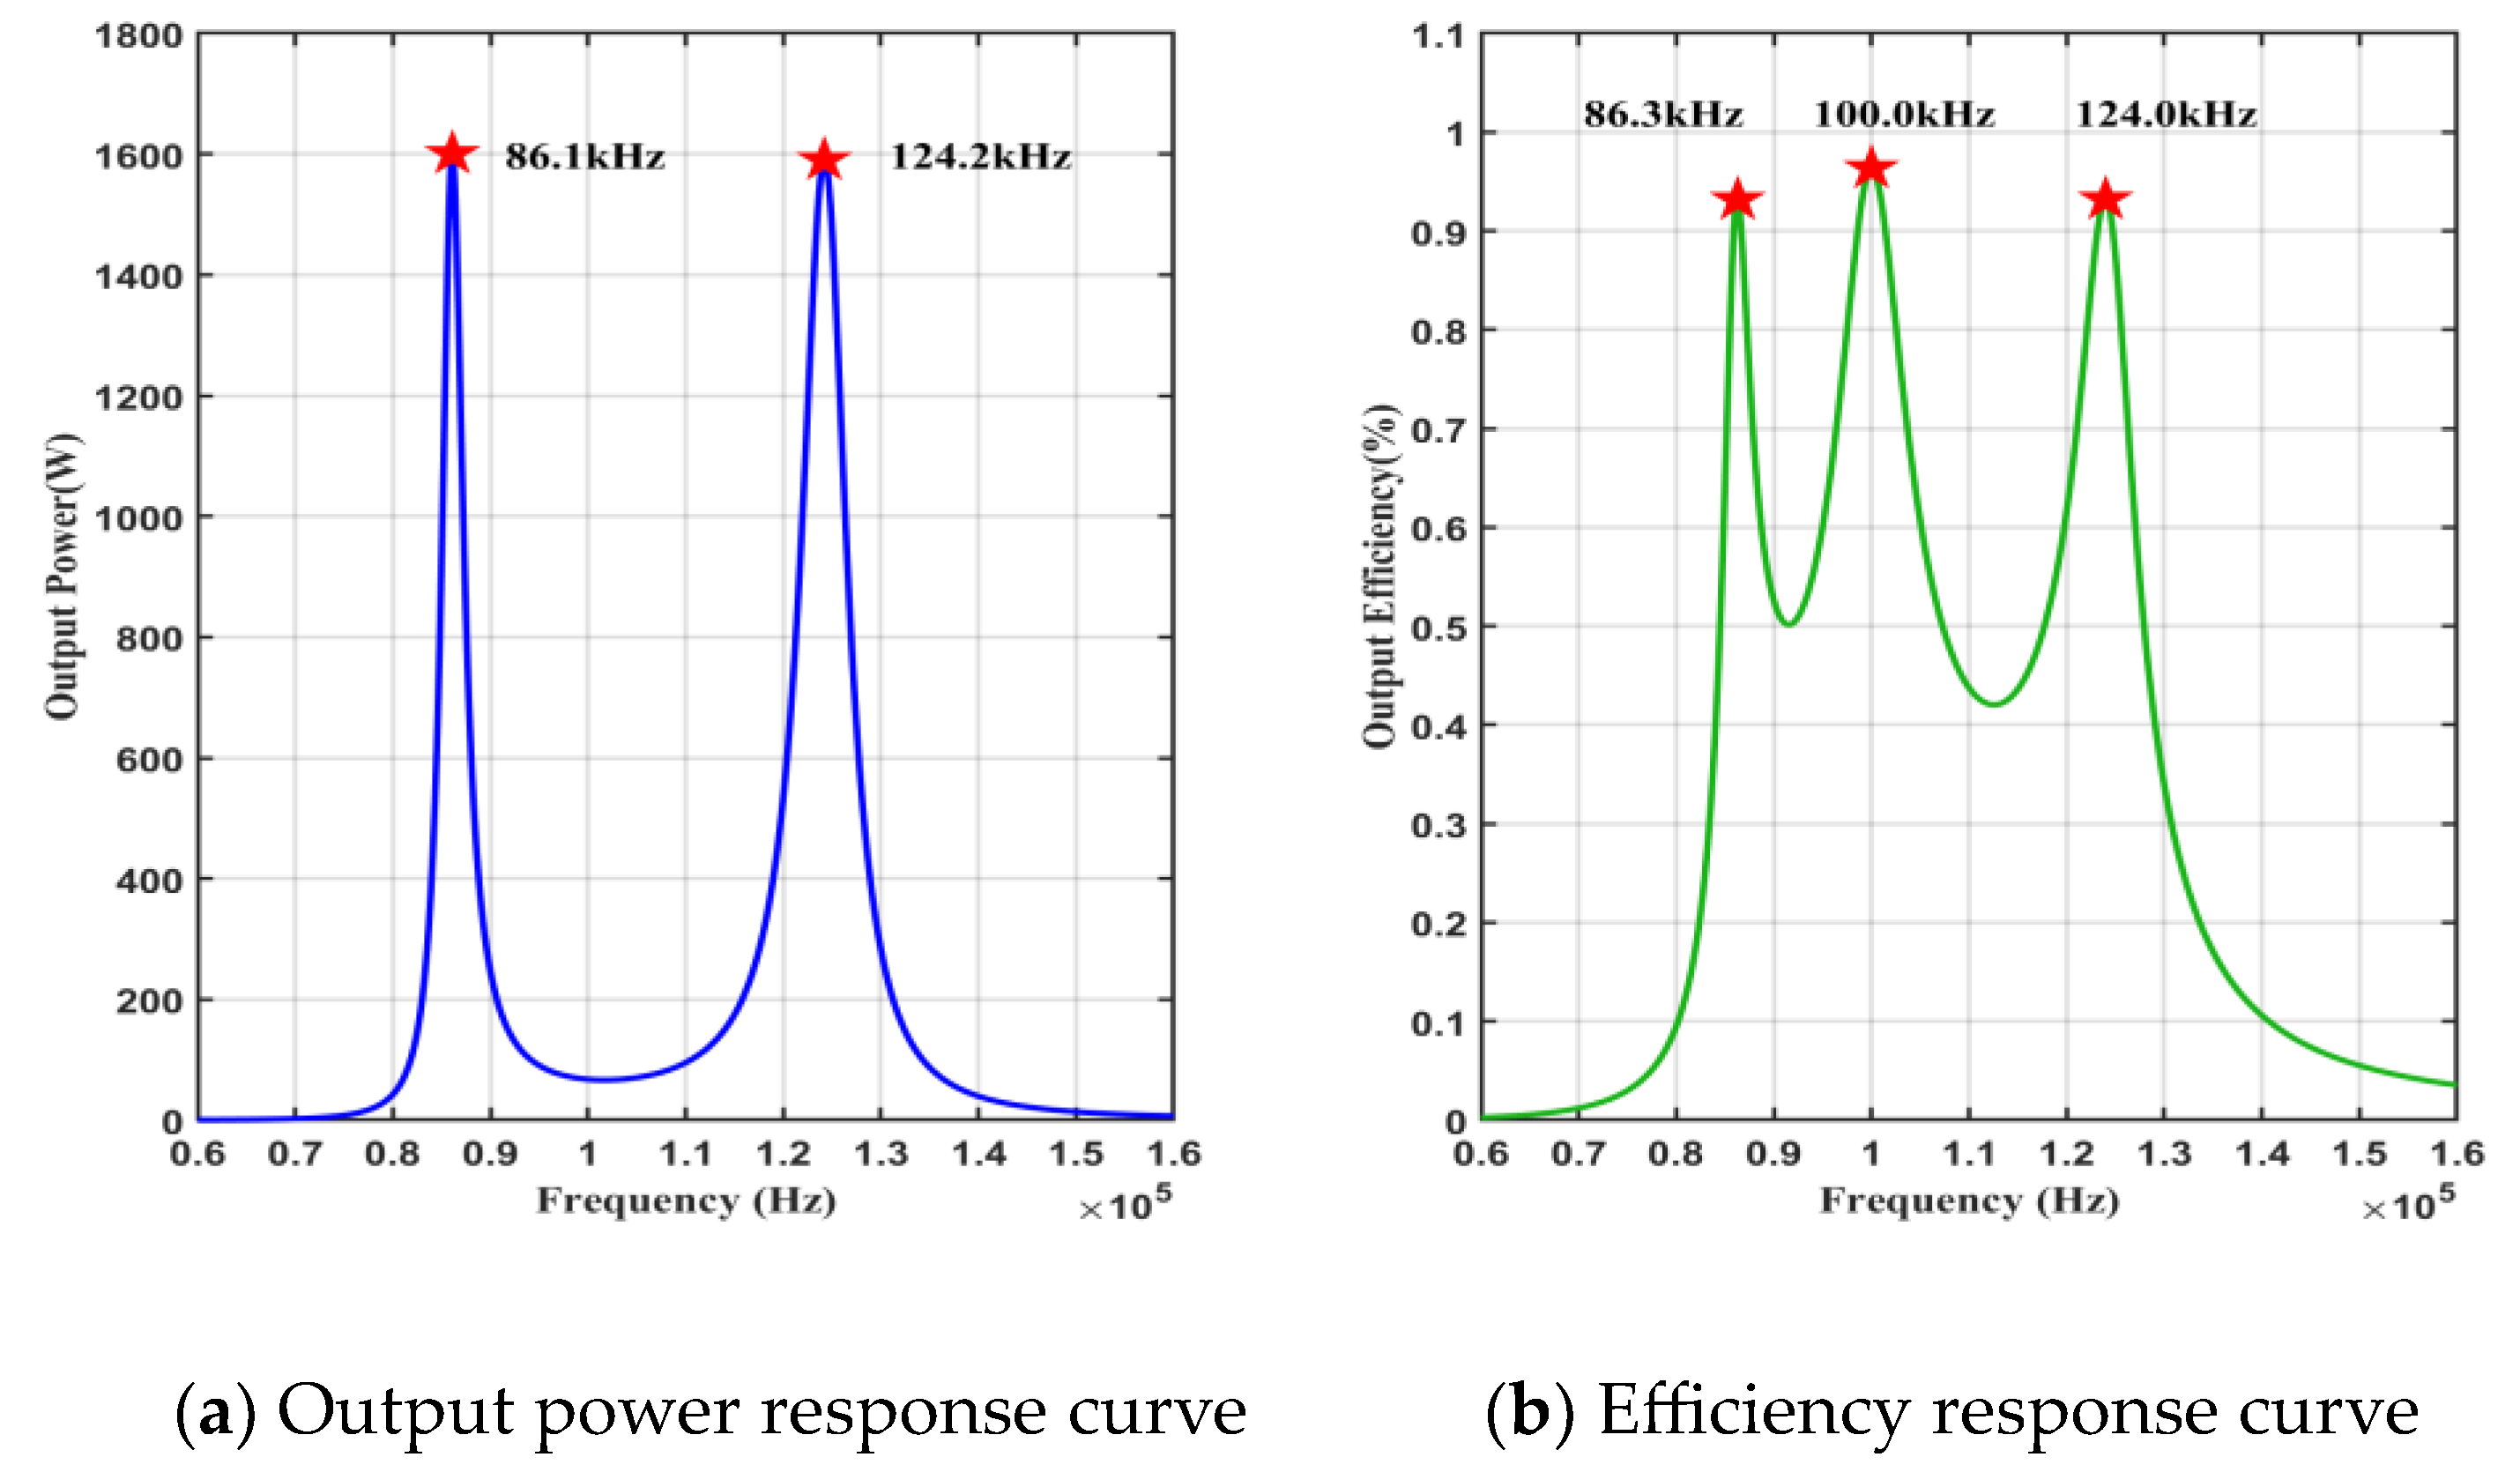
4.2.1. Simulation Results for Variable Equivalent Loads

At the coupling coefficient k = 0.35 and equivalent load resistance RL = 1.3 Ω, RL = 3.3 Ω, RL = 6.5 Ω, RL = 20 Ω, the output power and transmission efficiency response curves to the power supply frequency are shown in Figure 3, Figure 4, Figure 5, and Figure 6, respectively.

4.2.2. Analysis of Simulation Results

Changes in several physical quantities can be observed in Figure 2, Figure 3 and Figure 4, and the critical data from the above three figures are summarized in Table 3 for ease of analysis.
In the above table, it can be seen that the power-frequency splitting bandwidth gradually decreases with the increase in the equivalent load, while the output power at the power-frequency splitting point also decreases with the rise of the equal load. Correspondingly, the efficiency-frequency splitting bandwidth decreases with the increase in the equivalent load, while the transmission efficiency at the efficiency-frequency splitting point increases with the rise of the equal load. In addition, as the equivalent load increases, the power-frequency splitting bandwidth and the efficiency-frequency splitting bandwidth decrease simultaneously, and the efficiency-frequency splitting bandwidth decreases faster than the power-frequency splitting bandwidth decreases. As defined in Section 3.3, the power-efficiency synchronization coefficient reveals that, within the system, a smaller equivalent load results in a larger degree of power-efficiency frequency splitting and a higher power-frequency synchronization coefficient, given a constant coupling coefficient.
In order to further explore the conditions and patterns of power-frequency splitting points and efficiency-frequency splitting points, the coupling coefficient is kept constant while increasing the equivalent load. When k = 0.35, RL = 6.5 Ω, the obtained output power, transmission efficiency response curve to the power supply frequency is shown in Figure 5. At this time, the effect frequency splitting point disappears, the response of transmission efficiency to the power supply frequency is a single-peak curve, but the reaction of output power to the power supply frequency is a double-peak curve, and the frequency splitting phenomenon of output power still exists.
If we continue to increase the equivalent load, when k = 0.35, RL = 20 Ω, the obtained output power, transmission efficiency response curve to the power supply frequency is shown in Figure 6. Currently, the output power is 99.6 kHz to get the maximum value, and the transmission efficiency is 100.0 kHz to obtain the maximum value; the two curves are in a single-peak state, and the output power frequency splitting phenomenon disappears. In Figure 6, regarding (a) and (b), the maximum points of the two curves exhibit a slight deviation, indicating they do not occur at the same frequency for maximum output power and maximum transmission efficiency. This paper attributes such deviation to a slight asymmetry in the structural parameters between the primary and secondary sides of the wireless power transmission system.

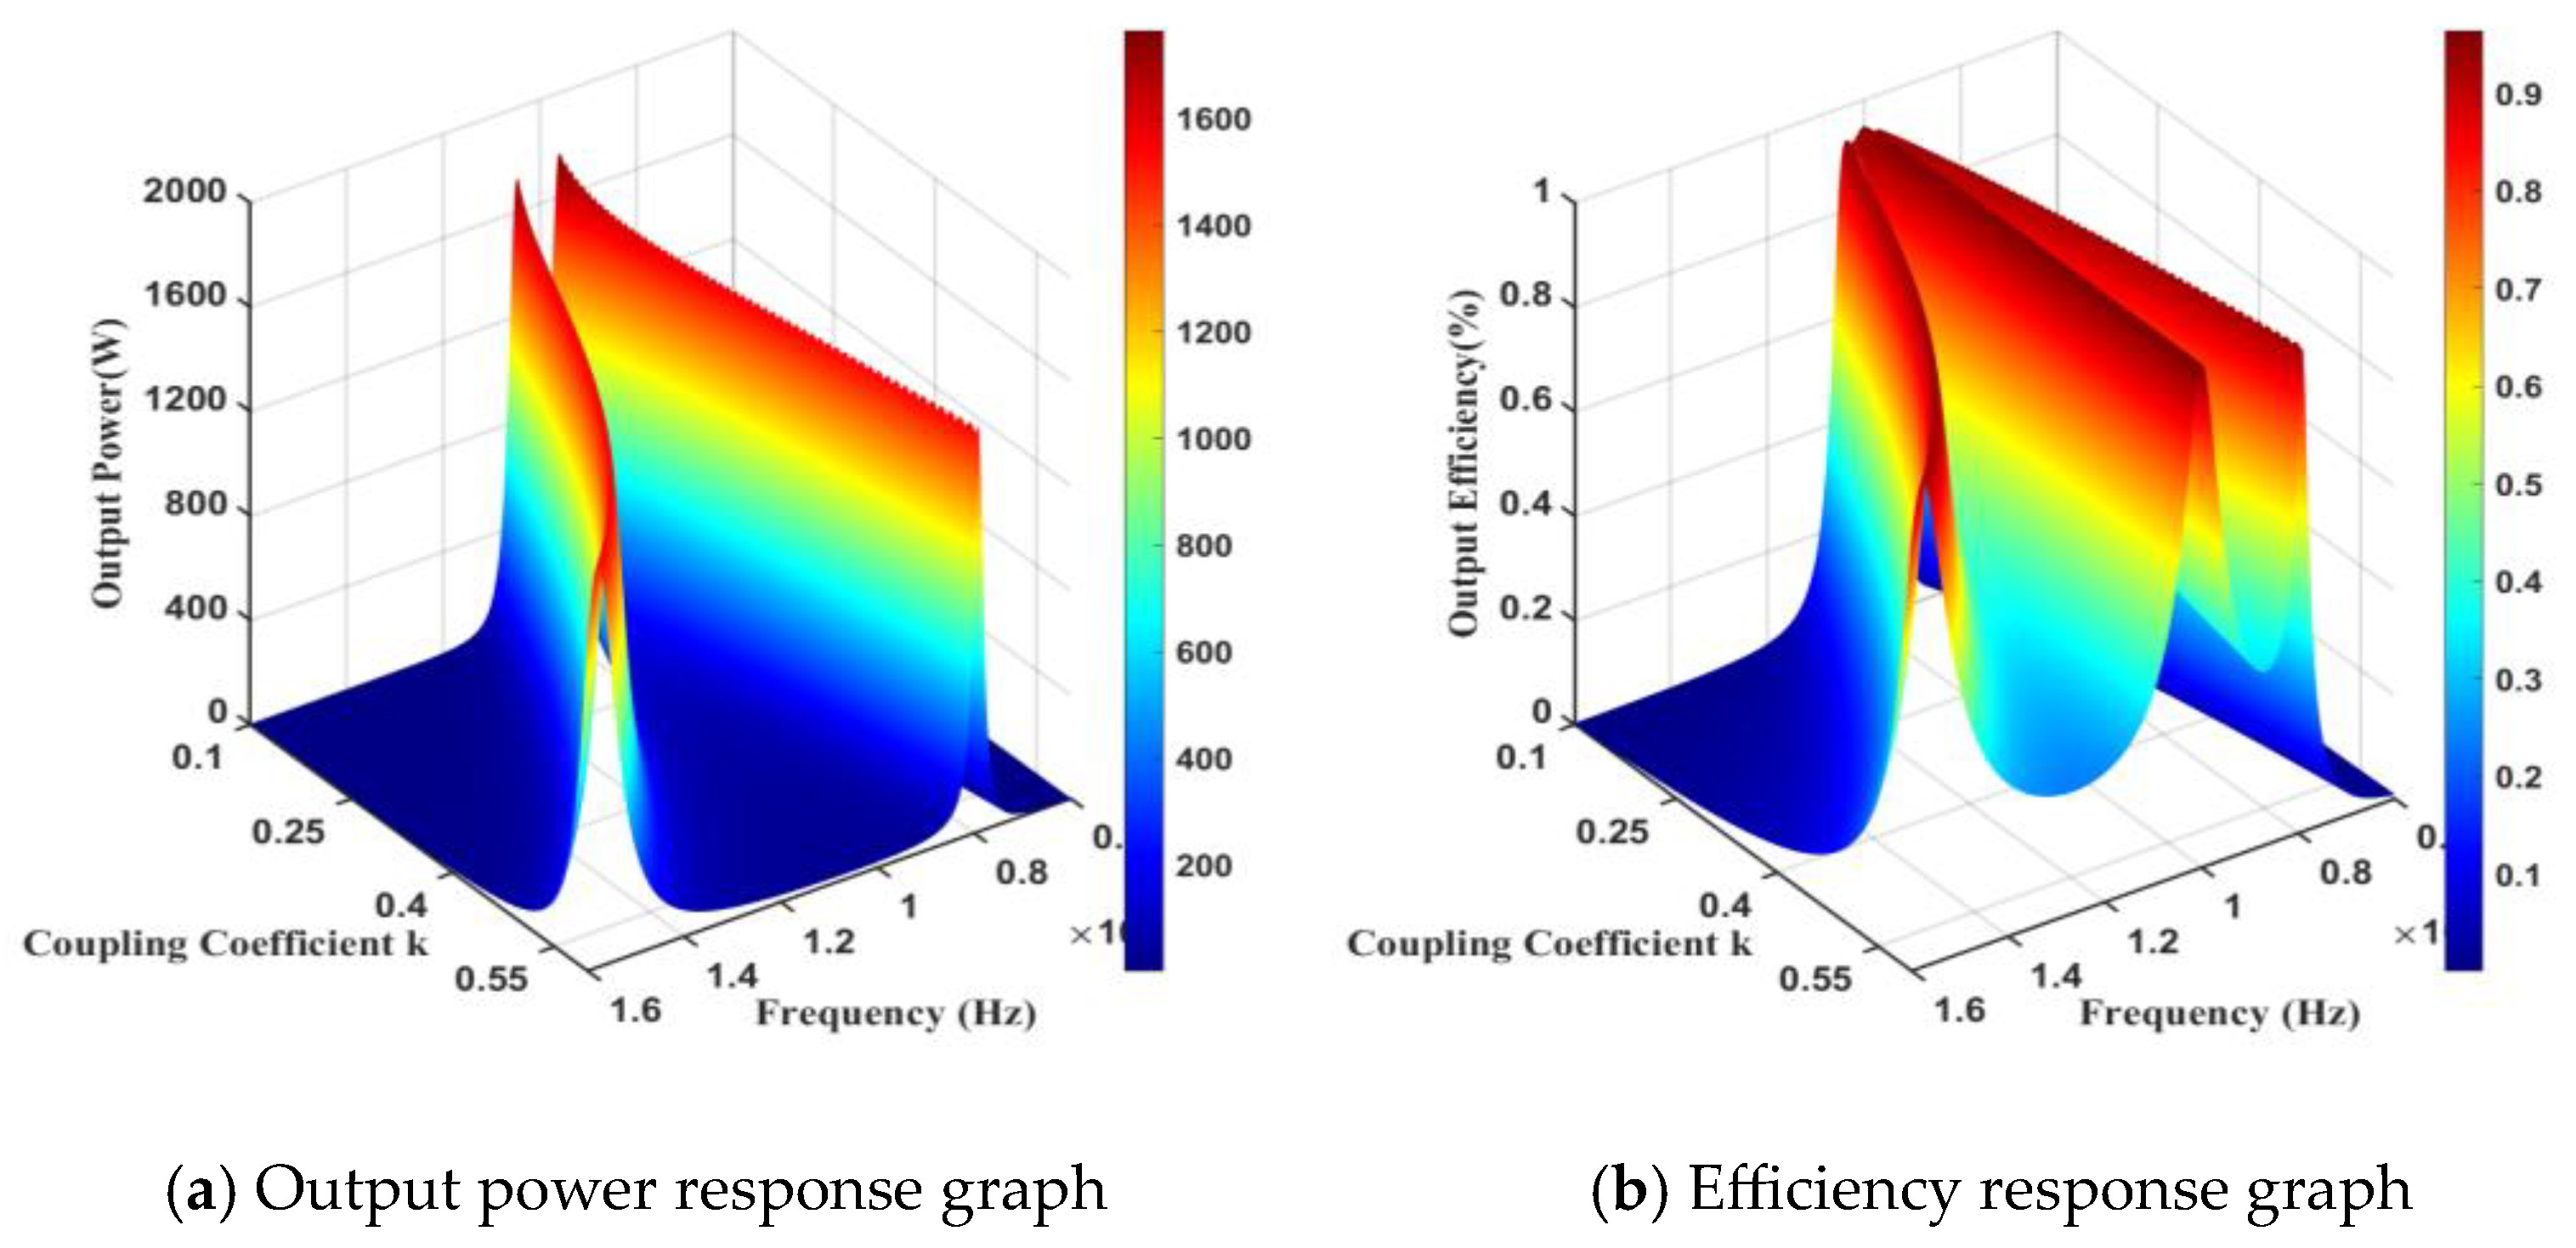
4.3. Effect of Coupling Coefficients

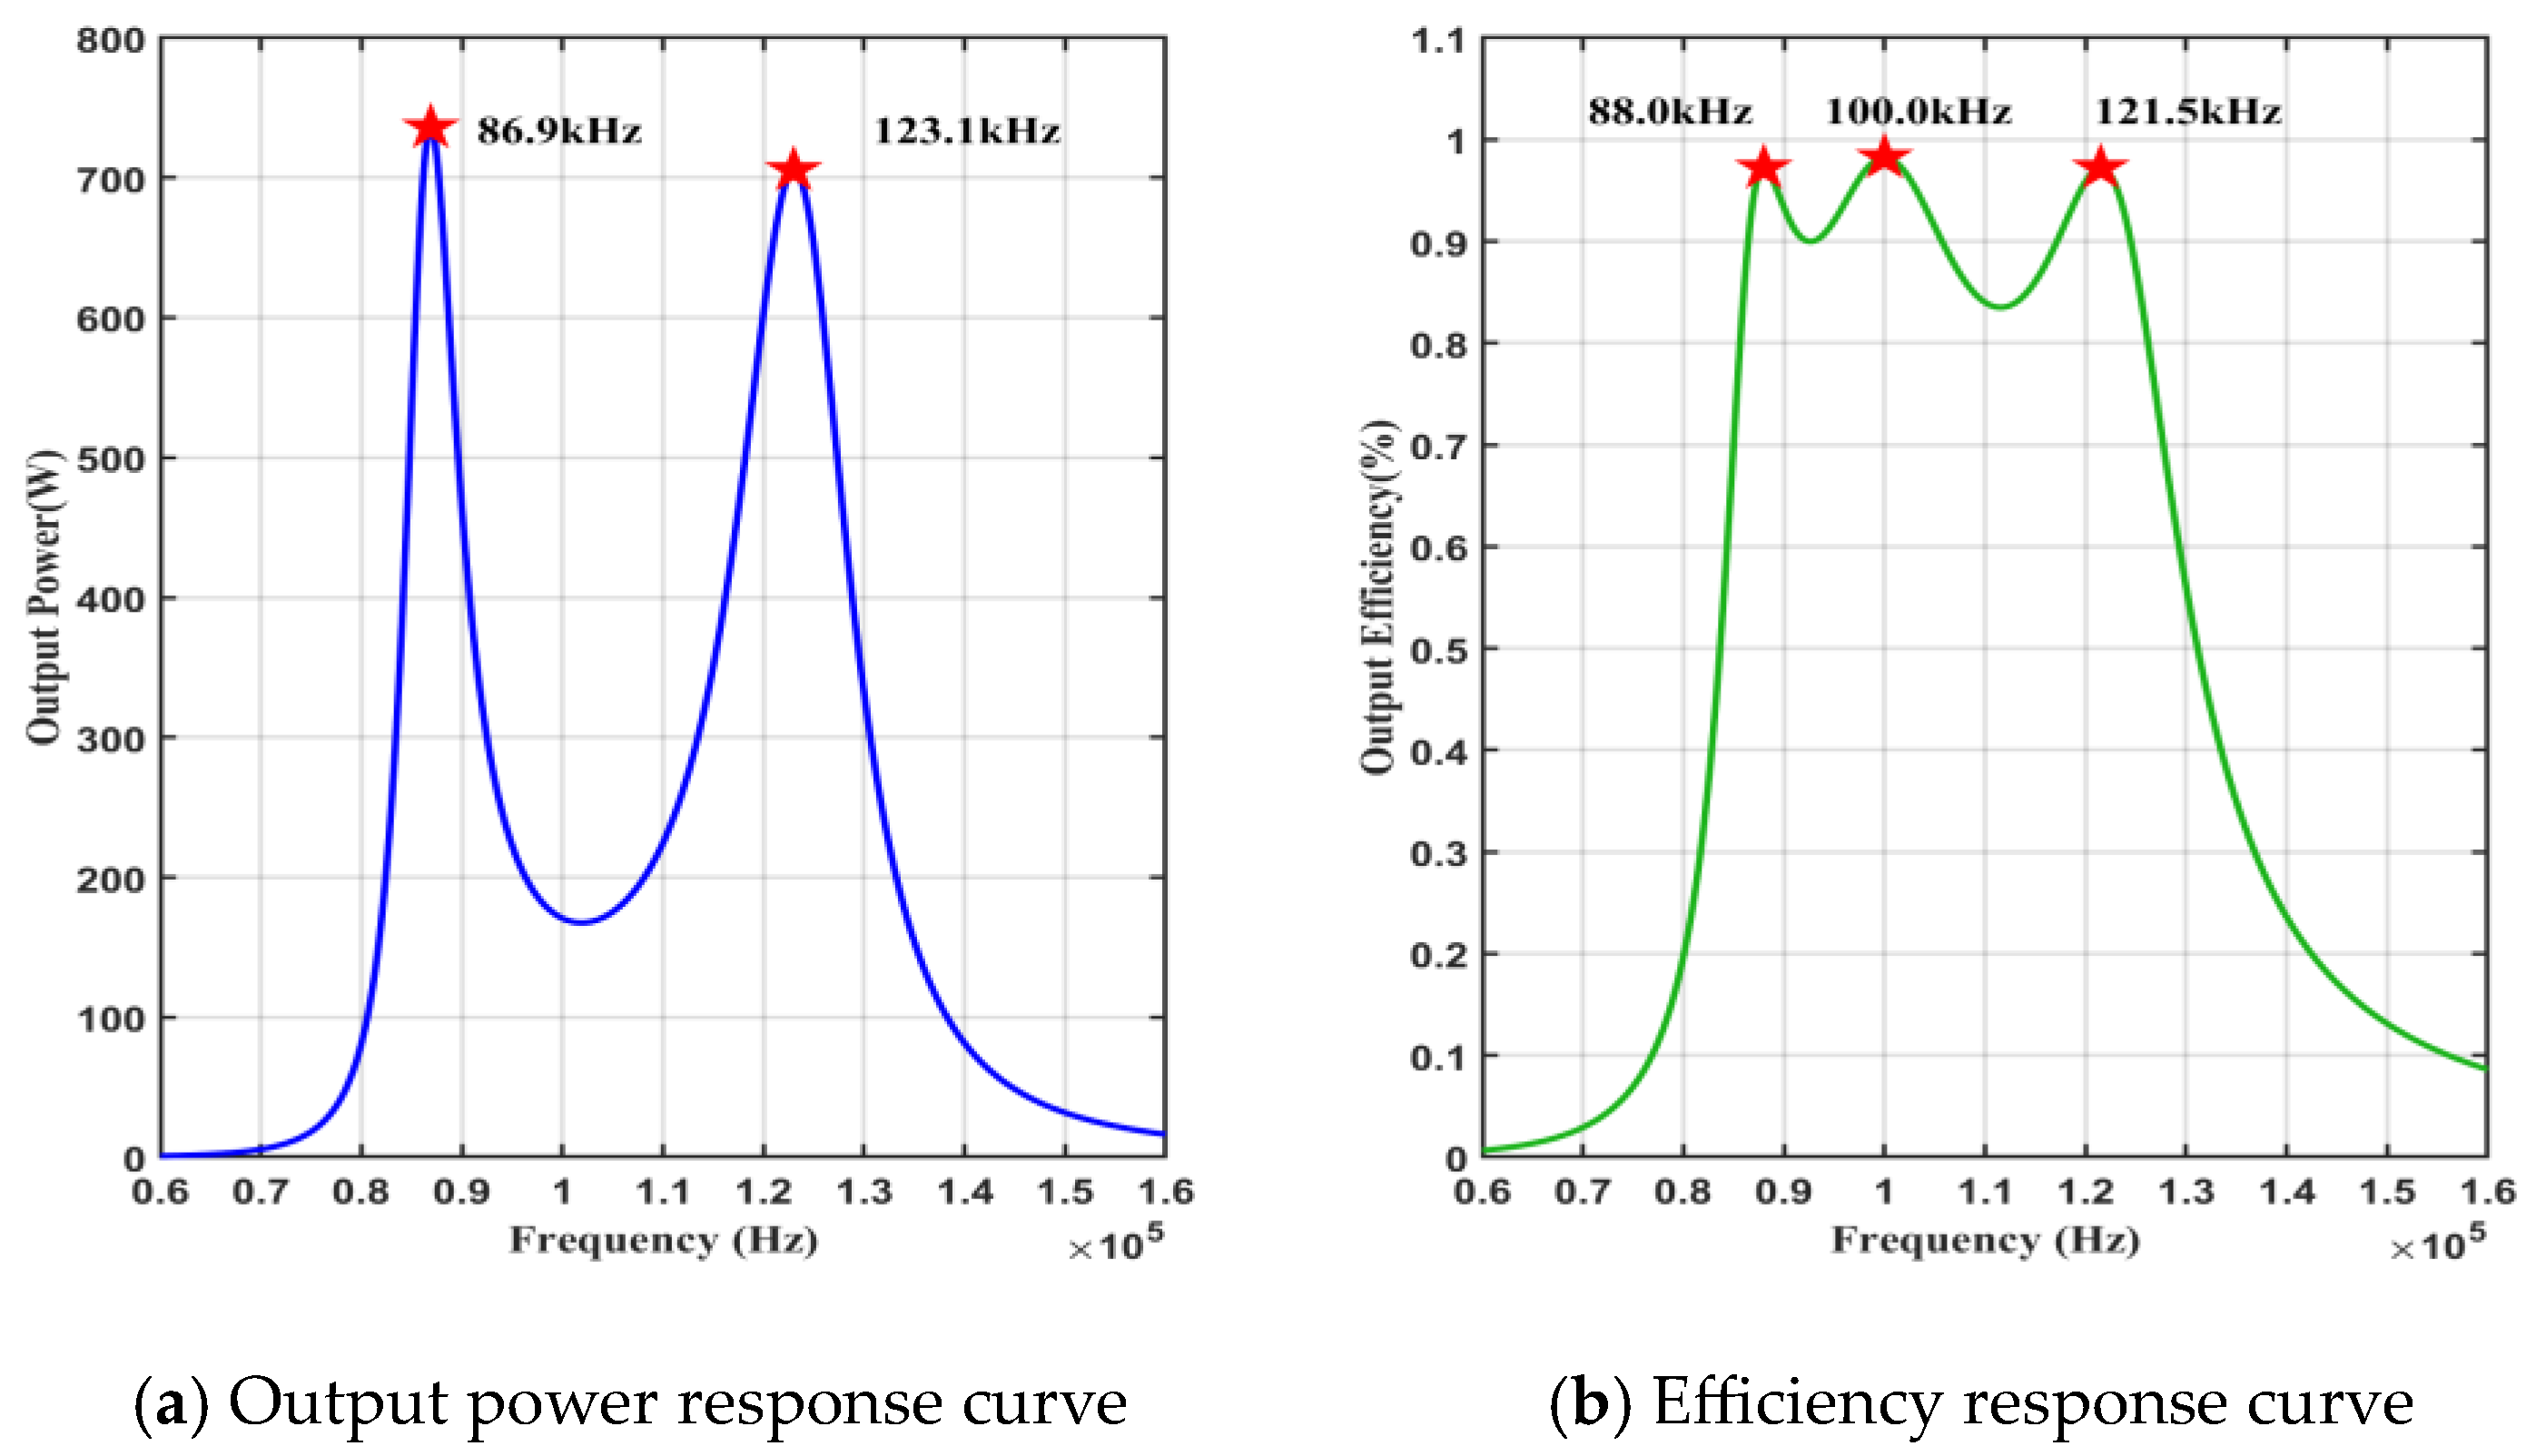
4.3.1. Simulation Results for Variable Coupling Coefficients

The response curves of output power and transmission efficiency to the power supply frequency are shown in Figure 7, Figure 8, Figure 9 and Figure 10 for the equivalent load resistance RL = 2.3 Ω and coupling coefficients k = 0.25, k = 0.45, k = 0.14 and k = 0.08, respectively:

4.3.2. Analysis of Simulation Results

Similarly, for ease of analysis, the critical data from Figure 2, Figure 7, and Figure 8 are summarised in Table 4.
It can be observed that the power-frequency splitting bandwidth gradually increases with the increase in the coupling coefficient, while the output power at the power-frequency splitting point decreases with the increase in the coupling coefficient. Correspondingly, the efficiency-frequency splitting bandwidth increases with the rise of the coupling coefficient. Furthermore, with an increase in the coupling coefficient, both the power-frequency splitting bandwidth and the efficiency-frequency splitting bandwidth expand simultaneously, growing at the same rate. From the power-efficiency synchronization coefficient defined in Section 3.3, the system has the characteristics that the larger the coupling coefficient, the larger the degree of power-frequency frequency splitting, and the higher the power-efficiency synchronization coefficient at a constant equivalent load.
To investigate the conditions and laws of the power-frequency splitting point and the efficiency-frequency splitting point in the process of the fixed equivalent load, reducing the coupling coefficient, when RL = 2.3 Ω, k = 0.14, the output power, transmission efficiency response curve to the power supply frequency is shown in Figure 9. At this time, the efficiency-frequency splitting point disappears, the response of transmission efficiency to the power supply frequency is a single-peak curve, but the reaction of output power to the power supply frequency is a double-peak curve, and the frequency splitting phenomenon of output power still exists. If we continue to reduce the coupling coefficient, when k = 0.08, RL = 2.3 Ω, the output power and transmission efficiency of the power supply frequency response curve are shown in Figure 10. At this point, the output power reaches its maximum value at 99.5 kHz, and the transmission efficiency peaks at 100.0 kHz; both curves exhibit a single-peak state, and the phenomenon of output power frequency splitting vanishes. As for (a) and (b) in Figure 10, the maximum point of the two curves is slightly off, not at the same frequency to achieve the maximum output power and maximum transmission efficiency, similar to Figure 6, this paper believes that it is due to a slight asymmetry of the primary and secondary structural parameters of the wireless energy transmission system.

4.4. Validation of the Efficacy Property Equation

4.4.1. Computer Calculation Verification

To verify the correctness of the power-frequency splitting equation and efficiency-frequency splitting equation derived in Section 3.1 and Section 3.2 of this paper under the condition of symmetric primary and secondary structures, the parameters in Table 2 are adjusted to the symmetrical structure as shown in Table 5.
Employing graphical methods through computer software and computational programming to identify the power and efficiency frequency splitting points, as defined in Equations (16) and (29), validates the accuracy of the discussions in Section 3.1 and Section 3.2 of this paper. The calculated results, presented in Table 6, show that the discrepancy between the two solving methods falls within a 0.1% error margin.

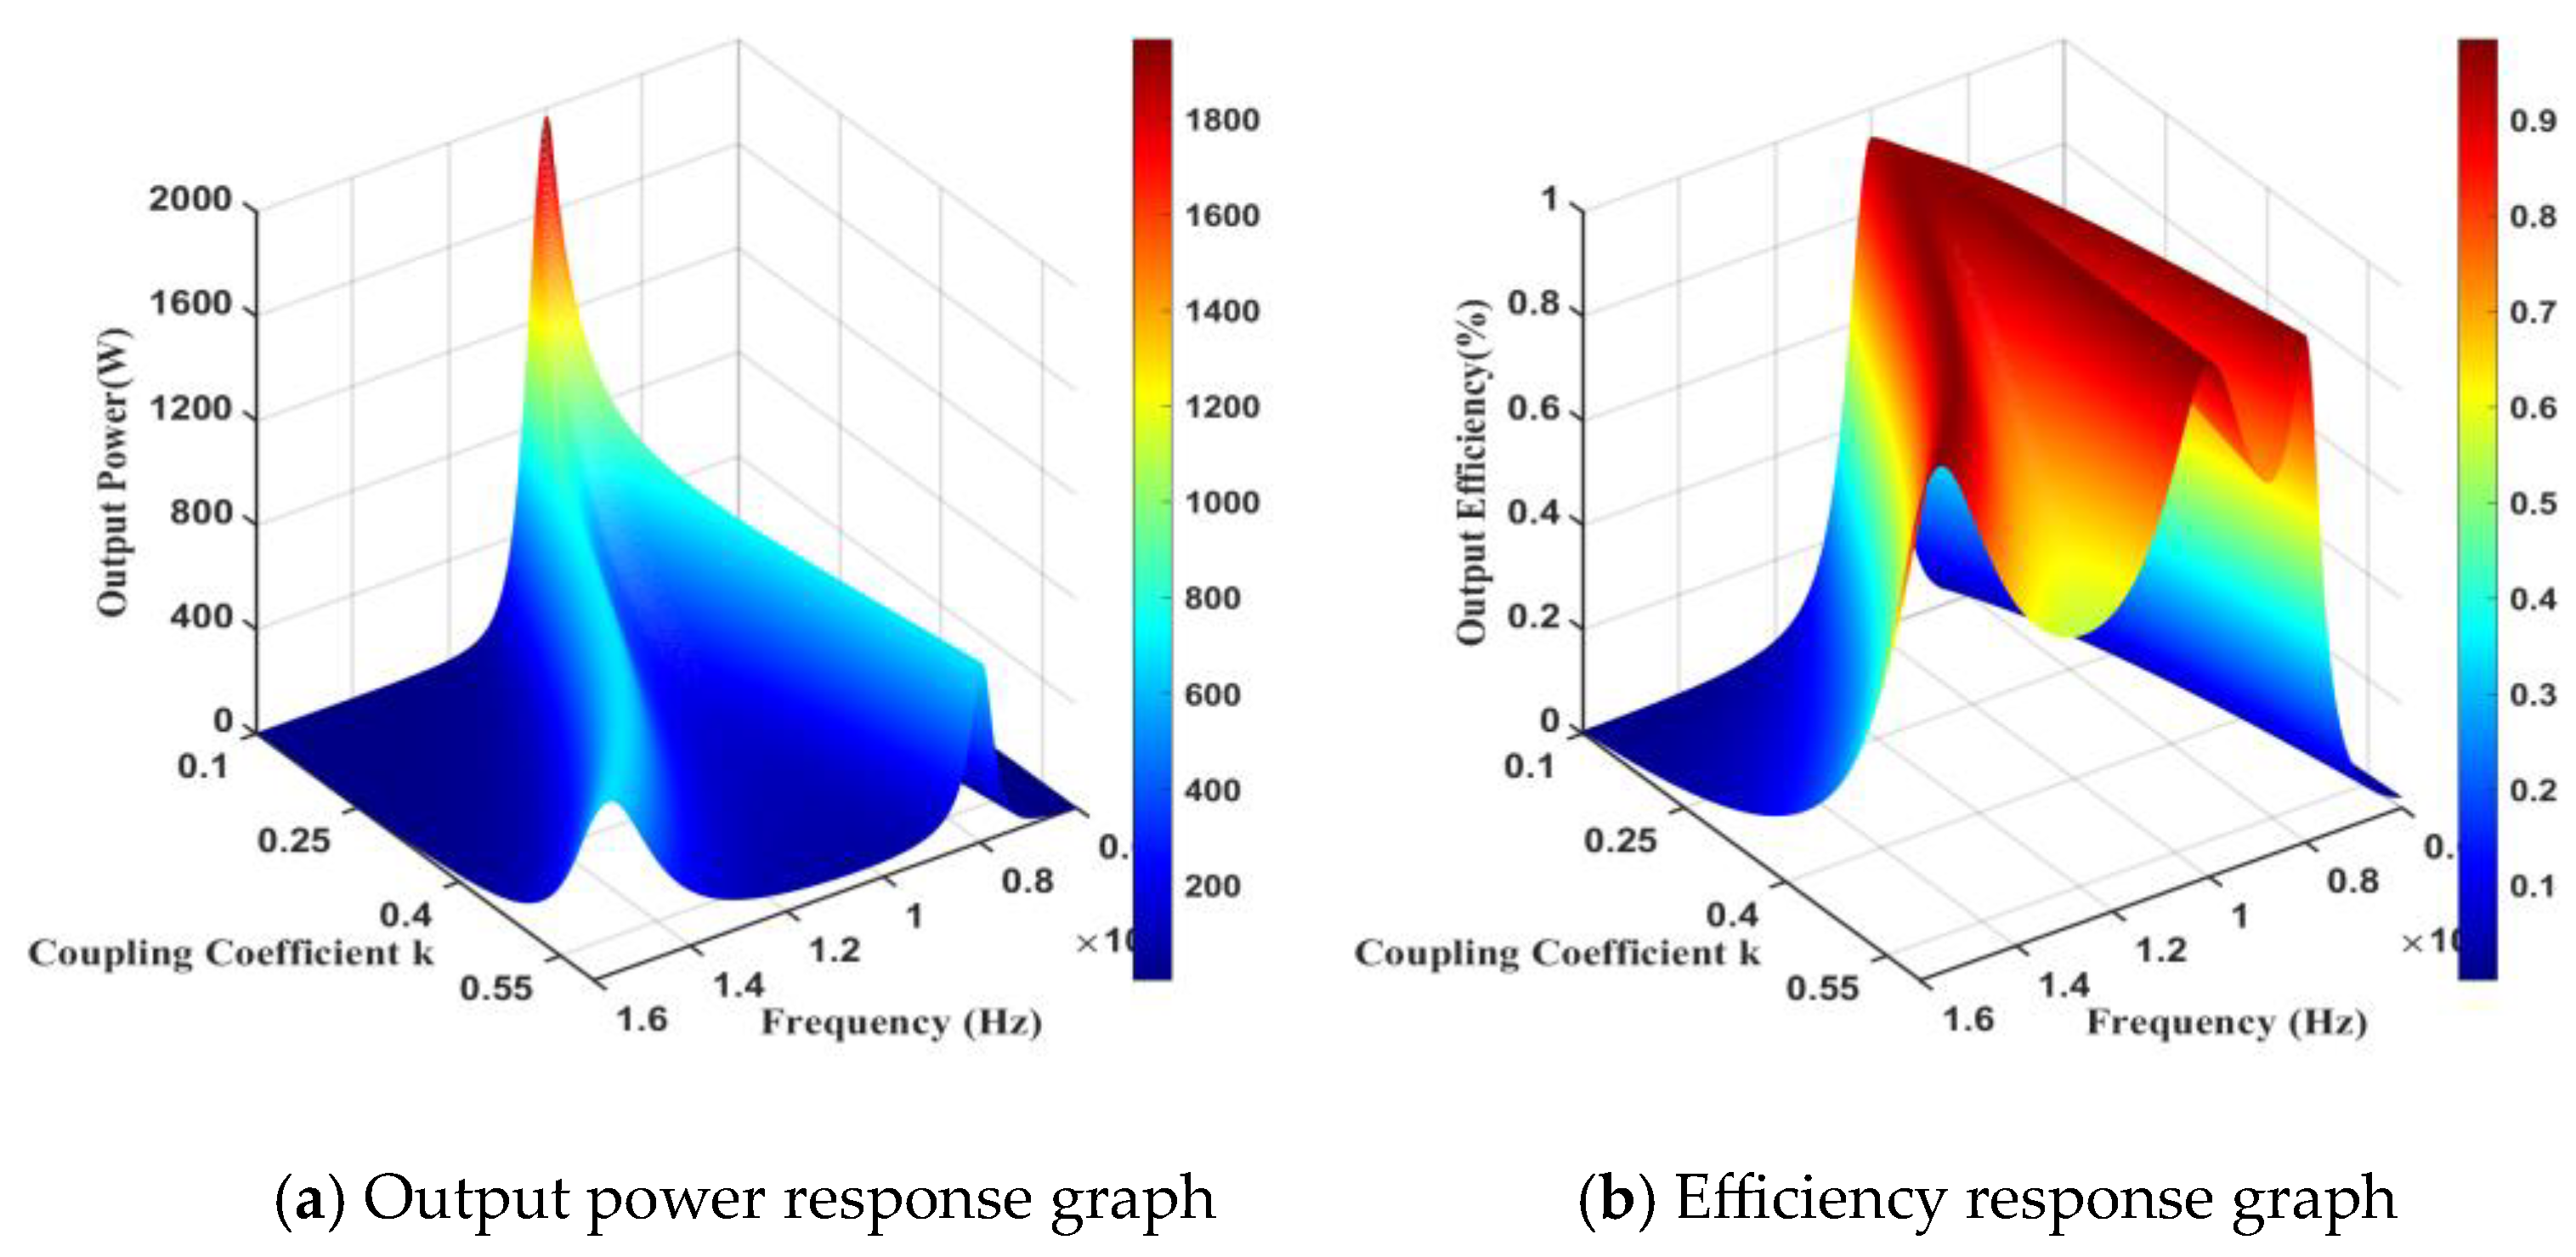
4.4.2. Three-Dimensional Image Verification

To more clearly illustrate the impact of variations in the coupling coefficient and equivalent load on power-frequency and efficiency-frequency splitting, three-dimensional frequency response images of the output power and transmission efficiency are provided. These images are displayed for equivalent resistances (RL) of 1.3 Ω, 2.3 Ω, and 3.3 Ω, illustrating the impact of changes in the coupling coefficient on these parameters. The respective response images are displayed in Figure 11, Figure 12 and Figure 13. A thorough analysis of Figure 11, Figure 12 and Figure 13 reveals that reductions in equivalent load, together with increases in the coupling coefficient, result in more pronounced power-efficiency frequency splitting. In over-coupled regions, augmenting the equivalent load can mitigate this effect. Data from Table 5 indicates that increasing the equivalent load may boost the transmission efficiency at the efficiency-frequency splitting point, but this comes with a significant trade-off in output power at the power-frequency splitting point, where increased efficiency is attained at the expense of output power.

5. Conclusions

This paper provides a thorough investigation into an innovative wireless power supply method for intelligent sensing devices within the urban electric Internet of Things. Using a precise formula derivation grounded in the resonant mutual inductance model, this paper not only clarifies the phenomena of power-frequency splitting and efficiency-frequency splitting within wireless power supply technology but also further reveals the deep interrelation between these characteristics and crucial factors like equivalent load and coupling coefficient, achieved via simulation modeling and calculations. The findings of this research confirm the presence of two significant characteristics, power-frequency splitting and efficiency-frequency splitting, offering a new theoretical foundation for the design of wireless power transmission systems.
The analysis shows that the size of the equivalent load in wireless power transmission systems has a decisive impact on the stability and safety of the system. Specifically, an overly small equivalent load can result in power efficiency frequency splitting, which threatens the stability of the system; on the other hand, an excessively large equivalent load demands the acquisition of a higher voltage from the high-frequency power source. This requirement entails incorporating components in the magnetic coupling elements that can endure high voltages, which not only escalates costs but may also compromise system safety. Therefore, optimizing the selection of equivalent load or finely adjusting it to an ideal size using an impedance-matching network is crucial for crafting efficient and safe wireless power transmission systems.
For the wireless power transmission (WPT) field, this study emphasizes the importance of balancing equivalent loads in system design. Appropriately understanding and applying the characteristics of power-frequency splitting and efficiency-frequency splitting can guarantee system stability and safety during design, as well as optimize performance and cost-efficiency. Moreover, by strategically using an impedance-matching network to fine-tune the equivalent load, it is possible to achieve the best balance between output power, withstand voltage level, and transmission efficiency, thereby promoting the widespread application and development of wireless power transmission technology in the urban electric Internet of Things.
Moreover, the continuous optimization of the performance of wireless power transmission systems plays a critical role in the advancement of smart city infrastructure. Especially for the wireless charging capabilities of front-end sensing devices connected to non-buried power distribution cables, advancements in these technologies are expected to greatly accelerate the development and expansion of smart cities. With the support of WPT technology, the urban IoT power network system is poised to become more intelligent, significantly strengthening urban infrastructure connectivity, enhancing energy efficiency, and further driving the digital transformation of urban environments. Consequently, the findings of this study not only provide valuable guidance for practitioners of WPT technology but also contribute innovative momentum to comprehensive electrical solutions for smart cities, driving urban development toward a future that is more intelligent, interconnected, and sustainable.

Author Contributions

Conceptualization, X.H.; methodology, X.H. and Z.Z.; software, X.H. and H.Z.; validation, X.H., Z.Z. and H.Z.; formal analysis, X.H. and L.J.; investigation, M.X. and R.N.; resources, L.J.; data curation, H.Z.; writing—original draft preparation, X.H.; writing—review and editing, X.H. and Z.Z.; visualization, H.Z.; supervision, M.X.; project administration, R.N.; funding acquisition, L.J. All authors have read and agreed to the published version of the manuscript.

Funding

This work has been funded by the State Grid Corporation of China Headquarters Science and Technology Project—Research on distributed state monitoring technology of medium voltage distribution cable network by compact micropower multi-state sensors (5400-202224157A-1-1-ZN).

Data Availability Statement

The data presented in this study are available on request from the corresponding author.

Conflicts of Interest

The authors declare no conflicts of interest.

References

  1. Barman, S.D.; Reza, A.W.; Kumar, N.; Karim, M.E.; Munir, A.B. Wireless powering by magnetic resonant coupling: Recent trends in wireless power transfer system and its applications. Renew. Sustain. Energy Rev. 2015, 51, 1525–1552. [Google Scholar] [CrossRef]
  2. Eteng, A.A.; Rahim, S.K.A.; Leow, C.Y.; Chew, B.W.; Vandenbosch, G.A.E. Two-Stage Design Method for Enhanced Inductive Energy Transmission with Q-Constrained Planar Square Loops. PLoS ONE 2016, 11, e0148808. [Google Scholar] [CrossRef] [PubMed]
  3. Kim, T.-H.; Yun, G.-H.; Lee, W.Y. Asymmetric Coil Structures for Highly Efficient Wireless Power Transfer Systems. IEEE Trans. Microw. Theory Tech. 2018, 66, 3443–3451. [Google Scholar] [CrossRef]
  4. Choroszucho, A.; Pieńkowski, C.; Jordan, A. Electromagnetic wave propagation into building constructions. Przegląd Elektrotechniczny 2008, 84, 44–49. [Google Scholar]
  5. Sun, L.; Ma, D.; Tang, H. A review of recent trends in wireless power transfer technology and its applications in electric vehicle wireless charging. Renew. Sustain. Energy Rev. 2018, 91, 490–503. [Google Scholar] [CrossRef]
  6. Luo, Z.; Wei, X. Analysis of Square and Circular Planar Spiral Coils in Wireless Power Transfer System for Electric Vehicles. IEEE Trans. Ind. Electron. 2018, 65, 331–341. [Google Scholar] [CrossRef]
  7. Inoue, K.; Kusaka, K.; Itoh, J.I. Reduction in radiation noise level for inductive power transfer systems using spread spectrum techniques. IEEE Trans. Power Electron. 2018, 33, 3076–3085. [Google Scholar] [CrossRef]
  8. Tang, S.C.; Lun, T.L.T.; Guo, Z.; Kwok, K.W.; McDannold, N.J. Intermediate range wireless power transfer with segmented coil transmitters for implantable heart pumps. IEEE Trans. Power Electron. 2017, 32, 3844–3857. [Google Scholar] [CrossRef]
  9. Kan, T.; Mai, R.; Mercier, P.P.; Mi, C.C. Design and analysis of a three-phase wireless charging system for lightweight autonomous underwater vehicles. IEEE Trans. Power Electron. 2017, 33, 6622–6632. [Google Scholar] [CrossRef]
  10. Moiduddin, K.; Mian, S.H.; Ameen, W.; Alkindi, M.; Ramalingam, S.; Alghamdi, O. Patient-Specific Surgical Implant Using Cavity-Filled Approach for Precise and Functional Mandible Reconstruction. Appl. Sci. 2020, 10, 6030. [Google Scholar] [CrossRef]
  11. Li, X.; Zhang, H.; Peng, F.; Li, Y.; Yang, T.; Wang, B.; Fang, D. A wireless magnetic resonance energy transfer system for micro implantable medical sensors. Sensors 2012, 12, 10292–10308. [Google Scholar] [CrossRef] [PubMed]
  12. Fitzpatrick, D.C. Implantable Electronic Medical Devices; Academic Press: San Diego, CA, USA, 2014; pp. 7–35. [Google Scholar]
  13. Bukhari, M.U.; Khan, A.; Maqbool, K.Q.; Arshad, A.; Riaz, K.; Bermak, A. Waste to energy: Facile, low-cost and environment-friendly triboelectric nanogenerators using recycled plastic and electronic wastes for self-powered portable electronics. Energy Rep. 2022, 8, 1687–1695. [Google Scholar] [CrossRef]
  14. Van Toan, N.; Thi Kim Tuoi, T.; Van Hieu, N.; Ono, T. Thermoelectric generator with a high integration density for portable and wearable self-powered electronic devices. Energy Convers. Manag. 2021, 245, 114571. [Google Scholar] [CrossRef]
  15. Latest 97 Mobile Phone List with Qi Certification by WPC Wireless Charging Alliance–Chongdiantou. Available online: https://www.chongdiantou.com/archives/26813.html (accessed on 8 May 2023).
  16. Hammi, B.; Zeadally, S.; Khatoun, R.; Nebhen, J. Survey on smart homes: Vulnerabilities, risks, and countermeasures. Comput. Secur. 2022, 117, 102677. [Google Scholar] [CrossRef]
  17. Maharjan, P.; Salauddin, M.; Cho, H.; Park, J.Y. An indoor power line based magnetic field energy harvester for self-powered wireless sensors in smart home applications. Appl. Energy 2018, 232, 398–408. [Google Scholar] [CrossRef]
  18. Sun, Q.; Han, J.; Li, H.; Liu, S.; Shen, S.; Zhang, Y.; Sheng, J. A Miniature Robotic Turtle With Target Tracking and Wireless Charging Systems Based on IPMCs. IEEE Access 2020, 8, 187156–187164. [Google Scholar] [CrossRef]
  19. Lü, X.; Deng, R.; Chen, C.; Wu, Y.; Meng, R.; Long, L. Performance optimization of fuel cell hybrid power robot based on power demand prediction and model evaluation. Appl. Energy 2022, 316, 119087. [Google Scholar] [CrossRef]
  20. Tan, Z.; Liu, F.; Chan, H.K.; Gao, H.O. Transportation systems management considering dynamic wireless charging electric vehicles: Review and prospects. Transp. Res. Part E Logist. Transp. Rev. 2022, 163, 102761. [Google Scholar] [CrossRef]
  21. Jin, Y.; Xu, J.; Wu, S.; Xu, L.; Yang, D. Enabling the Wireless Charging via Bus Network: Route Scheduling for Electric Vehicles. IEEE Trans. Intell. Transp. Syst. 2021, 22, 1827–1839. [Google Scholar] [CrossRef]
  22. Allamehzadeh, H. Wireless Power Transfer (WPT) Fundamentals with Resonant Frequency-Dependent Parameters, Energy Transfer Efficiency, and Green Technology Applications. In Proceedings of the 2021 IEEE 48th Photovoltaic Specialists Conference (PVSC), Fort Lauderdale, FL, USA, 20–25 June 2021. [Google Scholar]
  23. Fang, Y.; Qu, J.; Pong, B.M.H.; Lee, C.K.; Hui, R.S.Y. Quasi-Static Modeling and Optimization of Two-Layer PCB Resonators in Wireless Power Transfer Systems for 110-kV Power Grid Online Monitoring Equipment. IEEE Trans. Ind. Electron. 2022, 69, 1400–1410. [Google Scholar] [CrossRef]
  24. Baby, T.; Madhu, G.; Renjith, V.R. Occupational electrical accidents: Assessing the role of personal and safety climate factors. Saf. Sci. 2021, 139, 105229. [Google Scholar] [CrossRef]
  25. Goh, H.H.; Huang, Y.; Lim, C.S.; Zhang, D.; Liu, H.; Dai, W.; Kurniawan, T.A.; Rahman, S. An Assessment of Multistage Reward Function Design for Deep Reinforcement Learning-Based Microgrid Energy Management. IEEE Trans. Smart Grid 2022, 13, 4300–4311. [Google Scholar] [CrossRef]
  26. Tran, C.Q.; Keyvan-Ekbatani, M.; Ngoduy, D.; Watling, D. Dynamic wireless charging lanes location model in urban networks considering route choices. Transp. Res. Part C Emerg. Technol. 2022, 139, 103652. [Google Scholar] [CrossRef]
  27. Glaser, P.E. Power from the Sun: Its Future. Science 1968, 162, 857–861. [Google Scholar] [CrossRef] [PubMed]
  28. Shinohara, N. Beam Control Technologies With a High-Efficiency Phased Array for Microwave Power Transmission in Japan. Proc. IEEE 2013, 101, 1448–1463. [Google Scholar] [CrossRef]
  29. Kavin, R.; Gowri, V.K.; Naveenaa, M.; Navishree, T.; Nithish, J. Wireless Power Transmission in Electric Vehicle Using Solar Energy. In Proceedings of the 2021 3rd International Conference on Signal Processing and Communication (ICPSC), Coimbatore, India, 13–14 May 2021. [Google Scholar]
  30. Khan, A.A.; Malik, N.; Al-Arainy, A.; Alghuwainem, S. A review of condition monitoring of underground power cables. In Proceedings of the 2012 IEEE International Conference on Condition Monitoring and Diagnosis, Bali, Indonesia, 23–27 September 2012. [Google Scholar]
  31. Jou, H.L.; Wu, J.C.; Wu, K.D.; Kuo, C.Y. Bidirectional DC–DC Wireless Power Transfer Based on LCC-C Resonant Compensation. IEEE Trans. Power Electron. 2021, 36, 2310–2319. [Google Scholar] [CrossRef]
  32. Yan, L.; Shen, H.; Zhao, J.; Xu, C.; Luo, F.; Qiu, C.; Zhang, Z.; Mahmud, S. CatCharger: Deploying In-Motion Wireless Chargers in a Metropolitan Road Network via Categorization and Clustering of Vehicle Traffic. IEEE Internet Things J. 2022, 9, 9525–9541. [Google Scholar] [CrossRef]
  33. Badwey, M.A.; Abbasy, N.H.; Eldallal, G.M. An efficient design of LC-compensated hybrid wireless power transfer system for electric vehicle charging applications. Alex. Eng. J. 2022, 61, 6565–6580. [Google Scholar] [CrossRef]
  34. Wei, X.; Wang, Z.; Dai, H. A Critical Review of Wireless Power Transfer via Strongly Coupled Magnetic Resonances. Energies 2014, 7, 4316–4341. [Google Scholar] [CrossRef]
  35. Wu, K.; Choudhury, D.; Matsumoto, H. Wireless Power Transmission, Technology, and Applications [Scanning the Issue]. Proc. IEEE 2013, 101, 1271–1275. [Google Scholar] [CrossRef]
  36. Garnica, J.; Chinga, R.A.; Lin, J. Wireless Power Transmission: From Far Field to Near Field. Proc. IEEE 2013, 101, 1321–1331. [Google Scholar] [CrossRef]
  37. Sample, A.P.; Waters, B.H.; Wisdom, S.T.; Smith, J.R. Enabling Seamless Wireless Power Delivery in Dynamic Environments. Proc. IEEE 2013, 101, 1343–1358. [Google Scholar] [CrossRef]
  38. Li, S.; Mi, C.C. Wireless Power Transfer for Electric Vehicle Applications. IEEE J. Emerg. Sel. Top. Power Electron. 2015, 3, 4–17. [Google Scholar]
  39. Kim, D.; Abu-Siada, A.; Sutinjo, A. State-of-the-art literature review of WPT: Current limitations and solutions on IPT. Electr. Power Syst. Res. 2018, 154, 493–502. [Google Scholar] [CrossRef]
  40. Raza, U.; Salam, A. On-Site and External Energy Harvesting in Underground Wireless. Electronics 2020, 9, 681. [Google Scholar] [CrossRef]
  41. Saha, O.; Truong, B.D.; Roundy, S. A review of wireless power transfer using magnetoelectric structures. Smart Mater. Struct. 2022, 31, 113001. [Google Scholar] [CrossRef]
  42. Van Mulders, J.; Delabie, D.; Lecluyse, C.; Buyle, C.; Callebaut, G.; Van der Perre, L.; De Strycker, L. Wireless Power Transfer: Systems, Circuits, Standards, and Use Cases. Sensors 2022, 22, 5573. [Google Scholar] [CrossRef]
  43. Xu, F.; Wei, S.; Yuan, D.; Li, J. Review on Key Technologies and Development of Magnetic Coupling Resonant-Dynamic Wireless Power Transfer for Unmanned Ground Vehicles. Electronics 2023, 12, 1506. [Google Scholar] [CrossRef]
  44. Grabham, N.J.; Li, Y.; Clare, L.R.; Stark, B.H.; Beeby, S.P. Fabrication techniques for manufacturing flexible coils on textiles for inductive power transfer. IEEE Sens. J. 2018, 18, 2599–2606. [Google Scholar] [CrossRef]
  45. Stankiewicz, J.M. Analysis of the Influence of the Skin Effect on the Efficiency and Power of the Receiver in the Periodic WPT System. Energies 2023, 16, 2009. [Google Scholar] [CrossRef]
  46. Micus, S.; Padani, L.; Haupt, M.; Gresser, G.T. Textile-Based Coils for Inductive Wireless Power Transmission. Appl. Sci. 2021, 11, 4309. [Google Scholar] [CrossRef]
  47. Wei, B.; Wang, S.; Jiang, C.; Jiang, B.; He, H.; Liu, M. Matrix Metamaterial Shielding Design for Wireless Power Transfer to Control the Magnetic Field. Materials 2022, 15, 2678. [Google Scholar] [CrossRef] [PubMed]
  48. Stankiewicz, J.M.; Choroszucho, A.; Steckiewicz, A. Estimation of the Maximum Efficiency and the Load Power in the Periodic WPT Systems Using Numerical and Circuit Models. Energies 2021, 14, 1151. [Google Scholar] [CrossRef]
  49. Stankiewicz, J.M.; Choroszucho, A. Efficiency of the Wireless Power Transfer System with Planar Coils in the Periodic and Aperiodic Systems. Energies 2022, 15, 115. [Google Scholar] [CrossRef]
  50. Stankiewicz, J.M. Estimation of the Influence of the Coil Resistance on the Power and Efficiency of the WPT System. Energies 2023, 16, 6210. [Google Scholar] [CrossRef]
  51. Bazeia, D.; Pereira, M.; Brito, A.; de Oliveira, B.; Ramos, J. A novel procedure for the identification of chaos in complex biological systems. Sci. Rep. 2017, 7, 44900. [Google Scholar] [CrossRef]
  52. Medeiros, R.L.V.; Ramos, J.G.G.S.; Nascimento, T.P.; Filho, A.C.L.; Brito, A.V. A Novel Approach for Brushless DC Motors Characterization in Drones Based on Chaos. Drones 2018, 2, 14. [Google Scholar] [CrossRef]
  53. Hou, W.; Zhang, Y.; Sun, J. A fault detection method for motors based on Local Polynomial Fourier Transform. In Proceedings of the Prognostics and System Health Management Conference (PHM), Beijing, China, 21–23 October 2015; pp. 1–5. [Google Scholar]
Figure 1. Equivalent circuit of two coils in series-series (s-s) resonance.
Electronics 13 01411 g001
Figure 2. Output power, transfer efficiency response curve to power supply frequency (RL = 2.3 Ω, k = 0.35).
Electronics 13 01411 g002
Figure 3. Output power, transfer efficiency response curve to power supply frequency (RL = 1.3 Ω, k = 0.35).
Electronics 13 01411 g003
Figure 4. Output power, transfer efficiency response curve to power supply frequency (RL = 3.3 Ω, k = 0.35).
Electronics 13 01411 g004
Figure 5. Output power, transfer efficiency response curve to power supply frequency (RL = 6.5 Ω, k = 0.35).
Electronics 13 01411 g005
Figure 6. Output power, transfer efficiency response curve to power supply frequency (RL = 20 Ω, k = 0.35).
Electronics 13 01411 g006
Figure 7. Output power, transfer efficiency response curve to power supply frequency (RL = 2.3 Ω, k = 0.25).
Electronics 13 01411 g007
Figure 8. Output power, transfer efficiency response curve to power supply frequency (RL = 2.3 Ω, k = 0.45).
Electronics 13 01411 g008
Figure 9. Output power, transfer efficiency response curve to power supply frequency (RL = 2.3 Ω, k = 0.14).
Electronics 13 01411 g009
Figure 10. Output power, transfer efficiency response curve to power supply frequency (RL = 2.3 Ω, k = 0.08).
Electronics 13 01411 g010
Figure 11. Output power, transfer efficiency response curve to power supply frequency (RL = 1.3 Ω).
Electronics 13 01411 g011
Figure 12. Output power, transfer efficiency response curve to power supply frequency (RL = 2.3 Ω).
Electronics 13 01411 g012
Figure 13. Output power, transfer efficiency response curve to power supply frequency (RL = 3.3 Ω).
Electronics 13 01411 g013
Table 1. Comparison of WPT technologies.
WPT TechnologiesAdvantagesDisadvantagesApplications
EM
radiation
Uni-directional
(microwave/laser)
Achieving high-efficiency power transmission over long distances (in the kilometer range).Requires LOS with advanced tracking and alignment, typically involving large devices.SHARP unmanned aircraft.
Omni-directionalA compact receiver is needed that ensures stable RF-to-DC conversion efficiency under varying input power and load resistance conditions.Energy transfer efficiency significantly reduces with increased distance and is suitable only for ultra-low power sensors.Supplying power to a WSN for tracking environmental parameters such as temperature, humidity, and light.
EM induction couplingNon-radiative, high-efficiency, simple energy transfer over centimeters.Short-range transmission with precise alignment needed for charging.Charging mats for smartphones, laptops, electric toothbrushes.
Magnetic resonant couplingHigh-efficiency, omnidirectional transfer over several meters, independent of line-of-sight and weather conditions.Efficiency loss from misalignment, axial mismatch, and interference.Charging for mobile devices, EVs, implants, and sensors.
Table 2. Parameters of the wireless power transmission system (asymmetrical structure).
ParametersR1 (mΩ)L1 (μH)C1 (nF)R2 (mΩ)
value46.129.585.8647.9
ParametersR1 (mΩ)L1 (μH)C1 (nF)R2 (mΩ)
value30.383.602.3 Ω100
Table 3. Parameters with Fixed Coupling Coefficient and Variable Equivalent Load.
kRL (Ω)δωp (kHz)δωη (kHz)Pout (W)ηξ
0.351.338.137.7160015900.93110.93170.9895
2.337.336.39879670.96030.96020.9732
3.336.233.57367050.97200.97200.9254
Table 4. Parameters with Fixed Equivalent Load and Variable Coupling Coefficient.
RL (Ω)kδωp (kHz)δωη (kHz)Pout (W)ηξ
2.30.2524.522.610229930.96020.93170.9224
0.3537.336.39879670.96030.96020.9732
0.4550.949.99749580.96020.96020.9804
Table 5. Parameters of the wireless power transmission system (symmetrical structure).
ParametersR1 (mΩ)L1 (μH)C1 (nF)R2 (mΩ)
value473084.4347
ParametersL2 (μH)C2 (nF)RL (mΩ)f (kHz)
value3084.432.3Ω100
Table 6. Results of the power-frequency splitting point calculation.
kRL (Ω)Graphical MethodsξComputational Programming Methodsξ
ωp1ωp2ωη1ωη2ωp1ωp2ωη1ωη2
0.251.389.67115.1789.93114.850.977389.67115.1789.91114.870.9788
0.351.386.22123.8186.40123.560.988686.22123.8186.39123.580.9894
0.451.383.16134.6583.29134.440.993483.16134.6583.28134.450.9938
0.252.390.16114.5490.99113.520.924190.16114.5590.94113.570.9278
0.352.386.55123.3387.08122.590.965586.55123.3487.06122.620.9666
0.452.383.41134.2583.80133.640.980383.41134.2583.78133.660.9811
0.253.390.94113.5092.97111.160.806390.97113.5392.81111.280.8187
0.353.387.06122.5888.22121.020.923487.07122.6088.17121.070.9260
0.453.383.78133.6384.60132.360.958183.79133.6484.57132.400.9595
Disclaimer/Publisher’s Note: The statements, opinions and data contained in all publications are solely those of the individual author(s) and contributor(s) and not of MDPI and/or the editor(s). MDPI and/or the editor(s) disclaim responsibility for any injury to people or property resulting from any ideas, methods, instructions or products referred to in the content.

