Abstract
In order to achieve peak carbon and carbon neutrality targets, a high number of distributed power sources have been connected to distribution networks. How to realize the planning of a distribution network containing integrated energy under the condition of carbon capture and complete the exceedance test of the distribution network under the condition of accessing a large number of distributed generators has become an urgent problem. To solve the above problem while promoting sustainable development, this work proposes an active distribution network risk-planning model based on multisource data from carbon capture and the Power Internet of Things. The model calculates the semi-invariants of each order of the node state vectors and branch circuit current vectors and then utilizes Gram–Charlier-level expansion to obtain the exceeding probability density function and the probability distribution functions of the node voltages and line powers in the distribution network. Combined with multisource data, an active distribution network with an integrated energy system designed for carbon capture was modeled. According to the risk scenario of the distribution network, the nonconvex constraints in the model were simplified by second-order cone relaxation, and the optimal planning scheme of the distribution network was solved by combining the Gurobi solver with the risk index as the first-level objective and the economic benefit as the second-level objective. The simulation results of a coupled network consisting of a 39-node distribution network and an 11-node transportation network verified the effectiveness of the proposed model.
1. Introduction
Distribution networks directly affect power users and are responsible for the important task of power distribution, which plays a key role in the economics, security, and stability of power grids and facilitates the integration of distributed equipment into the grid. The development of digital technologies likewise poses significant challenges to the security and reliability of smart grid networks [1,2,3,4]. With integrated energy systems, traditional power data collection platforms have fewer monitorable points, require a single type of monitoring data, and lack multivariate data-processing functions. Existing distribution network risk-planning techniques are becoming increasingly difficult to adapt and apply in relation to the special requirements of smart and transparent distribution networks. Applying the Power Internet of Things requires multiple monitoring nodes [5]; it is characterized by multiple connected nodes and multiple data types. By use of many monitoring nodes, the Power Internet of Things can develop the same data in multiple dimensions, thus improving the accuracy and real-time performance of distribution network modeling [6]. In order to improve the distribution network’s security system, in combination with Power Internet of Things-related technology, when multiple source loads must access the distribution network, it is necessary to carry out risk-related research in order to develop an active distribution network that comprises an integrated energy system, involving the calculation of the high risk of the distribution network.
The traditional deterministic power flow calculation method [7] requires several calculations when used to analyze the distribution network’s operation risk in a quantitative way, and references [8,9,10,11,12] have described a variety of probabilistic power flow algorithms that are commonly used. References [13,14] analyzed the accuracy of Monte Carlo methods based on specific scenarios. References [15,16] considered the correlation between wind farms that are close together when analyzing the probabilistic power flow operation characteristics of power systems. Reference [17] illustrated that the semi-invariant method can be used to effectively resolve the probability distribution of different state quantities. Reference [18] utilized linear relationships in developing probabilistic power flow calculations for distribution networks containing integrated energy sources and combined them with level expansion to quickly obtain the probability distribution functions of various state quantities.
At present, integrated energy systems making use of multienergy coupling are increasingly being connected to distribution grids, producing a close connection between the integrated energy systems and distribution grids in relation to the supply and conversion of, and demand for, energy. References [19,20,21] explained the role of integrated energy systems and carbon capture technologies in reducing grid carbon emissions and improving the operational stability of distribution grids. Reference [22] proposed the introduction of a carbon trading mechanism in distribution grids containing integrated energy sources and suggested that distribution grids reduce carbon emissions through stepped carbon pricing. Reference [23] introduced a power-to-gas (P2G) device into an integrated energy system and used the CO2 emitted by a gas unit in a methane synthesis reaction through carbon capture to improve the system’s economic qualities. Reference [24] pointed out that active distribution network planning is relevant to the optimal power flow of distribution networks; optimal power flow research is currently focused on AC optimal power flow [25]. Developing optimal AC currents is relevant to nonlinear planning because of the nonlinear characteristics of its constraints. The earliest validation of its effectiveness when used to optimize distribution network power flow was given in relation to the use of evolutionary algorithms, such as the genetic algorithm [26,27] or particle swarm algorithm [28,29,30]. However, evolutionary algorithms also carry obvious defects, such as their inability to guarantee global optimization when used to solve nonlinear models. To address this need, reference [31] established a systematic branch flow model to solve the optimal flow model framework. Meanwhile, references [32,33,34] provided relaxation accuracy proofs. Second-order cone programming has been used to obtain globally optimal solutions, which offer faster solution speeds, by transforming the original model into its convex programming form.
Distribution network risk-planning research also needs to consider the strong correlation amongst random variables and the fact that the distribution network improvement planning program is highly random. Therefore, to address the above problems, this paper uses Gram–Charlier series expansion to obtain the exceeding probability density function and probability distribution function of a distribution network’s node voltage and line power, establishes a two-layer planning model, and optimizes the planning scheme of the distribution network through second-order cone relaxation combined with the Gurobi solver, with the premise of ensuring that the risk probability of the distribution network is controllable.
In order to realize the safe access of new energy generators, electric vehicles, and integrated energy systems to the distribution network, this paper establishes a risk planning model that can realize the address selection and capacity determination of new energy generators and electric vehicles and, at the same time, regulate the energy storage equipment to realize the efficient utilization of diversified energy. Finally, the exceedance testing model can assess the risk of the completed distribution network framework and calculate the exceedance probability of voltage at each node of the distribution network and the exceedance probability of power at each branch under different scenarios. In this paper, simulations are conducted on the IEEE examples with total loads of 5.57 MW and 6.47 MW, respectively, to verify the effectiveness of the model.
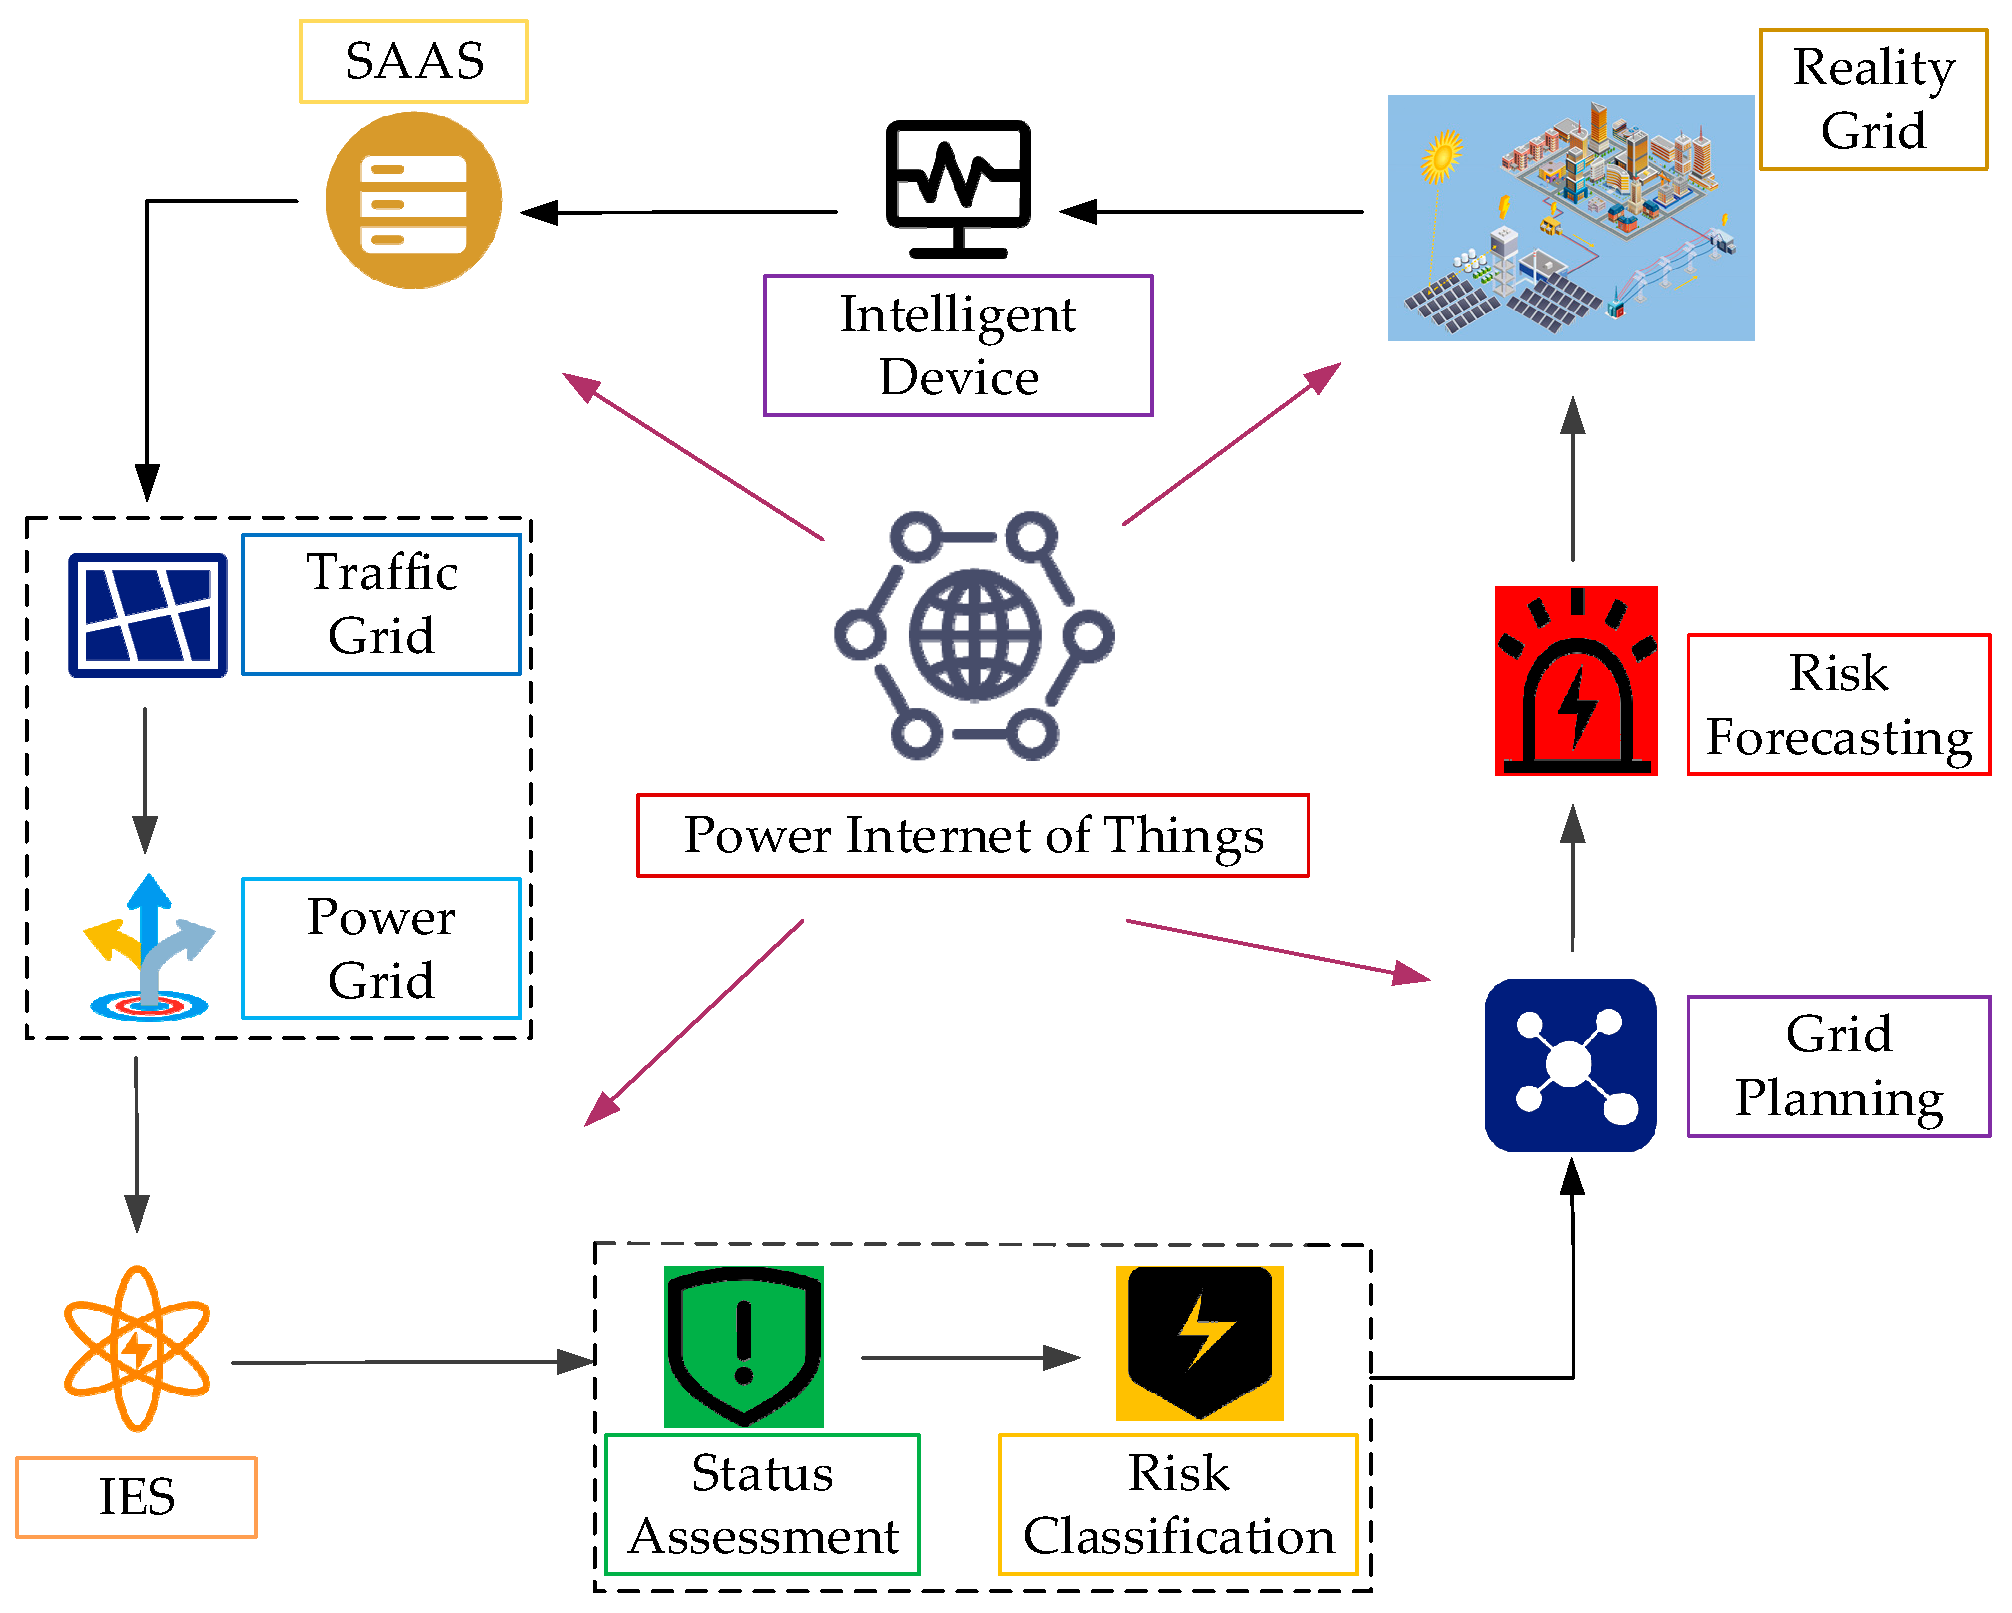
Figure 1 shows a coupling model related to the power grid and traffic grid used in this work. Using multisource data derived from the Power Internet of Things, distribution network status assessment and risk classification were carried out. Based on the second-order cone planning method, used to adjust the existing distribution network’s frame structure and test its characteristic indexes, the main features of the data structure were used to construct an evaluation system for the distribution network’s risk characteristics.

Figure 1.
Risk-planning model for distribution networks based on the Internet of Things for electricity.
2. Model Descriptions
2.1. Semi-Invariant-Based Risk-Prediction Model for Distribution Networks
Complex convolutional operations can be simplified using the numerical feature of semi-invariance. The semi-invariants of the load margin are obtained by solving the semi-invariants of the input variables and the sensitivity matrix. A semi-invariant has two important properties: additivity and homogeneity. As a result of these two properties, linear combinations of random variables can be transformed into linear operations of their semi-invariants; this is essential when simplifying stochastic analysis calculations. Compared with other probabilistic power flow methods, the analytical method represented by the Gram–Charlier algorithm has faster solution speed and computational accuracy.
In this paper, a probabilistic power flow algorithm based on semi-invariance and level expansion is used to calculate the expectation and sensitivity matrices of the node voltages and branch currents. Then, the semi-invariants of each order of load and distributed unit output are calculated to obtain the semi-invariants of the injected power at each node, which are converted into the semi-invariants of each order of the node state vectors and tributary current vectors. The probability density function and probability distribution function of the node voltage and branch current can be obtained after one calculation using level expansion.
The semi-invariants of each order of the variable can be obtained by applying certain mathematical transformations to the characteristic function of the distribution function F(x). The characteristic function can be expressed as
Taking the natural logarithm of the above equation and expanding it according to the McLaughlin series formula, we derive the following equation:
where the coefficient yr is an r-order semi-invariant, s denotes the number of terms in the expanded expression, and o(ts) denotes the remaining terms.
For normally distributed load power, the first-order semi-invariant is mathematically expected, the second-order semi-invariant is equal to the variance, and the third- and higher-order semi-invariants have a value of zero:
To derive a discretely distributed load power, we must first find its center moments in each order. The Gram–Charlier series can be grade-expanded according to the orthogonal expansion of Hermite polynomials. According to Gram–Charlier series expansion, the cumulative distribution function of a random variable can be expressed as
where xs is the specified random quantity; φ(xs) and ϕ(xs) are the probability density function and the cumulative distribution function of a standard normally distributed random variable, respectively; fr is the r-order specified semi-invariant; and hi(xs) is the i-order Hermite polynomial.
When polar coordinates are used to represent the nodal voltages, the equation for the current of the power system can be expressed as
where PF and QF are the active and reactive power of node F, respectively; VF and VT are the voltage amplitude between the two nodes; θFT is the phase difference between the two nodes; and GFT and BFT are the real and imaginary parts of the node admittance matrix YFT, respectively.
Each order semi-invariant of the node’s injected power can be expressed as the algebraic sum of each order of semi-invariant of the point load’s injected power and each order of the semi-invariant of the distributed injected power :
Based on linearized power flow equations and using the properties of semi-invariants instead of convolution calculations, r-order semi-invariants can be found for the node voltages and branch currents, respectively, of the variables to be solved.
2.2. Second-Order Cone-Based Active Distribution Network Planning Model with Integrated Energy Sources
In the context of peak carbon targets, carbon neutrality targets, and the development of a distributed smart grid, the supply and demand sides of the distribution network change greatly. In addition to the original basic elements, distributed devices and electric vehicles have been gradually incorporated into the distribution network, which means that a method for the optimization of the distribution network needs to be further developed [35]. Planning improvements in distribution networks is a kind of distribution network optimization measure, undertaken through line optimization and upgrading, and is intended to optimize the distribution network’s operation indexes, such as its stability and economy, under the premise of ensuring the stability of the distribution network’s grid topology.
2.2.1. Queuing Model for Fast Charging Stations
Assuming each fast charging station is simplified by the application of a queuing system and that the driving routes of EVs are simulated via the Monte Carlo method when the battery SOC of EVs, buses, and cabs in the driving state is lower than the user’s threshold, the user can select the optimal charging station for fast replenishment based on a charging station decision-making model. In addition, private electric cars and cabs can be connected to charging piles in their local areas to enable slow replenishment immediately after finishing a trip. Assuming that electric vehicles generate a charging demand as soon as they drive into the planning area, the sum of time spent searching for and arriving at the fast charging station and the queuing time is the waiting cost. The actual situation can be simplified as follows: we establish a road section impedance model according to the road’s saturation, as well as a traffic node impedance model according to the signal cycle, green letter ratio, and road section vehicle arrival rate, and then simulate the dynamic traffic network. Planning for the improvement of distribution networks can limit the problem of increasing network losses caused by large-scale EV and wind power access.
The roadway impedance can be modeled as
where a and b are roadway impedance impact factors, t0 is the zero-flow travel time, and H is the roadway saturation.
The transportation node impedance model is
where q is the vehicle arrival rate, α is the green signal ratio, and c is the traffic signal cycle. Equations (7) and (8) can be merged to obtain the actual impedance model of the road.
Electric vehicles arrive at a frequency of
where λj is the rate of arrival of users at a fast charging station at point j, tc is the segment duration, and ωi is the charging demand at point i.
The probability that a charging post in a fast charging station will be empty is
where mj is the number of fast charging piles in the fast charging station at point j, pj is the service intensity of the fast charging station at point j, and Pj0 is the probability that the charging pile in the fast charging station at point j will be idle.
The expected user queue time is
where Wjq is the expected user queuing time at the fast charging station at point j. According to the charging pile idle probability and expected time of user queuing at the fast charging station, an electric vehicle charging scenario model can be obtained.
2.2.2. Integrated Energy Station Planning Model with Carbon Capture Consideration
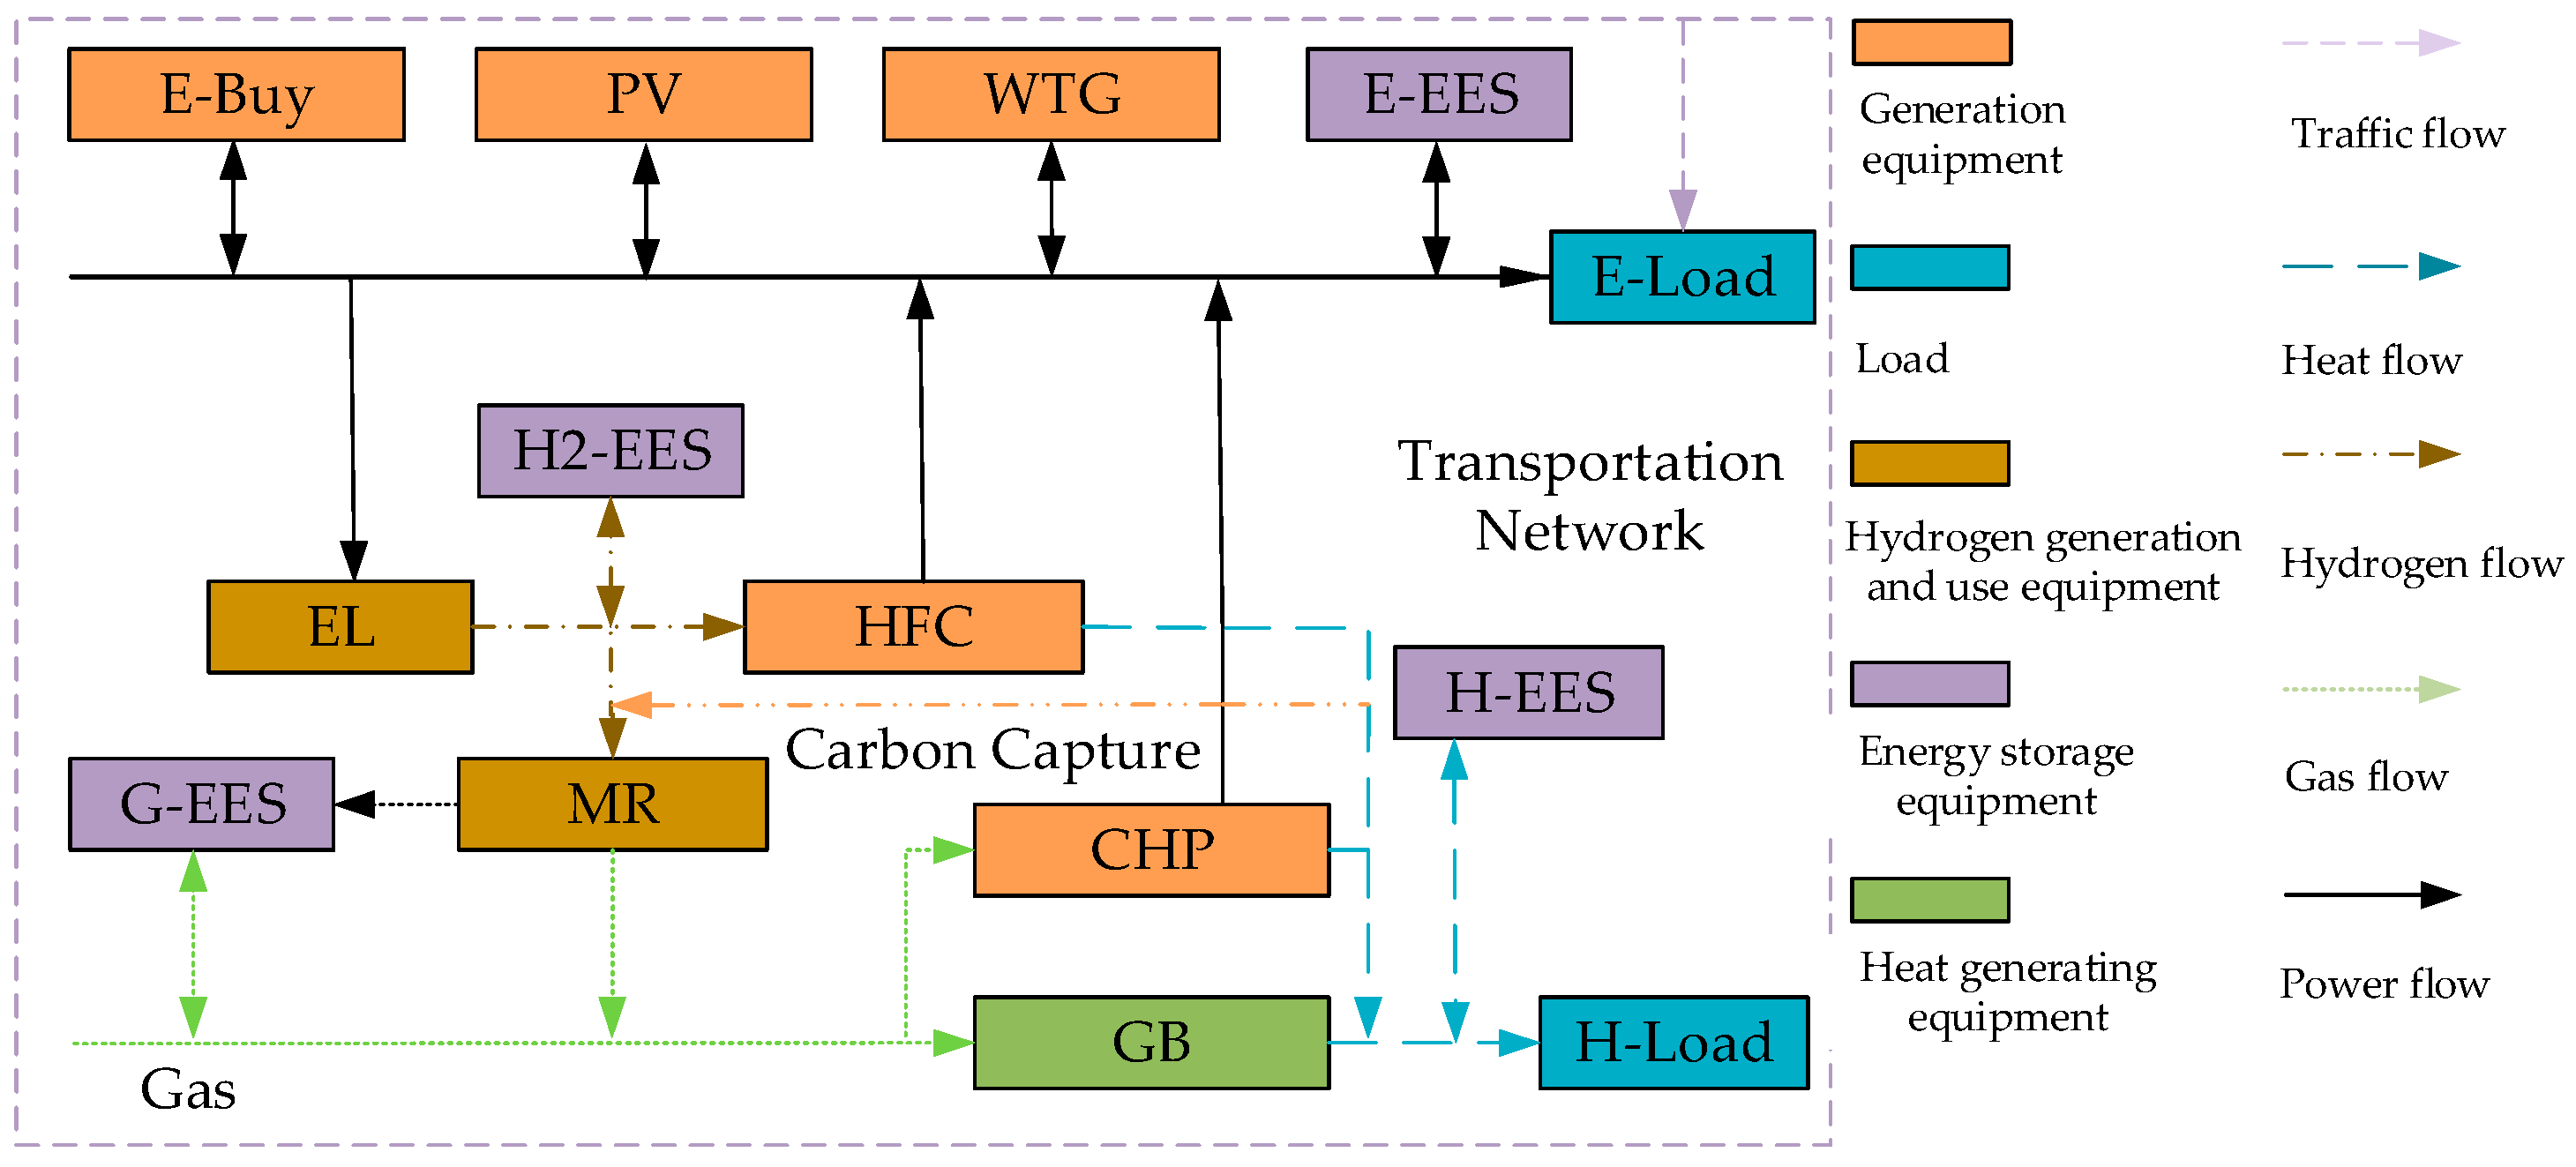
In this work, the carbon capture device, P2G, hydrogen fuel cell, and gas unit are aggregated into a carbon capture power-to-gas hydrogen fuel cell (HFC)–gas unit system, which fixes and feeds CO2 from gas boilers (GB) into a methane synthesizer (MR). The hydrogen generated by the electrolyzer (EL) is utilized to generate natural gas in addition to the CO2 fixed in the carbon capture device, which is supplied to the gas unit, and the difference between the amounts of natural gas generated and demanded on the part of the gas unit contributes to the natural gas market, while another section of the hydrogen is employed in the fuel cell reaction that supplies power via synergy [36]. This model improves system economy and balances the energy flow through electrical energy storage (EES), gas energy storage (G-EES), heat energy storage (H-EES), and hydrogen energy storage (H2-EES) devices accompanied by photovoltaic (PV) and wind turbine generators (WTG). The specific methods employed in the interconversion of energy are shown in Figure 2.

Figure 2.
Energy flow modeling for integrated energy systems.
The cogeneration unit can be modeled as
where and are the electrical and thermal energy output of the CHP unit in time period t, respectively; and are the energy conversion rates of the electrical and thermal energy in the CHP unit, respectively; is the natural gas power input into the CHP unit in time period t; and and are the upper and lower limits of the CHP unit climbing, respectively. The P2G unit operating model is
where is the electrical energy input into the electrolyzer in time period t; is the hydrogen energy input to the methane synthesis unit in time period t; is the natural gas power output by the methane synthesis unit in time period t; is the hydrogen energy output from the electrolyzer in time period t; and are the energy conversion ratios between the electrolyzer and the methane synthesis unit, respectively; and are the upper and lower limits of the electrical energy input into the electrolyzer, respectively; and are the upper and lower limits of the electrolyzer climb, respectively; and are the upper and lower limits of the hydrogen energy input into the methane synthesis unit, respectively; and and are the upper and lower limits of the methane synthesis unit climb, respectively.
The working of hydrogen fuel cells can be modeled as
where is the hydrogen energy input into the hydrogen fuel cell in time period t; and are the electric and thermal energy output from the hydrogen fuel cell in time period t, respectively; and are the conversion rates of the two types of energies (electricity and heat) in the hydrogen fuel cell, respectively; and are the upper and lower limits of the hydrogen energy input into the hydrogen fuel cell, respectively; and and are the upper and lower limits of the climb of the hydrogen fuel cell, respectively.
The mode of operation of the gas boiler can be modeled as
where is the natural gas power input into the gas boiler in time period t; is the thermal energy output from the gas boiler in time period t; is the thermal energy conversion rate of the gas boiler; and are the upper and lower limits of the natural gas power input into the gas boiler, respectively; and and are the upper and lower limits of the creep of the gas boiler, respectively.
The energy storage device’s operation can be modeled as
where is the charging power of the electric, heat, gas, and hydrogen energy storage devices in time period t; is the power output by the four types of energy storage devices in time period t; and are the state parameters of the energy storage devices; PES(t) is the final power output by the four types of energy storage devices in time period t; and Sn(t) is the capacity of the four types of energy storage devices in time period t.
3. Model Constraints
When assessing economic and security features, the distribution network’s risk of exceedance is the main focus, and its economy features are a secondary focus. The objective function can be expressed as
where φ0 is the distribution network’s voltage exceeding coefficient, φ1 is the distribution network’s power exceeding coefficient, φ2 is the distribution network’s loss coefficient, φ3 is the annualized coefficient of investment in wind power, φ4 is the annualized coefficient of investment in charging stations, φ5 is the annualized coefficient of investment in new lines, φ6 is the annualized coefficient of investment in photovoltaic energy, φ7 is the annualized coefficient of investment in integrated energy stations, Uav is the reference voltage, and Pmax is the maximum risk capacity of the lines. Cwd, Cpv, CES, Cxj, and CIES are the construction costs of wind power, photovoltaic energy, charging piles, lines, and integrated energy stations per unit, respectively, and Cbuy and Cccs are the costs of purchasing electricity from the distribution grid and carbon capture, respectively. Swd, Spv, SES, and Sxj are the quantities of wind power, photovoltaic energy, charging piles, and lines per unit, respectively.
The optimal power flow constraints for the branch circuit power flow model are
where UF,t and UT,t are the node voltage of the line inflow node and outflow node at moment t, respectively; RFT and XFT are the impedance values of the line between the two nodes; PFT,t and QFT,t are the active and reactive power on the line at moment t, respectively; IFT,t is the current on the line at moment t; Umin and Umax are the lower and upper limits of node voltage, respectively; Imin and Imax are the upper and lower limits of the line current, respectively; Pg,min and Pg,max are the upper and lower limits of the active power output from the transformer in the distribution network, respectively; Qg,min and Qg,max are the upper and lower limits of the output from the transformer in the distribution network, respectively. Sj,wdmin and Sj,wdmax are the upper and lower limits of the number of node turbine accesses, respectively; Sj,cdmin and Sj,cdmax are the upper and lower limits on the number of node accesses to the charging piles, respectively; δ(T) is the ensemble of line outflow nodes with node T as the inflow end; π(T) is the ensemble of line inflow nodes with node T as the outflow end; A is the collection of time series; B is the collection of line inflow and outflow nodes in the distribution grid; and C is the set of all nodes in the distribution network.
The electrical power balance constraints in the integrated energy station are
where is the electrical energy purchased from the grid by the integrated energy station in time period t; is the load on the node at the point where the integrated energy station is located in time period t; PDG(t) and PPV(t) are the wind turbine output and photovoltaic output in the integrated energy station at time period t, respectively; (t) is the limit placed on the electrical energy that can be purchased from the grid by the integrated energy station at time period t; and is the amount of electricity charged to the energy storage device in the integrated energy station at time period t.
The hydrogen energy balance and heat energy balance constraints in the integrated energy station are
where is the heat load of the node where the integrated energy station is located in time period t; is the heat energy provided by the gas boiler in the integrated energy station in time period t; is the heat energy charged to the thermal storage device in the integrated energy station in time period t; and is the hydrogen energy charged to the hydrogen storage device in the integrated energy station in time period t.
The natural gas balance constraints in the integrated energy station are
where is the natural gas purchased at the integrated energy station in time period t; is the natural gas load at the node where the integrated energy station is located in time period t; is the limit placed on the natural gas that can be purchased at the integrated energy station in time period t; and is the gas energy charged to the natural gas energy storage device in the integrated energy station in time period t.
The stepped carbon trading mechanism model mainly comprises a carbon emission rights quota model, an actual carbon emission model, and a stepped carbon emission trading model. For the certification of the quota of carbon emission rights, we here obtain a carbon emission quota by weighting the power purchased from the greater grid against the energy output by the gas boiler and cogeneration unit. When calculating the actual carbon emission model, the absorption of CO2 by carbon capture devices needs to be taken into account, and the difference between the two is used to obtain the actual carbon trading quota.
Second-order cone relaxation is a nonlinear optimization method, which mainly involves transforming the original model into a convex programming form and then obtaining an optimal global solution as well as a fast solution speed. The risk-planning model contains constraints of the optimal power flow, where the nonlinear term leads to the creation of nonconvex constraints. Due to the strong nonlinearity and nonconvexity of the constraints of the risk-planning model, it is difficult to solve the model directly, and the convergence of the solution cannot be guaranteed. Therefore, it is necessary to linearize the nonlinear elements of the model or perform second-order cone relaxation to transform it into a mixed-integer second-order cone programming model so that it can be solved efficiently using numerical methods.
The polarized AC power flow constraint introduces nonlinearity and nonconvexity into the distribution network planning model, which makes solving it more difficult. The introduction of intermediate variables transforms the power flow equation into a second-order conic form, which, thus, becomes a nonlinear convex planning problem, and the global optimal solution can then be obtained according to the theory of convex planning, such that Equation (19) can be transformed into
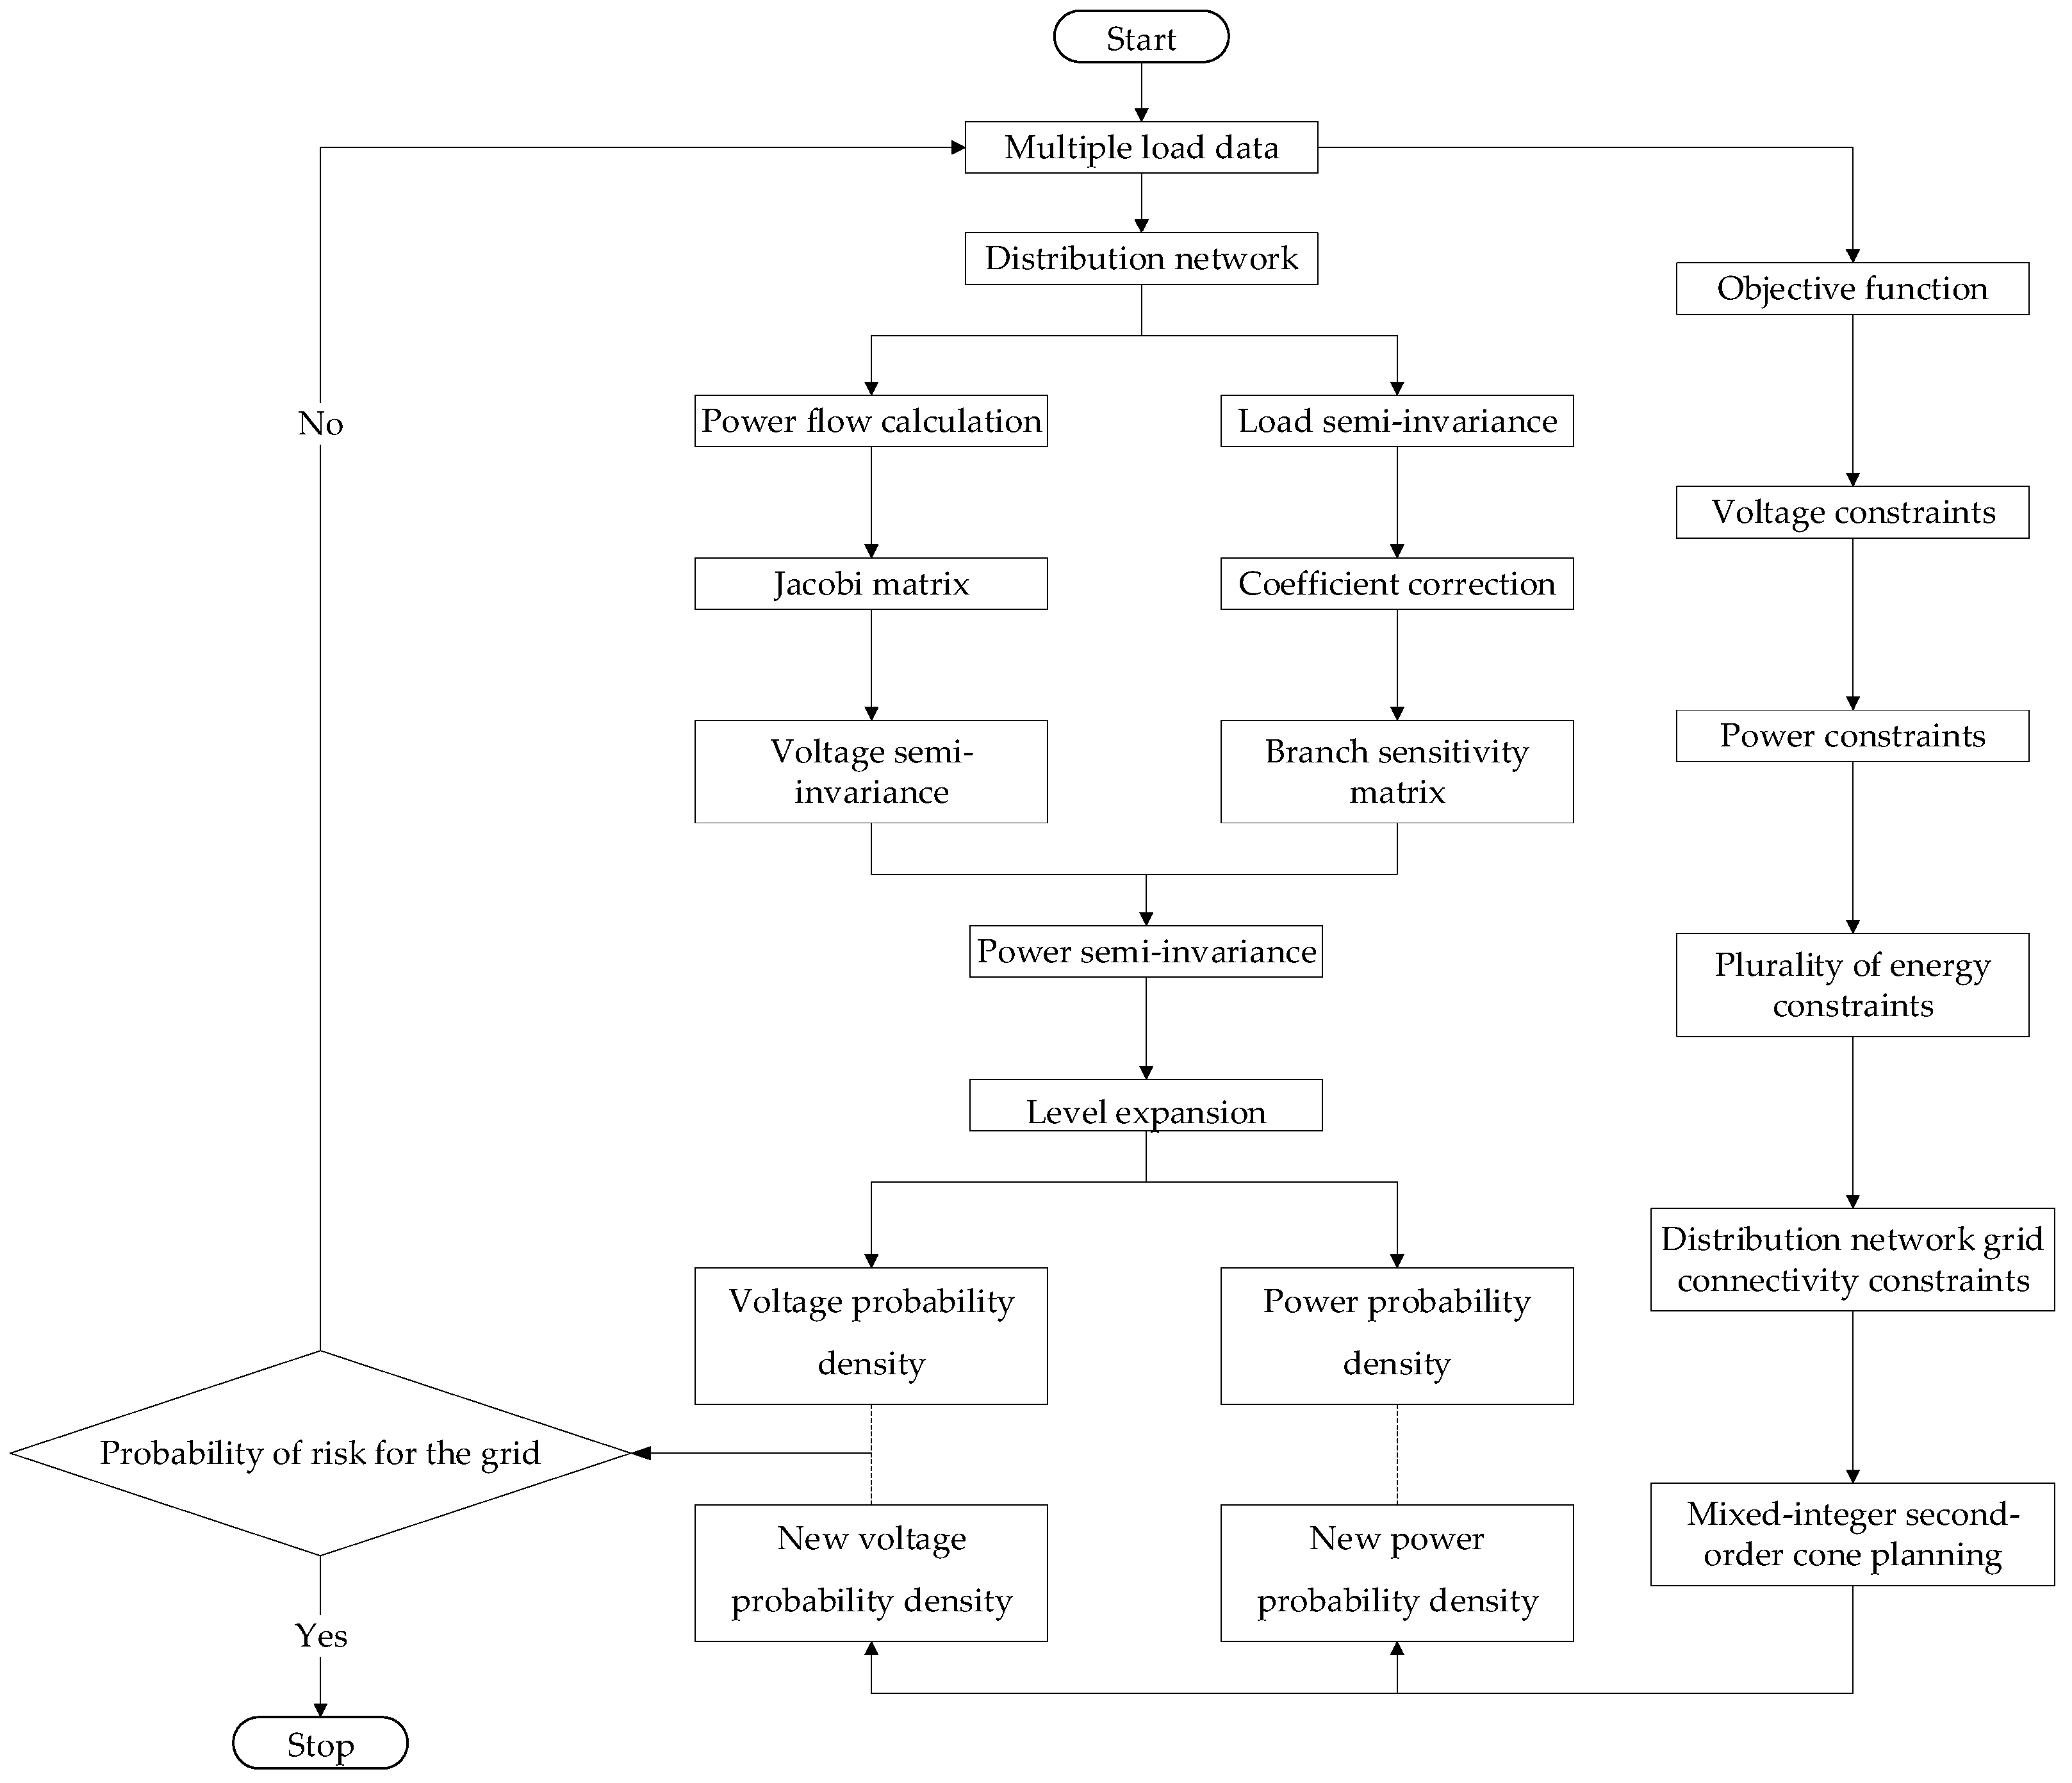
The steps for solving the risk planning and exceedance testing model are shown in Figure 3, and they are as follows: import multiple types of load data into the algorithm and find the semi-invariance of each order according to the probability distribution of the injected power at each node. The probability distribution of state variables and branch currents is obtained through the level expansion equation. Using the original node data of the distribution network and related constraints, the improved planning model of AC power flow distribution network based on mixed integer second-order conic planning is established, and the distribution network risk value is compared with that of the distribution network before the improved planning to determine the distribution network planning scheme.

Figure 3.
Distribution network risk planning and exceedance testing flowchart.
4. Case Study
4.1. Distribution Network Exceedance Testing Based on the Semi-Invariant Approach
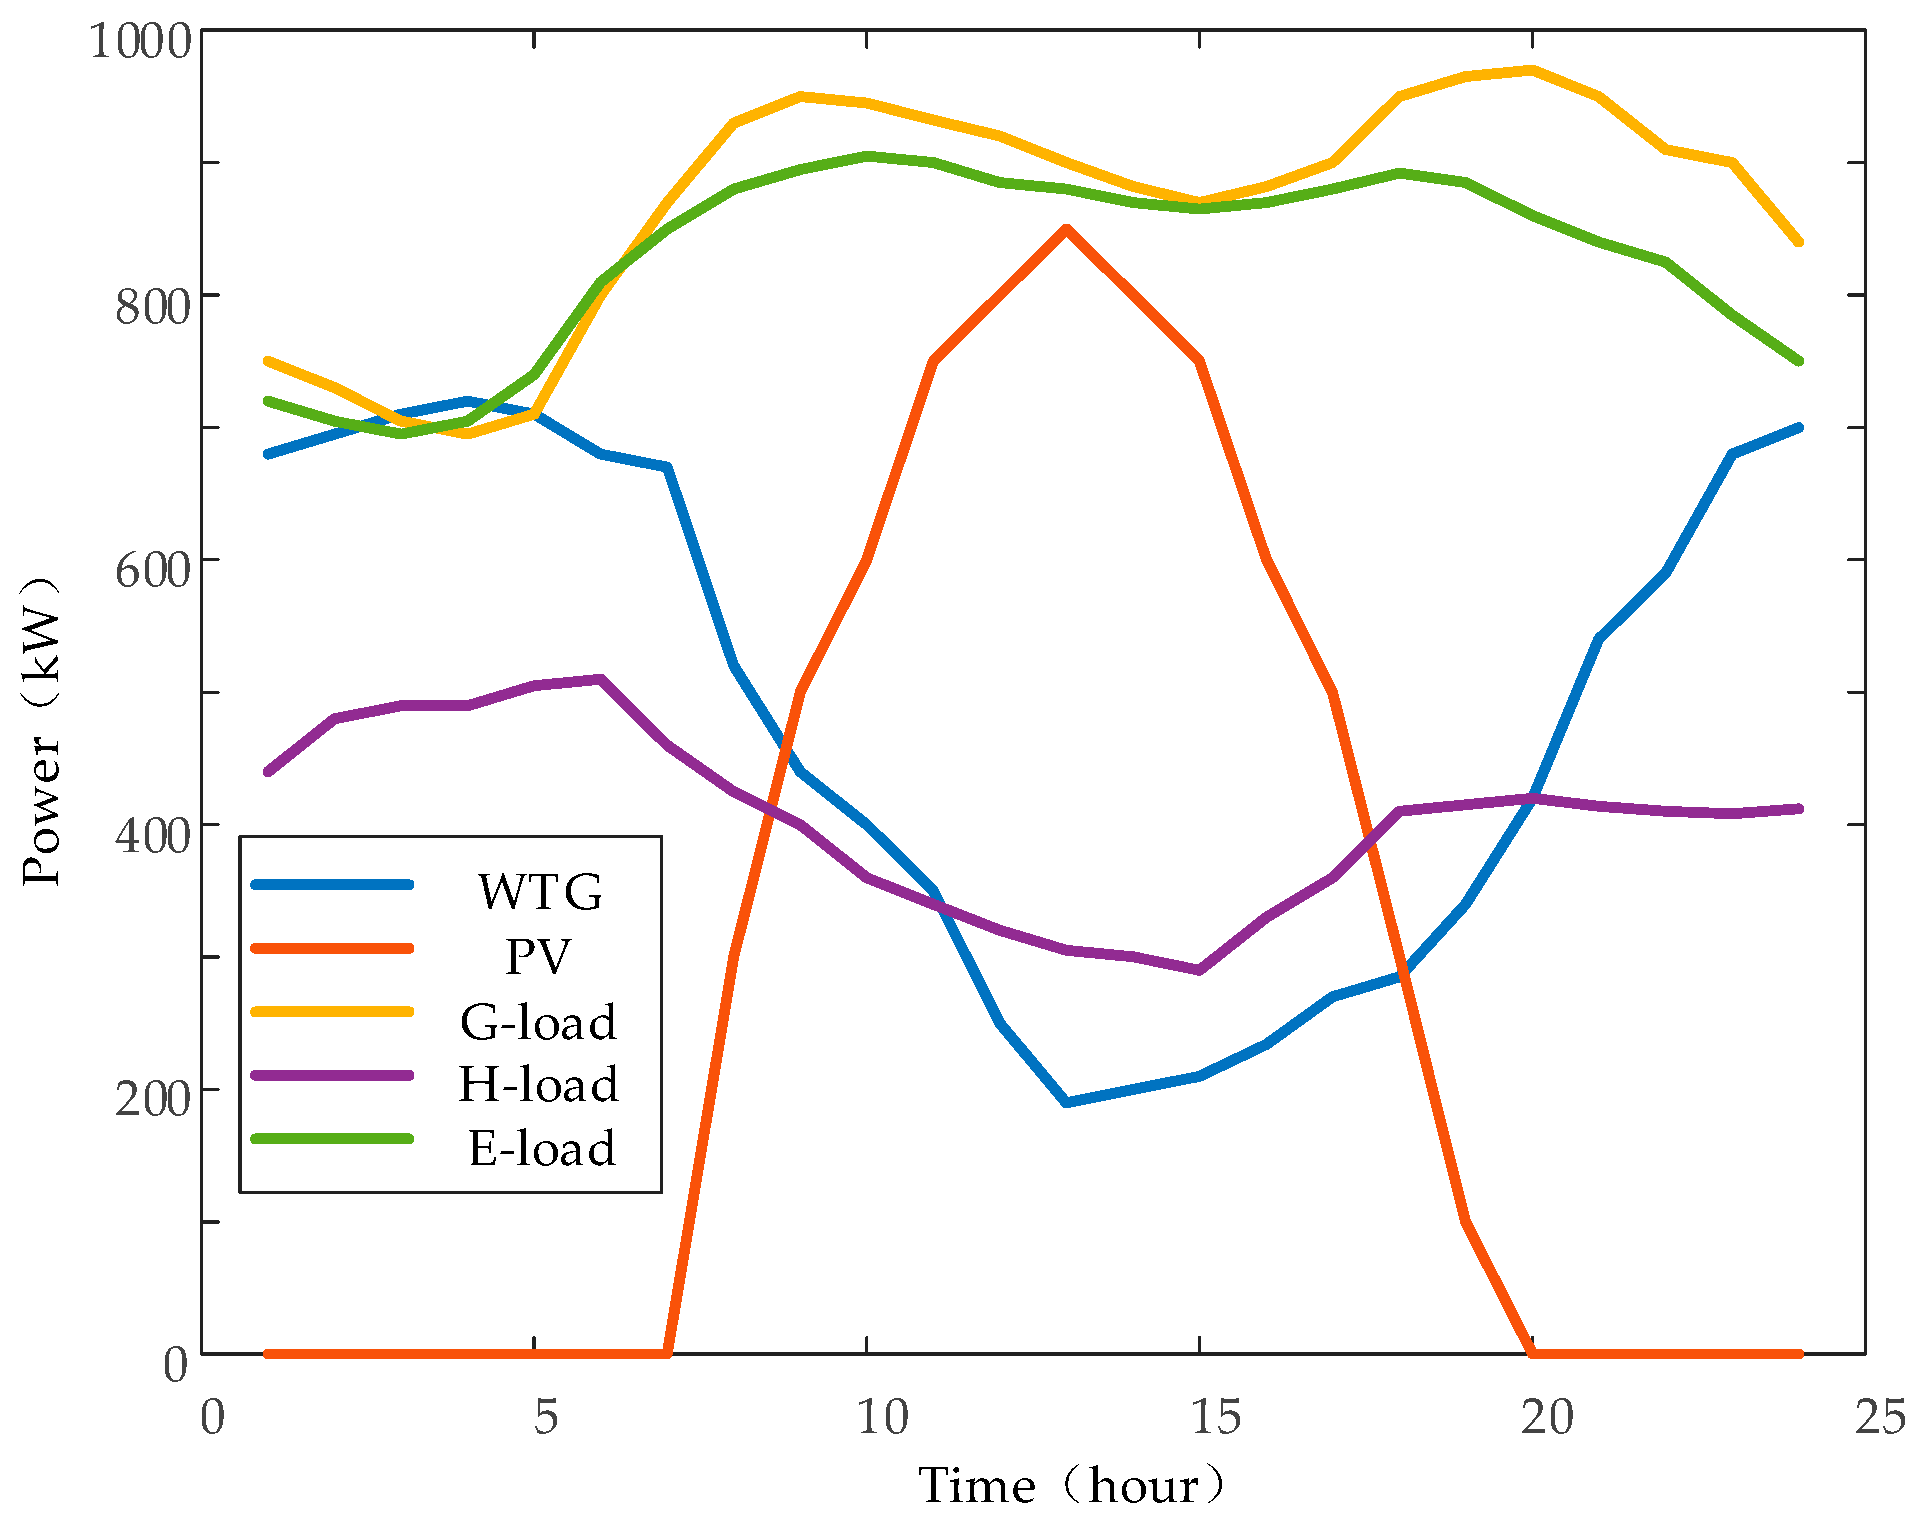
The aggregated multiple load data collected and summarized through the Power Internet of Things were input into the probabilistic power flow model, via the semi-invariant method, to calculate the probability of risk in the state distribution network. The exemplar data were derived from an urban distribution network in northern China; the time span of the data is one year, the sampling frequency is every hour, and the load curve in Figure 4 is derived from the historical data.

Figure 4.
Integrated energy system source and load data.
The IEEE 33-node distribution network model was used for validation. This distribution network has 33 nodes and 32 branches, with a total load of 5.57 MW. There are 12 and 19 nodes that are connected to the wind turbines. The combined capacity of the nodes’ wind turbines in this system is 300 kW.
The steps taken in solving the risk prediction model are as follows. Multiple types of load data are imported into the arithmetic example, and the semi-invariants of each order are found based on the probability distribution of the injected power at each node. The probability distribution of the state variables and branch currents is obtained by application of the level expansion equation. Using the original node data regarding the distribution network and related constraints, an improved planning model for the AC power distribution network based on mixed-integer second-order conic planning is established, and the distribution network’s risk value is compared with that of the distribution network before the application of improved planning to determine the distribution network planning scheme.
The list of risk probabilities associated with the distribution network is shown in Table 1, and the probability of the power exceedance risk for each line is shown in Table 2.

Table 1.
The comparison of three nonlinear planning methods.
Table 2.
Risk associated with the probability of the distribution network’s voltage exceedance.
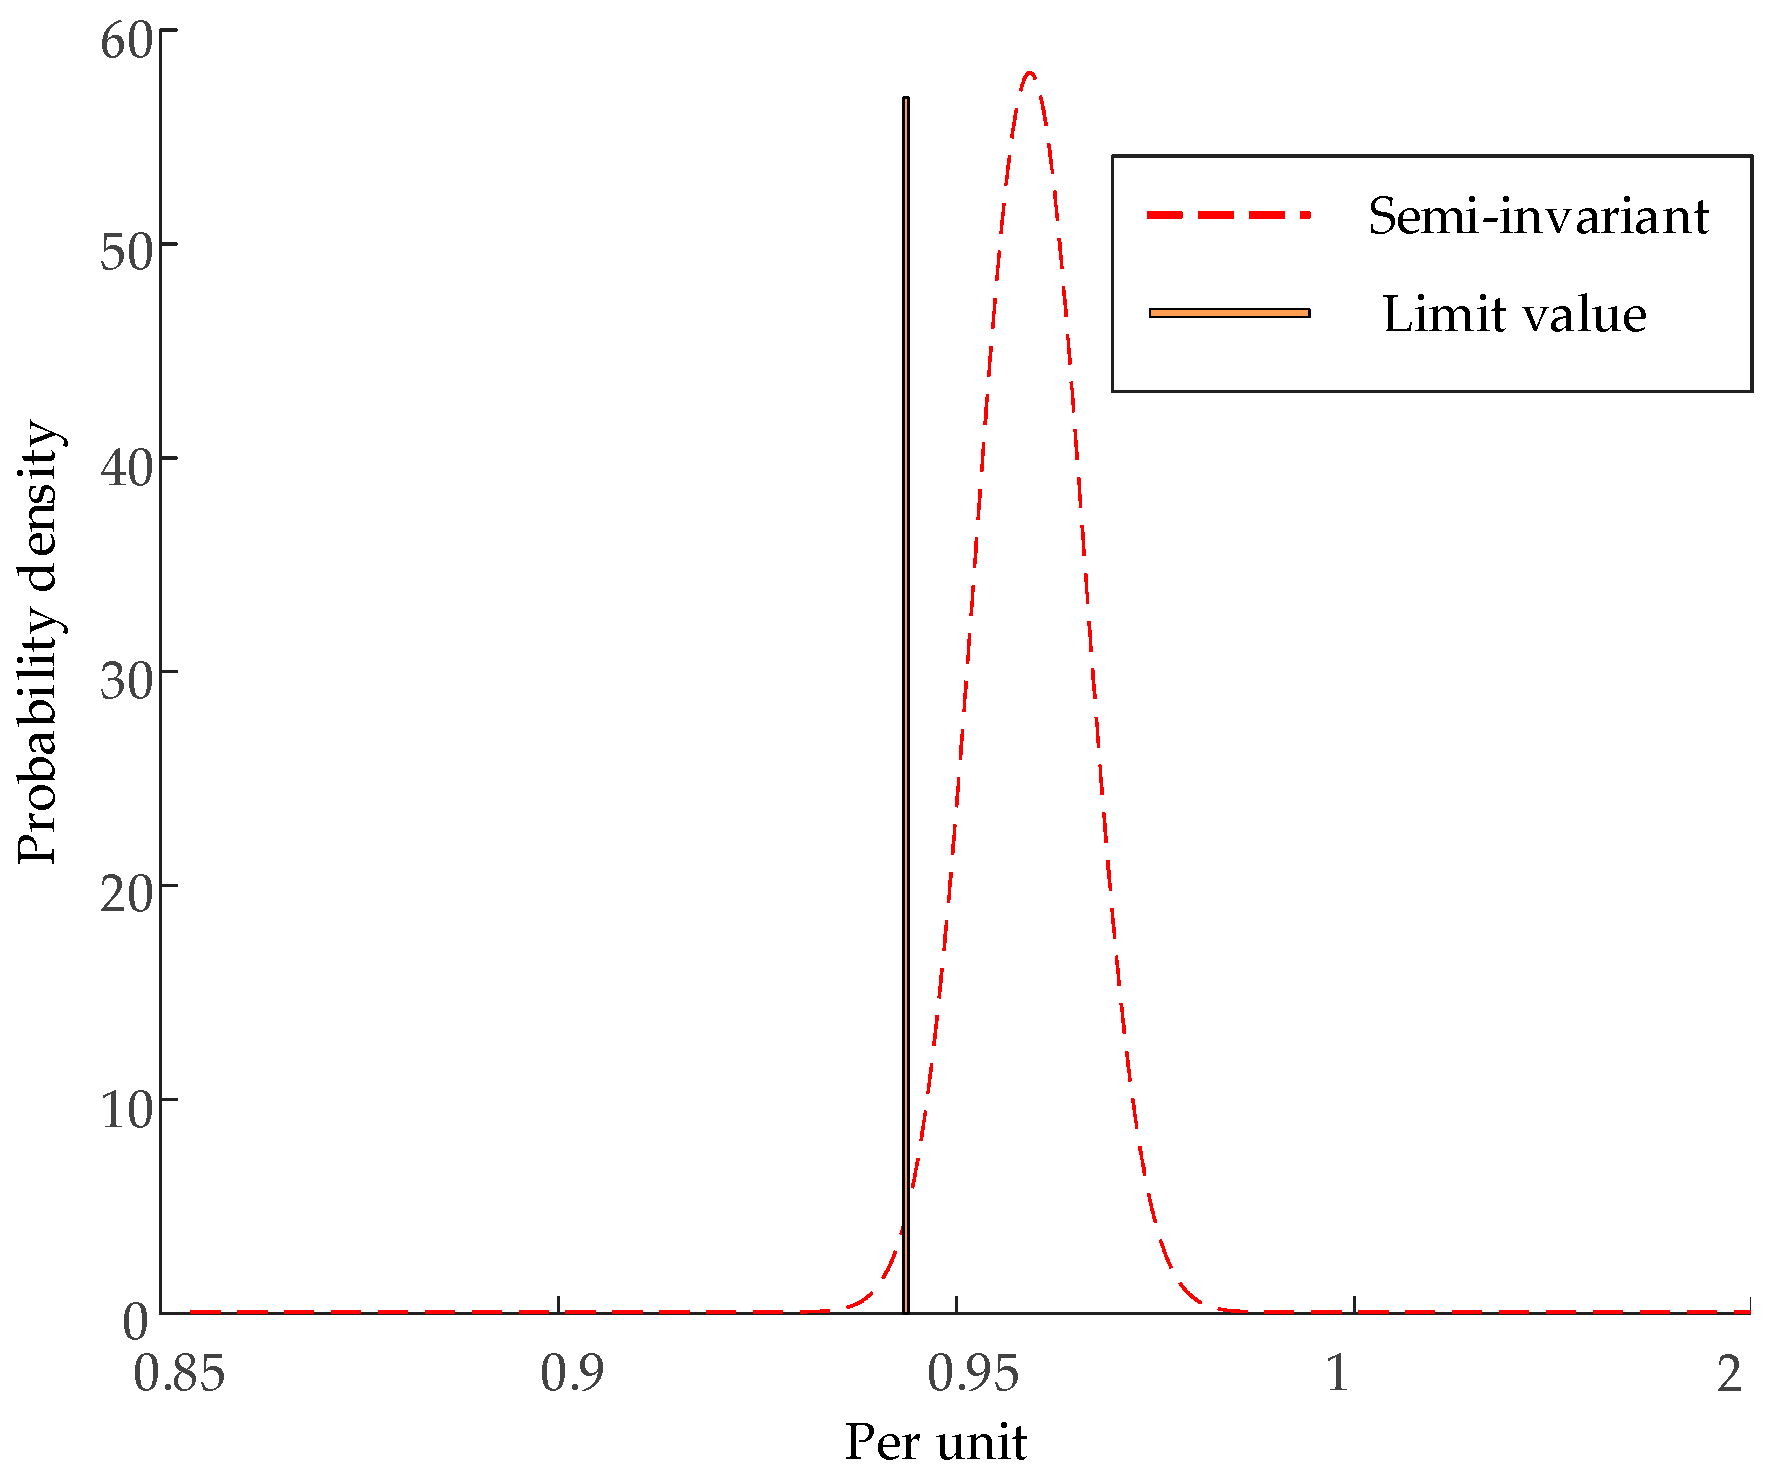
We used Gram–Charlier series expansion to find the distribution network node voltage exceedance and line power exceedance probability density function, as well as the probability distribution function, after calculating the exemplary node voltage exceedance probability, as shown in Table 2. In the distribution network, nodes 13–18 show varying probabilities of their voltage exceeding the lower limit. Nodes 14–16 show a probability of their voltage exceeding the limit by more than 1%, indicating a higher risk level. Nodes 17 and 18 show a probability of the voltage exceeding the limit by more than 10%, indicating a serious risk. In the calculation example, the probability of the power exceeding the limit of the line is shown in Table 3. Lines 6, 22, and 23 are all associated with the possibility of their power exceeding the limit. These probabilities for lines 6 and 22 exceed 1%, indicating a higher risk level. After the application of the method outlined in Section 2.1, the results of voltage testing at the 14th node of the distribution network are shown in Figure 5.
Table 3.
Probability of power exceedance risk in the distribution network.
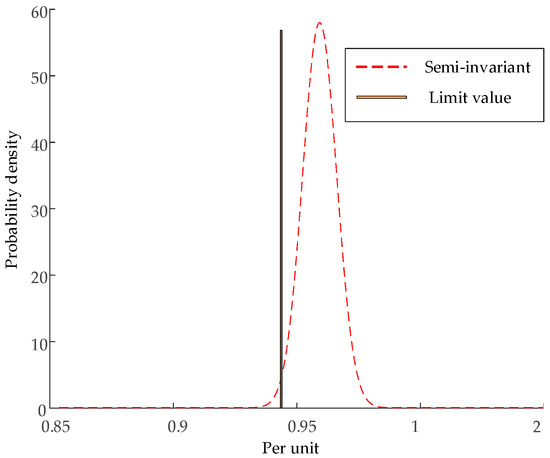
Figure 5.
Node 14 voltage probability distribution.
4.2. Validation of a Two-Tier Planning Model Based on Second-Order Cones for Integrated Energy-Containing Distribution Networks
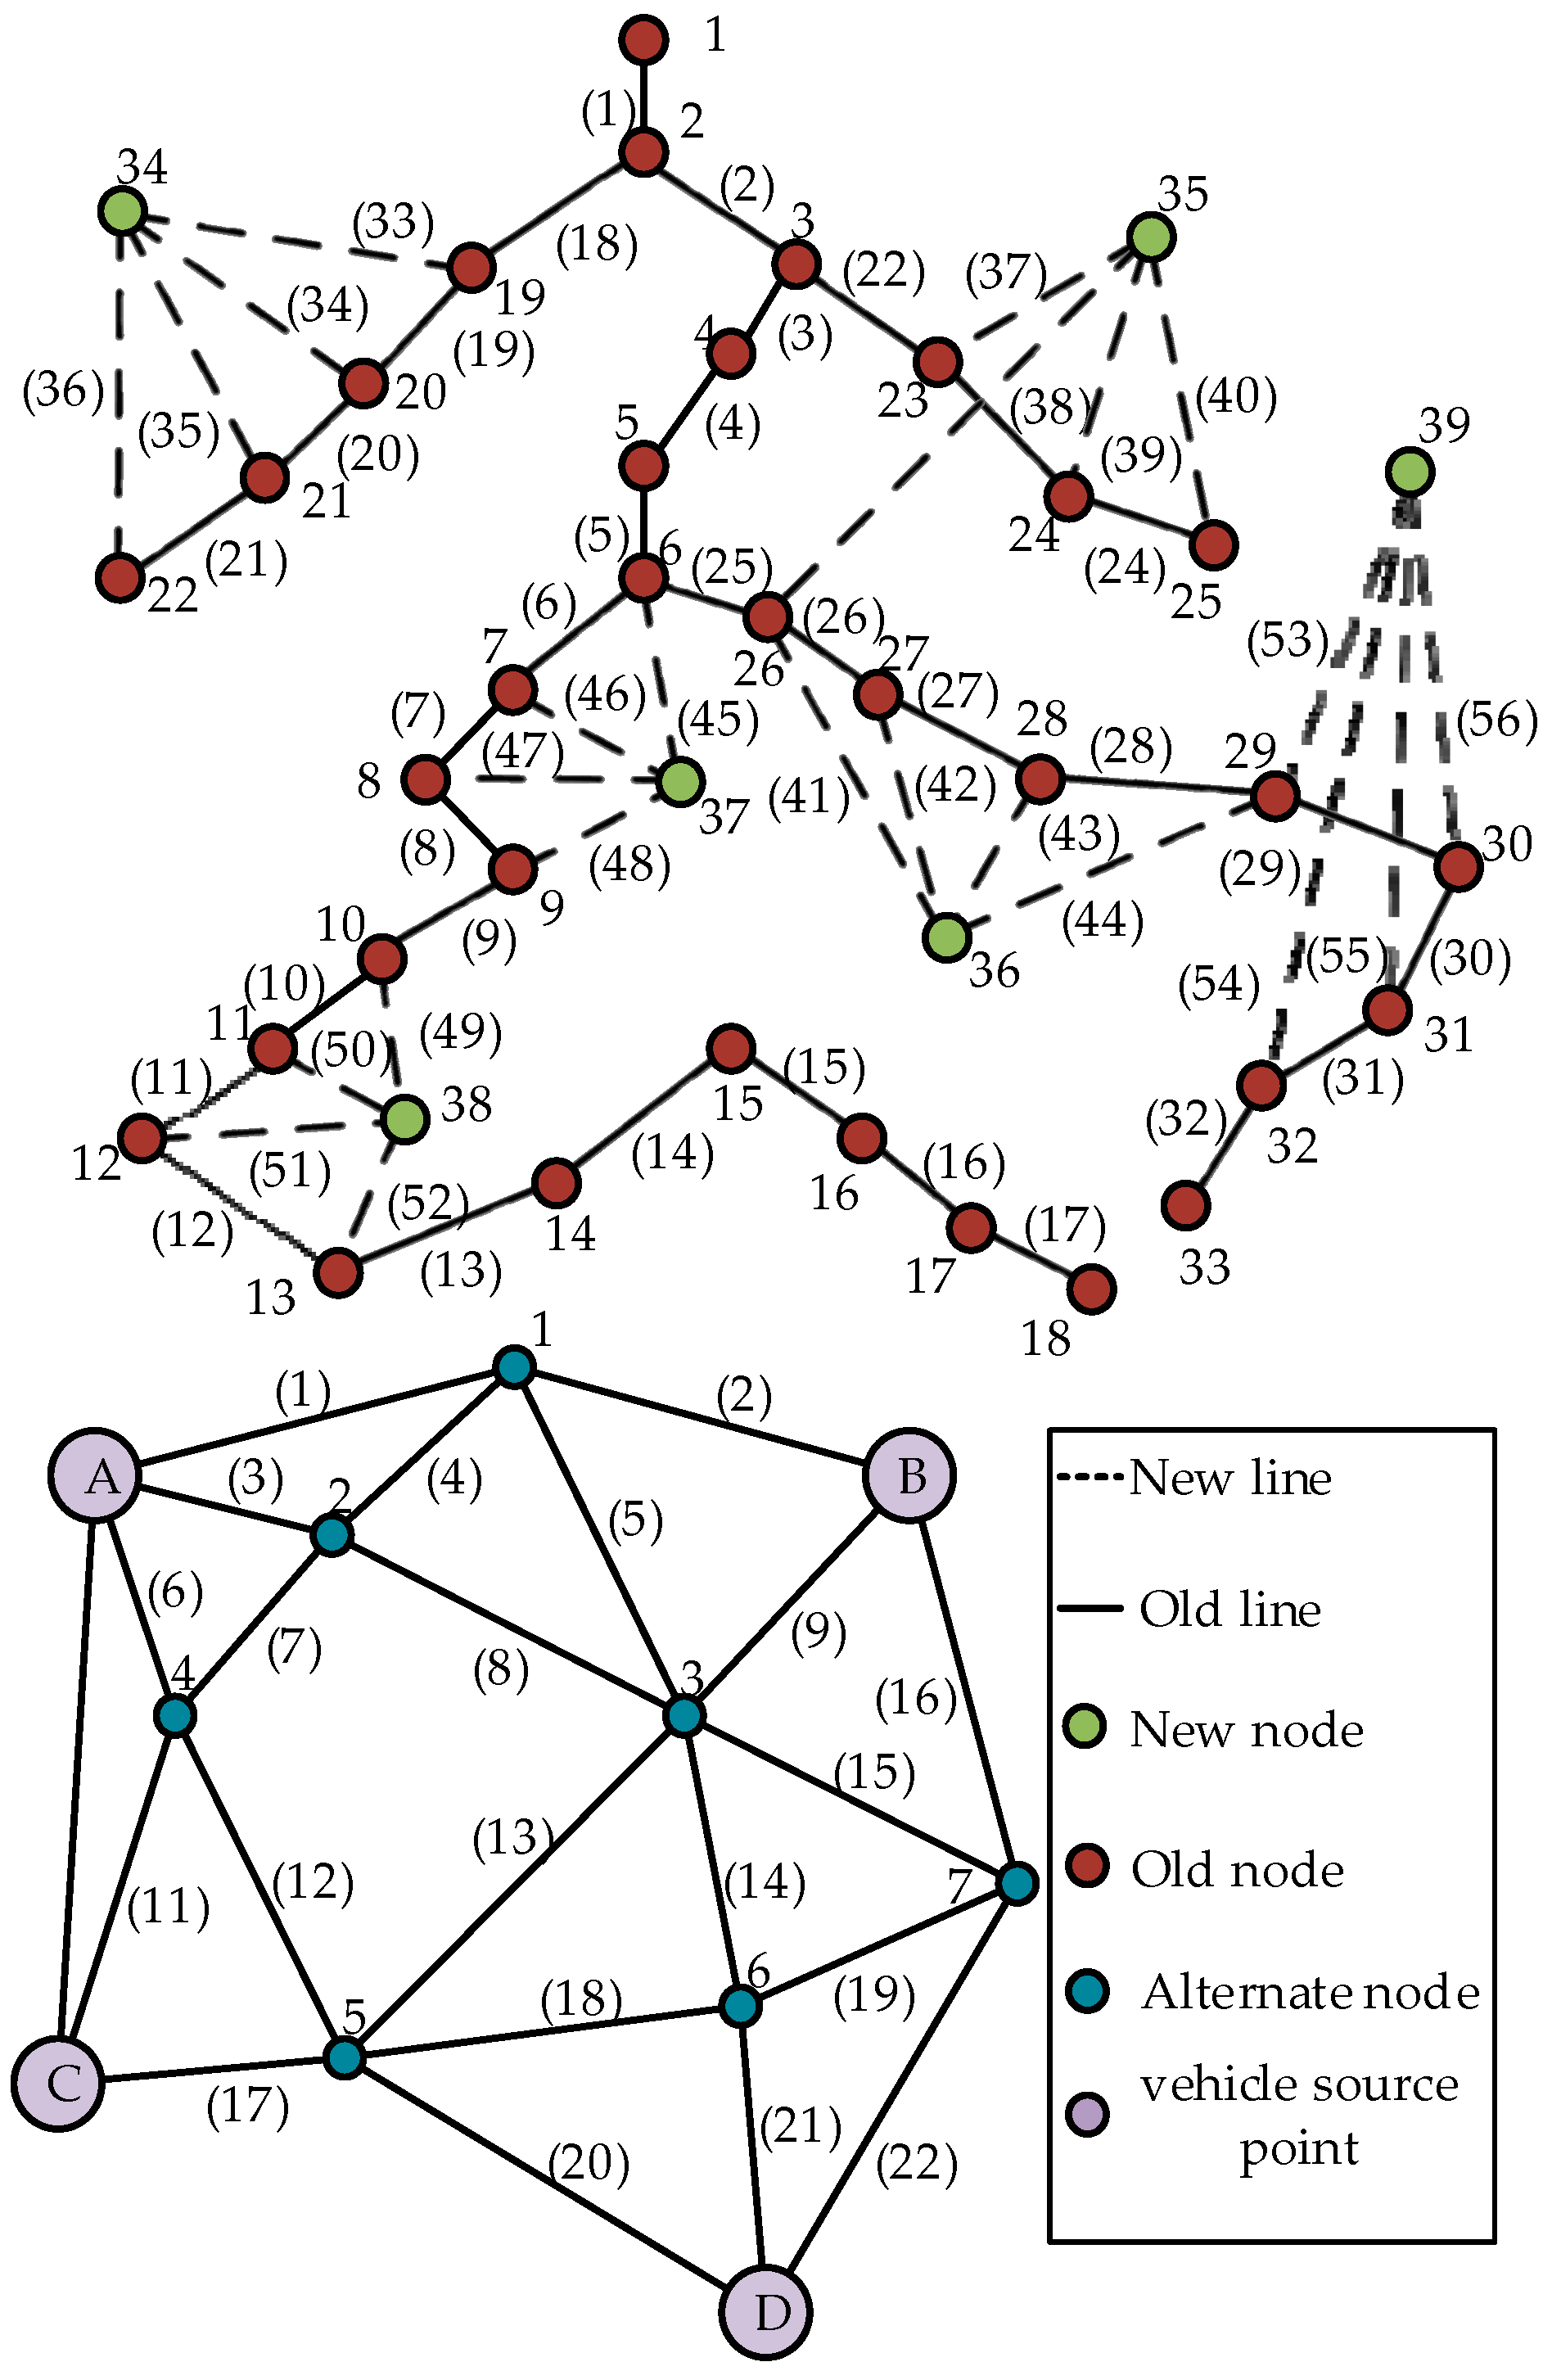
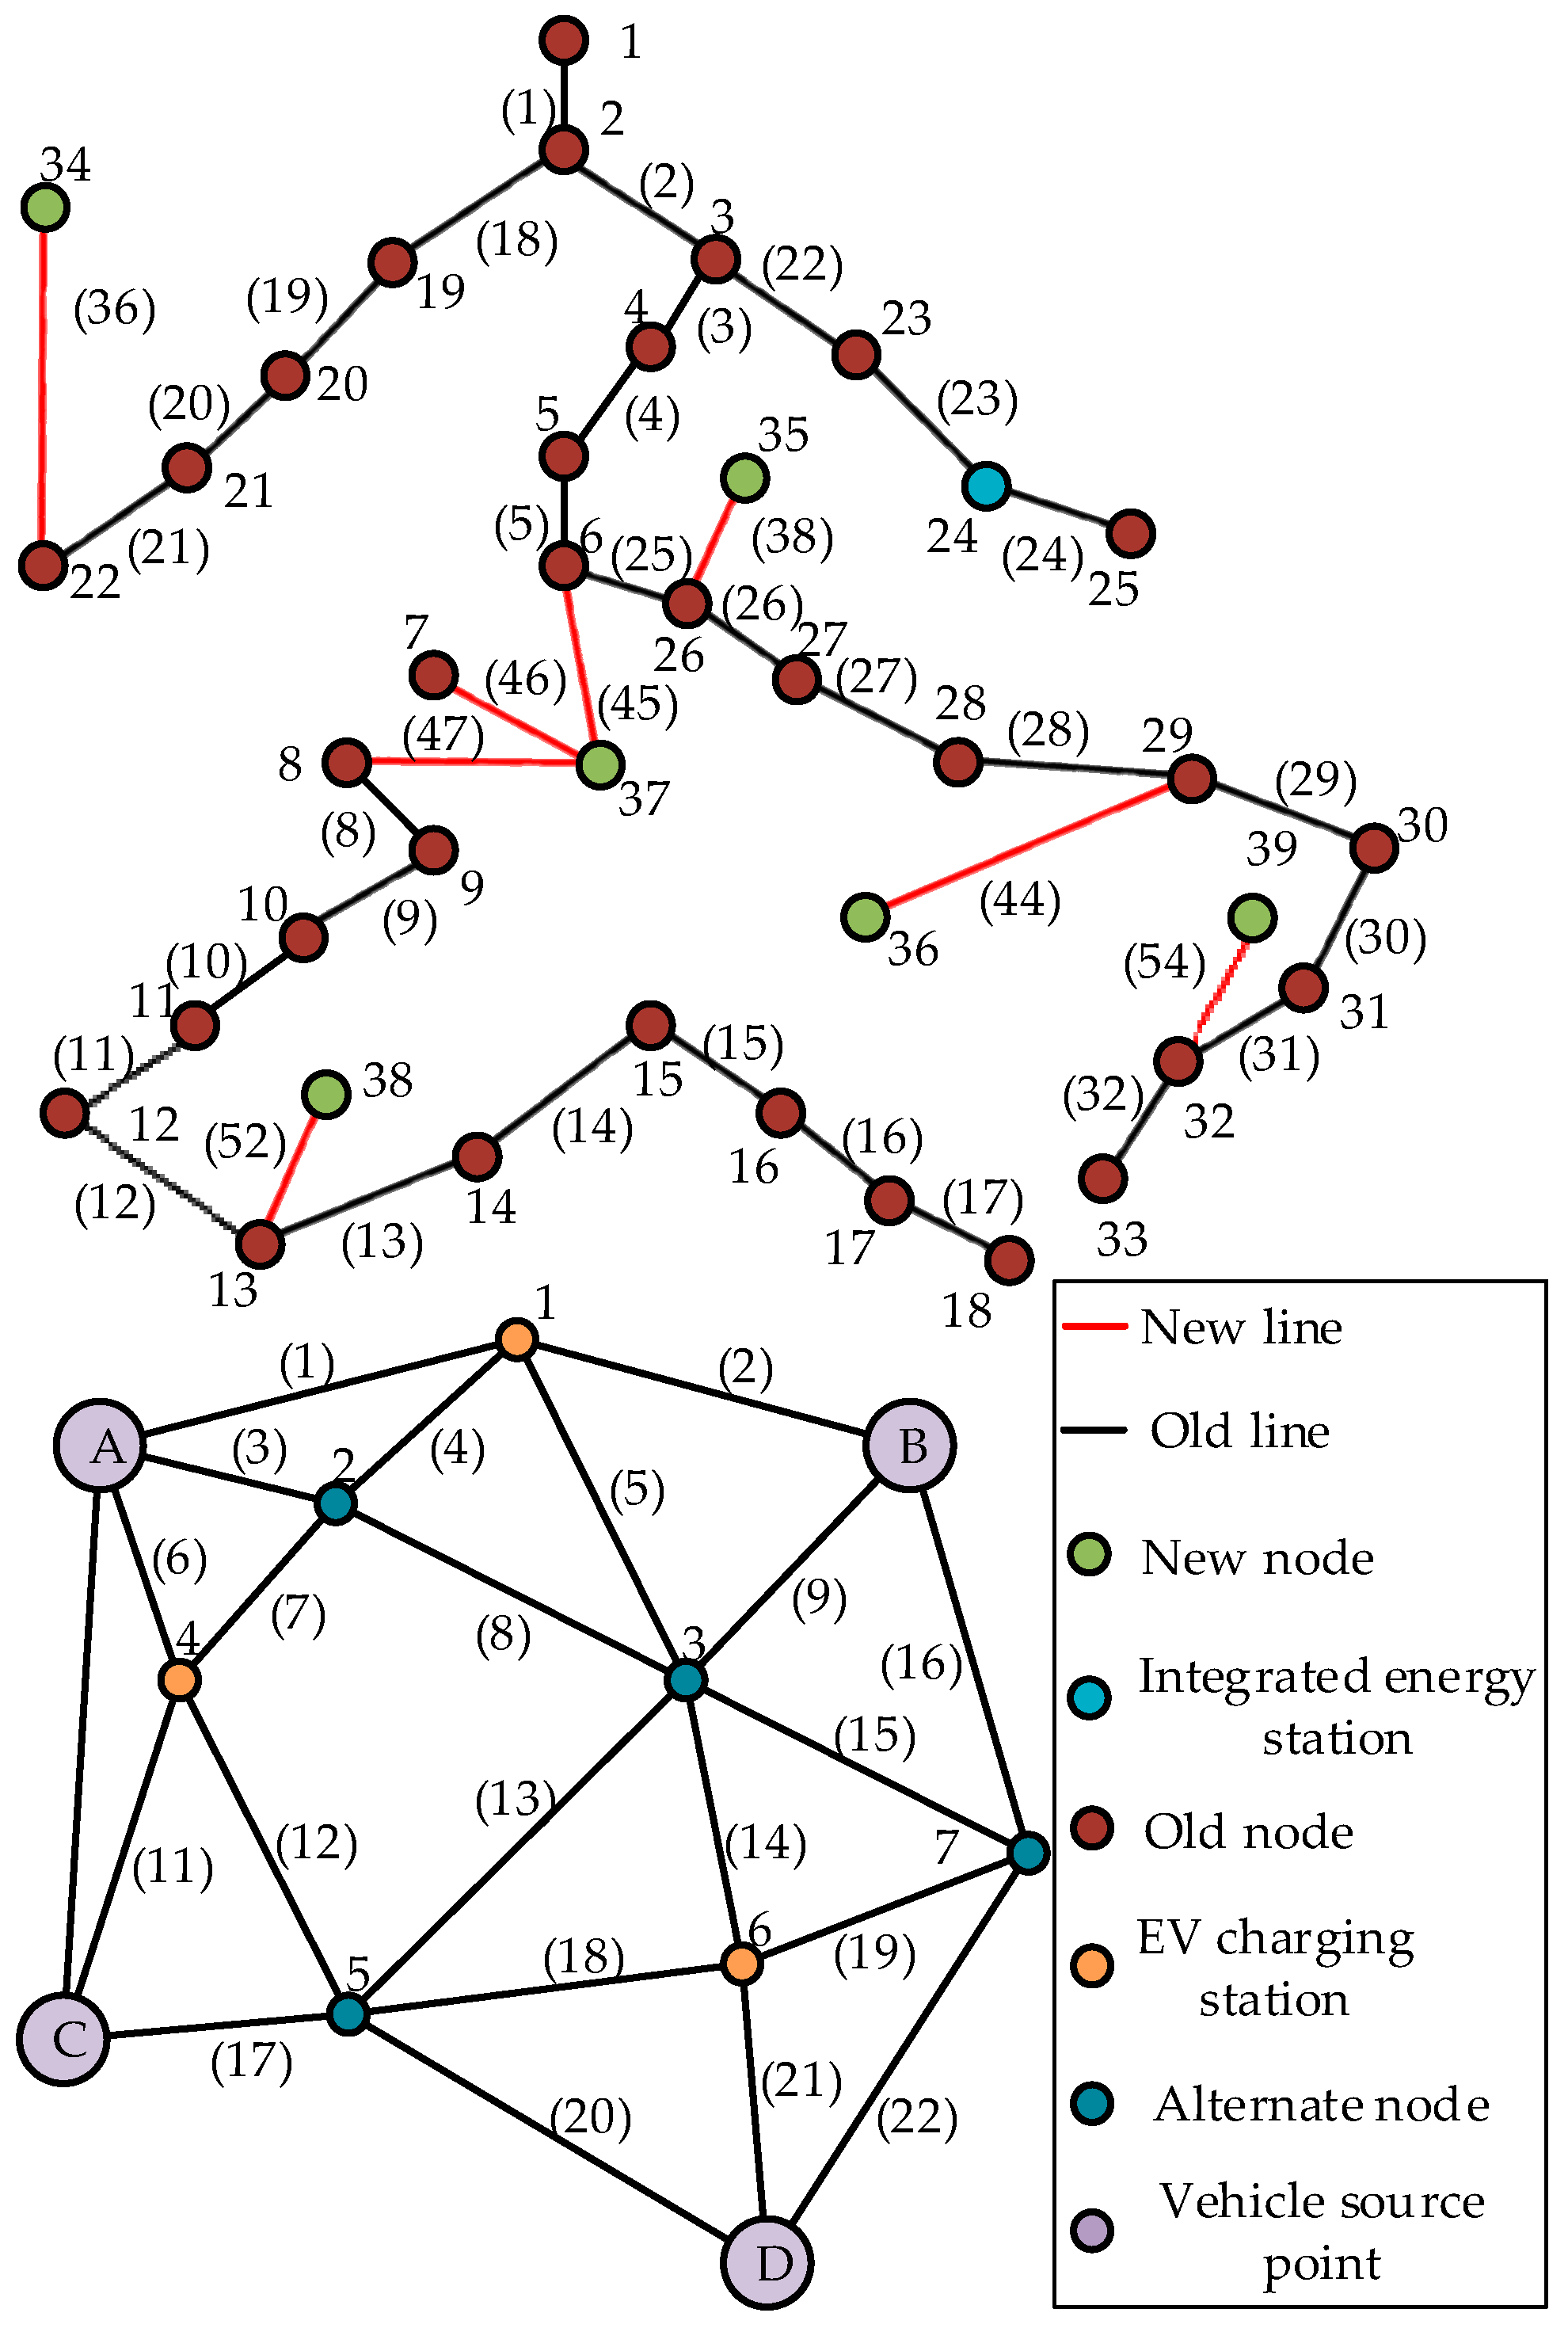
The historical load data were imported into the improved IEEE-33 node, the topology of which is shown in Figure 6; the distribution network contains 39 nodes and 56 branch roads, and the transportation network contains 22 traffic lines. The last six green nodes are new nodes, and the last 24 routes are planned for construction, with a total load of 6.47 MW. The numbers of the nodes planned for connection to wind turbine generators are 12, 19, 23, 35, 36, 37, 38, and 39.

Figure 6.
Topology of the improved IEEE-33 distribution (top) and transportation (bottom) networks.
The capacity of a single wind generator in the system is 50 kW, and its maximum allowable penetration rate is 40%. In this case, there is a charging demand for 4200 EVs during service hours, and each EV charging post can provide 48 kW of charging power. The transportation network features four main vehicle source points, A to D. It is planned to connect three of the seven EV fast charging station sites to the new nodes 37–39. In order to validate the impact of carbon capture and integrated energy systems on security and economic features of the distribution network planning, four schemes have been employed in this work:
Scheme 1—Only wind turbine generators are considered in the integrated energy system, without carbon capture;
Scheme 2—Only photovoltaic generators are considered in the integrated energy system, without carbon capture;
Scheme 3—Only wind turbine and photovoltaic generators are considered in the integrated energy system, without carbon capture;
Scheme 4—Integrated energy systems considering both wind turbine and photovoltaic generators along with carbon capture.
Two optimization methods: second-order cone algorithm and genetic algorithm are chosen to solve the four schemes, and the results are shown in Table 4 and Table 5.
Table 4.
Distribution network improvement planning program by second-order cone algorithm.
Table 5.
Distribution network improvement planning program by genetic algorithm (NSGA-II).
From the results of the four planning schemes laid out above, it can be seen that considering only wind turbine generators or photovoltaic generators would result in the probability of the voltage exceeding the limit by more than 10%, indicating a serious risk level. If both wind turbines and photovoltaic generators are considered, the voltage exceedance probability decreases to 8.42%, but this risk is still too high. After incorporating carbon capture technology, the voltage exceedance probability decreases to 0.05%; thus, the risk level is safe. Furthermore, considering wind turbine and photovoltaic generators can enhance the economic benefits of the system and the annual investment costs decrease from USD 4.82 million and 4.41 million to 4.18 million and 4.25 million. If the genetic algorithm is used for optimization, it can be found that the optimization results of each scheme cannot reach the effect of second-order cone optimization, and at the same time, the optimization time is greater, so the second-order cone algorithm is chosen as the main optimization method of the model. Improving the distribution network will require access to both wind turbines and photovoltaic generators; otherwise, there will be a high risk of the lower limit of the distribution network’s node voltage being exceeded. At the same time, there remains a certain risk that the upper limit will be crossed, and incorporating carbon capture technology in the improvement of the network can improve the overall energy utilization efficiency of the system, which not only resolves part of the carbon dioxide emitted by the gas turbine but also through energy conversion and storage, reducing the impact of integrated energy nodes on the entire network. Although carbon capture devices increase investment costs from the security and environmental points of view, Scheme 4 should be selected as the planning program.
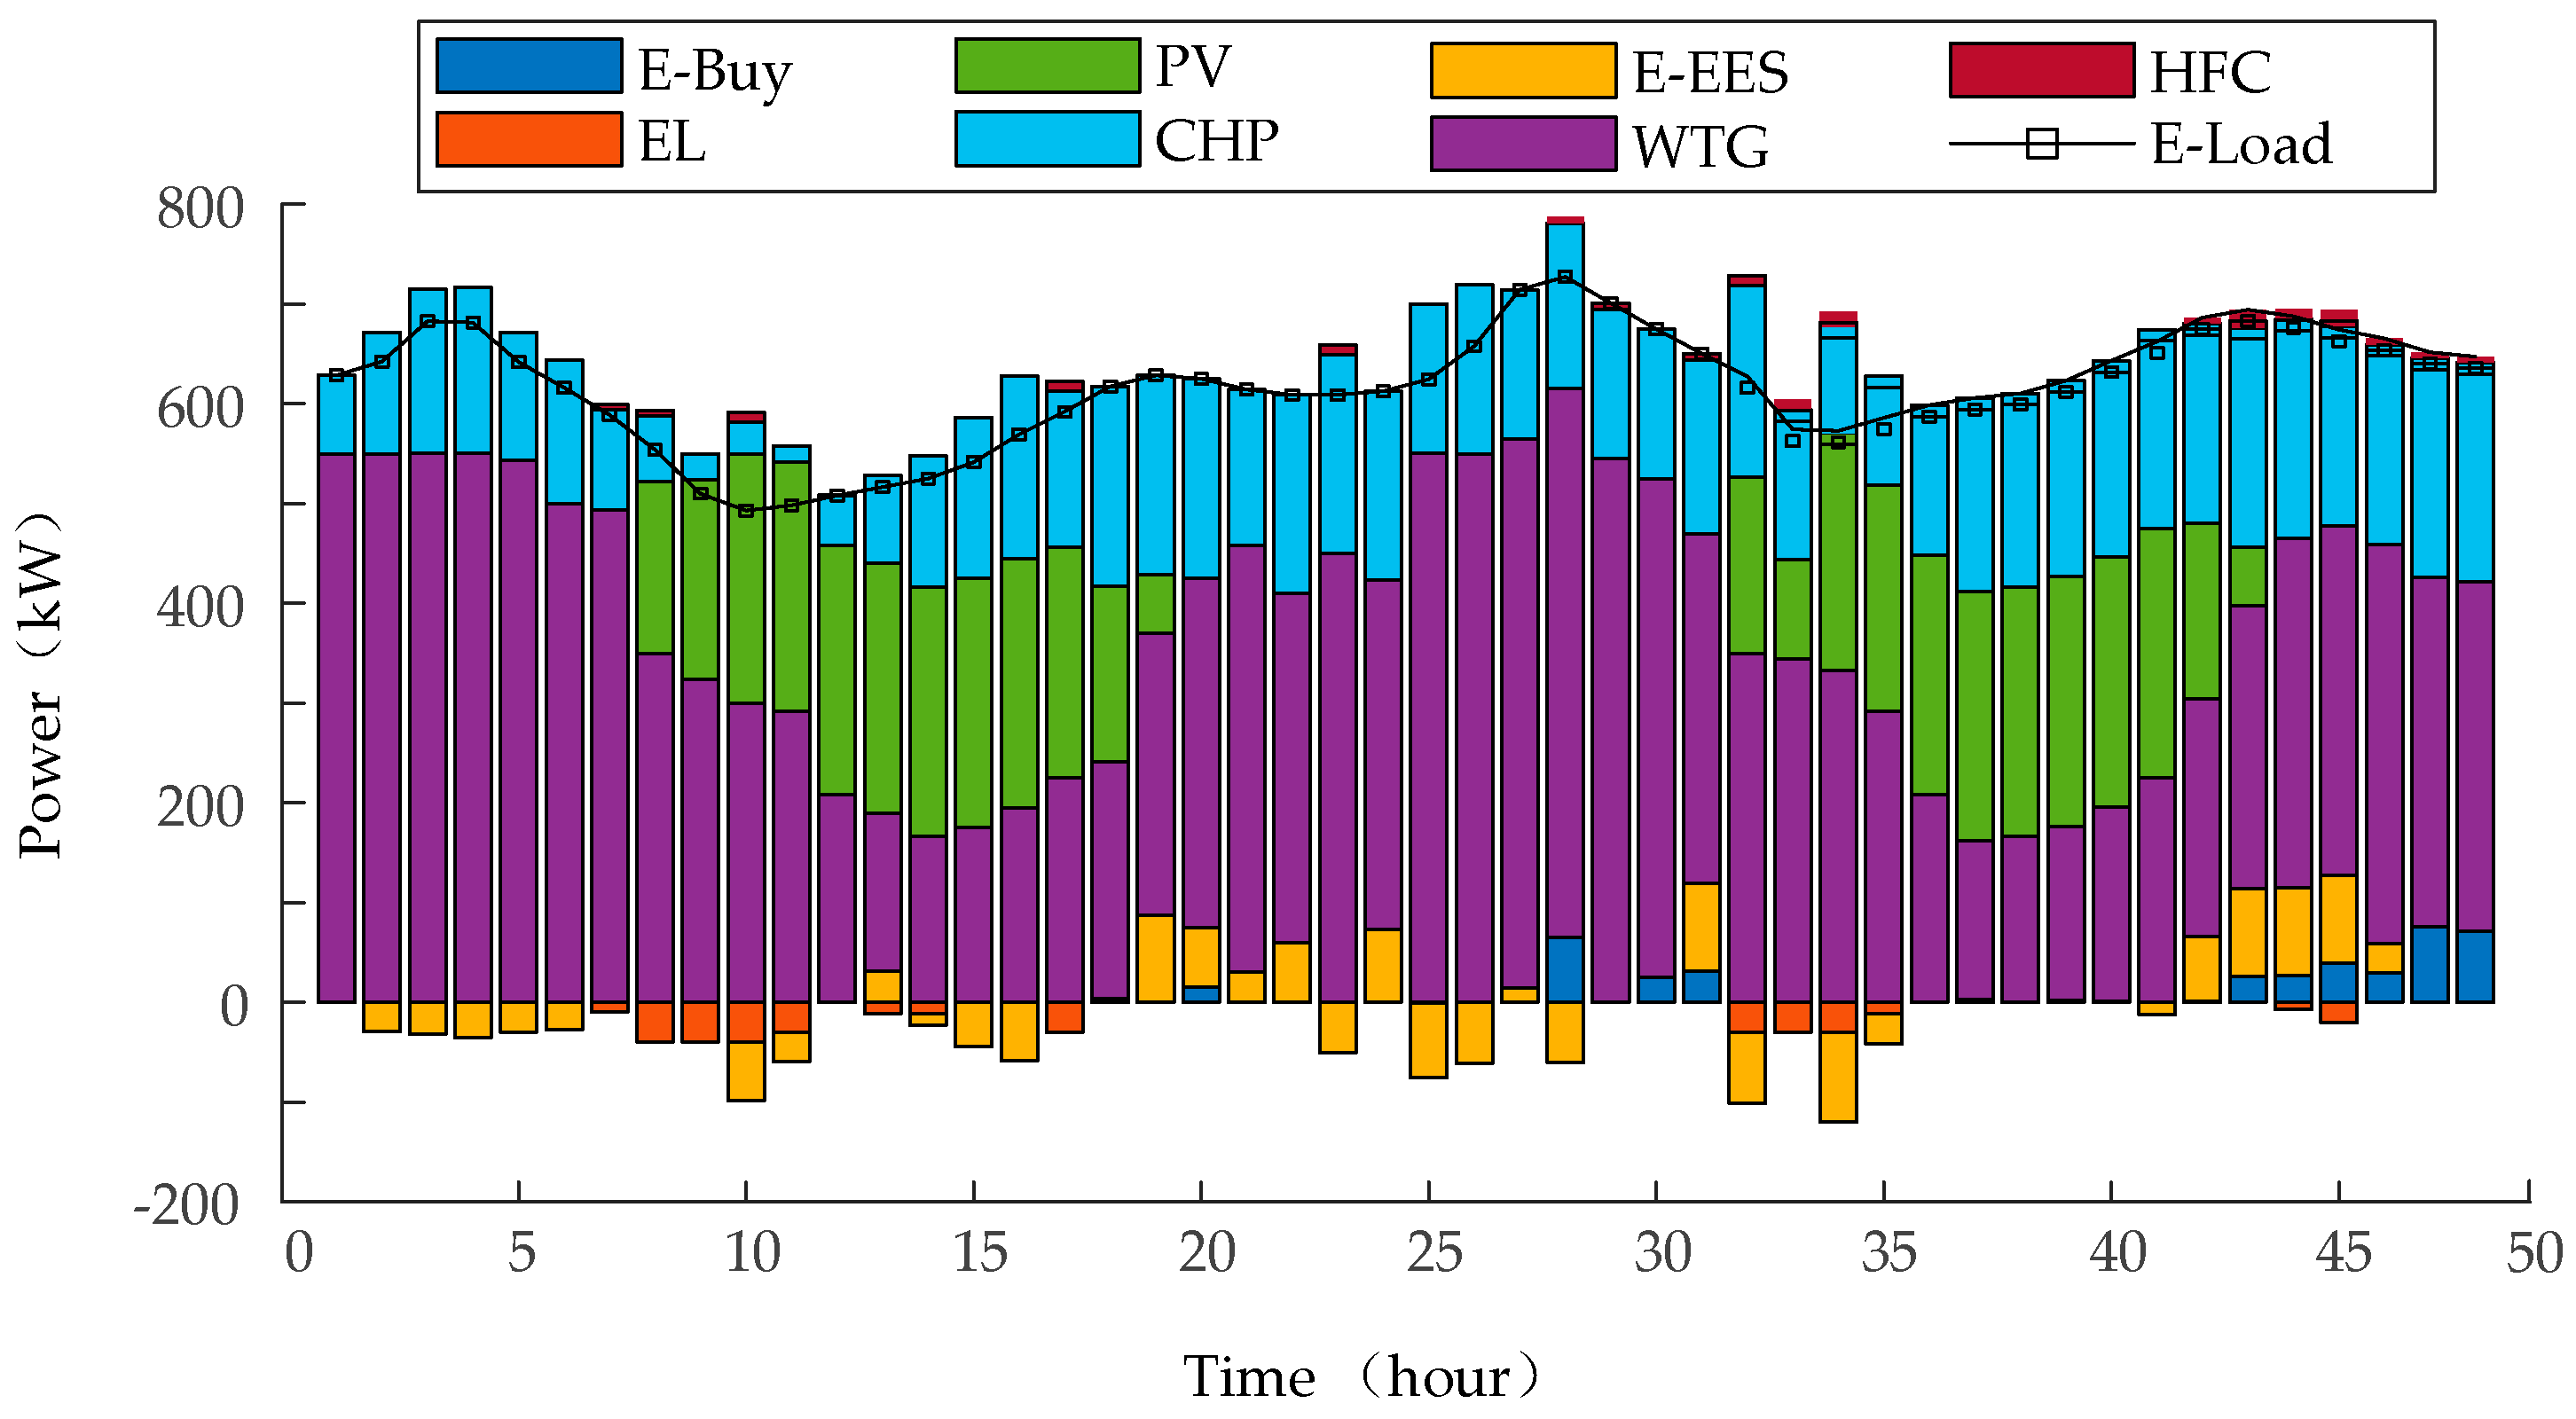
In the 48 h scenario, the integrated energy system meets the load needs by regulating the storage of electrical energy in fuel cells with fewer power purchase credits. The charging and discharging behaviors of the energy storage device are determined based on the photovoltaic generators’ output characteristics. The calculated electric power balance of the integrated energy system in the distribution network is shown in Figure 7.

Figure 7.
Electrical power balance of integrated energy systems.
An example planning scheme for wind turbines is shown in Table 6, in which the planned capacities of nodes 19, 23, 35, and 37 are 0.50, 0.50, 0.35, and 0.50 MW. An example planning scheme for EV fast charging stations is shown in Table 7, which also shows the charging demand and the queuing algorithm; here, the corresponding EV fast charging station site numbers of nodes 37–39 are 1, 4, and 6, respectively. The numbers of planned 50 kW charging piles are 14, 16, and 15, respectively.
Table 6.
Distribution network wind turbine planning program.
Table 7.
Electric vehicle fast charging station planning scheme for distribution grids.
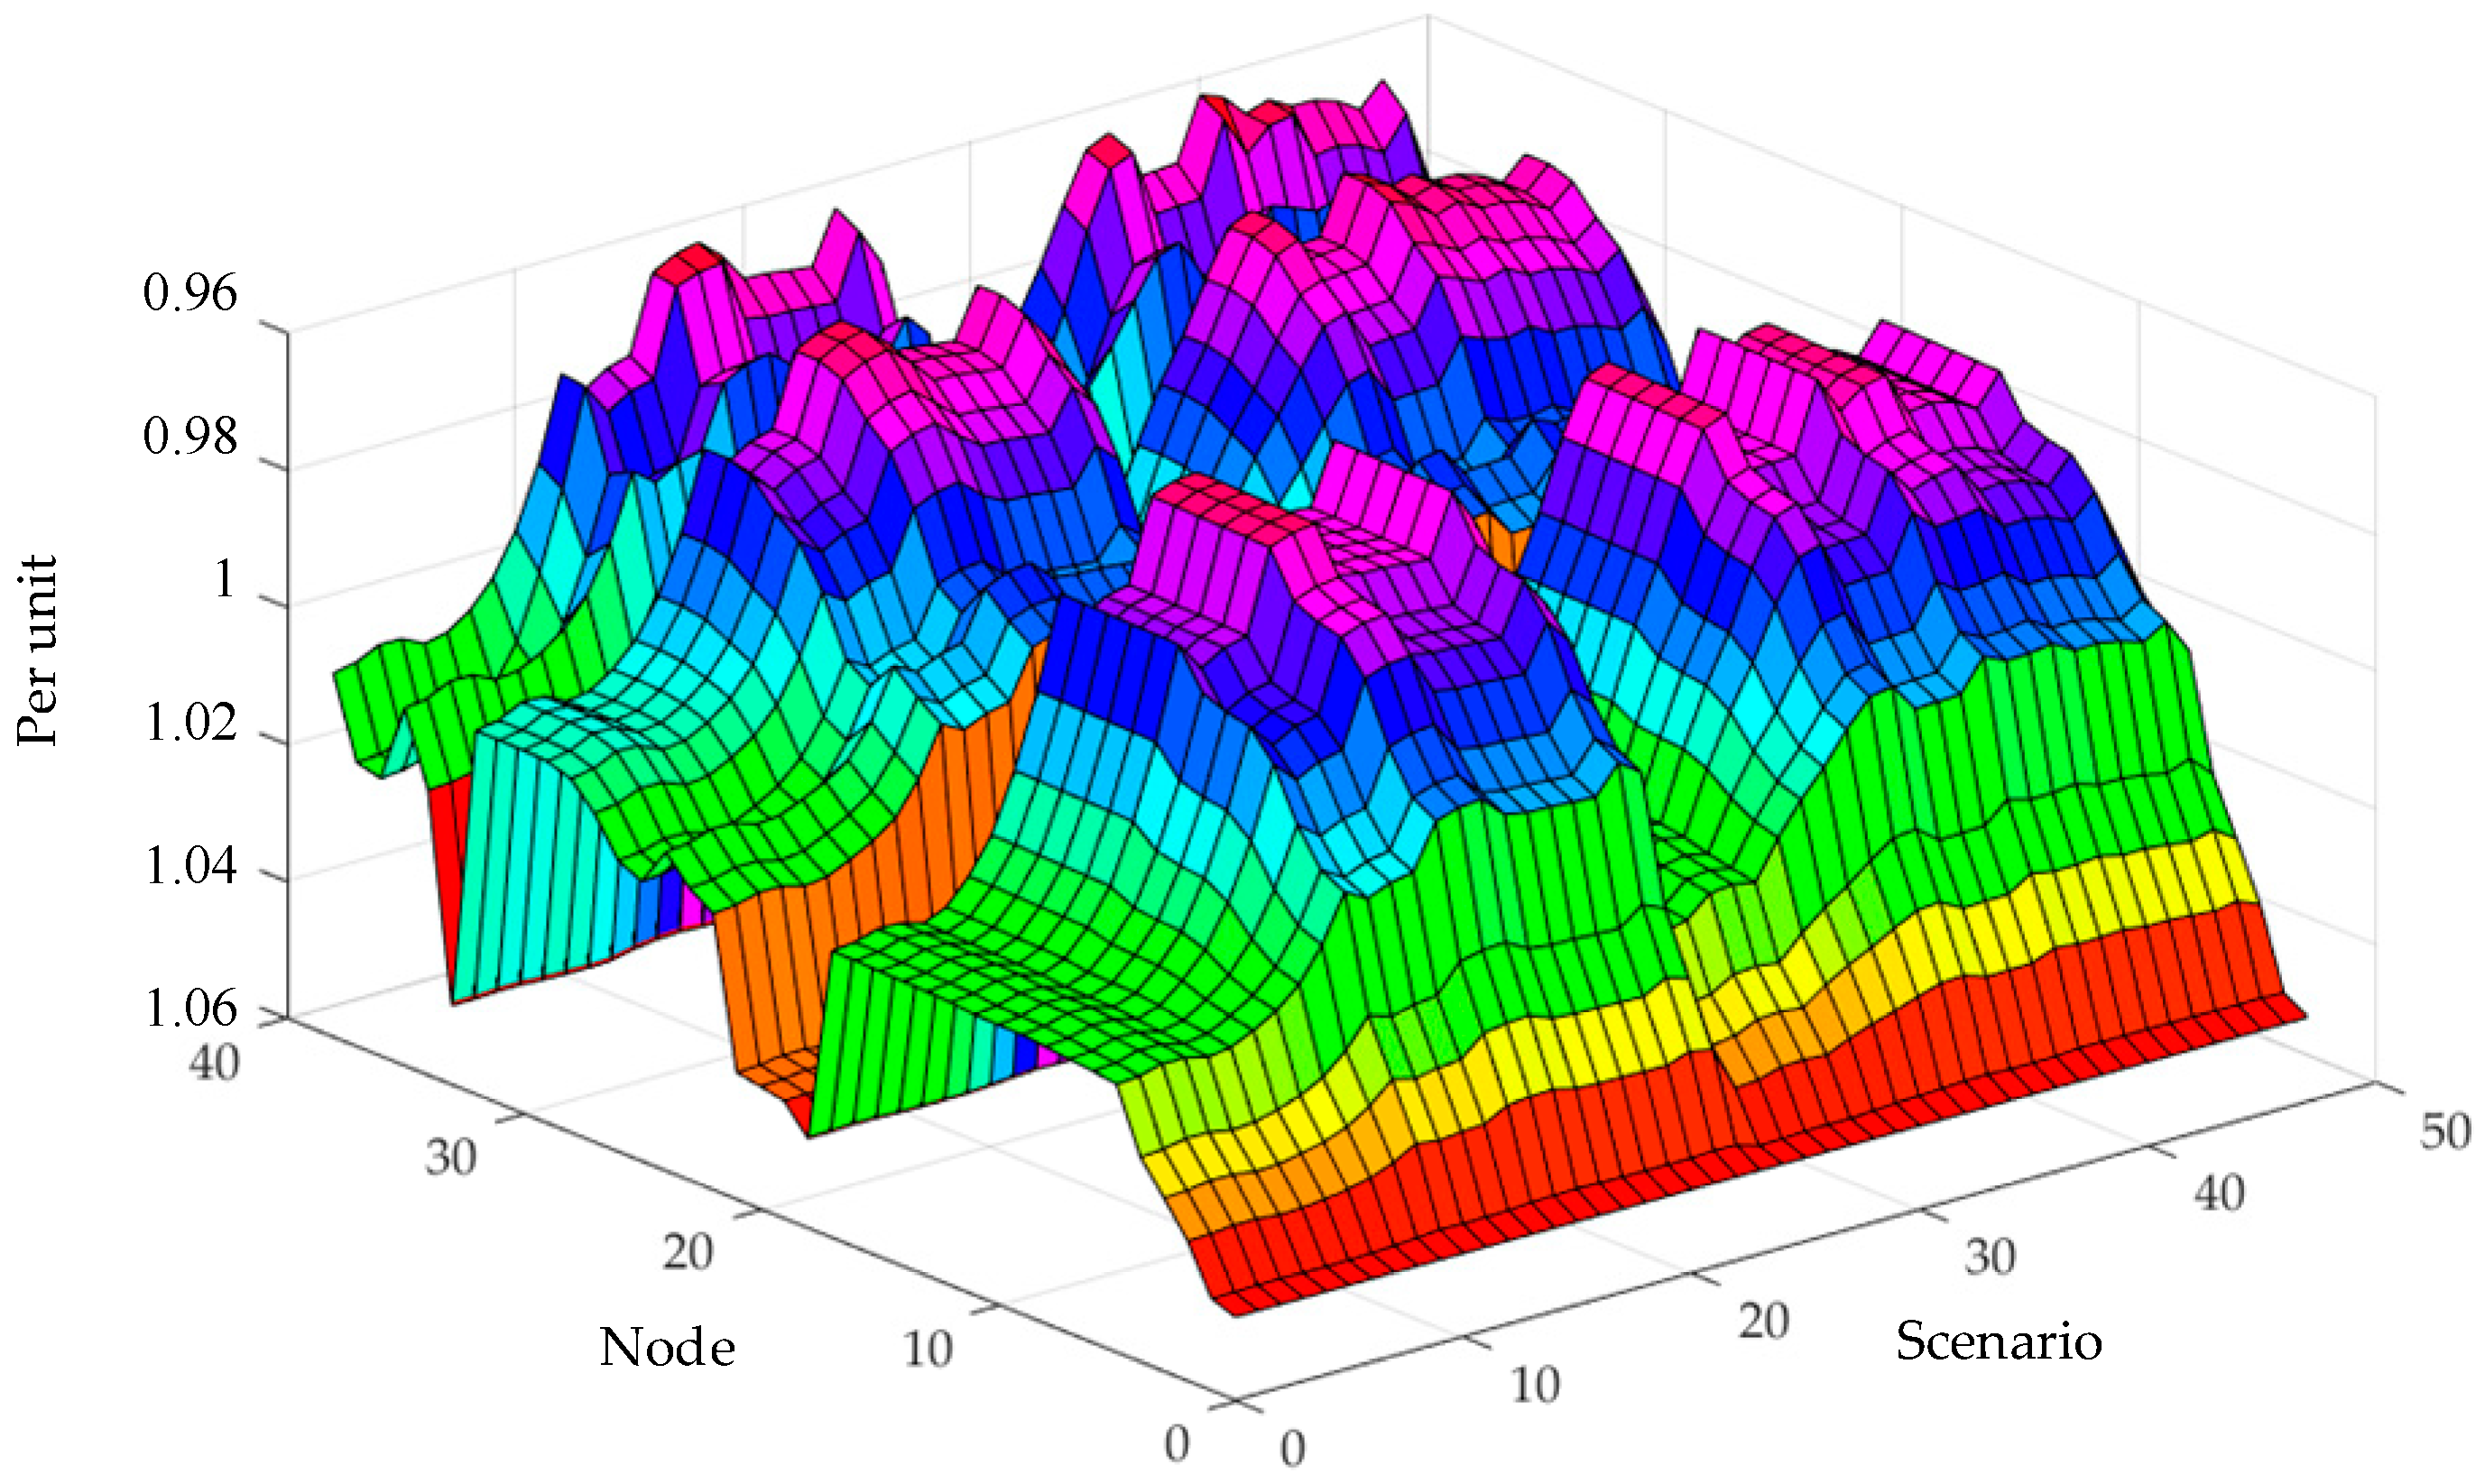
The probability of tested node voltage exceedance in the exemplary case is shown in Figure 8. Warmer color means higher voltage. The voltage at each node of the distribution network is 95% to 105% of the rated value. The voltage exceedance probability at each node in the distribution network is negligible.

Figure 8.
The per-unit value of voltage at each node of the distribution network in each scenario.
The probability of line power exceedance in the example is shown in Table 8, and there is no risk of power exceedance in each line in the distribution network. The planning of the distribution network was improved to meet security requirements.
Table 8.
The risk associated with the probability of power exceedance in the distribution network after improved planning.
After improvements in the planning, the topology of the resulting 39-node distribution network is shown in Figure 9, where the red lines are new lines, and the integrated energy station access node is the 24th node.
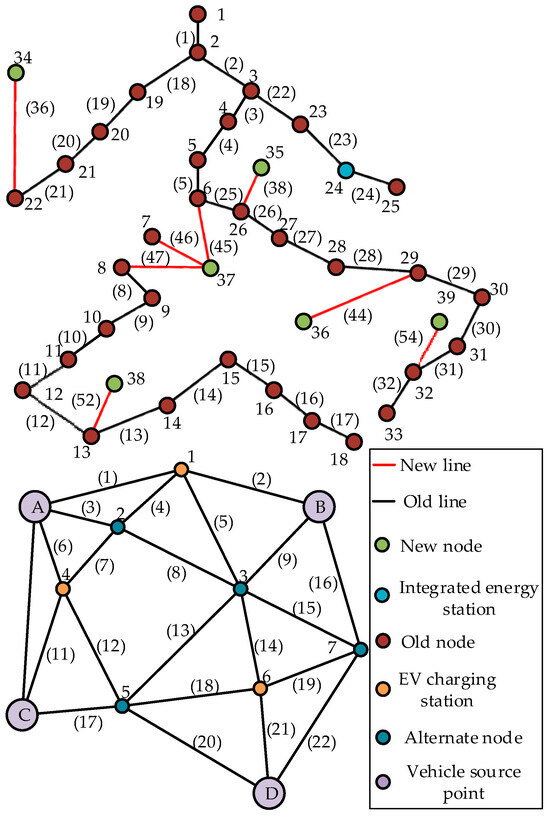
Figure 9.
Distribution (top) and transportation (bottom) network topology after improvements in planning.
5. Conclusions
This work utilizes Power Internet of Things multisource data by comprehensively considering the most influential factors contributing to the exceedance of distribution network voltage and power, combined with the mixed access of multiple loads, a rising penetration rate of electric vehicles, the massive degree of access of distributed equipment such as wind power generation, and integrated energy stations, in addition to a laddered carbon trading mechanism. We analyzed the mechanistic pattern of the generation of distribution network faults and simulated a real-life situation using scenario modeling to provide data relevant to risk planning.
A distribution network risk test was carried out on a distribution network with a frame structure and multisource load data, based on the expected values and the sensitivity matrix of the node voltage and branch currents, the loads, the conventional generators, and the wind turbine outputs. The semi-invariants of each order of the injected power at each node were calculated, the probability density function and the probability distribution function were obtained through level expansion, and a probabilistic distribution network risk model was constructed, which together constituted a test and calibration methodology that could be applied to the subsequent planning of risk improvement in the distribution network. After considering economic and social factors, such as the distribution network’s source and load allocation, integrated energy system access, electric vehicles, and load types, and taking the probabilities of distribution network voltage and power exceedance as the first-level objective function and economic benefit as the second-level objective function, a scheme for improving upon the planning of the original distribution network was established using a commercial solver to perform risk localization prejudgment and quantification. Finally, the planning scheme was incorporated into the distribution network risk prejudgment model to test the feasibility of the method through the analysis of a calculation example. The following conclusions were obtained:
- The test of distribution network voltage and power exceedance utilizes the probabilistic power flow method, which can be used to effectively calculate the risk related to the node voltage and line power of the active distribution network containing integrated energy sources. In comparison with the original deterministic test method, the risk probabilities of the nodes and lines of the distribution network have been visually displayed after Gram–Charlier-level expansion to enable a quantitative analysis of the risk of the distribution network;
- The distribution networks need to be rearranged to facilitate risk planning after coupling with transportation networks, distributed generation equipment, and integrated energy systems. The application of the Power Internet of Things can enable the use of multidimensional data to increase the reliability of planning and changing the network structure and, along with rationally planning the distribution of generation equipment, fast charging stations, and energy storage devices, it can effectively reduce the probability of risk in relation to distribution networks;
- The two-layer planning model can take the security and economic features of the distribution network into account. The integrated energy system improves the efficiency of energy utilization through the interconversion of multiple energy sources, and carbon capture combined with a ladder carbon trading mechanism collects the CO2 emitted from gas turbines so that it can be employed in methane synthesis, which improves the economic and security features of the system. At the same time, the use of energy storage equipment enables the utilization of renewable energy and promotes sustainable development;
- This paper combines distribution network exceedance testing with risk planning by performing exceedance tests on the existing network structure, and, thus, it provides a basis for distribution network risk planning. In the distribution network planning model, the transportation network, integrated energy, carbon capture, and carbon trading are comprehensively considered, and the planning results here have been verified by further testing, which introduced the above elements into risk planning for the distribution network. This integrated energy model can be further optimized, and travel patterns related to different types of electric vehicles can be considered in future research.
Author Contributions
J.W. proposed the idea, performed the experiments, analyzed the data, and wrote the paper; K.W., T.W. and S.M. provided example data and research funding; H.G. and Q.G. organized example data; Z.H. provided useful advice, revised the manuscript, and approved the final version of the manuscript. All authors have read and agreed to the published version of the manuscript.
Funding
This research was funded by the National Key Research and Development Program of China, grant number 2020YFB0905905.
Data Availability Statement
All data underlying the results are available as part of the article and no additional source data are required.
Conflicts of Interest
Authors Kun Wang, Tianhao Wang and Shiqian Ma were employed by the company State Grid Tianjin Electric Power Company. The remaining authors declare that the research was conducted in the absence of any commercial or financial relationships that could be construed as a potential conflict of interest.
References
- Rafique, Z.; Khalid, H.M.; Muyeen, S.M. Communication Systems in Distributed Generation: A Bibliographical Review and Frameworks. IEEE Access 2020, 8, 207226–207239. [Google Scholar] [CrossRef]
- Khalid, H.M.; Qasaymeh, M.M.; Muyeen, S.M.; El Moursi, M.S.; Foley, A.M.; Tha’er, O.S.; Sanjeevikumar, P. WAMS Operations in Power Grids: A Track Fusion-Based Mixture Density Estimation-Driven Grid Resilient Approach toward Cyberattacks. IEEE Syst. J. 2023, 17, 3950–3961. [Google Scholar] [CrossRef]
- Khalid, H.M.; Flitti, F.; Mahmoud, M.S.; Hamdan, M.M.; Muyeen, S.M.; Dong, Z.Y. Wide Area Monitoring System Operations in Modern Power Grids: A Median Regression Function-Based State Estimation Approach towards Cyber Attacks. Sustain. Energy 2023, 34, 101009. [Google Scholar] [CrossRef]
- Zafar, M.H.; Bukhari, S.M.S.; Abou Houran, M.; Moosavi, S.K.R.; Mansoor, M.; Al-Tawalbeh, N.; Sanfilippo, F. Step towards Secure and Reliable Smart Grids in Industry 5.0: A Federated Learning Assisted Hybrid Deep Learning Model for Electricity Theft Detection Using Smart Meters. Energy Rep. 2023, 10, 3001–3019. [Google Scholar] [CrossRef]
- Xie, L.; Wu, J.; Li, Y.; Sun, Q.; Xi, L. Automatic Generation Control Strategy for Integrated Energy System Based on Ubiquitous Power Internet of Things. IEEE Internet Things J. 2023, 10, 7645–7654. [Google Scholar] [CrossRef]
- Jiang, C.; Xu, H.; Jin, W.; Bi, X. Research on application of power Internet of Things technology in leakage fault diagnosis of rural power grid. Energy Rep. 2023, 9, 847–854. [Google Scholar] [CrossRef]
- Zou, B.; Xiao, Q. Solving Probabilistic Optimal Power Flow Problem Using Quasi Monte Carlo Method and Ninth-Order Polynomial Normal Transformation. IEEE Trans. Power Syst. 2014, 29, 300–306. [Google Scholar] [CrossRef]
- Hashish, M.S.; Hasanien, H.M.; Ji, H.; Alkuhayli, A.; Alharbi, M.; Akmaral, T.; Turky, R.A.; Jurado, F.; Badr, A.O. Monte Carlo Simulation and a Clustering Technique for Solving the Probabilistic Optimal Power Flow Problem for Hybrid Renewable Energy Systems. Sustainability 2023, 15, 783. [Google Scholar] [CrossRef]
- Bin, L.; Abbas, R.; Shahzad, M.; Safdar, N. Probabilistic Load Flow Analysis Using Nonparametric Distribution. Sustainability 2024, 16, 240. [Google Scholar] [CrossRef]
- Tourandaz Kenari, M.; Sepasian, M.S.; Setayesh Nazar, M.; Mohammadpour, H.A. Combined Cumulants and Laplace Transform Method for Probabilistic Load Flow Analysis. IET Gener. Transm. Distrib. 2017, 11, 3548–3556. [Google Scholar] [CrossRef]
- Li, X.; Cao, J.; Du, D. Two-point Estimate Method for Probabilistic Optimal Power Flow Computation Including Wind Farms with Correlated Parameters. Intell. Comput. Sustain. Energy Environ. 2013, 355, 417–423. [Google Scholar]
- Hu, Y.; Lian, H.; Bie, Z.; Zhou, B. Unified Probabilistic Gas and Power Flow. Mod. Power Syst. Clean Energy 2017, 5, 400–411. [Google Scholar] [CrossRef]
- Chen, Y.; Wen, J.; Cheng, S. Probabilistic Load Flow Method Based on Nataf Transformation and Latin Hypercube Sampling. IEEE Trans. Sustain. Energy 2013, 4, 294–301. [Google Scholar] [CrossRef]
- Baghaee, H.R.; Mirsalim, M.; Gharehpetian, G.B.; Talebi, H.A. Application of RBF Neural Networks and Unscented Transformation in Probabilistic Power-Flow of Microgrids Including Correlated Wind/PV Units and Plug-in Hybrid Electric Vehicles. Simul. Model. Pract. Theory 2017, 72, 51–68. [Google Scholar] [CrossRef]
- Hashish, M.S.; Hasanien, H.M.; Ullah, Z.; Alkuhayli, A.; Badr, A.O. Giant Trevally Optimization Approach for Probabilistic Optimal Power Flow of Power Systems Including Renewable Energy Systems Uncertainty. Sustainability 2023, 15, 13283. [Google Scholar] [CrossRef]
- Ye, K.; Zhao, J.; Zhang, Y.; Liu, X.; Zhang, H. A Generalized Computationally Efficient Copula-Polynomial Chaos Framework for Probabilistic Power Flow Considering Nonlinear Correlations of PV Injections. Int. J. Electr. Power Energy Syst. 2022, 136, 107727. [Google Scholar] [CrossRef]
- Taghavi, R.; Samet, H.; Seifi, A.R.; Ali, Z.M. Stochastic Optimal Power Flow in Hybrid Power System Using Reduced-Discrete Point Estimation Method and Latin Hypercube Sampling. IEEE Can. J. Electr. Comput. Eng. 2021, 45, 63–66. [Google Scholar] [CrossRef]
- Singh, V.; Moger, T.; Jena, D. Probabilistic Load Flow for Wind Integrated Power System Considering Node Power Uncertainties and Random Branch Outages. IEEE Trans. Sustain. Energy 2022, 14, 482–489. [Google Scholar] [CrossRef]
- Li, Y.; Liu, C.; Zhang, L.; Sun, B. A Partition Optimization Design Method for A Regional Integrated Energy System Based on A Clustering Algorithm. Energy 2021, 219, 119562. [Google Scholar] [CrossRef]
- Zhang, Z.; Zhou, J.; Zong, Z.; Chen, Q.; Zhang, P.; Wu, K. Development and Modelling of a Novel Electricity-Hydrogen Energy System Based on Reversible Solid Oxide Cells and Power to Gas Technology. Int. J. Hydrogen Energy 2019, 44, 28305–28315. [Google Scholar] [CrossRef]
- Liang, S.; Wang, Y. Evaluation of Integrated Energy System Planning Scheme for Industrial Parks Based on Improved Cloud Object-Element Model. Power Syst. Prot. Control. 2023, 51, 165–176. [Google Scholar]
- Cheng, Y.; Zhang, N.; Zhang, B.; Kang, C.; Xi, W.; Feng, M. Low-Carbon Operation of Multiple Energy Systems Based on Energy-Carbon Integrated Prices. IEEE Trans. Smart Grid 2020, 11, 1307–1318. [Google Scholar] [CrossRef]
- Yang, M.; Cui, Y.; Huang, D.; Su, X.; Wu, G. Multi-Time-Scale Coordinated Optimal Scheduling of Integrated Energy System Considering Frequency out-of-limit Interval. Int. J. Electr. Power Energy Syst. 2022, 141, 0142–0615. [Google Scholar] [CrossRef]
- Sabzehgar, R.; Amirhosseini, D.Z.; Manshadi, S.D.; Fajri, P. Stochastic Expansion Planning of Various Energy Storage Technologies in Active Power Distribution Networks. Sustainability 2021, 13, 5752. [Google Scholar] [CrossRef]
- Wang, G.; Ma, H.; Wang, B.; Alharbi, A.M.; Wang, H.; Ma, F. Multi-Objective Optimal Power Flow Calculation Considering Carbon Emission Intensity. Sustainability 2023, 15, 16953. [Google Scholar] [CrossRef]
- Vargas, G.A.D.; Mosquera, D.J.; Trujillo, E.R. Optimization of Topological Reconfiguration in Electric Power Systems Using Genetic Algorithm and Nonlinear Programming with Discontinuous Derivatives. Electronics 2024, 13, 616. [Google Scholar] [CrossRef]
- Xu, H.; Lan, H. An Adaptive Layered Clustering Framework with Improved Genetic Algorithm for Solving Large-Scale Traveling Salesman Problems. Electronics 2023, 12, 1681. [Google Scholar] [CrossRef]
- Hou, S.; Zhu, W. Dynamic Reconfiguration Method of Photovoltaic Array Based on Improved HPSO Combined with Coefficient of Variation. Electronics 2023, 12, 2744. [Google Scholar] [CrossRef]
- Khaled, U.; Eltamaly, A.M.; Beroual, A. Optimal Power Flow Using Particle Swarm Optimization of Renewable Hybrid Distributed Generation. Energies 2017, 10, 1013. [Google Scholar] [CrossRef]
- Al-Majidi, S.D.; Abbod, M.F.; Al-Raweshidy, H.S. A Particle Swarm Optimisation-Trained Feedforward Neural Network for Predicting the Maximum Power Point of a Photovoltaic Array. Eng. Appl. Artif. Intell. 2020, 92, 103688. [Google Scholar] [CrossRef]
- Foster, J.D.; Berry, A.M.; Boland, N.; Waterer, H. Comparison of Mixed-Integer Programming and Genetic Algorithm Methods for Distributed Generation Planning. IEEE Trans. Power Syst. 2013, 29, 833–843. [Google Scholar] [CrossRef]
- Zafar, R.; Ravishankar, J.; Fletcher, J.E.; Pota, H.R. Optimal Dispatch of Battery Energy Storage System Using Convex Relaxations in Unbalanced Distribution Grids. IEEE Trans. Ind. Inform. 2020, 16, 97–108. [Google Scholar] [CrossRef]
- Meng, W.; Song, D.; Deng, X.; Dong, M.; Yang, J.; Rizk-Allah, R.M.; Snášel, V. Dynamic Optimal Power Flow of Active Distribution Network Based on LSOCR and Its Application Scenarios. Electronics 2023, 12, 1530. [Google Scholar] [CrossRef]
- Gil-González, W.; Montoya, O.D.; Grisales-Noreña, L.F.; Cruz-Peragón, F.; Alcalá, G. Economic Dispatch of Renewable Generators and BESS in DC Microgrids Using Second-Order Cone Optimization. Energies 2020, 13, 1703. [Google Scholar] [CrossRef]
- Kavianipour, M.; Fakhrmoosavi, F.; Singh, H.; Ghamami, M.; Zockaie, A.; Ouyang, Y.; Jackson, R. Electric Vehicle Fast Charging Infrastructure Planning in Urban Networks Considering Daily Travel and Charging Behavior. Transp. Res. Part D-Transp. Environ. 2021, 93, 102769. [Google Scholar] [CrossRef]
- Khaleel, M.M.; Adzman, M.R.; Zali, S.M. An Integrated of Hydrogen Fuel Cell to Distribution Network System: Challenging and Opportunity for D-STATCOM. Energies 2021, 14, 7073. [Google Scholar] [CrossRef]
Disclaimer/Publisher’s Note: The statements, opinions and data contained in all publications are solely those of the individual author(s) and contributor(s) and not of MDPI and/or the editor(s). MDPI and/or the editor(s) disclaim responsibility for any injury to people or property resulting from any ideas, methods, instructions or products referred to in the content. |
© 2024 by the authors. Licensee MDPI, Basel, Switzerland. This article is an open access article distributed under the terms and conditions of the Creative Commons Attribution (CC BY) license (https://creativecommons.org/licenses/by/4.0/).