Article

Towards a State of Health Definition of Lithium Batteries through Electrochemical Impedance Spectroscopy

Department of Information Engineering, University of Florence, Via di S. Marta 3, 50139 Florence, Italy
*
Author to whom correspondence should be addressed.
Electronics 2024, 13(8), 1438; https://doi.org/10.3390/electronics13081438
Submission received: 18 March 2024 / Revised: 7 April 2024 / Accepted: 9 April 2024 / Published: 11 April 2024
(This article belongs to the Special Issue Young Investigators in Electronics)

Abstract

:
In the era of Industry 4.0, achieving optimization in production and minimizing environmental impact has become vital. Energy management, particularly in the context of smart grids, plays a crucial role in ensuring sustainability and efficiency. Lithium-ion batteries have emerged as a leading technology for energy storage due to their versatility and performances. However, accurately assessing their State of Health (SOH) is essential for maintaining grid reliability. While discharge capacity and internal resistance (IR) are commonly used SOH indicators, battery impedance also offers valuable insights into aging degradation. This article explores the use of Electrochemical Impedance Spectroscopy (EIS) to define the SOH of lithium batteries. By analyzing impedance spectra at different frequencies, a comprehensive understanding of battery degradation is obtained. A life cycle analysis is conducted on cylindrical Li–Mn batteries under various discharge conditions, utilizing EIS measurements and an Equivalent Circuit Model (ECM). This study highlights the differential effects of aging on battery characteristics, emphasizing the variations at different life stages and the behavior changes on each region of the impedance spectrum. Furthermore, it demonstrates the efficacy of EIS and the advantages of this technique compared to the solely IR measurements used in tracking SOH over time. This research contributes to advancing the understanding of lithium battery degradation and underscores the importance of EIS in defining their State of Health for Smart Grids applications.

1. Introduction

Nowadays, the term “Industry 4.0” has become a keyword in the development and research of all industrial applications. The main goal that resides behind this concept is to achieve optimization in terms of production and profits and to reduce the risks and the footprint on the environment [1,2]. In order to do that, the development of self-learning factories, capable of elaborating great quantities of data and being able to implement Internet-of-Things (IoT)-oriented technologies [3,4] to handle the transmission and the acquisition of all the information inside the productive system has become the main aim in this industrial phase [5].
In this context, the enhancement of energy management plays a fundamental role, not only to guarantee the quality, the reliability, and the consumption awareness of the power grids inside smart factories, but also to improve the sustainability of the plants and the deployment of renewable and low-impact energy sources [6,7,8]. The characteristics listed above are part of the definition of Smart Grids (SGs), which are self-sufficient systems capable of delivering a sustainable, reliable, and quality power supply to the end-users, by monitoring the power system’s condition and, eventually, resolving the possible problems on the grid [9]. However, one of the main requirements of these systems is the necessity of a stable and reliable energy storage solution to improve the reliability, the quality, and the efficiency of the grid [10,11].
One of the main successful technologies applied in these scenarios are Lithium-ion batteries. This is justified by their high-power density and life duration and also by their low cost and versatility in lots of situations [12,13] that makes them suitable for supplying both small devices and electrical vehicles [14], but also for storage applications [15,16]. Other relevant features are their outstanding flexibility in geographical positioning in different scenarios and their low environmental footprint [17,18,19], but also their huge potential in combination with renewable sources [20].
Nevertheless, associated with the choice of a practical and cost-efficient energy storage system, there is also the need for an accurate evaluation of its State of Health (SOH) condition, as well as its Remaining Useful Life (RUL) [21]. In fact, the degradations introduced by the continuous use and the aging of these storage devices can sensibly affect the performance of an SG, reducing the efficiency and the safety of the power system [22]. This issue has resulted in the study of SOH monitoring systems gaining the interest of many industrial and academic studies, with the development of different strategies in this field.
The most common parameter associated with the SOH of a battery is its discharge capacity, defined as the percent ratio between the current capacity and a reference value, which could be the nominal capacity of the battery or the actual capacity under the initial conditions [23]. However, using only a capacity loss-based approach is not always practical and efficient due to the limitations of the devices and battery operation ranges, even if the in situ capacity estimation models have gained attention in many recent works [24]. Other definitions propose the internal resistance (IR) value as an additional indicator of the life of the battery [25,26]. In the literature, there are a lot of scientific papers that propose SOH monitoring methodologies that make use of the unique information relationship between Open Circuit Voltage (OCV) and State of Charge (SOC) [27] for capacitance estimation, like in [28,29], or that instead use Differential Voltage Analysis (DVA) methods [30,31] or Incremental Capacitance Analysis (ICA) techniques [32,33,34].
However, there is another parameter that is irreversibly affected by the aging degradation, which is the battery impedance [35]. According to the reviews presented in [24,25,36], the SOH estimation methodologies based on this parameter are classifiable into the following two categories:
  • Time domain-based methods, in which a pulse current is used to evaluate the IR value like, for example, in [37], which investigates the battery IRs with current pulses at different SOC values in the range between 90% and 10% for a cycle and calendar life test.
  • Frequency domain-based methods, in which EIS measurements at different scan frequencies are used to obtain an impedance spectrum and to estimate its variation with the aging of the cells. For instance, in [38,39,40], these methods are used to construct a dataset for Machine Learning-based battery prognostic techniques or aging modeling of different Lithium-ion cells’ technologies.
Even if a time domain-based method is characterized by a simpler implementation for real-time SOH estimation, EIS techniques provide a more thorough and exhaustive analysis of the battery state. By investigating the behavior of different regions of the impedance spectrum, EIS measurements allow a greater accuracy in the identification of the degradation sources, giving more than a single parameter to associate the cell to a specific health condition.
In this regard, in this work, a life cycle analysis is proposed to study the effects of the aging phenomena of a Li–Mn battery, through the use of EIS measurements and the analysis of different plots tracked from these data. In more detail, in this paper, a comparison and discussion about the different effects of cycle aging on the deterioration characteristics of two batteries under different discharge conditions is presented. This paper introduces a simple Equivalent Circuit Model (ECM) to highlight the differences in the trends of each EIS region of the impedance spectral response during a life cycle test.

2. Materials and Methods

2.1. Device under Test (DUT)

In this testing procedure, two Lithium-ion cells were analyzed. According to the datasheet provided by the manufacturer [41], the devices are Li–Mn cylindrical 18650 batteries, with a typical rated capacity of 2500 mAh and a nominal voltage of 3.7 V. The maximum charging voltage supported is 4.2 V, while the maximum discharge current is either 20 A in continuous discharge or 35 A under pulsed discharge. The lower cut-off voltage is reported to be equal to 2.5 V. The maximum operative temperature range defined by the manufacturer is between 0 °C and 45 °C during the charging phase, while it is extended between −20 °C and 75 °C during discharge. It is important to mention the fact that there is no explicit information regarding the internal resistance (IR) value of the battery in the provided datasheet. Before the beginning of the experiments, a measurement of the actual capacity value of the DUTs is essential to guarantee the correctness and the consistency of the data obtained. After the performance of some low C-rate charge/discharge cycles, the actual capacities obtained for the two batteries tested are 2.6653 Ah and 2.6320 Ah, respectively.

2.2. Testing Procedure

An experimental testing procedure has been planned with the purpose of characterizing the effects of cycle aging on two Li–Mn batteries and to confront the variations of these degradations with different discharge rates endured by the cells. In order to evaluate the life cycle impact on the batteries, a potentiostatic EIS technique is used. The test plan consists of 350 repeated charge/discharge cycles, in which two cells are charged with a Constant Current–Constant Voltage (CCCV) method at a 0.8 C-rate (i.e., 2 A current) and a 4.2 V cut-off voltage. Instead, the discharge phase is different for the two cells, as specified in the following:
  • The first battery is discharged using a fast Constant Current profile at a 3C-rate (i.e., 7.5 A current).
  • The second battery is discharged using a nominal Constant Current at a 1C-rate (i.e., 2.5 A current).
According to the recommended practice presented in the datasheet, a 30 min rest transition is set between these two phases. Every 10 cycles, an EIS measurement is performed to sample the impedance values at different cycle life conditions of each Lithium-ion battery. The scan frequency is set in the frequency range between 50 mHz and 50 kHz. The frequencies are investigated on a logarithmic scale, with 10 points for decade, for a total of 63 frequency values investigated using the EIS instrument. The amplitude of the voltage signal superimposed onto the battery is 100 mV, without DC offset. Furthermore, at the end of each cycle, a DC internal resistance measurement was performed using a 10 pulse train, with 1 ms pulse width, and a magnitude of 0.1 A, with a 0.2 A DC offset.

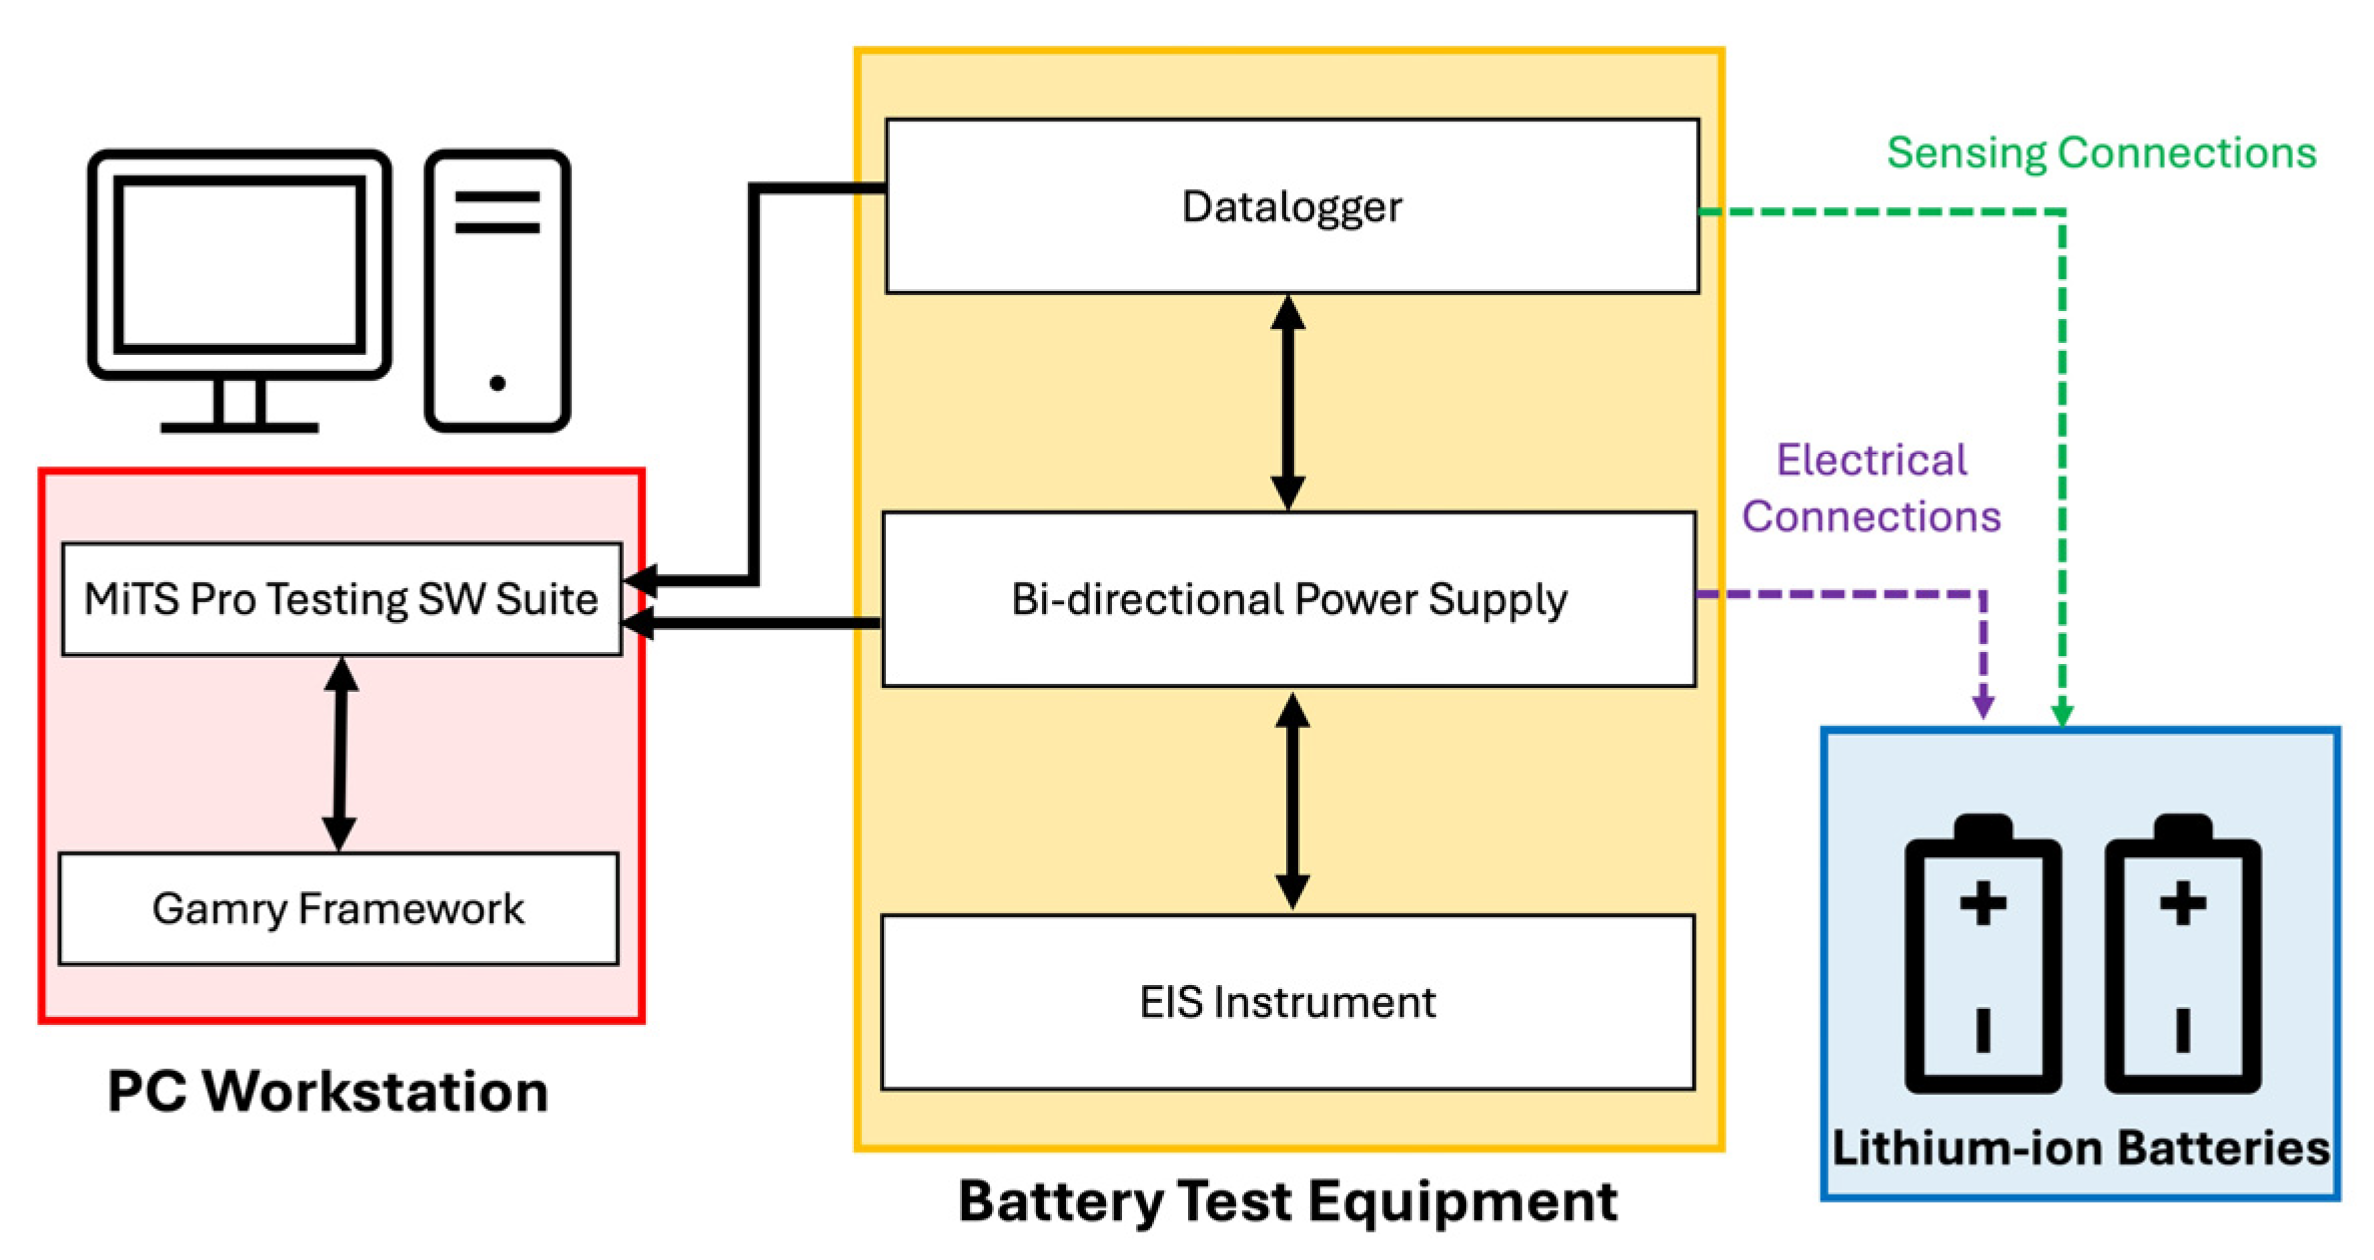
2.3. Experimental Setup

To implement the testing procedure shown in the section above for diagnostic and prognostic purposes, based on EIS measurements, a battery test equipment and a PC workstation are required [42]. As illustrated in the diagram in Figure 1, the battery test equipment is essentially composed of three main blocks, as follows:
  • A Laboratory Battery Test System (LBT 5V-30A) by Arbin (Arbin Instruments, College Station, TX, USA): a bi-directional power supply capable of charging and discharging simultaneously and, with different methodologies, up to 16 channels. The system can collect data with a maximum log frequency of 100 Hz and a resolution of 24 bits. The maximum current and voltage rates allowed are 30 A and 5 V, respectively.
  • A Gamry Interface 5000E EIS instrument (Gamry Instruments, Warminster, PA, USA): it can perform EIS measurements in a range between 10 μHz and 100 kHz when integrated with the LBT system.
  • A 21084HC Datalogger by Arbin (Arbin Instruments, College Station, TX, USA): it is connected to the external case of the batteries with T-type thermocouples. This has the aim of monitoring the overheating of the cells, in order to avoid the temperature increasing above the safety thresholds.
Figure 1. Block diagram of the battery test equipment describing the connection with the DUTs and the PC workstation.
Electronics 13 01438 g001
For the PC workstation, the MiTS Pro Testing software (Version 8.00) and the Gamry Framework (version 7.8.4) are installed on a PC to set the test schedules, to monitor the electrical and thermal parameters, to check possible safety thresholds trespassing, and to collect the measurement data.

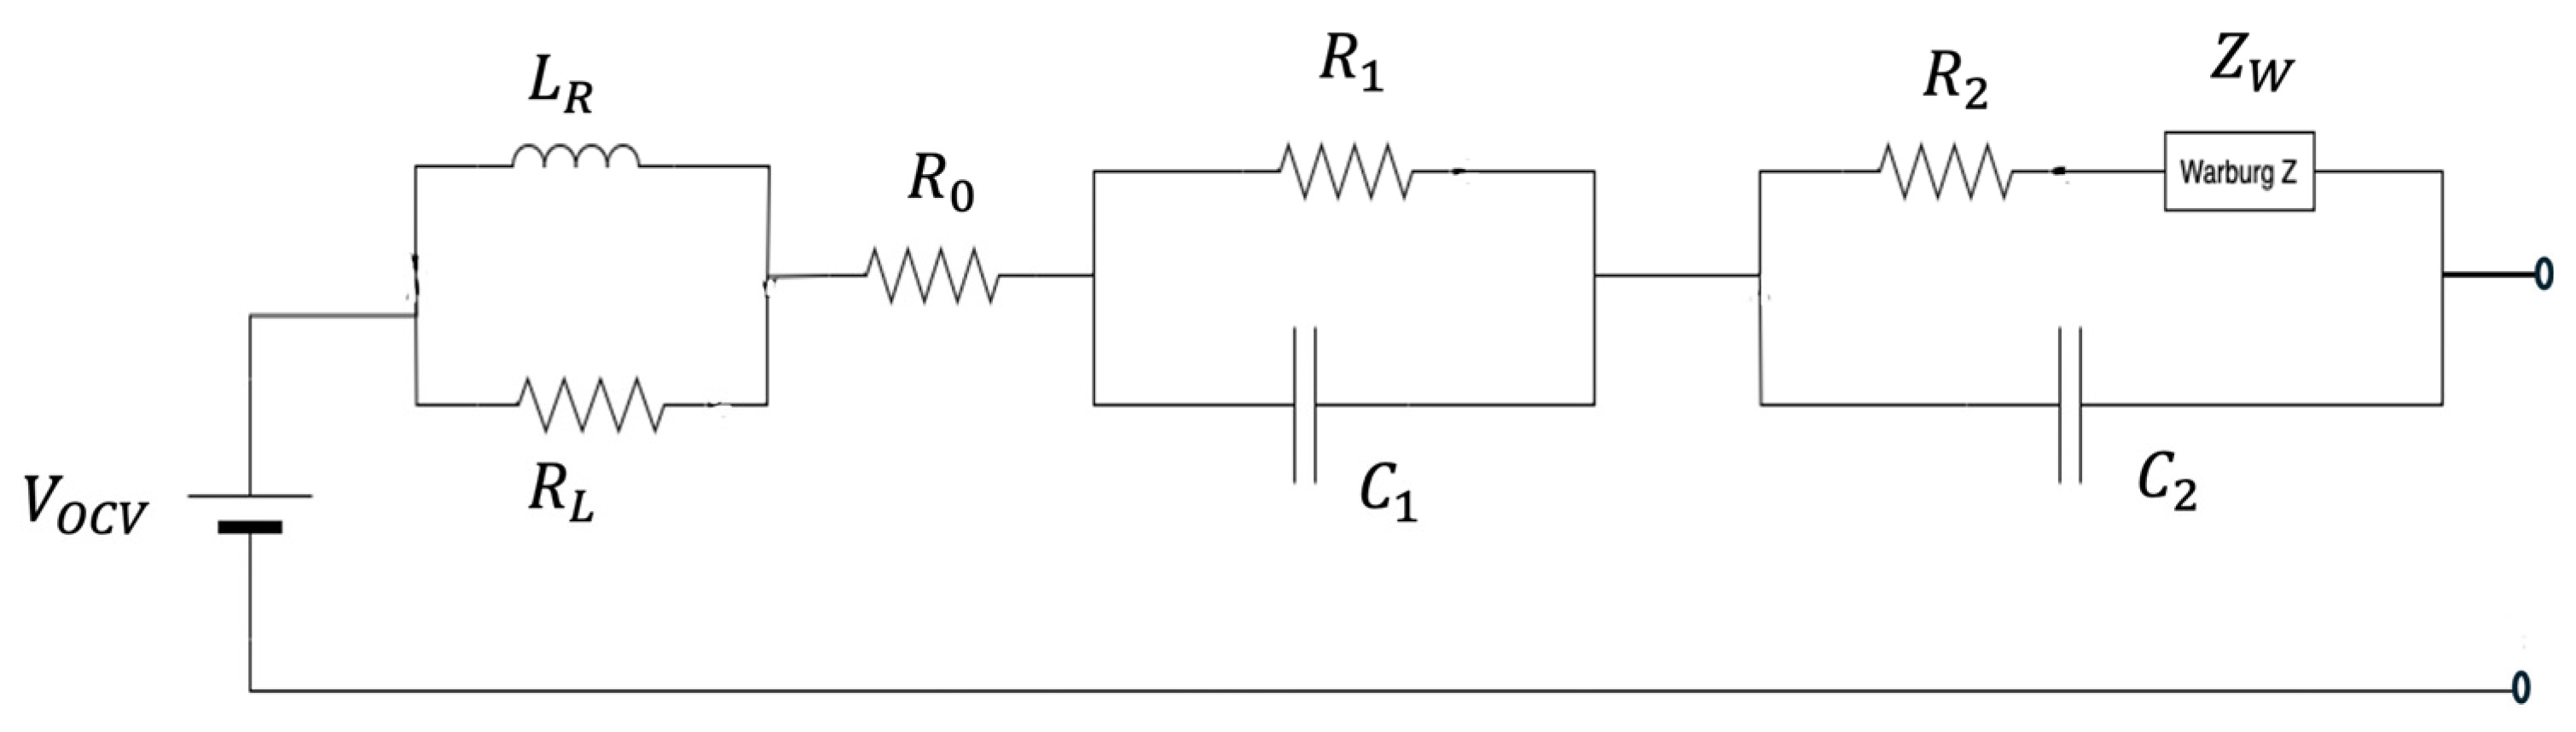
2.4. Equivalent Circuit Model Used

To describe the trend of the impedance spectrum and the degradation effects of the DUTs, it is useful to refer to an ECM for a Lithium-ion cell. In the literature, there are tens of models, each of them covering a particular aspect of the battery that is investigated in the work which proposed it. Since a precise degradation mechanisms analysis is outside the purpose of this paper, a simple ECM, based on the Warburg model, is adopted that was used in the analysis of a battery of similar chemistry [40]. As shown in Figure 2, the model consists of the following:
  • A resistance, R0, to indicate the DC IR of the battery.
  • An RL element to represent the Ohmic-Inductive behavior at high-frequency.
  • Two RC elements to describe the different effects of Charge Transfer Losses and SEI degradation in the intermediate frequencies that generally generate one or two arches in impedance spectra, depending on the chemistry and SOC of the battery.
  • A Warburg element, modeled as Z W = 1 j σ ω 1 2 , that describes a linear trend at lower frequencies, due to diffusion mechanisms.
Figure 2. Circuit diagram of the Warburg Equivalent Circuit Model.
Electronics 13 01438 g002

3. Results

In this section, the results obtained from the experimental procedure described in Section 2.2 are reported.

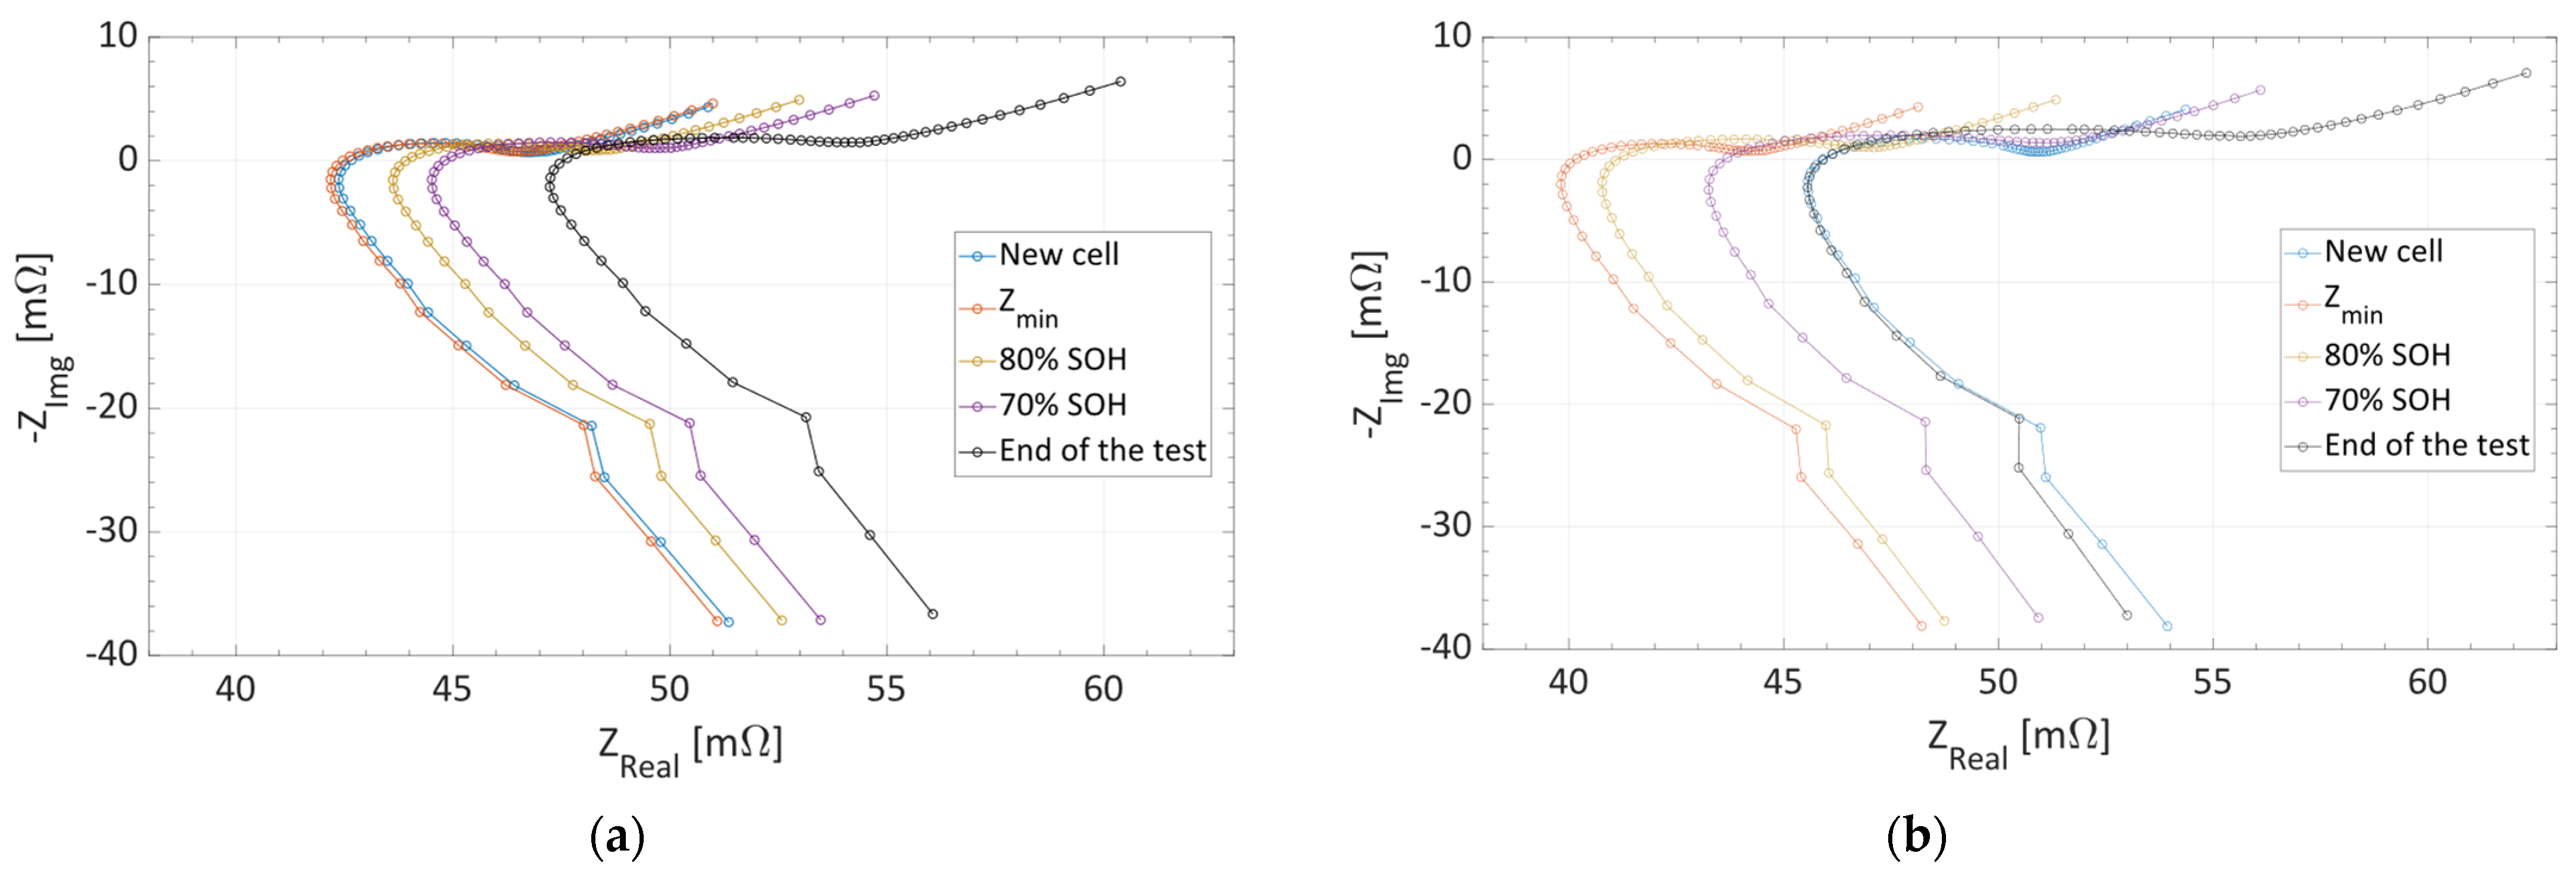
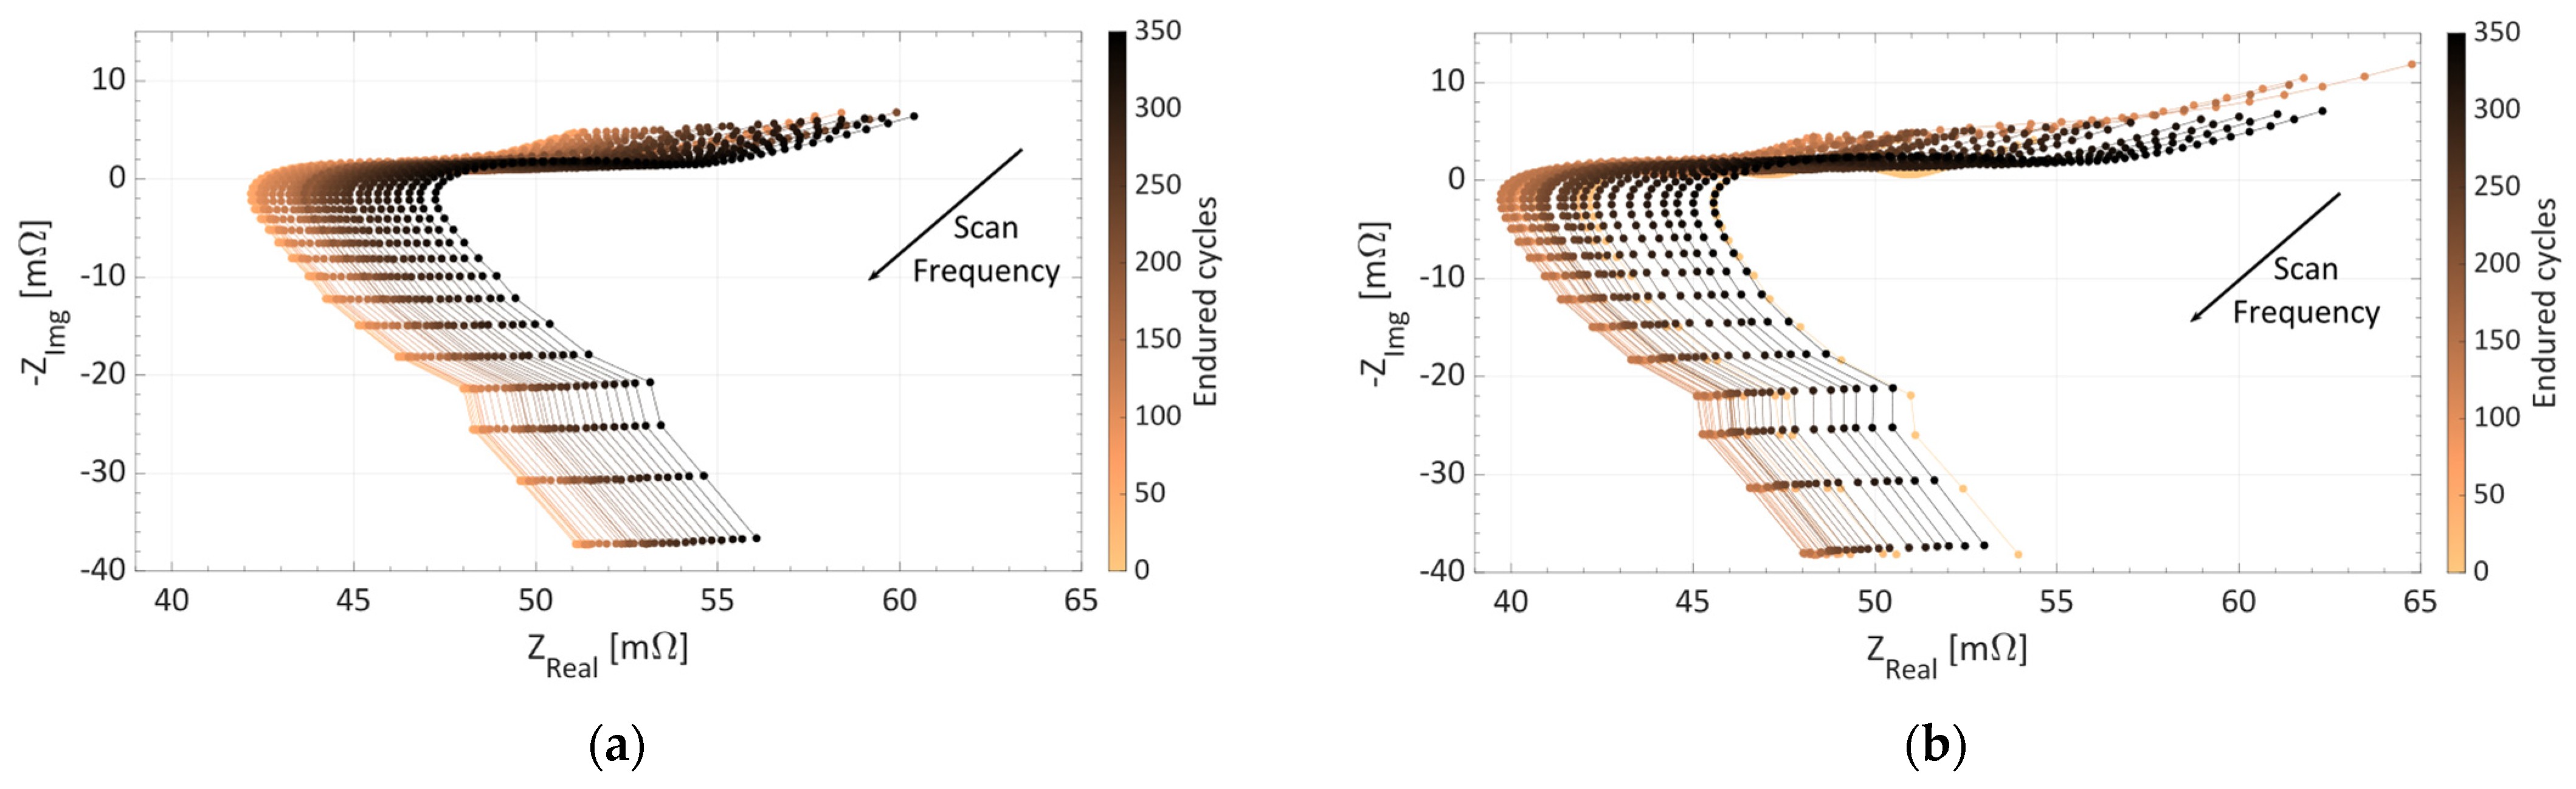
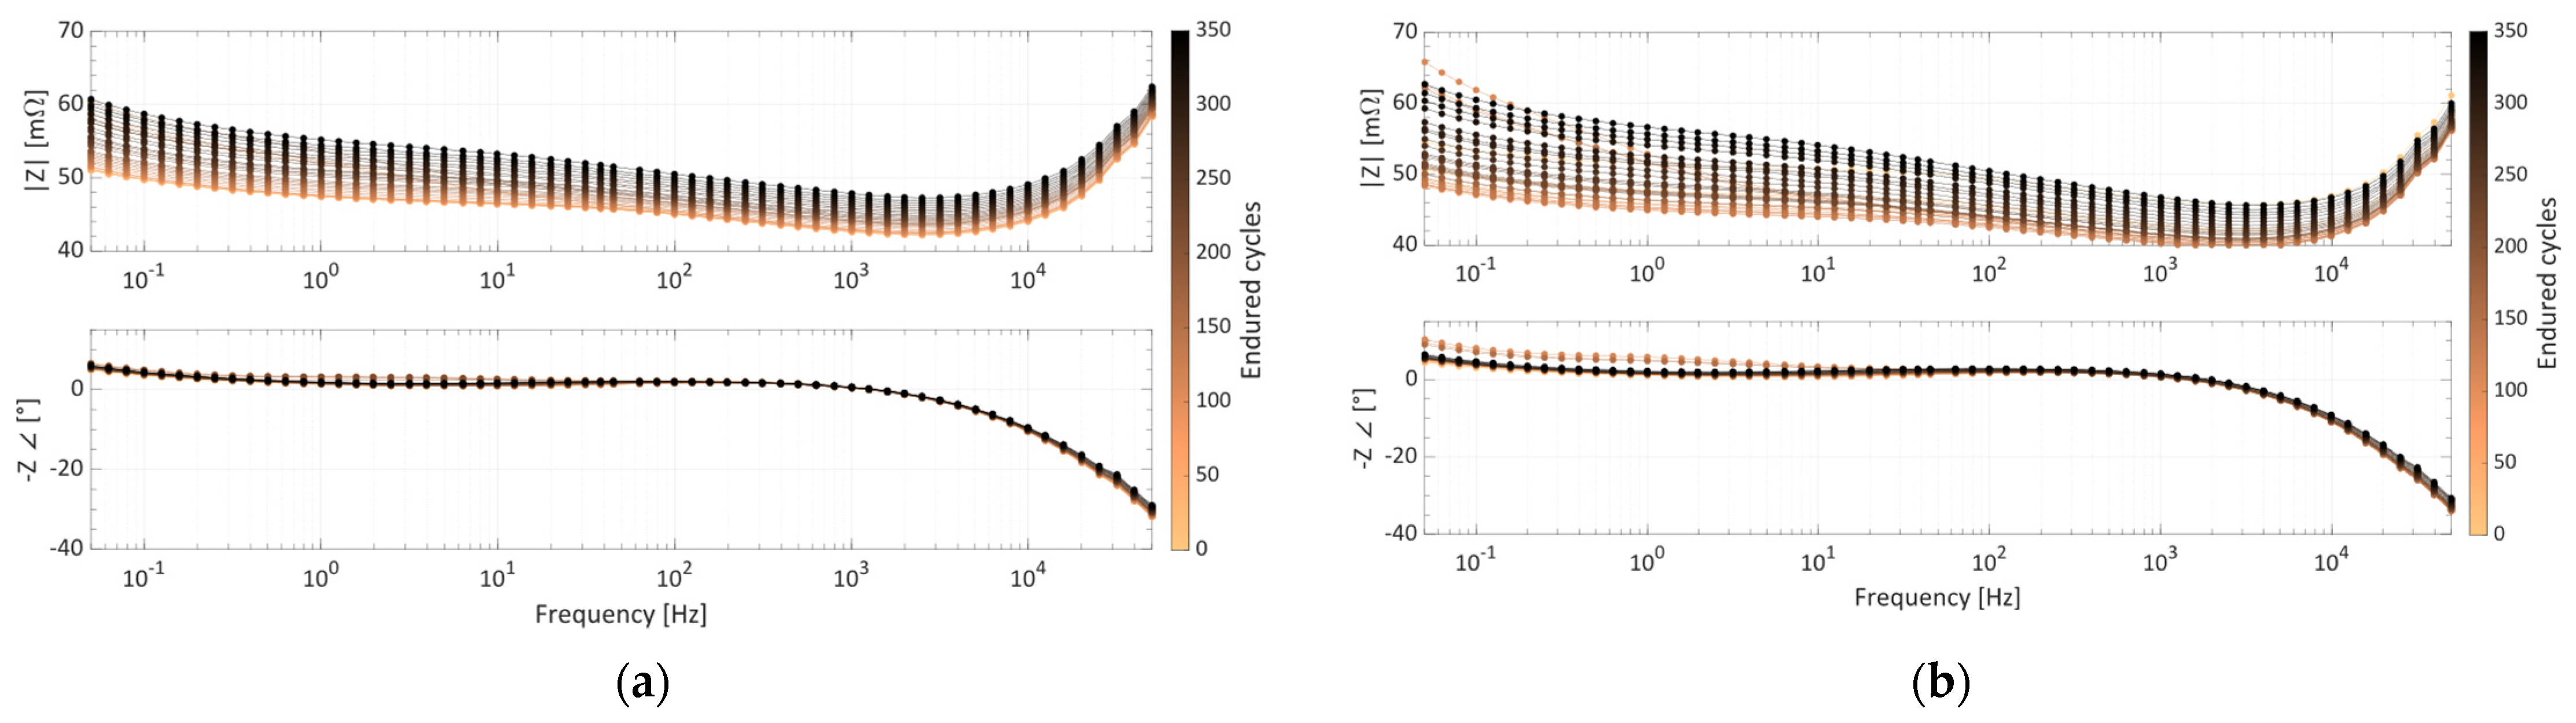
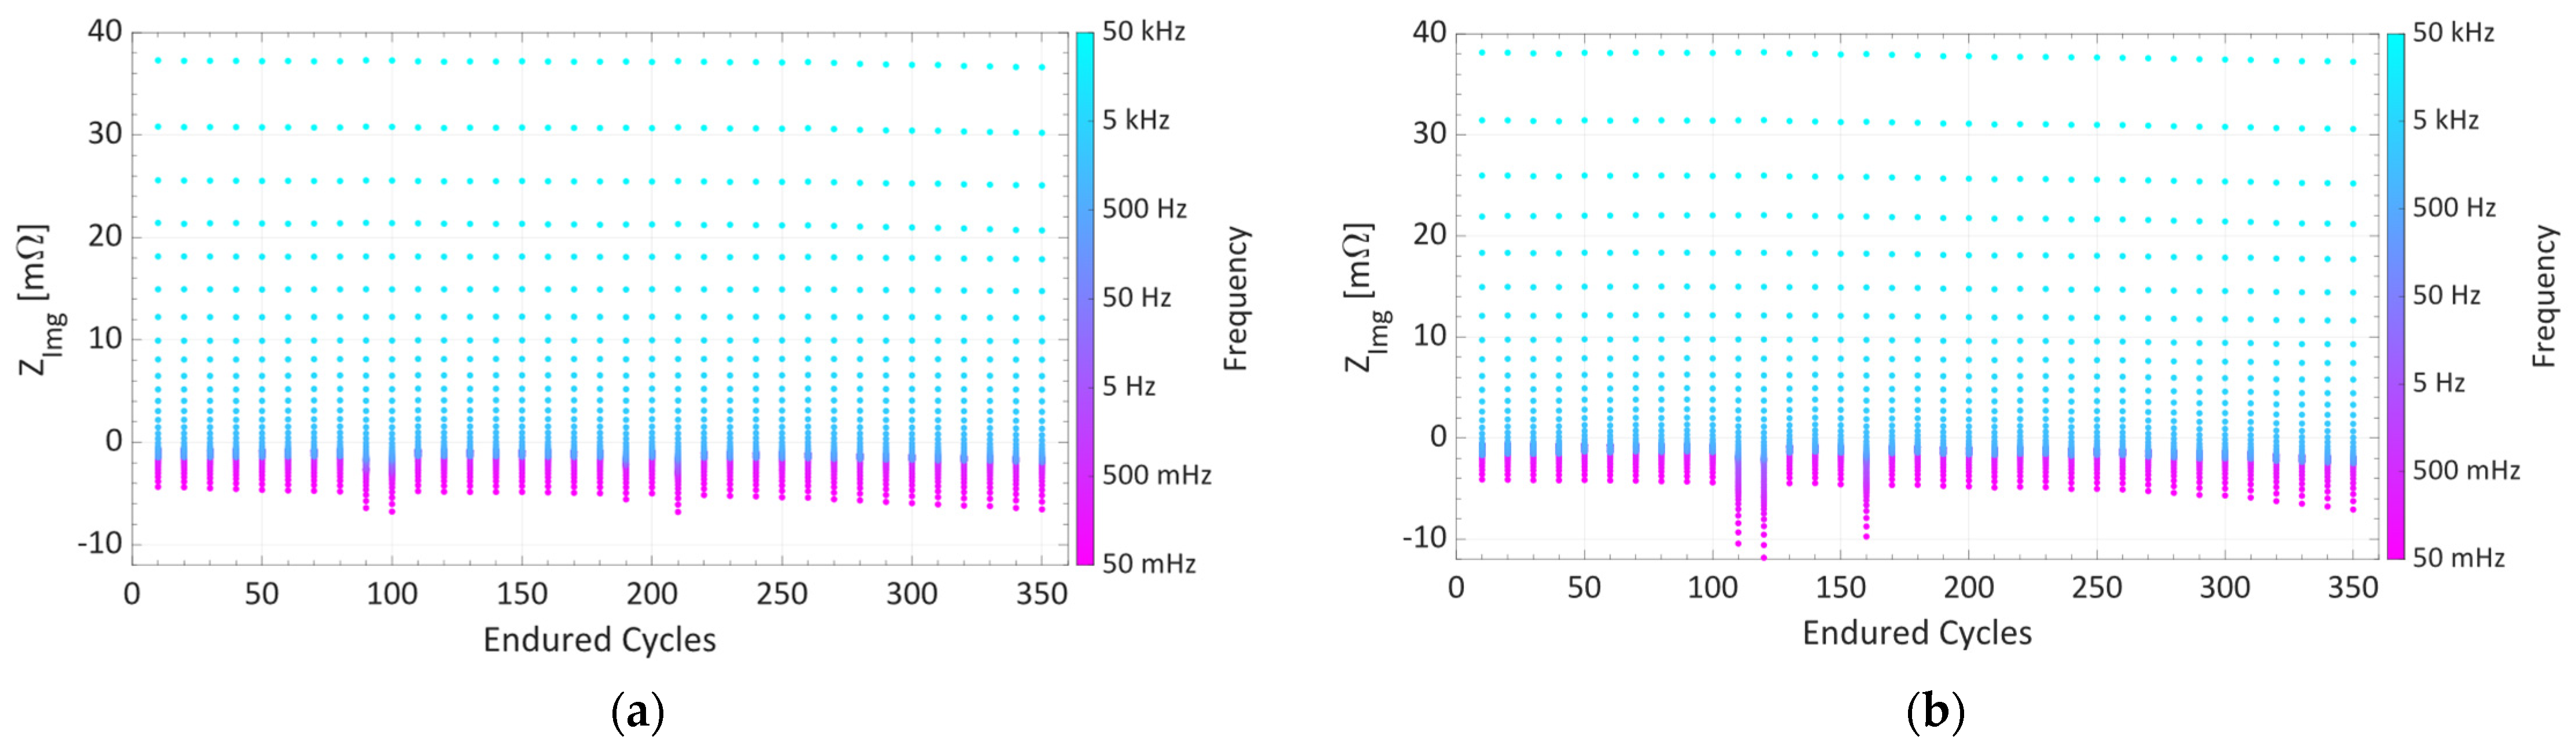
3.1. Impedance Spectrum Analysis

To investigate the effects of the cycle aging impact on different use conditions of Lithium-ion batteries, the impedance spectral responses of the two cells tested are analyzed. By observing the Nyquist plots in Figure 3a,b, it is possible to note the different initial conditions, in terms of impedance, of the two batteries tested, with the 1C-rate discharged battery exhibiting greater resistive values. In addition, the trend of the impedance spectra of both the DUTs during the test remains similar. For the first cycles, the spectrum presents a progressive decrement in the real part of the impedance, until the minimum impedance condition is reached, then it is gradually shifted to higher Z r e a l values for the rest of the test. The fast discharged cell reaches the minimum impedance condition after 50 cycles, while the other one achieves it after 80 cycles. It is interesting to underline that these shifts in the plot are not only along the horizontal axes, but there is also a monotonic vertical increment in— Z i m g components along the cycles endured by the batteries that is more appreciable in the linear zone at low frequency.
Making a zoom in the mid-frequency arc of the plot, as shown in Figure 3c,d, it can be seen how the variations between two spectra are highlighted more in the slow discharge test, with a wider range covered both in the imaginary and the real part of the impedance. It can be noted that the distances between two consecutive plots become wider at the advanced life stages, underlining a faster degradation in the “second life” phase. This trend is more evident for mid and lower frequencies values, emphasizing how the degradation mechanisms that are more involved are linked to SEI degradations, losses in interface processes, and charge transfer slow down [36]. In both the tests conducted, the presence of some occasional changes in the shape of the intermediate region can also be observed. In fact, in some EIS measurements between the 50th and the 250th cycle, the central arc is split into two semi-arcs with a larger total width and a higher slope in the following Warburg linear trend.
These outlier trends are probably due to the fact that the respective EIS measurements were performed after an incorrect charge cycle and, consequentially, the SOC of the cell analyzed was much lower than 100% [43] (for the battery discharged at a 3C-rate, this behavior is also associated with an average temperature higher than during the measurements of the other cell [44]).
The behaviors described above can be further validated by analyzing the Bode plot of the impedance spectra in Figure 4.
In fact, it is possible to highlight the increment in the impedance module with the aging of the battery, with more significant variations observed at lower frequencies. By comparing the Bode plots obtained under 3C-rate and 1C-rate discharge conditions, the different impact on the module of the impedance in these two conditions is further underlined, as follows:
  • After 150 cycles, the maximum module variation is 1.89 mΩ for the first cell and 1.75 mΩ for the second one.
  • At the end of the test, the maximum variation ranges are 9.71 mΩ and 14.38 mΩ, respectively.
By observing the phase plots in Figure 5, the change in the phase of the impedance of the batteries during the test is also verified, with more significant differences in the Warburg and mid-frequency zones.
To further underline the aging impact on the impedance, it is possible to analyze the variation range of the resistive part of the impedance as a function of the cycles endured by the DUTs, as illustrated in Figure 5.
The range of the values assumed by Z r e a l during the EIS becomes narrower between the new and the minimum impedance condition, then it enlarges with the increasing number of cycles endured by the device. These variations are more noticeable on the 1C-rate discharged cell. The first cell exhibits higher resistive values, especially at high frequency. On the contrary, as shown in Figure 6, the most significant variations of the Z i m g are mainly visible in the low-frequency zone.

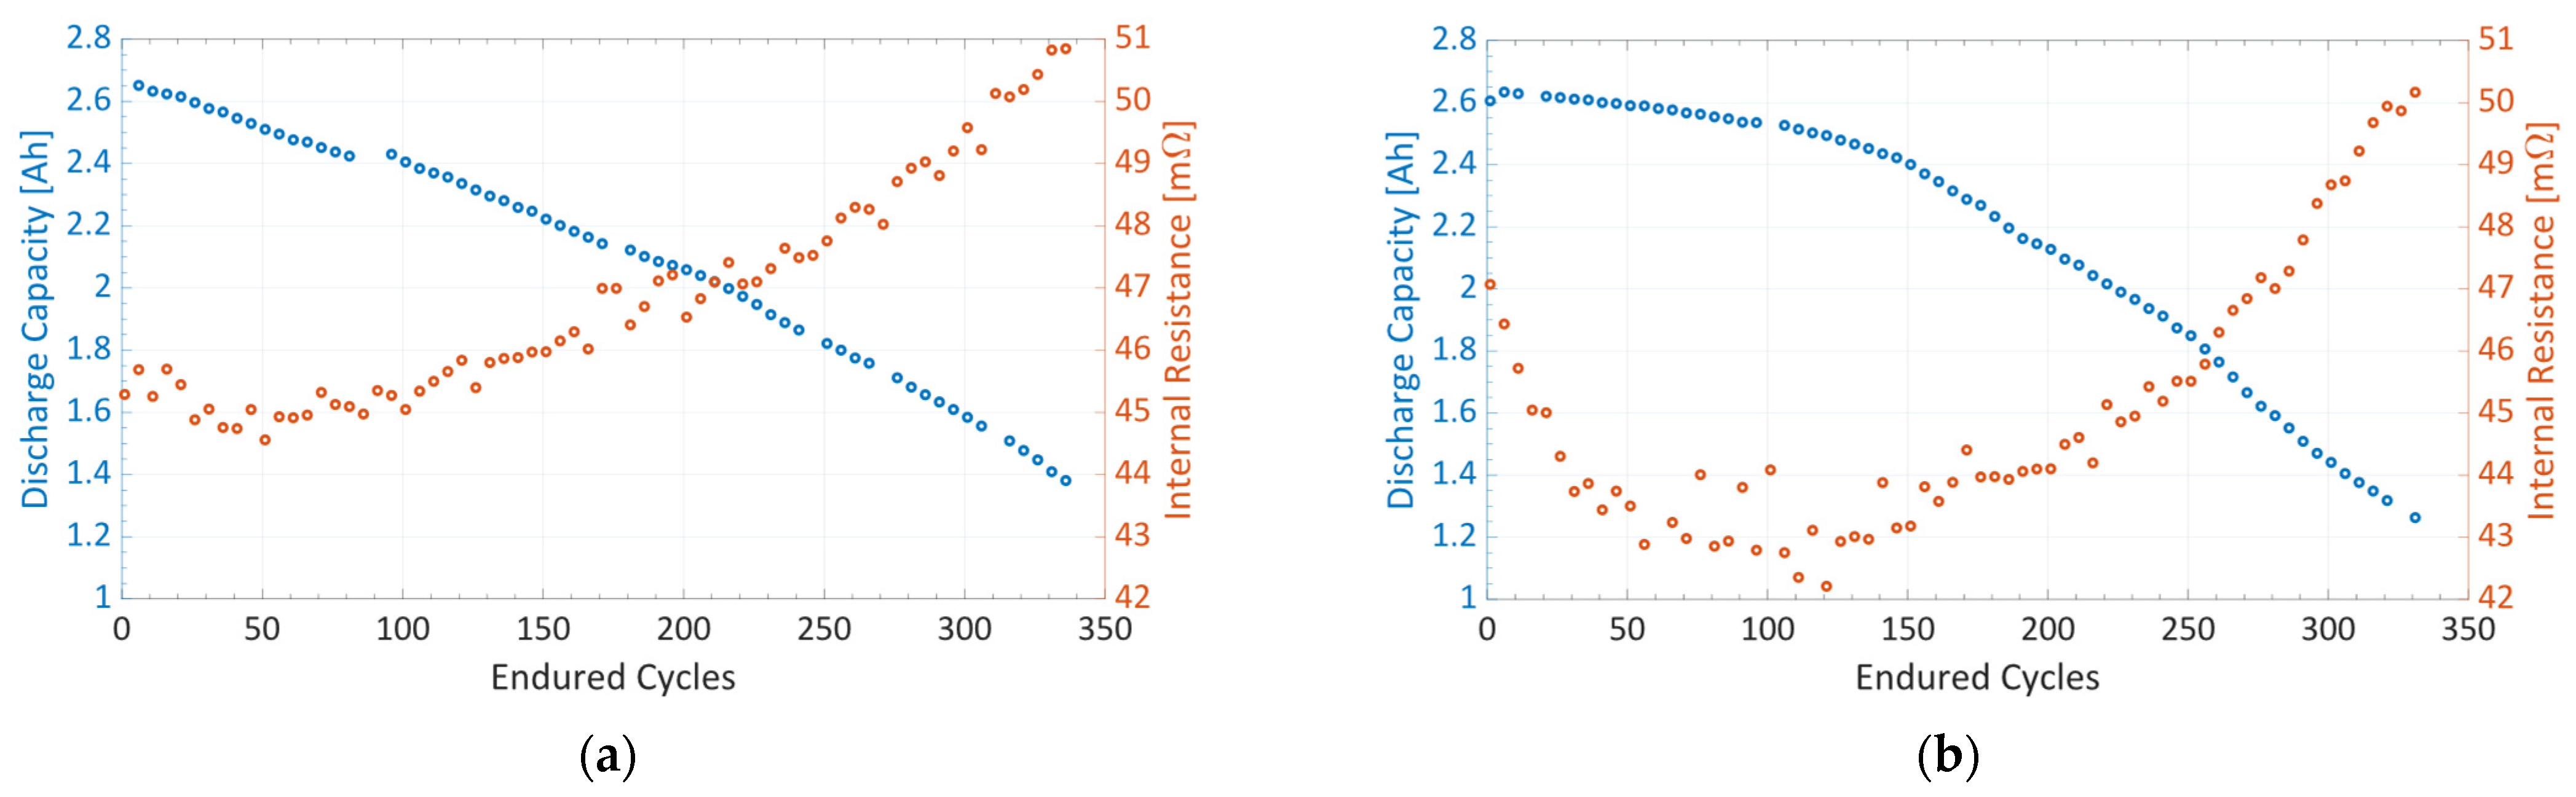
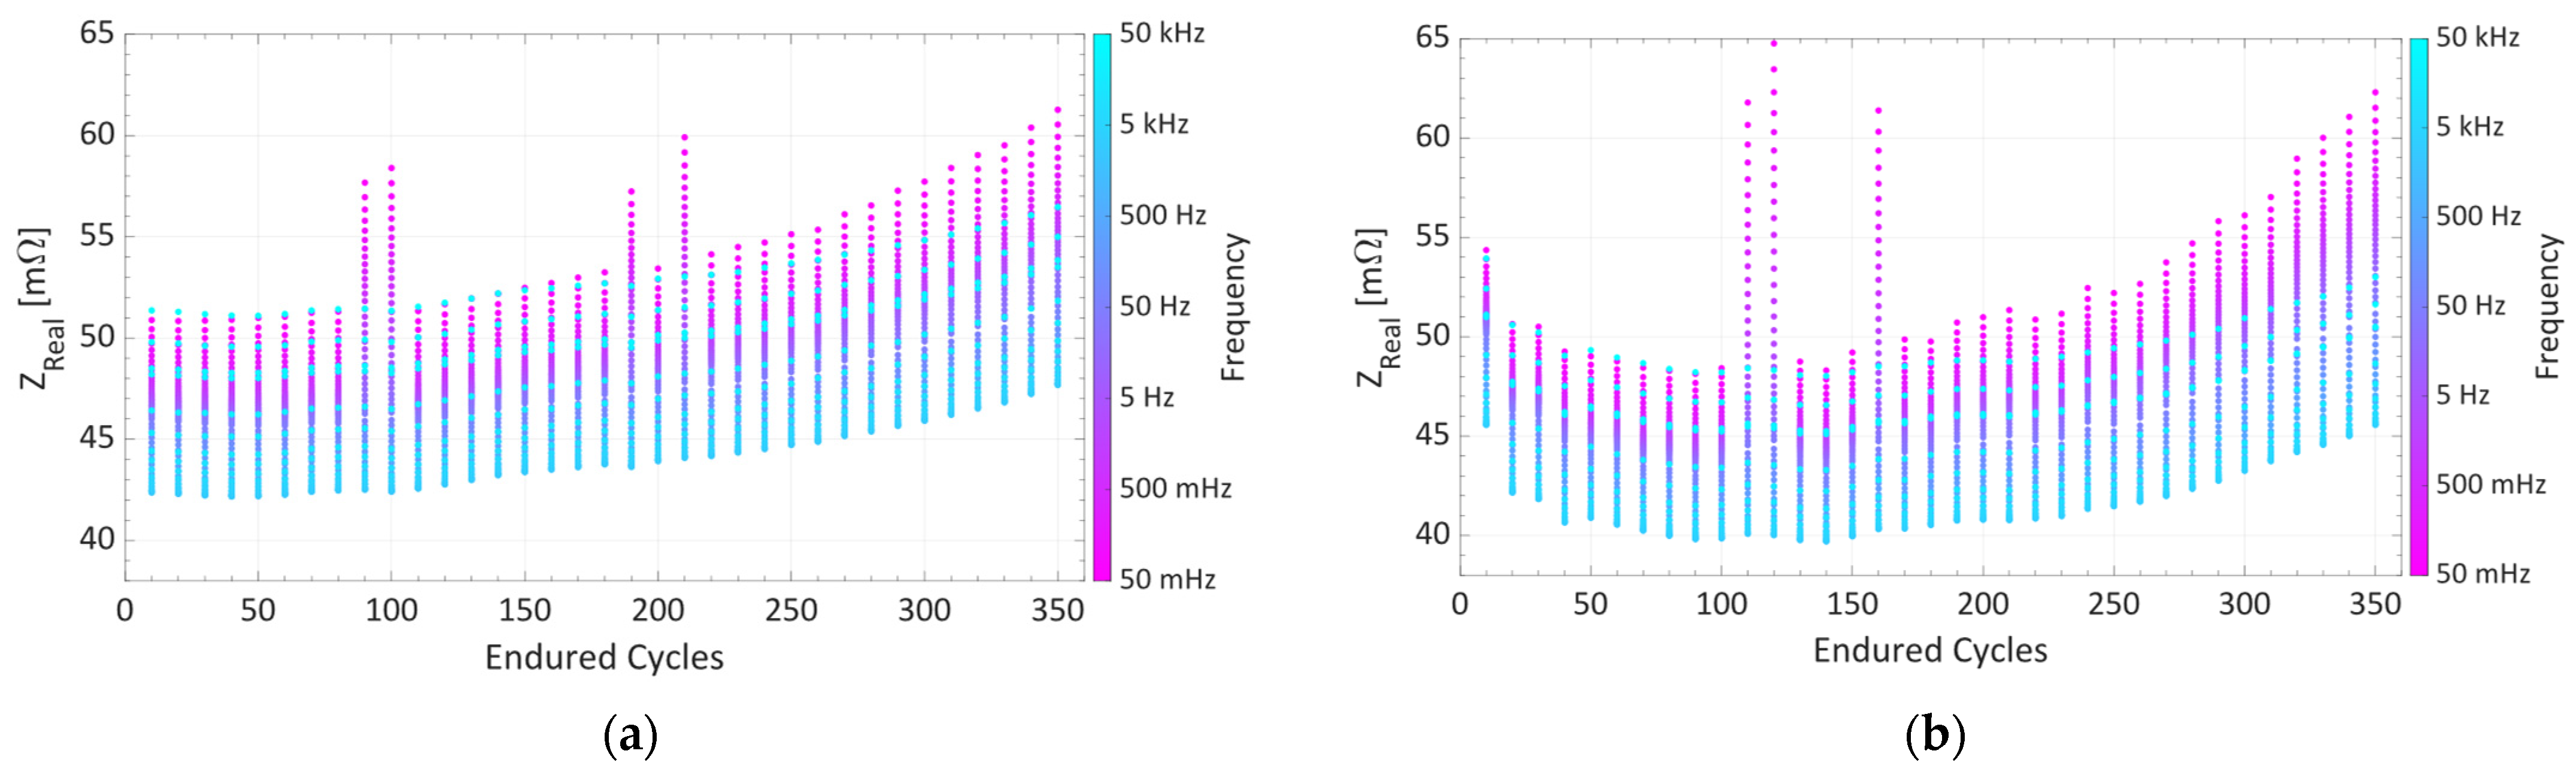
3.2. Discharge Capacity vs. Internal Resistance

Another result that emerges from the tests is the different trend of the aging effects on the discharge capacity and the internal resistance (IR) of the battery. Performing the DC internal resistance measurements every five cycles and confronting them with the discharge capacity, as is visible in Figure 7, it is possible to note how the discharge capacity plots have a monotonic decreasing trend, while the IR, as a function of aging, is neither linear nor monotonic. As a matter of fact, the IR exhibits a minimum after 50 cycles and 80 cycles for the 3C-rate discharge and 1C-rate discharge, respectively, in compliance with the results discussed in Section 3.1. The discharge capacity plot for the cell aged under fast discharge has an approximately linear trend with a quicker degradation in the SOH, while the cell discharged using a nominal condition exhibits a lower slope for the first 150 cycles and then highly increases for the rest of the experiment.
The slopes’ values of the fitting lines of these trends are reported in Table 1. Both the batteries analyzed present higher values of resistance than at the initial conditions, which then decrease in the first tens of cycles. This phenomenon probably derives from a calendar aging, in which the batteries remained unused before the beginning of the test campaign. It can also be noted that the IR for the slower discharged battery reaches lower values than the other one. In fact, the fast discharged cell shows small changes in the “warm-up” phase, with an overall resistance value higher than the other battery. Then, the IR of both batteries increases, following different slopes. The IR’s increasing slope is more pronounced for the second cell, i.e., for the one tested under nominal slow discharge conditions. These affirmations are confirmed by the results reported in the second part of Table 1.

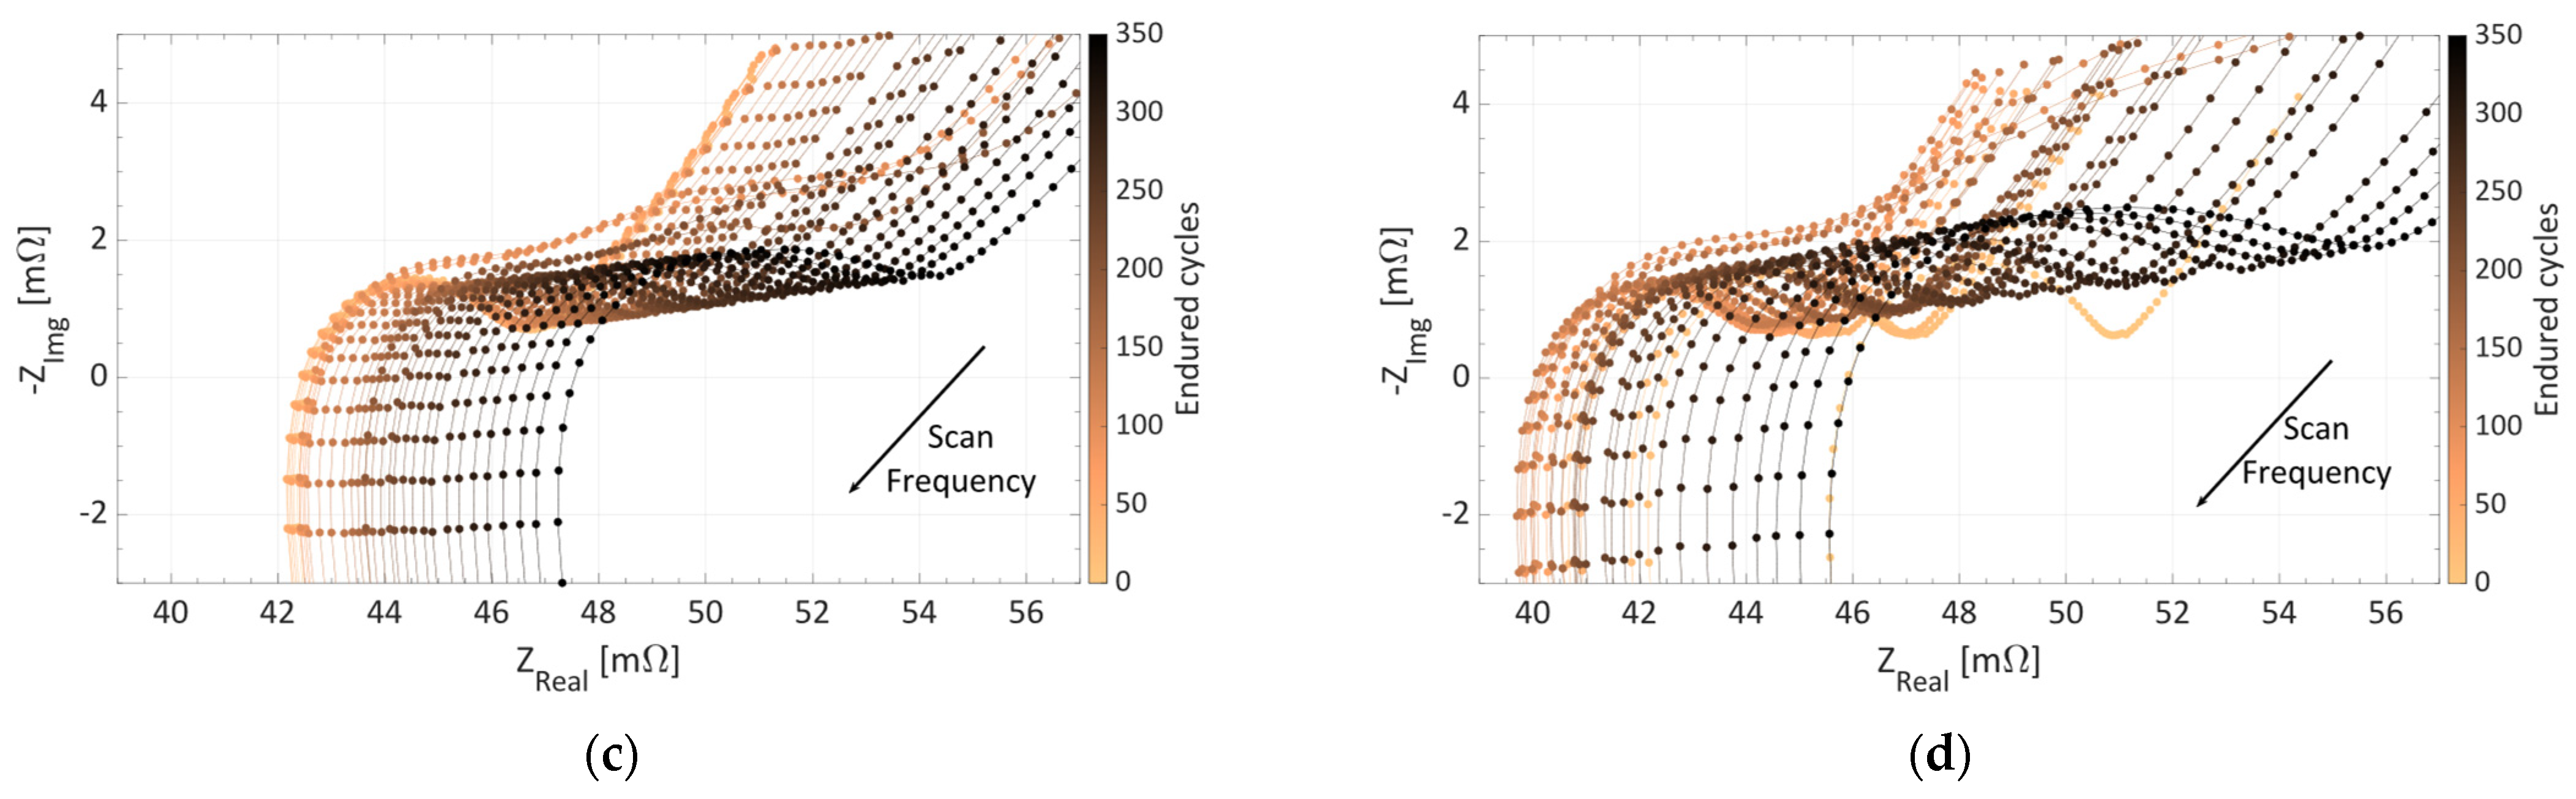
3.3. Differences in Each Region’s Trend at Different SOH Conditions

The explained testing procedure has allowed us to bring the discharge capacity of the two cells to the values of 1.3564 Ah and 1.2442 Ah, respectively, which are two extremely severe conditions that correspond approximately to the 50% of the SOH of these batteries. To characterize the effects of the cycle aging degradation on the impedance spectrum, five reference SOH conditions are chosen:
  • New cell condition.
  • Minimum Impedance Condition ( Z M i n ).
  • 80% SOH condition, the most common definition of End Of Life (EOL) conditions derived from automotive standards.
  • 70% SOH condition, which is a valid alternative for the EOL in alternative fields.
  • End of the test (i.e., 350 cycles, which represents approximately 50% SOH).
In Figure 8, the impedance spectra at the defined conditions for both the tested batteries are illustrated. To divide and to study the effects on each single region of the plots, some parameters regarding the slopes of the different trends and the dimension of the mid-frequency arc are extracted and collected in Table 2 and Table 3. These values substantially identify the resistance changes of the losses exhibited by the ECM in Section 2.4, giving an idea of the variations of how these quantities are involved. It is possible to confront the trends obtained for the two different discharge conditions tested in each of the Nyquist plot’s zones, as detailed in the following:
  • In the Warburg zone, the linear trend’s slope decreases in a monotonic way for both the cells tested. The total percentage reduction results equal to 13.32%, for the fast discharged battery and 28.24%, for the cell aged under nominal conditions. It is important to emphasize that the most significant decrease in the diffusion coefficient is collocated in the portion of the cells’ life between 70% SOH and the end of the test.
  • The mid-frequency (MF) arc’s size follows the behavior of the impedance, with a decreasing trend until the Z M i n condition, to then increase with the rest of the cycles. The more significant variations in the central arc are seen for the 1C-rate discharged battery that passes from the 5.5633 mΩ width at the initial condition to the value of 10.0368 mΩ at the end of the test.
  • For the high-frequency (HF) region, it is possible to notice a different progression in linear trends’ slopes for the two batteries. In fact, while for the second battery, the variations in the slope follow the impedance behavior, the other cell exhibits a decreasing progression. This is probably due to the higher impedance values at the high frequency shown by the first cell.
Figure 8. Nyquist plot of the impedance for different health conditions considering a 3C-rate discharged battery (a) and a 1C-rate discharged battery (b). The health conditions are new cell, Z M i n , 80% SOH, 70% SOH, and end of the test.
Electronics 13 01438 g008
In summary, the most significant changes in the EIS Nyquist plot can be visualized in an overall shift to higher resistive values, but also in an enlargement of the size of the MF semiarch, followed by the monotonic slope’s reduction in the linear trend at lower frequencies.
Table 2. Summary of the main parameters that characterize the cycle aging effects on the battery at different health conditions for a battery discharged at fast condition (3C-rate).
ConditionIR
[mΩ]
Warburg Zone SlopeMF Arc Width [mΩ]HF Zone Slope
New Cell42.70.94334.7744−3.6568
Z M i n 42.40.92144.7452−3.6688
80% SOH43.90.91634.9993−3.6369
70% SOH44.80.89525.4978−3.6262
End of Test47.50.81767.1494−3.5999
Table 3. Summary of the main parameters that characterize the cycle aging effects on the battery at different health conditions for a battery discharged under nominal condition (1C-rate).
ConditionIR
[mΩ]
Warburg Zone SlopeMF Arc Width [mΩ]HF Zone Slope
New Cell45.91.08475.5633−3.9735
Zmin40.20.97734.6964−3.9635
80% SOH41.10.92136.3300−4.1198
70% SOH43.70.87637.8592−4.2398
End of Test45.90.778410.0368−4.3426

4. Discussion

From the results obtained by elaborating the information of multiple EIS datasets extracted from the life of the two batteries tested, it has been possible to characterize the behavior of the cycle aging impact under different stress use conditions. Regardless of the different initial conditions of the single product, it is possible to note that the amplitude of the current applied in discharge sensibly affects the speed of the aging process, with higher values in terms of impedance and a more rapid decrease in the discharge capacity.
However, from the test conducted, it turned out that this fact can be valid only for the first 150 cycles; after that, the degradation impact and the relative capacity drop become more significant for the battery discharged at 1C-rate.
Moreover, the battery tested under fast discharge (3C-rate) reaches 80% SOH and 70% SOH conditions after 180 and 250 cycles, respectively, while for the other one (i.e., battery tested under nominal discharge profile at 1C-rate), 210 and 300 cycles are needed to reach the same thresholds.
Nevertheless, the worsening of the characteristics and the different deterioration trends in the second half of the life test bring the cell tested under nominal discharge to a worse SOH at the conclusion of the experiments.
Furthermore, the variations in the impedance spectrum are more evident for the 1C-rate discharged cell, with a more significant decrease in the IR values during the first test cycles, followed by a larger shift to higher impedance values that coincides with the slope increment in the capacity drop.
As expected, a more stressful usage reduces the life of a Lithium-ion battery, but the comparison of two different discharge conditions does not only translates into a simple change of the slope of a linear aging trend (that is true for most of the useful life of the battery), but it highlights the postponed and more severe degradation at lower SOH for the one discharged with lower currents.

5. Conclusions

This paper introduces a State of Health definition of Lithium-ion batteries based on Electrochemical Impedance Spectroscopy measurements and a Warburg-based Equivalent Circuit Model. The main results obtained from the experimental campaign are reported in the following:
  • The cycle aging of the battery affects the various regions of the impedance spectrum differently, with more significant variations visible on the mid-frequency arc and the low-frequency linear zone.
  • A quicker aging impact caused by a faster discharge profile of the cell has been discovered in the “first life stage” (until 80% SOH is reached) of a Li–Mn battery, with a higher overall impedance and an approximately linear capacity drop.
  • Under nominal discharge conditions, a sensible change in the degradation trend in the “second life phase” (after 80% SOH threshold) has been discovered, with higher impacts on the mid-frequency degradation mechanisms and on the reduction in the diffusion coefficient in the Warburg region.
Furthermore, this work further underlines the necessity to develop a multi-parameters SOH estimation, exposing the differences in the trends of the various features that characterize a Lithium-ion cell during all the stages of its life. In this case, the use of EIS dataset analysis, in association with the capacity and IR measurements, makes it possible to obtain more information in order to enhance the accuracy of SOH estimation, even under different initial conditions of the analyzed cell. Moreover, this paper illustrates the potentiality of EIS for battery prognostics under different stress conditions, such as slow and fast discharge applications. Future developments of this work will be focused on battery performance estimation during life cycle tests under new discharge current rates and with different battery technologies; additionally, future studies of SOH definition under different charge strategies will also be conducted.

Author Contributions

Conceptualization, G.P.; Data curation, G.P. and F.C.; Formal analysis, G.P. and F.C.; Funding acquisition, L.C. and M.C.; Investigation, G.P. and F.C.; Methodology, G.P.; Project administration, L.C. and M.C.; Resources, L.C.; Software, G.P. and F.C.; Supervision, L.C. and M.C.; Validation, L.C.; Visualization, G.P. and F.C.; Writing—original draft, G.P. and F.C.; Writing—review and editing, G.P. All authors have read and agreed to the published version of the manuscript.

Funding

This research received no external funding.

Data Availability Statement

The raw data supporting the conclusions of this article will be made available by the authors on request.

Conflicts of Interest

The authors declare no conflicts of interest.

References

  1. D’Emilia, G.; Gaspari, A.; Natale, E.; Adduce, G.; Vecchiarelli, S. All-Around Approach for Reliability of Measurement Data in the Industry 4.0. IEEE Instrum. Meas. Mag. 2021, 24, 30–37. [Google Scholar] [CrossRef]
  2. D’Emilia, G.; Gaspari, A.; Natale, E. Mechatronics Applications of Measurements for Smart Manufacturing in an Industry 4.0 Scenario. IEEE Instrum. Meas. Mag. 2019, 22, 35–43. [Google Scholar] [CrossRef]
  3. Catelani, M.; Ciani, L.; Bartolini, A.; Del Rio, C.; Guidi, G.; Patrizi, G. Reliability Analysis of Wireless Sensor Network for Smart Farming Applications. Sensors 2021, 21, 7683. [Google Scholar] [CrossRef] [PubMed]
  4. Singh, K.; Singh, Y.; Barak, D.; Yadav, M. Evaluation of Designing Techniques for Reliability of Internet of Things (IoT). Int. J. Eng. Trends Technol. 2023, 71, 102–118. [Google Scholar] [CrossRef]
  5. Da Silva, F.S.T.; Da Costa, C.A.; Crovato, C.D.P.; Da Rosa Righi, R. Looking at energy through the lens of Industry 4.0: A systematic literature review of concerns and challenges. Comput. Ind. Eng. 2020, 143, 106426. [Google Scholar] [CrossRef]
  6. Ghookabloo, M.; Fathi, M. Industry 4.0 and opportunities for energy sustainability. J. Clean. Prod. 2021, 295, 126427. [Google Scholar]
  7. Scharl, S.; Praktiknjo, A. The Role of a digital industry 4.0 in a renewable energy system. Int. J. Energy Res. 2019, 43, 3891–3904. [Google Scholar] [CrossRef]
  8. Iturrino-Garcia, C.; Patrizi, G.; Bartolini, A.; Ciani, L.; Paolucci, L.; Luchetta, A.; Grasso, F. An Innovative Single Shot Power Quality Disturbance Detector Algorithm. IEEE Trans. Instrum. Meas. 2022, 71, 2517210. [Google Scholar] [CrossRef]
  9. Bayindir, R.; Colak, I.; Fulli, G.; Demirtas, K. Smart grid technologies and applications. Renew. Sustain. Energy Rev. 2016, 66, 499–516. [Google Scholar] [CrossRef]
  10. Tan, K.M.; Babu, T.S.; Ramachandaramurthy, V.K.; Kasinathan, P.; Solanki, S.G.; Raveendran, S.K. Empowering smart grid: A comprehensive review of energy storage technology and application with renewable energy integration. J. Energy Storage 2021, 39, 102591. [Google Scholar] [CrossRef]
  11. Alotaibi, I.; Abido, M.A.; Khalid, M.; Savkin, A.V. A Comprehensive Review of Recent Advances in Smart Grids: A Sustainable Future with Renewable Energy Resources. Energies 2020, 13, 6269. [Google Scholar] [CrossRef]
  12. Tong, B.; Song, Z.; Wu, H.; Wang, X.; Feng, W.; Zhou, Z.; Zhang, H. Ion transport and structural design of lithium-ion conductive solid polymer electrolytes: A perspective. Mater. Futures 2022, 1, 042103. [Google Scholar] [CrossRef]
  13. Zhao, Q.; Sun, K.; Wang, X.; Wang, Q.; Wang, J. Examining green-sustainable approaches for recycling of lithium-ion batteries. DeCarbon 2024, 3, 100034. [Google Scholar] [CrossRef]
  14. Armand, M.; Axmann, P.; Bresser, D.; Copley, M.; Edström, K.; Ekberg, C.; Guyomard, D.; Lestriez, B.; Novák, P.; Petranikova, M.; et al. Lithium-ion batteries—Current state of the art and anticipated developments. J. Power Sources 2020, 479, 228708, ISSN 0378-7753. [Google Scholar] [CrossRef]
  15. Dunn, B.; Kamath, H.; Tarascon, J.-M. Electrical energy storage for the grid: A battery of choices. Science 2011, 334, 928–935. [Google Scholar] [CrossRef] [PubMed]
  16. Bresser, D.; Moretti, A.; Varzi, A.; Passerini, S. The role of batteries for the successful transition to renewable energy sources. In Encyclopedia of Electrochemistry: Batteries, 1st ed.; Wiley-VCH: Weinheim, Germany, 2020; pp. 3–11. [Google Scholar]
  17. Wang, A.G. Battery energy storage system: The key of future smart grid. In Proceedings of the 2016 IEEE International Conference on Pervasive Computing and Communication Workshops (PerCom Workshops), Sydney, NSW, Australia, 14–18 March 2016; p. 1. [Google Scholar] [CrossRef]
  18. Yudhistira, R.; Khatiwada, D.; Sanchez, F.A. Comparative life cycle assessment of lithium-ion and lead-acid batteries for grid energy storage. J. Clean. Prod. 2022, 358, 131999. [Google Scholar] [CrossRef]
  19. Salkuti, S.R. Energy Storage Technologies for Smart Grid: A Comprehensive Review. Majlesi J. Electr. Eng. 2020, 14, 39–48. [Google Scholar]
  20. Zubi, G.; Dufo-Lopez, R.; Carvalho, M.; Pasaoglu, G. The lithium-ion battery: State of the art and future perspectives. Renew. Sustain. Energy Rev. 2018, 89, 292–308. [Google Scholar] [CrossRef]
  21. Patrizi, G.; Picano, B.; Catelani, M.; Fantacci, R.; Ciani, L. Validation of RUL Estimation Method for Battery Prognostic under Different Fast-Charging Conditions. In Proceedings of the 2022 IEEE International Instrumentation and Measurement Technology Conference (I2MTC), Ottawa, ON, Canada, 16–19 May 2022. [Google Scholar]
  22. Rahimi-Eichi, H.; Ojha, U.; Baronti, F.; Chow, M.-Y. Battery Management System: An Overview of Its Application in the Smart Grid and Electric Vehicles. IEEE Ind. Electron. Mag. 2013, 7, 4–16. [Google Scholar] [CrossRef]
  23. Catelani, M.; Ciani, L.; Grasso, F.; Patrizi, G.; Reatti, A. Remaining Useful Life Estimation for Electric Vehicle Batteries Using a Similarity-Based Approach. In Proceedings of the 2022 IEEE International Workshop on Metrology for Automotive (MetroAutomotive), Modena, Italy, 4–6 July 2022; pp. 82–87. [Google Scholar]
  24. Yang, S.; Zhang, C.; Jiang, J.; Zhang, W.; Zhang, L.; Wang, Y. Review on state-of-health of lithium-ion batteries: Characterizations, estimations and applications. J. Clean. Prod. 2021, 314, 128015. [Google Scholar] [CrossRef]
  25. Liu, Y.; Wang, L.; Li, D.; Wang, K. State-of-health estimation of lithium-ion batteries based on electrochemical impedance spectroscopy: A review. Prot. Control Mod. Power Syst. 2023, 8, 41. [Google Scholar] [CrossRef]
  26. Patrizi, G.; Catelani, M.; Ciani, L.; Song, Y.; Liu, D. A Multi-Channel Deep-Learning Prediction Algorithm for Battery State-of-Health Indicator. In Proceedings of the 2023 IEEE International Conference on Metrology for eXtended Reality, Artificial Intelligence and Neural Engineering (MetroXRAINE), Milano, Italy, 25–27 October 2023; pp. 816–821. [Google Scholar]
  27. Dubarry, M.; Baure, G.; Ansean, D. Perspective on state-of-health determination in lithium-ion batteries. J. Electrochem. Energy Convers. Storage 2020, 17, 044701. [Google Scholar] [CrossRef]
  28. Zheng, Y.; Wang, J.; Qin, C.; Lu, L.; Han, X.; Ouyang, M. A novel capacity estimation method based on charging curve sections for lithium-ion batteries in electric vehicles. Energy 2019, 185, 361–371. [Google Scholar] [CrossRef]
  29. Kim, I.-S. A Technique for Estimating the State of Health of Lithium Batteries Through a Dual-Sliding-Mode Observer. IEEE Trans. Power Electron. 2010, 25, 1013–1022. [Google Scholar] [CrossRef]
  30. Liu, G.; Ouyang, M.; Lu, L.; Li, J.; Han, X. Online estimation of lithium-ion battery remaining discharge capacity through differential voltage analysis. J. Power Sources 2015, 274, 971–989. [Google Scholar] [CrossRef]
  31. Berecibar, M.; Garmendia, M.; Gandiaga, I.; Crego, J.; Villarreal, I. State of health estimation algorithm of LiFePO4 battery packs based on differential voltage curves for battery management system application. Energy 2016, 103, 784–796. [Google Scholar] [CrossRef]
  32. He, J.; Wei, Z.; Bian, X.; Yan, F. State-of-Health Estimation of Lithium-Ion Batteries Using Incremental Capacity Analysis Based on Voltage–Capacity Model. IEEE Trans. Transp. Electrif. 2020, 6, 417–426. [Google Scholar] [CrossRef]
  33. Li, X.; Wang, Z.; Zhang, L.; Zou, C.; Dorrell, D.D. State-of-health estimation for Li-ion batteries by combing the incremental capacity analysis method with grey relational analysis. J. Power Sources 2019, 410–411, 106–114, ISSN 0378-7753. [Google Scholar] [CrossRef]
  34. Ansean, D.; Garcia, V.M.; Gonzalez, M.; Blanco-Viejo, C.; Viera, J.C.; Pulido, Y.F.; Sanchez, L. Lithium-ion battery degradation indicators via incremental capacity analysis. IEEE Trans. Ind. Appl. 2019, 55, 2992–3002. [Google Scholar] [CrossRef]
  35. Chen, L.; Lu, Z.; Lin, W.; Li, J.; Pan, H. A new state-of-health estimation method for lithium-ion batteries through the intrinsic relationship between ohmic internal resistance and capacity. Measurements 2018, 116, 586–595. [Google Scholar] [CrossRef]
  36. Iurilli, P.; Brivio, C.; Wood, V. On the use of electrochemical impedance spectroscopy to characterize and model the aging phenomena of lithium-ion batteries: A critical review. J. Power Sources 2021, 505, 229860. [Google Scholar] [CrossRef]
  37. Kabitz, S.; Bernhard, J.; Ecker, M.; Yurdagel, Y.; Emmermacher, B.; Andrè, D.; Mitsch, T.; Uwe, D. Cycle and calendar life study of a graphite|LiNi1/3Mn1/3Co1/3O2 Li-ion high energy system. Part A: Full cell characterization. J. Power Sources 2013, 239, 572–583. [Google Scholar] [CrossRef]
  38. Li, Y.; Maleki, M.; Banitaan, S. State of health estimation of lithium-ion batteries using EIS measurement and transfer learning. J. Energy Storage 2023, 73, 109185. [Google Scholar] [CrossRef]
  39. Choi, W.; Shin, H.C.; Kim, J.M.; Choi, J.Y.; Yoon, W.S. Modeling and Applications of Electrochemical Impedance Spectroscopy (EIS) for Lithium-ion Batteries. J. Electrochem. Sci. Technol. 2020, 11, 1–13. [Google Scholar] [CrossRef]
  40. Estaller, J.; Kersten, A.; Kuder, M.; Mashayek, A.; Buberger, J.; Thirlinger, T.; Eckerle, R.; Weyh, T. Battery Impedance Modeling and Comprehensive Comparisons of State-Of-The-Art Cylindrical 18650 Battery Cells considering Cells’ Price, Impedance, Specific Energy and C-Rate. In Proceedings of the 2021 IEEE International Conference on Environment and Electrical Engineering and 2021 IEEE Industrial and Commercial Power Systems Europe (EEEIC/I&CPS Europe), Bari, Italy, 7–10 September 2021; pp. 1–8. [Google Scholar]
  41. Datasheet: Li-Mn Battery Specification Model IMR18650, 1st ed.; Consulted on February; Shenzhen Fest Technology Co. Ltd.: Shenzhen, China, 2024.
  42. Catelani, M.; Ciani, L.; Corti, F.; Laschi, M.; Patrizi, G.; Reatti, A.; Vangi, D. Experimental Characterization of Hybrid Supercapacitor Under Different Operating Conditions Using EIS Measurements. IEEE Trans. Instrum. Meas. 2024, 73, 3503210. [Google Scholar] [CrossRef]
  43. Zhang, Y.; Liu, Z.; Wang, Z.; Jiang, Y.; Wen, G.; Gao, P.; Zhu, Y. Electrochemical impedance spectroscopy study of lithium-rich material 0.5Li2MnO3·0.5LiNi1/3Co1/3Mn1/3O2 in the first two charge-discharge cycles. Electrochim. Acta 2019, 310, 136–145. [Google Scholar] [CrossRef]
  44. Keefe, A.S.; Buteau, S.; Hill, I.G.; Dahn, J.R. Temperature Dependent EIS Studies Separating Charge Transfer Impedance from Contact Impedance in Lithium-Ion Symmetric Cells. J. Electrochemic. Soc. 2019, 166, A3272. [Google Scholar] [CrossRef]
Figure 3. Nyquist plots of the impedance during the life cycle test for a 3C-rate discharged battery (a) and for a 1C-rate discharged battery (b). Zoom on the mid-frequency arc of Nyquist plots of the impedance during the life cycle test for a 3C-rate discharged battery (c) and for a 1C-rate discharged battery (d). The EIS measurements are performed every 10 cycles.
Electronics 13 01438 g003aElectronics 13 01438 g003b
Figure 4. Bode plots of the impedance during the life cycle test for a 3C-rate discharged battery (a) and for a 1C-rate discharged battery (b). The EIS measurements are performed every 10 cycles.
Electronics 13 01438 g004
Figure 5. Variation trend of the real part of the impedance during the life cycle test for a 3C-rate discharged battery (a) and for the 1C-rate discharged battery (b).
Electronics 13 01438 g005
Figure 6. Variation trend of the imaginary part of the impedance during the life cycle test for a 3C-rate discharged battery (a) and for a 1C-rate discharged battery (b).
Electronics 13 01438 g006
Figure 7. Discharge capacity (blue) and internal resistance as a function of the battery life considering a 3C-rate discharged battery (a) and a 1C-rate discharged battery (b). The samples are taken every five cycles.
Electronics 13 01438 g007
Table 1. Summary of slope values for discharge capacity and internal resistance during the test. The slopes are obtained from a linear approximation of the trend by means of a fitting line.
Discharge RateDischarge Capacity Function Slope [Ah/Cycle]
3C-rate−0.0033
1C-rate−0.0014 (until 150th cycle)−0.0064 (150th–end)
Discharge RateIR Function Slope [mΩ/Cycle]
3C-rate−0.0182 (until 50th cycle)0.0199 (50th–end)
1C-rate−0.0457 (until 80th cycle)0.0282 (80th–end)
Disclaimer/Publisher’s Note: The statements, opinions and data contained in all publications are solely those of the individual author(s) and contributor(s) and not of MDPI and/or the editor(s). MDPI and/or the editor(s) disclaim responsibility for any injury to people or property resulting from any ideas, methods, instructions or products referred to in the content.

