Article

Understanding Pedestrian Cognition Workload in Traffic Environments Using Virtual Reality and Electroencephalography

1
Center for Energy Efficiency, Virtual Reality, Optical Engineering and Biometry (CEDINT-UPM), Universidad Politécnica de Madrid, 28223 Pozuelo de Alarcón, Spain
2
Faculty of Health Sciences—HM Hospitales, University Camilo José Cela, 28692 Villanueva de la Cañada, Spain
*
Author to whom correspondence should be addressed.
Electronics 2024, 13(8), 1453; https://doi.org/10.3390/electronics13081453
Submission received: 5 March 2024 / Revised: 28 March 2024 / Accepted: 3 April 2024 / Published: 11 April 2024
(This article belongs to the Special Issue Virtual Reality and Scientific Visualization, 2nd Edition)

Abstract

:
Understanding pedestrians’ cognitive processes in traffic environments is crucial for developing strategies to enhance safety and reduce accidents. This study assesses the efficacy of virtual reality (VR) in evaluating pedestrian behavior in simulated road-crossing scenarios. It investigates VR’s capability to realistically mimic the cognitive load experienced in real-world settings. It examines the technical integration of VR with psychophysiological recording to capture cognitive demand indicators accurately. Utilizing a dedicated VR application and electroencephalogram (EEG) measurements, this research aims to elicit significant Event-Related Potentials (ERP), like P3 and Contingent Negative Variation (CNV), associated with decision-making processes. The initial results demonstrate VR’s effectiveness in creating realistic environments for investigating cognitive mechanisms and the balance between induced immersion and experienced discomfort. Additionally, the tasks involving time-to-arrival estimations and oddball scenarios elicited the anticipated components related to attentional and decision-making processes. Despite increased discomfort with extended VR exposure, our results show that it did not negatively impact the cognitive workload. These outcomes highlight VR’s efficacy in replicating the cognitive demands of real-world settings and provide evidence to understand the neurophysiological and behavioral dynamics of vulnerable road users (VRUs) in traffic scenarios. Furthermore, these findings support VR’s role in behavioral and neurophysiological research to design specific safety interventions for VRUs.

1. Introduction

Road traffic accidents represent a complex problem, typically arising from elements related to infrastructure, vehicle functionality, and human errors involving drivers and pedestrians. As the most vulnerable road users (VRUs), pedestrians face significant risks, particularly in urban areas where most of the population lives. Recent 2021 statistics reveal that about 70% of all road fatalities in these regions involve them [1]. A key objective within the Sustainable Development Goals (SDGs) established in 2015 is Goal 3.6, which focuses on reducing deaths and injuries from road accidents. This goal was further reinforced by the 2020 Stockholm Declaration at the Third Global Ministerial Conference on Road Safety. This declaration calls for a 50% reduction in road traffic deaths by 2030, extending the objectives of Goal 3.6 beyond 2020. This declaration also encourages setting specific targets to decrease fatalities and severe injuries for all road users, with particular attention to vulnerable road users (VRUs), in adherence to these commitments. Although there has been a gradual decline, the current number of road casualties remains alarmingly high, presenting significant human, social, and economic challenges. Furthermore, these statistics are markedly far from the ambitious goal of achieving zero deaths by 2050, as outlined by initiatives such as Europe’s “Vision Zero” [2].
It is essential to understand the cognitive processes that govern pedestrians’ risk perception in traffic environments and the factors influencing their decision making to devise successful strategies to improve pedestrian safety and lower accident rates. For instance, it is well-known that walking or street-crossing involves more than processing sensory information: it requires estimating time and speed, with behaviors adjusted according to personal goals [3]. This is a complex behavior demanding significant cognitive resources. Any additional activity or distraction, such as using a mobile phone while walking (a common interference for up to 20% of pedestrians [4]), can pose a safety risk by diverting these resources and reducing one’s risk-detection capacity. Such tasks where cognitive capacity is diverted are referred to as dual tasks.
Neuroscientific insights reveal that performing dual tasks can strain cognitive resources. While individuals with a healthy cognitive system may manage this effectively, impairment in the central nervous system can lead to task performance issues, evident in disrupted gait. Dual tasks impose an increased mental workload, defined as the resources dedicated to correctly executing an activity. In situations requiring cognitive effort, such as pedestrian decision making, excessive mental workload may heighten the likelihood of errors. Neurophysiological techniques can assess the impact of cognitively demanding situations on the brain mechanisms involved in task execution [5,6].

1.1. Virtual Reality for Pedestrian Safety

Real-world traffic studies focusing on pedestrian behavior are fraught with challenges, including the difficulty of creating and replicating specific traffic scenarios and the ethical issues associated with exposing participants to potentially hazardous situations. Virtual reality (VR) presents a compelling alternative to address these challenges in traffic safety research. Authors have already successfully developed and tested a VR simulator to study VRU reactions when facing potential collision situations [7,8]. VR enables the creation of realistic pedestrian simulators, allowing for the meticulous design of environments reflecting real-world conditions. One of the primary goals is to induce a sense of presence in users, making them experience both place and plausibility illusion [9]. These simulators ensure uniformity and repeatability in experimental setups across various sessions and enable precise monitoring and recording of participants’ movements and reactions for comprehensive data analysis. Additionally, virtual environment applications may foster the inclusion and recruitment of larger participant populations. For all these reasons, VR-based simulators have become an invaluable resource for studying and understanding the behaviors of VRUs in diverse traffic contexts by providing safe and immersive environments from the pedestrian’s perspective (e.g., see [10,11,12,13,14] for more detailed reviews).
A key challenge in virtual environment studies is assessing how well virtual observations of human behavior, physiological reactions, and psychological conditions mirror real-world experiences. Evidence indicates that VR simulation data may only partially generalize to real-life behaviors, with potential discrepancies in the magnitude and sensitivity of observed effects [14]. This raises important considerations for the validity of VR in pedestrian safety research, including research objectives, methodologies, and technical setups. One study comparing pedestrian behavior in real and virtual settings found minimal differences except in vehicle speed estimation and user presence measurement, suggesting VR’s potential accuracy in replicating real-world tasks [15]. Similarly, research on pedestrian route choice showed consistent preferences for less crowded paths in both environments, further validating VR’s applicability in behavioral studies [16]. Another study aligned VR-crossing speeds with real-world standards (~1.07 m/s, as suggested in [17]) while noting demographic variations in crossing speed, mirroring findings from observational research [18]. Lastly, comparing pedestrian reactions to vehicles in VR and reality revealed similar perceptions of danger and distance. However, VR participants showed less concern for lateral space around vehicles and pedestrians, highlighting nuances in spatial awareness in VR [19].
Additionally, some physical and technological limitations can limit VR settings. For example, restrictions on the field of view and peripherical vision when wearing Head-Mounted Displays (HMD) [20], the underestimation of egocentric depth perception [21], and some sensitivity to cybersickness for certain individuals [22] may affect the behavioral validity of the simulations.
Integrating Electroencephalogram (EEG) technologies with VR simulations can significantly enrich the analysis of pedestrian behavior research. While VR and EEG have been independently applied to study pedestrian behaviors and cognitive states, there is limited evidence of their combined use in this field. For example, EEG signals have been analyzed to understand pedestrian cognitive reactions to oncoming vehicles at crosswalks, revealing that active vehicle lighting reduces confusion and enhances safety during crossings, especially in poorly lit areas [23]. VR environments have also been instrumental in investigating how pedestrians respond to their surroundings, including other pedestrians and vehicles [19]. EEG measurements within these VR studies have provided nuanced insights into pedestrian reactions. Another study utilized EEG to assess behavioral and physiological responses in an immersive wayfinding context, demonstrating EEG’s effectiveness in revealing pedestrian navigation behavior in various urban environments [24]. The scarcity of research combining VR and EEG might be attributed to challenges in reconciling the differences in perception and behavior between real and virtual settings and understanding the effects of multitasking on situational awareness. Addressing these challenges would significantly contribute to advancements in psychophysiological experimentation.

1.2. Neurophysiology Approaches for Pedestrian Safety

Dual tasks involving motor and attentional activities with high cognitive demand induce cognitive–motor interference (CMI), thereby impairing behavioral performance (the number of errors, walking speed, or response times) and altering neural activity patterns associated with attention and perception [24,25] One of the most employed paradigms to create situations of high dual demand combine walking with a cognitive task of visual Oddball or target stimulus detection. In these paradigms, subjects are required to identify the appearance of a target stimulus (the oddball) while inhibiting their response to a distractor or irrelevant stimulus [24,25,26,27,28,29]. During this attentional activity, a P3 Event-Related Potential (ERP) component is obtained, which can be observed as a positive deflection in the EEG signal occurring in medial areas of the cerebral cortex approximately 300 ms after the onset of a relevant event. Given the distributed nature of neural events underlying P3 generation across callosal fiber tracts from the frontal to the parietal lobes [30], attention-related electrical activity within these cortical regions is typically assessed using electrodes positioned at FZ, CZ, and PZ sites on the midline scalp. Therefore, the observation of the P3 component during oddball tasks is associated with effective attentional processing toward a relevant event [27,28]. In dual tasks (oddball and walking), CMI has been observed, correlating with a reduction in the amplitude of P3 (in terms of μV) during tasks performed in motion compared to the same task in a static condition. This decrease in amplitude may be interpreted as an indication of the heightened utilization of cognitive resources required for the efficient execution of the attentional task [25,28].
Concerning attentional efficiency, high cognitive demand tasks have been observed to modulate the response anticipation process [31]. The ability to anticipate relevant stimuli, such as cars, pedestrians, or potential road safety hazards, is linked to the Contingent Negative Variation (CNV) component. The CNV ERP component is elicited following the presentation of a signal stimulus, indicating the proximity of another event requiring participant response [32,33]. This component is associated with decision-making and cognitive–motor preparation for response execution. Neural activity associated with this component is mainly observed in the frontal cortex, spanning the supplementary motor and cingulate cortex [34]. Therefore, electrical activity captured by electrodes situated in adjacent mid-frontal areas is typically selected for CNV amplitude analysis. Theoretically, CNVcomprises two elements: an Early-CNV (raging approximately from around 400 to 2000 ms after signal stimulus onset), associated with the characteristics of the cue stimulus, attentional orientation, and the onset of temporal encoding, and a Late-CNV (from around 1500 ms after signal stimulus onset until the behavioral response), which is linked to decision-making and preparatory processes in anticipation of the stimulus arrival [33,34,35,36]. Examined through time-to-arrival (TTA) tasks, where a moving object disappears, and the observer must respond when estimating its arrival at a specific position, this ERP type has been studied in VR safe driving paradigms. The reduction in CNV amplitude in these studies correlates with poorer anticipatory behavior, suggesting its potential as a predictive marker for risky driving behaviors [32,34].

1.3. Integrating VR and EEG for Pedestrian Safety

In conclusion, the suitability of VR to increase cognitive demand in safe pedestrian conditions could be substantial. However, psychophysiological recording poses technical conditions that need to be considered to ensure that both VR and EEG recording methodologies meet technical standards and can reflect the increased cognitive load (resulting in CMI). This would substantiate their efficacy for psychophysiological study paradigms examining pedestrian behavior in motion. Therefore, the main goal of this study is to verify the utility of VR pedestrian scenarios within the psychophysiological and behavioral assessment framework. In this context, the adopted procedural methodology is expected to elicit the relevant evoked potentials within the EEG recordings. Furthermore, it is expected that both objective and subjective measures associated with VR, such as presence and cognitive load, will demonstrate levels of immersion in the VR trials that are as realistic as possible. In this case, the levels of cognitive demand anticipated in VR would be akin to those experienced in actual environments.
There is limited evidence to date regarding investigating this factor concerning pedestrians’ behavioral changes in various potentially hazardous traffic situations. Therefore, the neurophysiological and behavioral explorations of VRUs in VR during diverse pedestrian behavior scenarios constitute a primary novelty in this proposal.
This paper is structured as follows: Section 2 offers an in-depth overview of the experimental protocol used to examine pedestrian behavior, including a detailed account of the custom VR application created for this purpose and the technological setup used in volunteer experiments. Section 3 focuses on the analytical methods applied to EEG data and the subjective questionnaires used to evaluate both objective and subjective aspects of behavioral responses. Section 4 delves into interpreting the study’s preliminary findings, highlighting potential enhancements to the methodological protocol for future research. Finally, Section 5 discusses the proposed methodology’s main limitations and shortcomings, along with some critical issues from a technological and development standpoint.
The reader is referred to the table of acronyms in Appendix A (Table A1) for a detailed explanation of the acronyms used throughout this document.

2. Materials and Methods

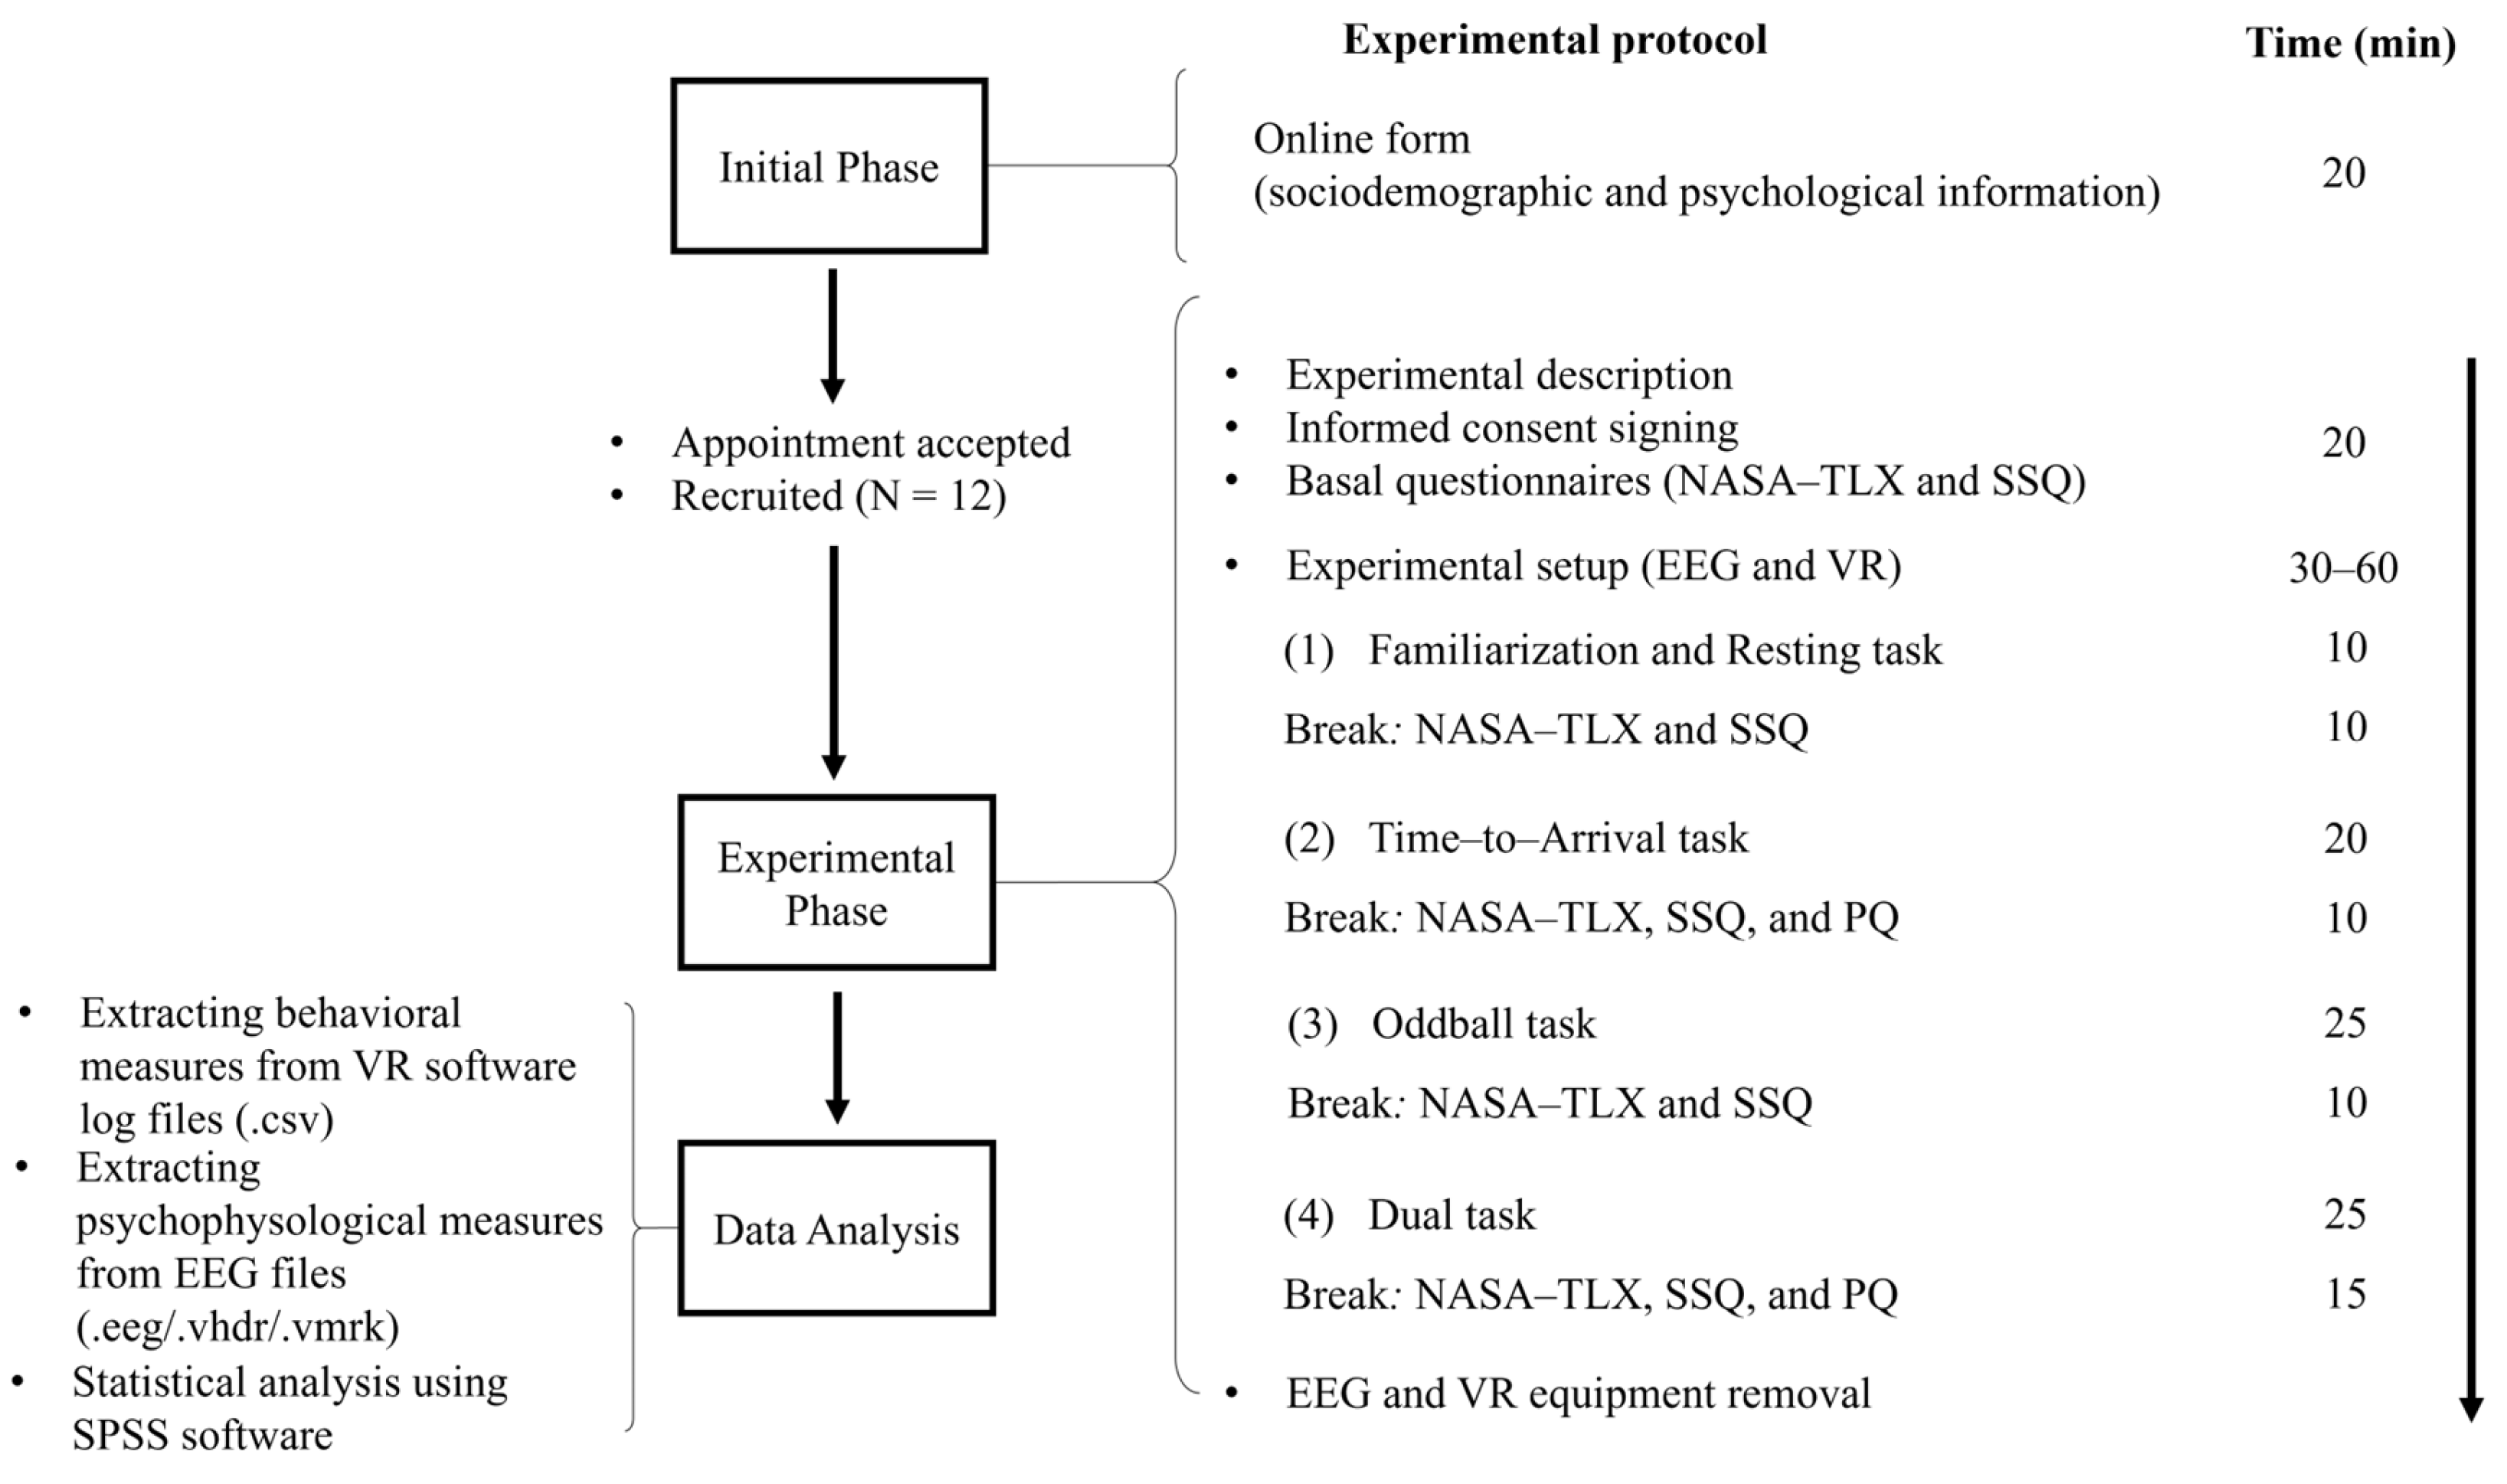
2.1. Study Design and Experimental Protocol

The experimental process was conducted in two distinct phases.
Figure 1 presents a graphical representation of the protocol followed. The study utilized a within-subject repeated measures design across four experimental tasks unfolded within a simulated urban setting in a virtual reality environment.
In the initial phase, participants completed an online form to provide sociodemographic and psychological information before they visited the laboratory. An in-person session at the Universidad Camilo José Cela campus in Madrid followed this phase. During this session, the research staff verified the information previously submitted online. Before participating in the trial, each volunteer signed their informed consent.
The pedestrian tasks within the virtual environment were executed in a fixed sequence, consisting of (1) an initial familiarization and resting task, (2) a time-to-arrival task, (3) a bi-modal Oddball task with both visual and auditory stimuli, and (4) a Dual task that combined the bi-modal Oddball task with the action of crossing a pedestrian crosswalk. These tasks and the related VR-based scenarios are thoroughly described in Section 2.3 and Section 2.4. A spacious and unobstructed area measuring 8 m in length and 3.4 m in width was prepared for the experiments.
This study utilized the NASA Task Load Index (NASA-TLX, ref. [37]) and the Simulator Sickness Questionnaire (SSQ, ref. [38]) to assess mental workload and cybersickness, respectively. These assessments were conducted at the beginning of the virtual reality environment activities and immediately after completing each task mentioned above. Additionally, the sense of presence within the VR environment was evaluated using the Presence Questionnaire (PQ, ref. [39]), with assessments following the completion of the second task (TTA) and at the end of the entire experimental procedure. More details on how these assessments were performed are outlined in Section 2.5.
The experimental phase was expected to last around three hours for each volunteer. Initially, 20 min was dedicated to explaining the experiment, obtaining informed consent, and administering the SSQ and NASA-TLX questionnaires to gather baseline measures. The following 30 to 60 min involved the experimenter fitting the EEG cap onto the participant’s head. This process included accurately placing electrodes at specific sites, ensuring their impedance was correctly measured and adjusted, and fitting the VR headset over the EEG cap (please refer to Figure A1 in Appendix B for a visual guide and Section 2.2 for technical equipment details). Following this setup, participants engaged in VR-based behavioural tasks for approximately 90 to 120 min, including 10 min breaks after each task to allow rest; removal of the HMD; and completion of the PQ, SSQ, and NASA-TLX questionnaires as required.
A key consideration in designing this experimental methodology was to mitigate potential fatigue effects across tasks. Fatigue, characterized as a temporary decrease in functional efficiency due to mental exertion from a task, can adversely affect performance and increase the likelihood of errors. It poses a significant concern in experiments demanding consecutive trial repetitions, which is essential for accurate EEG signal interpretation. Although traditional fatigue-reduction strategies were not employed in this pilot study, tasks were deliberately ordered from those with lower to higher cognitive demands to manage fatigue. Additionally, the study’s design enables the assessment of potential fatigue effects through the mentioned questionnaires.

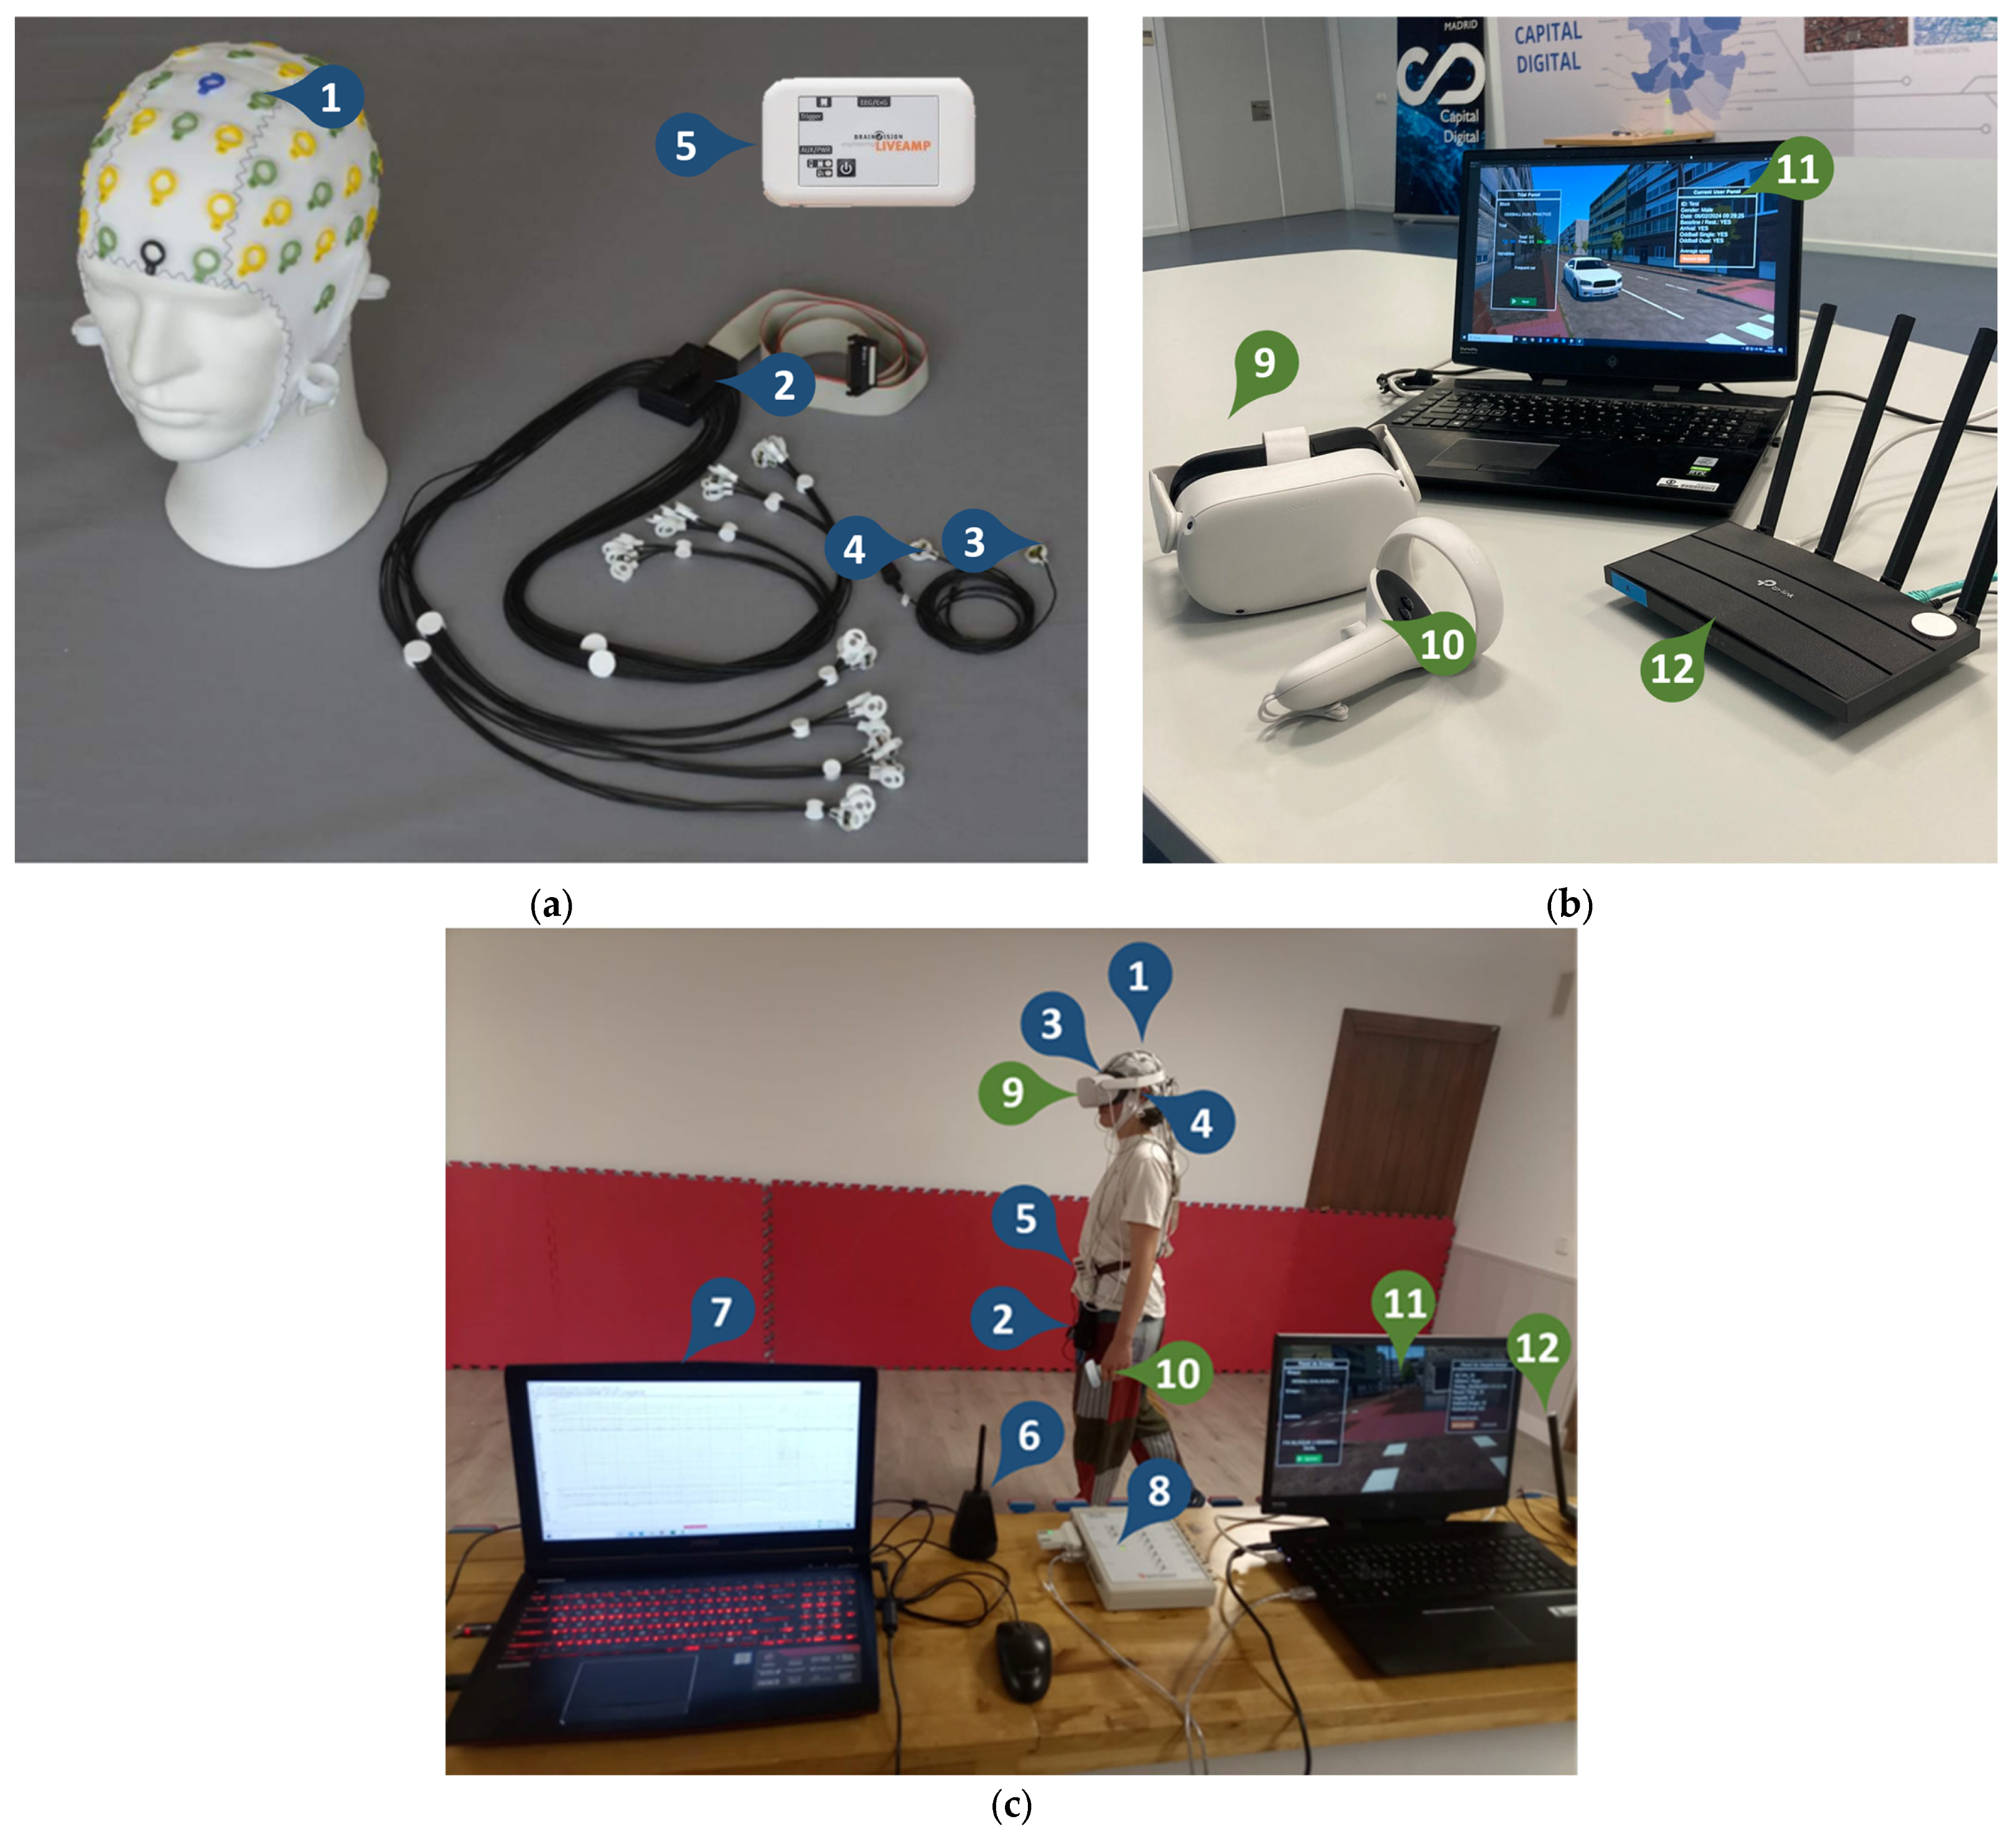
2.2. EEG and VR Equipment

The electroencephalogram data were collected using the equipment and software provided by Brain Products GmbH, Munich, Germany. The EEG cap, equipped with 32 wireless active electrodes, was carefully positioned on the participant’s head following the international 10/20 system layout (FP1, FZ, F3, F7, FT9, FC5, FC1, C3, T7, TP9, CP5, CP1, PZ, P3, P7, O1, OZ, O2, P4, P8, TP10, CP6, CP2, CZ, C4, T8, FT10, FC6, FC2, F4, F8, and FP2) and manually fine-tuned to ensure the EEG displayed accurate signals (see Figure A1 in Appendix B). The LiveAmp compact wireless EEG amplifier facilitated wireless signal transmission. Electrode impedances were consistently maintained below 10 kΩ to ensure signal quality. The online reference channel was positioned on the left mastoid, and the ground channel was placed at FPZ. Ocular movements were tracked horizontally and vertically with dedicated active electrodes (FT9 and FT10 for horizontal and vertical movements, respectively), which were strategically repositioned closer to the eyes. The brain electrical activity was recorded using Vision Recorder software at a 500 Hz sampling rate with a 50 Hz notch filter to reduce electrical noise. This setup enabled continuous monitoring of neural responses during tasks.
Participants also wore the Oculus Quest 2 wireless headset atop the EEG cap. This lightweight and portable HMD provides an optimal balance of visual quality, tracking accuracy, and ergonomic design, enhancing the immersive VR experience. The experimental protocol runs on a VR-ready workstation. Communication between the HMD and the PC was established via the Meta Quest Air Link over a dedicated Wi-Fi network, leveraging the total bandwidth and speed available for seamless data transfer. Furthermore, this setup allowed external supervision and monitoring during simulation sessions. The VR laptop also facilitated transmitting stimuli triggers to the EEG recording software, enabling precise signaling of specific events throughout the experiment. This integration enhanced the experimental protocol by ensuring accurate synchronization between the VR experiences and EEG data collection. A summary of the leading technical features of each piece of equipment can be seen in Figure 2 and outlined in Table 1.

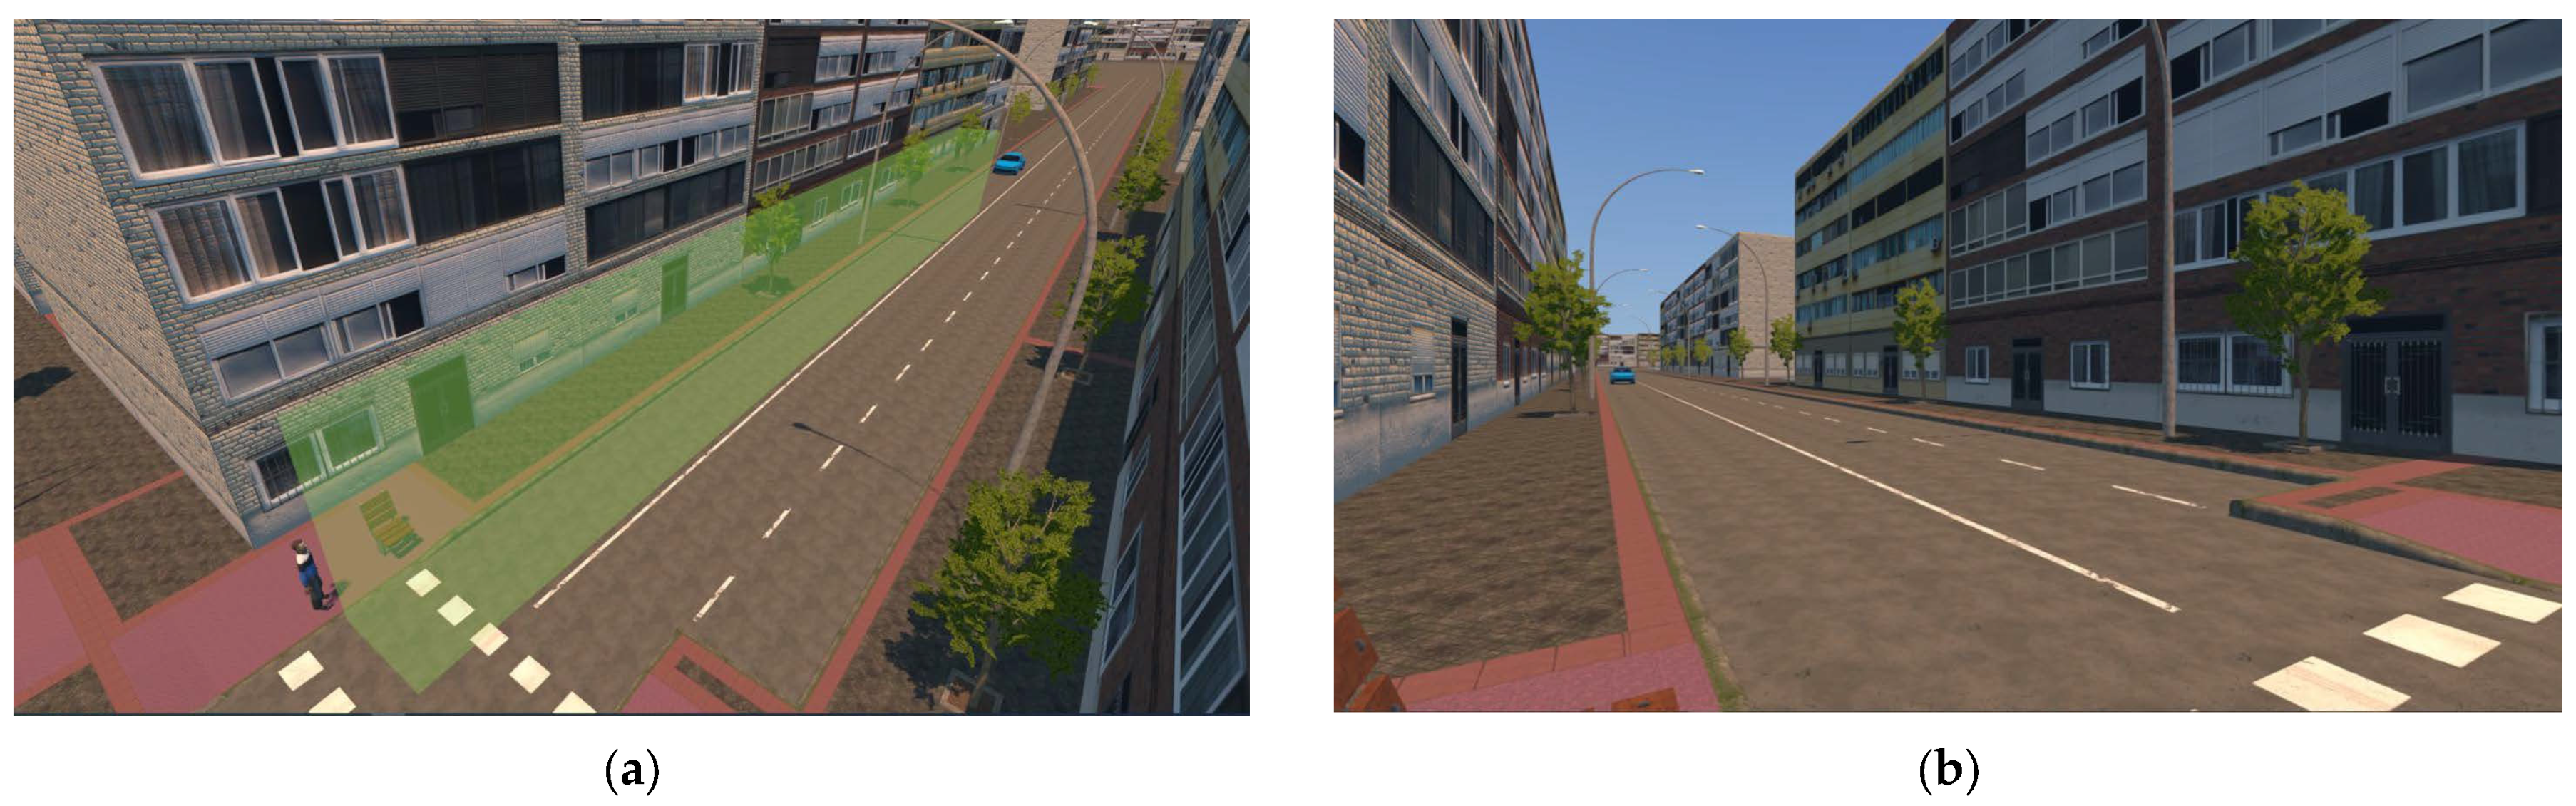
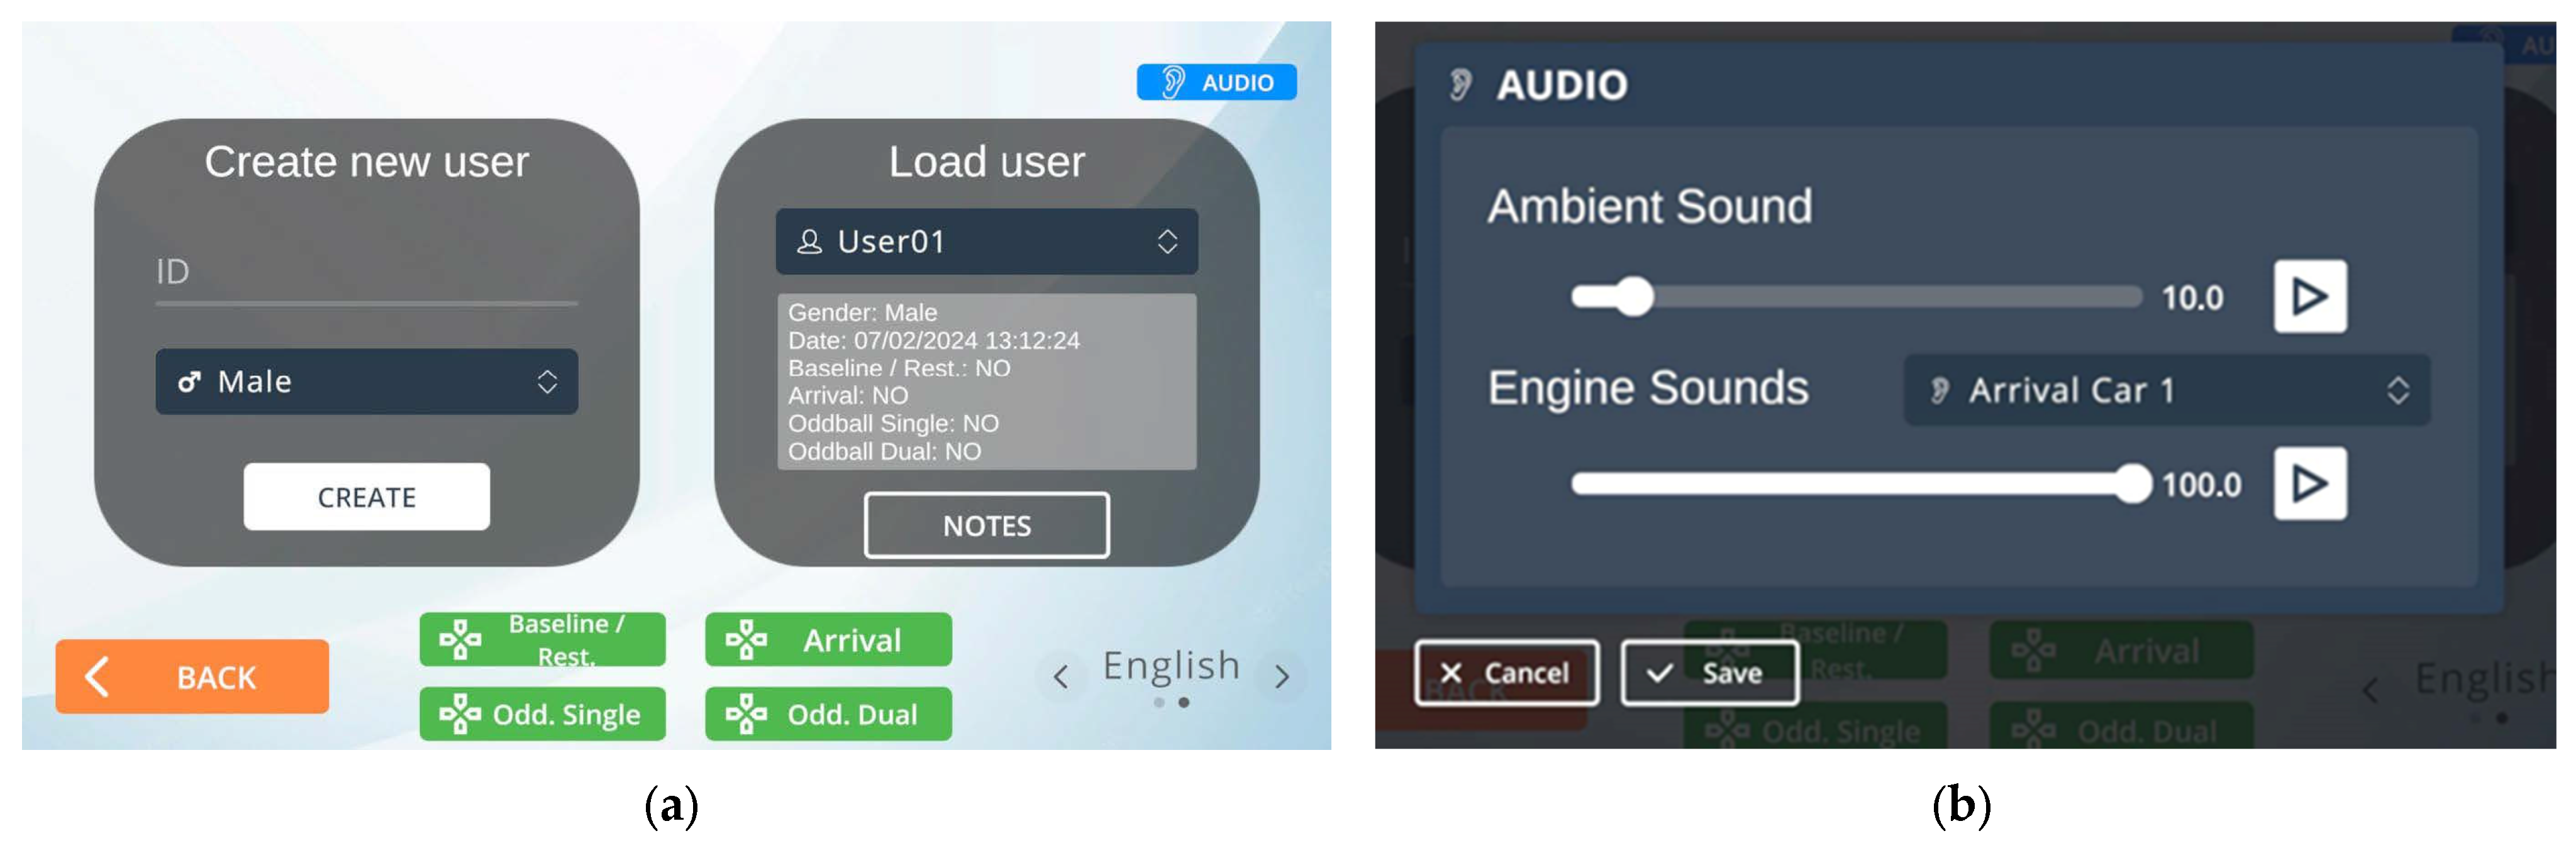
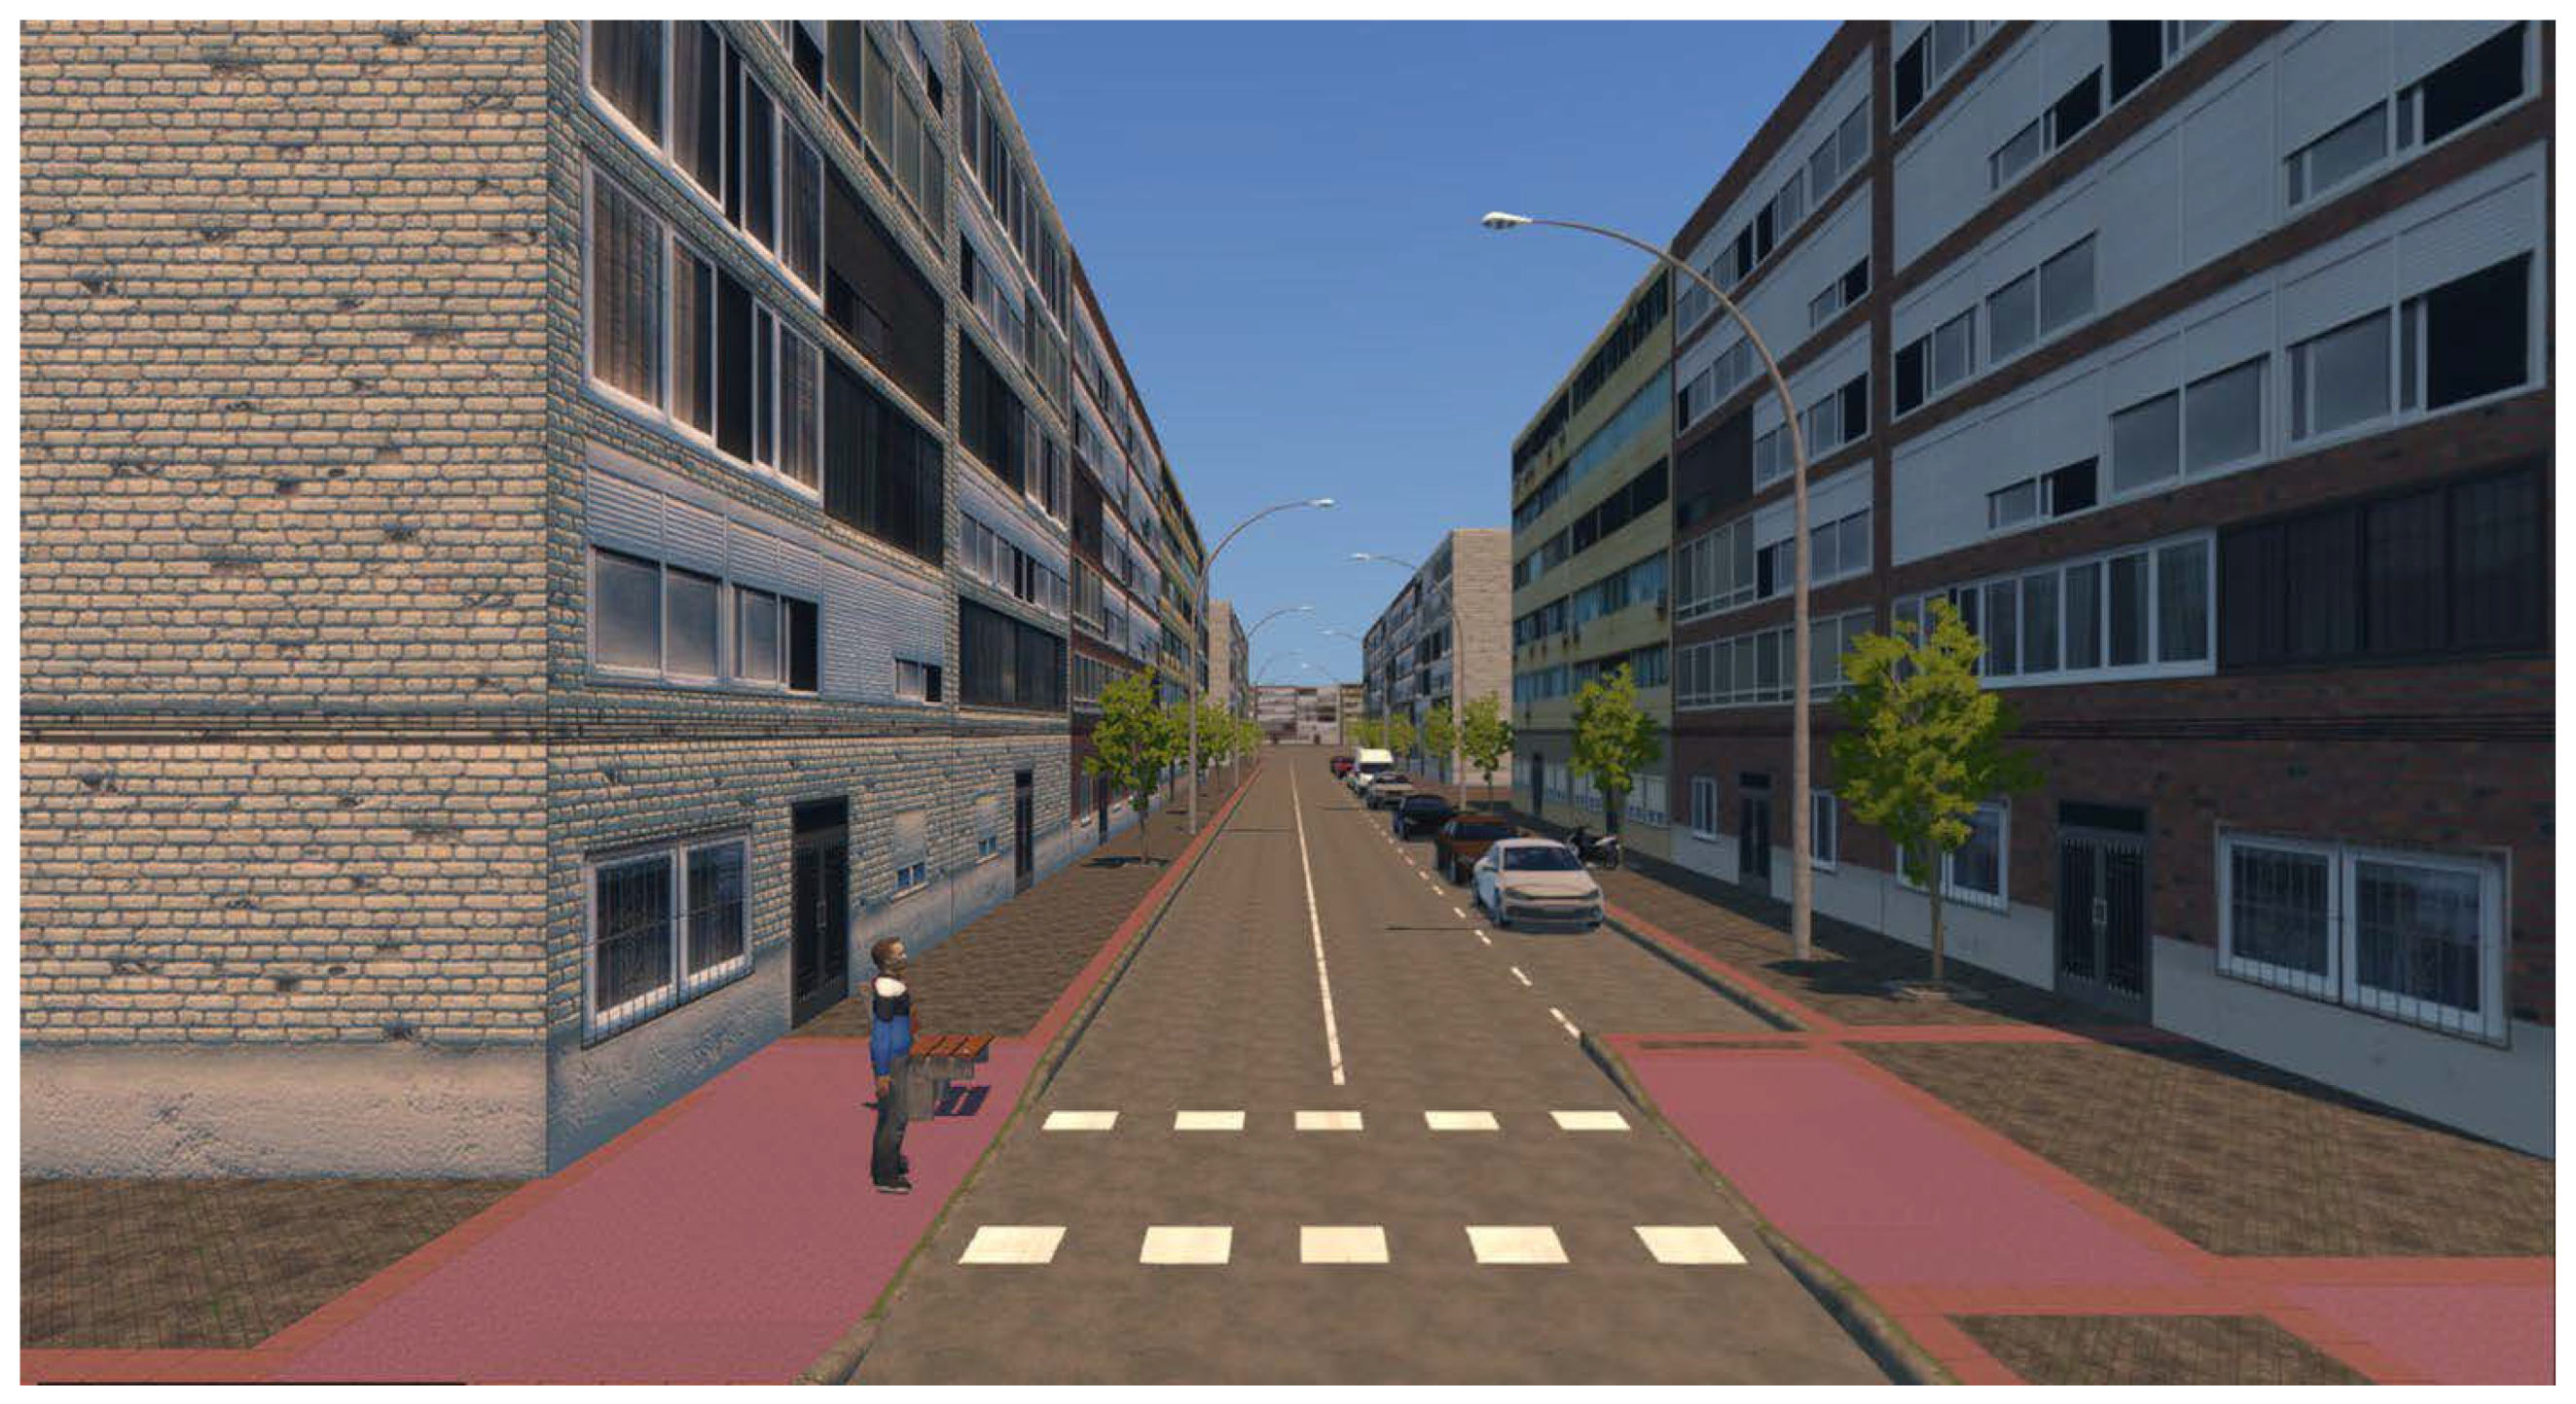
2.3. Virtual Reality Application

The VR application provides a flexible and rigorous environment to assist the behavioral study protocol outlined in Section 2.1, which has been developed using Unity’s latest LTS (Long-Term Support) version, specifically v2022.3.18.f1. Unity stands out as a robust and adaptable game development tool, empowering creators to design immersive and interactive experiences across various platforms, from mobile devices and consoles to PCs and VR environments. Notably, our implementation adheres to the OpenXR open API standard (https://registry.khronos.org/OpenXR/specs/1.0/html/xrspec.html (Last access: 5 April 2024)), designed to facilitate the seamless operation of applications across different VR platforms, eliminating the need for code rewriting for each specific device.
Before starting any experiment in one of the available virtual environments, an interface allows for registering a new user or loading one previously created for experiment resumption (see Figure 3). User profiles include data such as gender, creation date, and trial completion. Additionally, writing relevant notes about the ongoing experiment can prove helpful during analysis.
Through the same interface, it is possible to configure specific audio settings to limit the maximum intensity level of the sounds and ambient noise in the VR scenarios (see Figure 3). This limitation is crucial in EEG recordings to avoid potential distraction effects while capturing brain signals. The scenarios incorporate six unique audio sources. One captures environmental background noise at 35 dB, representing a city ambiance stripped of sharp sounds such as car horns or bird chirps. The remaining five have different car engine sounds, peaking at 80 dB. Of these, two engine sounds correspond to the various speeds analyzed in the time-to-arrival estimation task, and three are linked to the vehicles featured in the Oddball tasks. It is worth noting that the sound level at the output depends not solely on the sound source but also on the possible variations that may occur due to software limitations or headset headphones. To set a specific value, one would need to use a decibel meter at the headset’s output while adjusting the linear value set in the configuration panel. In our case, the experimental protocol anticipated a prior control before each trial, where we ensured that both the computer’s volume and that of the headsets were maintained at fixed and predetermined values.
Throughout the configuration steps, users wear their HMD and experience a virtual, blank scenario depicting the center and dimensions of the calibrated, obstacle-free play area (see Figure 4). They are allowed to move across this space to get acquainted with the virtual world. Should users approach any of the boundaries, a blue grid wall appears, visually signaling their proximity to the calibrated area’s limits. Moreover, a virtual bench occupies one corner, precisely mirroring the position of a physical chair within the room. This chair serves as a resting spot during a designated task within the experiment (see Section 2.4.1).
Upon completion of the configuration phase, the experimenter can initiate any of the four planned trials: familiarization and resting, time-to-arrival estimation, Oddball task, and dual task (see Section 2.4.1, Section 2.4.2, Section 2.4.3 and Section 2.4.4, respectively). By default, tasks are designed to be executed in any sequence and cannot be repeated upon completion. Upon finishing a task, its corresponding button becomes grayed out and not selectable. Nevertheless, a specific configuration file has been created to set up custom task sequencing or repeat specific tasks as needed. For this study, participants completed the tasks following the order specified in Section 2.1.
The developed scenario realistically portrays a typical urban crossroad in Madrid. It features a two-lane road accommodating bidirectional traffic flanked by pedestrian sidewalks, as shown in Figure 5. The scenario is composed only of static elements such as buildings, trees, parked vehicles, and benches (for use during rest periods), deliberately excluding dynamic components like moving pedestrians or vehicles to minimize distractions. Moving vehicles were introduced when the protocol for a correct task execution was required. The scene is set under sunny weather conditions to minimize the shadows cast by any urban elements on the asphalt. The light’s color temperature is set at 4500 K, slightly warmer than Unity’s default temperature of 6570 K, to achieve a better sense of dominance of the virtual environment [40].
The realism of the scenario is enhanced by employing textures from actual urban elements, with all components rendered without elaborate visual effects (e.g., reflections, wind effects, and animations) to mitigate extraneous visual stimuli that could interfere with EEG signal integrity.
Participants experienced this scenario through HMDs. Additionally, a remote controller was supplied to facilitate their interaction within the virtual environment. Experimenters monitored the virtual environment in real time via a laptop/PC, which displayed a specific user interface (see Figure 6). This interface enables researchers to oversee participant activities, offering updates on trial progress, including tracking progress, the count of remaining trials, participant response times (where relevant), and notifications of significant events like the appearance or disappearance of elements within the scene.
During these sessions, the application triggered specific signals in the USB port of the VR laptop, which is connected to the EEG laptop tasked with recording brain signals. In neurophysiology, a trigger refers to an external stimulus or event that initiates a specific physiological response or neural activity in the nervous system. The triggers sent by the application mark significant moments within the virtual environment, such as the beginning or conclusion of trials, changes in stimuli, or participant interactions via the controller. Each significant event was identified by a unique trigger label, playing a pivotal role in experimental protocols by facilitating precise control over the presentation and timing of stimuli. During each participant’s session, a dedicated log file captured precise information about the headset’s position and orientation. Data collection occurred at a frequency of 0.1 milliseconds, with timestamps recorded in the POSIX milliseconds format for accurate time referencing. Furthermore, trigger events were carefully documented in conjunction with the positional data. This comprehensive dataset facilitates the analysis of neural responses, allowing for a detailed investigation of brain activity under controlled experimental conditions. It also ensures the synchronization of brain activity data with the user’s positional information.

2.4. Pedestrian Performance Assessment Based on Behavioral Response

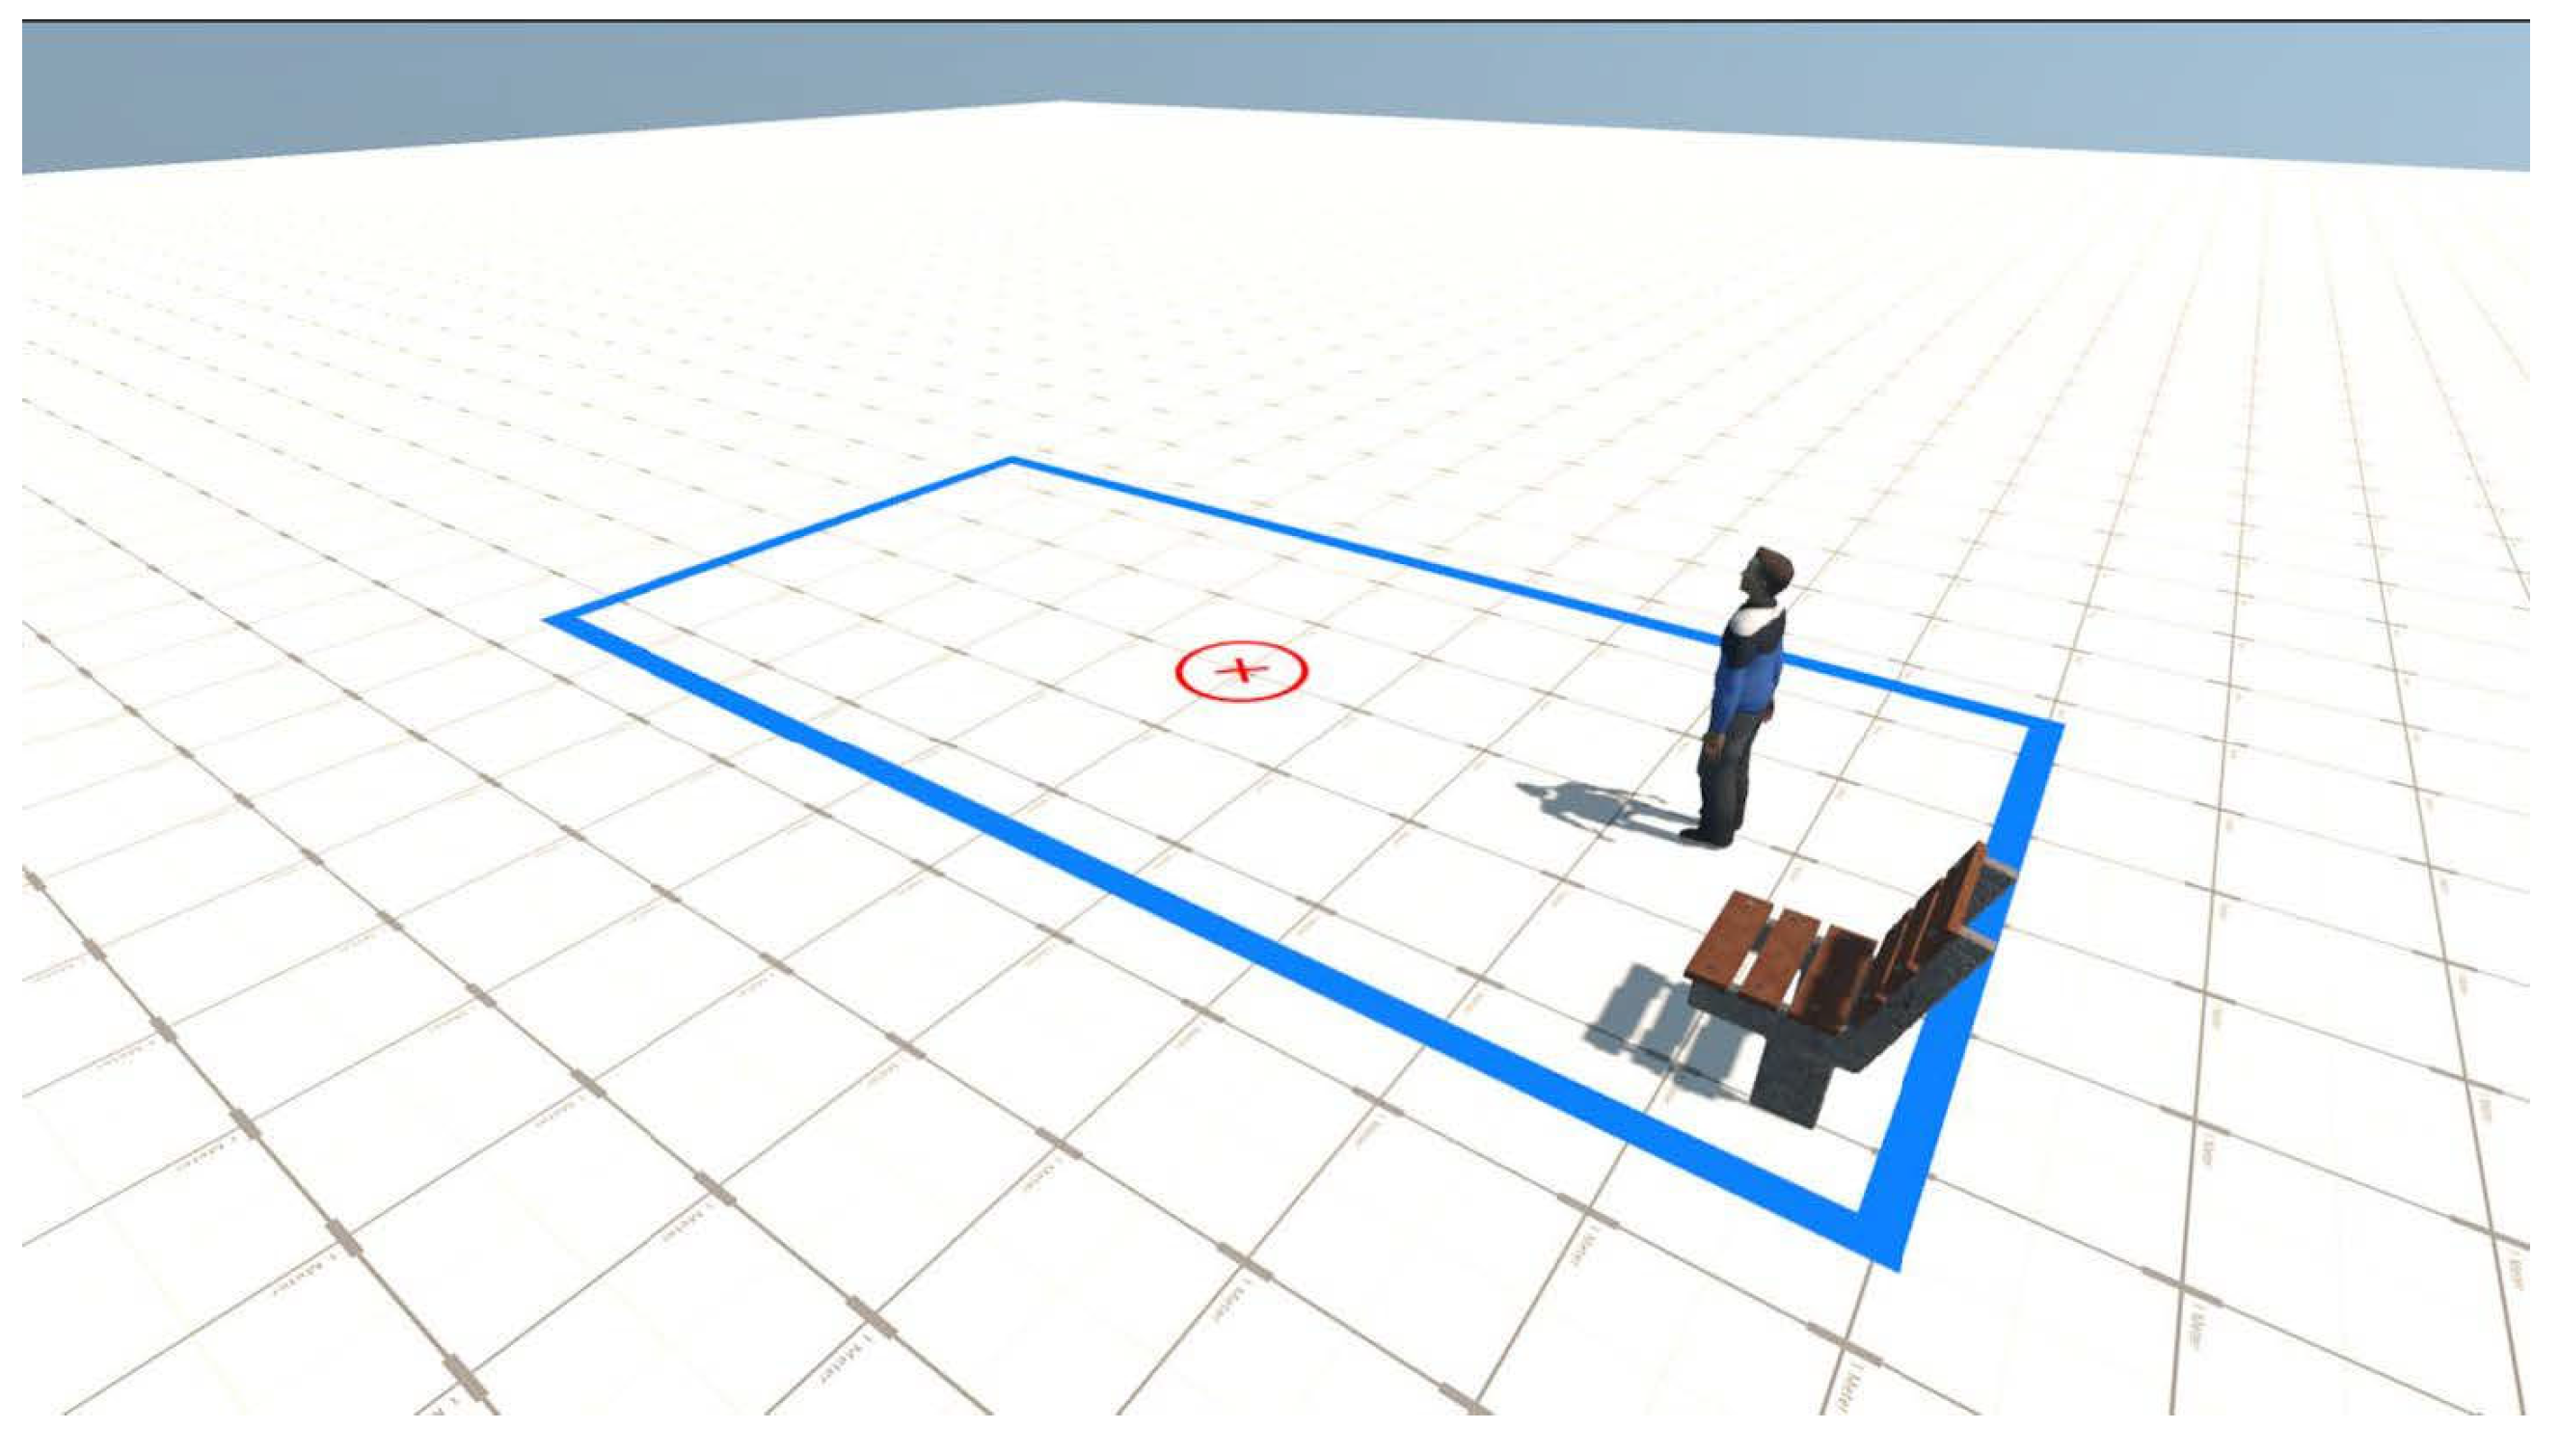
2.4.1. Familiarization and Resting

In this introductory task, users familiarized themselves with the 3D environment that is consistent across all experimental tasks. The task comprised three distinct stages: an initial familiarization phase, a resting phase with eyes closed, and a resting phase with eyes open. At the beginning of each stage, an information panel provided concise instructions pertinent to the upcoming phase to participants. Similar panels have been shown to users at the very beginning of each task.
The familiarization period with the virtual environment lasted for 3 min. As a preliminary step, each participant was invited to explore the virtual urban setting. This exploration aimed to facilitate familiarity with the environment and build confidence in navigating it freely. Participants were encouraged to move throughout the space, even to the extent of approaching the physical and virtual boundaries of the simulated environment.
Following this initial exploration, participants were instructed to locate and sit on a bench placed in a corner of both the virtual and physical environments. This step aimed to record their resting electrical brain activity. The procedure lasted for 4 min with eyes closed and 3 min with eyes open, during which participants were asked to focus on a specific point. The data collected during this phase served as a baseline, providing a reference point against which the data from subsequent tasks could be compared and analysed.

2.4.2. Time-to-Arrival (TTA) Estimation

The task required participants to predict the time-to-arrival of a car approaching from the left and vanishing at a predetermined location. The aim was to induce the participant to start the process of temporal encoding and cognitive and motor preparation to provide a correct response. At the beginning of each trial, participants stood at the edge of the roadway of a virtual pedestrian crosswalk. Using an interactive controller, participants registered their estimation of the vehicle’s arrival time (i.e., the moment when the front part of the car passed in front of them) by pressing a response trigger, thereby making their TTA guess. Following methodologies employing multimodal stimuli within VR environments to augment behavioral and brain responses [6,36,41,42,43,44], this task incorporated a vehicle as the primary bimodal stimulus, combining visual (a blue car whose RGB components are 0, 164, and 255) and auditory (engine sound at 35 dB) elements. At the moment the car disappeared, the corresponding stimuli also disappeared to allow users to make a “blind” estimation.
The experiment manipulates four distinct conditions by varying the vehicle’s speed and the timing of its disappearance (i.e., for how many seconds it remains invisible until it reaches the user), following previous studies [3,32,34,45,46]. Therefore, each of the two variables presents two discrete levels: speed at 30 km/h and 50 km/h and disappearance time of 3 s and 5 s. The levels of each variable have an equal probability (50%) of being drawn. Trials are configured to display one of the potential combinations of these variables, arranged in a randomized sequence. The duration of each trial ranged from 10 to 15 s, depending on the assigned speed condition. Notably, the vehicle did not become visible immediately upon reaching the participant’s position but reappeared 2 s later. The reason for this delay was to ensure that the psychophysiological measurement corresponds to the anticipation of the vehicle’s arrival rather than its reappearance. Furthermore, it allowed the recording of longer-duration evoked potentials without potential interference.
The cars generated for these trials appeared at a defined distance from the user ( d u ) and approached from the left at a constant speed ( v 0 ) . Assuming no drag from the asphalt, the total time ( t t ) for a car to reach the user was calculated using the following well-known motion equation:
t t = d u v 0
The distance that the car covered during its disappearance time t w is
l w = t w × v 0
Figure 7 depicts an actual example. A car created at 120 m, with an initial speed of 30 km/h (8.333 m/s), took 14.4 s to reach the user. Considering a disappearance time of 5 s, the distance that the car remained hidden was approximately 41.66 m. This distance is represented in the figure with the green transparent box. For this specific case, users had around 9.4 s before seeing the vehicle disappear.
Time-to-arrival estimation was determined by the time difference between the moment the now-obscured vehicle is believed to have passed the participant and the moment the participant presses the response button ( t u ) , which is
T T A = t u t w
According to the equation mentioned, positive TTA values suggest an overestimation of the arrival time, meaning the user pressed the trigger after the car reached their location. On the other hand, negative TTA values signify that the user anticipated the car’s arrival. For behavioral analysis, TTA estimates are recorded in a designated log file and categorized as Correct (if the user’s response falls within a +/− 1-s margin of the actual car’s arrival at the participant’s location) or Missed (if the response is delayed or not given by the end of the trial).
The TTA task started with an introductory practice block consisting of six trials (i.e., TTA estimations) to familiarize participants with the experimental procedure [3]. Upon completing this practice block, participants engaged in 2 experimental blocks, each comprising 30 trials (60 trials).
In this task, a total of nine triggers were transmitted to the EEG recording software: two triggers denoted the commencement and conclusion of each trial block; four triggers corresponded to the moments a car appeared or disappeared, differentiating each speed condition and disappearance time; one trigger captured the moment the user estimated the car’s arrival at their position; and the final two triggers were designated for the instances when the car reappeared post-crosswalk for each speed condition.

2.4.3. Oddball Task

In this experimental paradigm, participants were asked to press the controller button at the precise moment they perceived the onset of a target stimulus by differentiating it from both distractor and frequent stimuli. This approach was consistent with established bimodal Oddball paradigms [32,36,42]. Each trial exposed participants to a stimulus, specifically a car, distinguished by a unique combination of color and engine sound. The target vehicle featured a blue color (the same as the previous task), the distractor vehicle was green (RGB components: 0, 160, and 0), and the frequent vehicle was white (RGB components: 255, 255, and 255). Furthermore, a V6 gasoline engine sound was linked to the target vehicle; a sport engine (V8 gasoline engine) sound was associated with frequent stimulus, and the diesel engine sound was designated for the distractor vehicle. All these sounds were recorded at medium revolutions. These engine sounds were uniformly presented at a consistent volume level of 80 dB to ensure clear differentiation among the stimuli. Furthermore, these sounds were subjected to logarithmic attenuation for a more realistic sensation based on the distance between the user and the emission source.
The experimental structure included an initial practice block of 6 trials, followed by 2 experimental blocks, each comprising 80 trials. Within each block, the presentation of stimuli was randomized, featuring a distribution of 60% for the frequent stimulus, 20% for the distractor, and 20% for the target [42]. Each trial lasted up to 6 s (corresponding to the maximum time it took for the car to reach the user) with inter-trial intervals set to 3 s to mitigate the potential for anticipatory responses. A trial was considered complete once the inter-trial interval elapsed following the user’s response to optimize the experiment’s duration. Should there be no response from the participant, the simulation waited for the specified inter-trial period after the car had reached the user’s position. Participants were standing in the same position as in the previous task. The stimuli appeared on their left side at a fixed distance of 50 m and approached at 40 km/h.
Behavioral metrics were evaluated using measuring reaction times (RT), which span from the stimulus onset to 1 s afterward. Reaction time is defined as the duration between the appearance of a stimulus and the individual’s response to it. These responses were classified into three categories: Correct (where the user either responds to the target stimulus within ≤1 s or refrains from responding to a distractor or frequent stimulus), Incorrect (where the response is made to either a distractor or a frequent stimulus),or Missed (where there is no response to a target stimulus within ≤1 s). Additionally, broader results were obtained by calculating the Correct/Incorrect/Missed percentages for each participant and then determining the average of these percentages across the entire participant group (see Section 3.2.4).
For this task, a total of 10 distinct types of triggers were implemented: 2 were utilized to determine the start and end of each trial block, 3 were employed to identify the appearance of the stimulus car, 2 were dedicated to determining if the user’s response is correct or incorrect within one second following the stimulus appearance, 2 further triggers were used to assess the accuracy of the participants’ responses after one second following the stimulus appearance, and 1 trigger was designated to indicate the precise moment when the car arrived at the user’s position.

2.4.4. Dual Task

In this dual-task paradigm, participants positioned themselves at the pedestrian crosswalk, maintaining the same stance as in the prior tasks. Their task required identifying the target car, akin to the procedure in the Oddball task, while crossing the road without running or stopping midway [47,48,49]. This experimental setup preserved all characteristics of the preceding Oddball task, except the initial appearance distance and the stimulus speed, which were fixed at 100 m and 30 km/h, respectively. These values were selected to enhance pedestrians’ ability to make precise estimations of safe crossing intervals while ensuring sufficient time to traverse the street without risk. This task introduced the challenge of determining the ideal timing for introducing the stimulus car (consistently from the users’ left side to mimic traffic flow directions) to guarantee that participants could reliably detect each occurrence without disrupting the flow of the trials. The employed strategy involved determining when the participant started moving, with each road-crossing attempt treated as an individual trial. Accurately identifying this initiation moment was pivotal for analyzing EEG brain signals and assessing mental workload. To this end, the participant’s instantaneous speed perpendicular to the road’s direction was measured as they turned around following a successful crossing. Upon exceeding a pre-set threshold (i.e., 0.75 m/s), a specific trigger was dispatched to the EEG recorder, marking the start of the crossing action. Similarly, a trigger was generated once the participants completed the road-crossing action. The configuration of other triggers was consistent with those defined for the Oddball task (refer to Section 2.4.3).
In terms of behavioral analysis, reaction times in target detection were analyzed using the identical methodological approach utilized for the Oddball task.

2.5. Workload and Cybersickness

The subjective mental workload was evaluated utilizing the NASA Task Load Index (NASA-TLX) questionnaire [37] in its validated Spanish adaptation [50]. The implementation of this questionnaire necessitated an initial baseline measurement phase, during which the subject’s expected level of demand was established across the six evaluated dimensions: mental demand, physical demand, temporal demand, performance, effort, and frustration. Participants were asked to rate the perceived importance of each dimension on a scale from 0 to 20 immediately after completing their tasks. Detailed descriptions of each dimension were provided, guiding participants to compare them in pairs and identify which they perceived as contributing more significantly to their workload. In the original version, the mentioned dimensions and the overall scale exhibited an internal consistency level of 0.69, calculated with Cronbach’s alpha coefficient. The comprehensive mental workload score, calibrated on a scale up to 100, was derived by calculating the weighted mean of the aggregated scores across these six dimensions. Higher scores were interpreted as indicative of an elevated perception of mental workload.
Discomfort symptoms associated with VR, such as dizziness, nausea, and vertigo, were systematically assessed at designated intervals utilizing the Simulator Sickness Questionnaire (SSQ). This questionnaire gauges participant responses on a 4-point scale (0–3) for 16 symptoms of discomfort, which are organized into 3 categories: Oculomotor (O), Disorientation (D), and Nausea (N). In this case, Cronbach’s alpha score achieved a value of 0.87. Scores for each category were calculated by summing the responses for related symptoms, with elevated scores reflecting greater discomfort levels within each category. The questionnaire and formulas employed to assess participants’ discomfort are detailed in [38].
Moreover, the evaluation of presence, characterized by the level of immersion and engagement experienced within the VR environment, was conducted under the procedures outlined in the methods section. For this purpose, the Presence Questionnaire (PQ), consisting of 19 items, was deployed [39]. Each item is scored on a 7-point Likert scale (1 to 7), allowing the overall sense of presence to be determined by the cumulative score, where higher totals signify an enhanced sense of presence. Following the structure detailed in [51], the 19 items span 5 dimensions: Realism (7 items), Possibility to Act (4 items), Quality of Interface (3 items), Possibility to Examine (3 items), and Self-evaluation of Performance (2 items). When sound elements are integrated, as in our study, an additional dimension titled “Sounds” with 3 items is added. The PQ achieved a Cronbach’s alpha score of 0.84.

3. Results

3.1. Participants

Eligible participants included healthy adults of legal age without the presence of central nervous system pathologies and comorbidities with severe mental disorders, specifically excluding gait disorders.
Twelve healthy subjects with a mean age of 25 years (24.92 ± 6.91, 10 males and 2 females) were recruited. Recruitment was conducted through snowball sampling and advertisements posted on collaborating university campuses. All subjects gave informed consent for inclusion before participating in the study. The study was conducted following the Declaration of Helsinki. The project was submitted to and approved by the ethics committee of the University Camilo José Cela (22-CEI-VULNEREA).

3.2. Data Analysis

3.2.1. Software

The EEG data analysis was offline performed using BrainVision Analyzer Software (Brain Products, GmbH, München, Germany) and the EEGLAB Toolbox [52] running in MATLAB 2022a (Mathworks, Natick, MA, USA). Statistical analysis was performed using SPSS software version 24 (IBM Corp., Armonk, NY, USA).

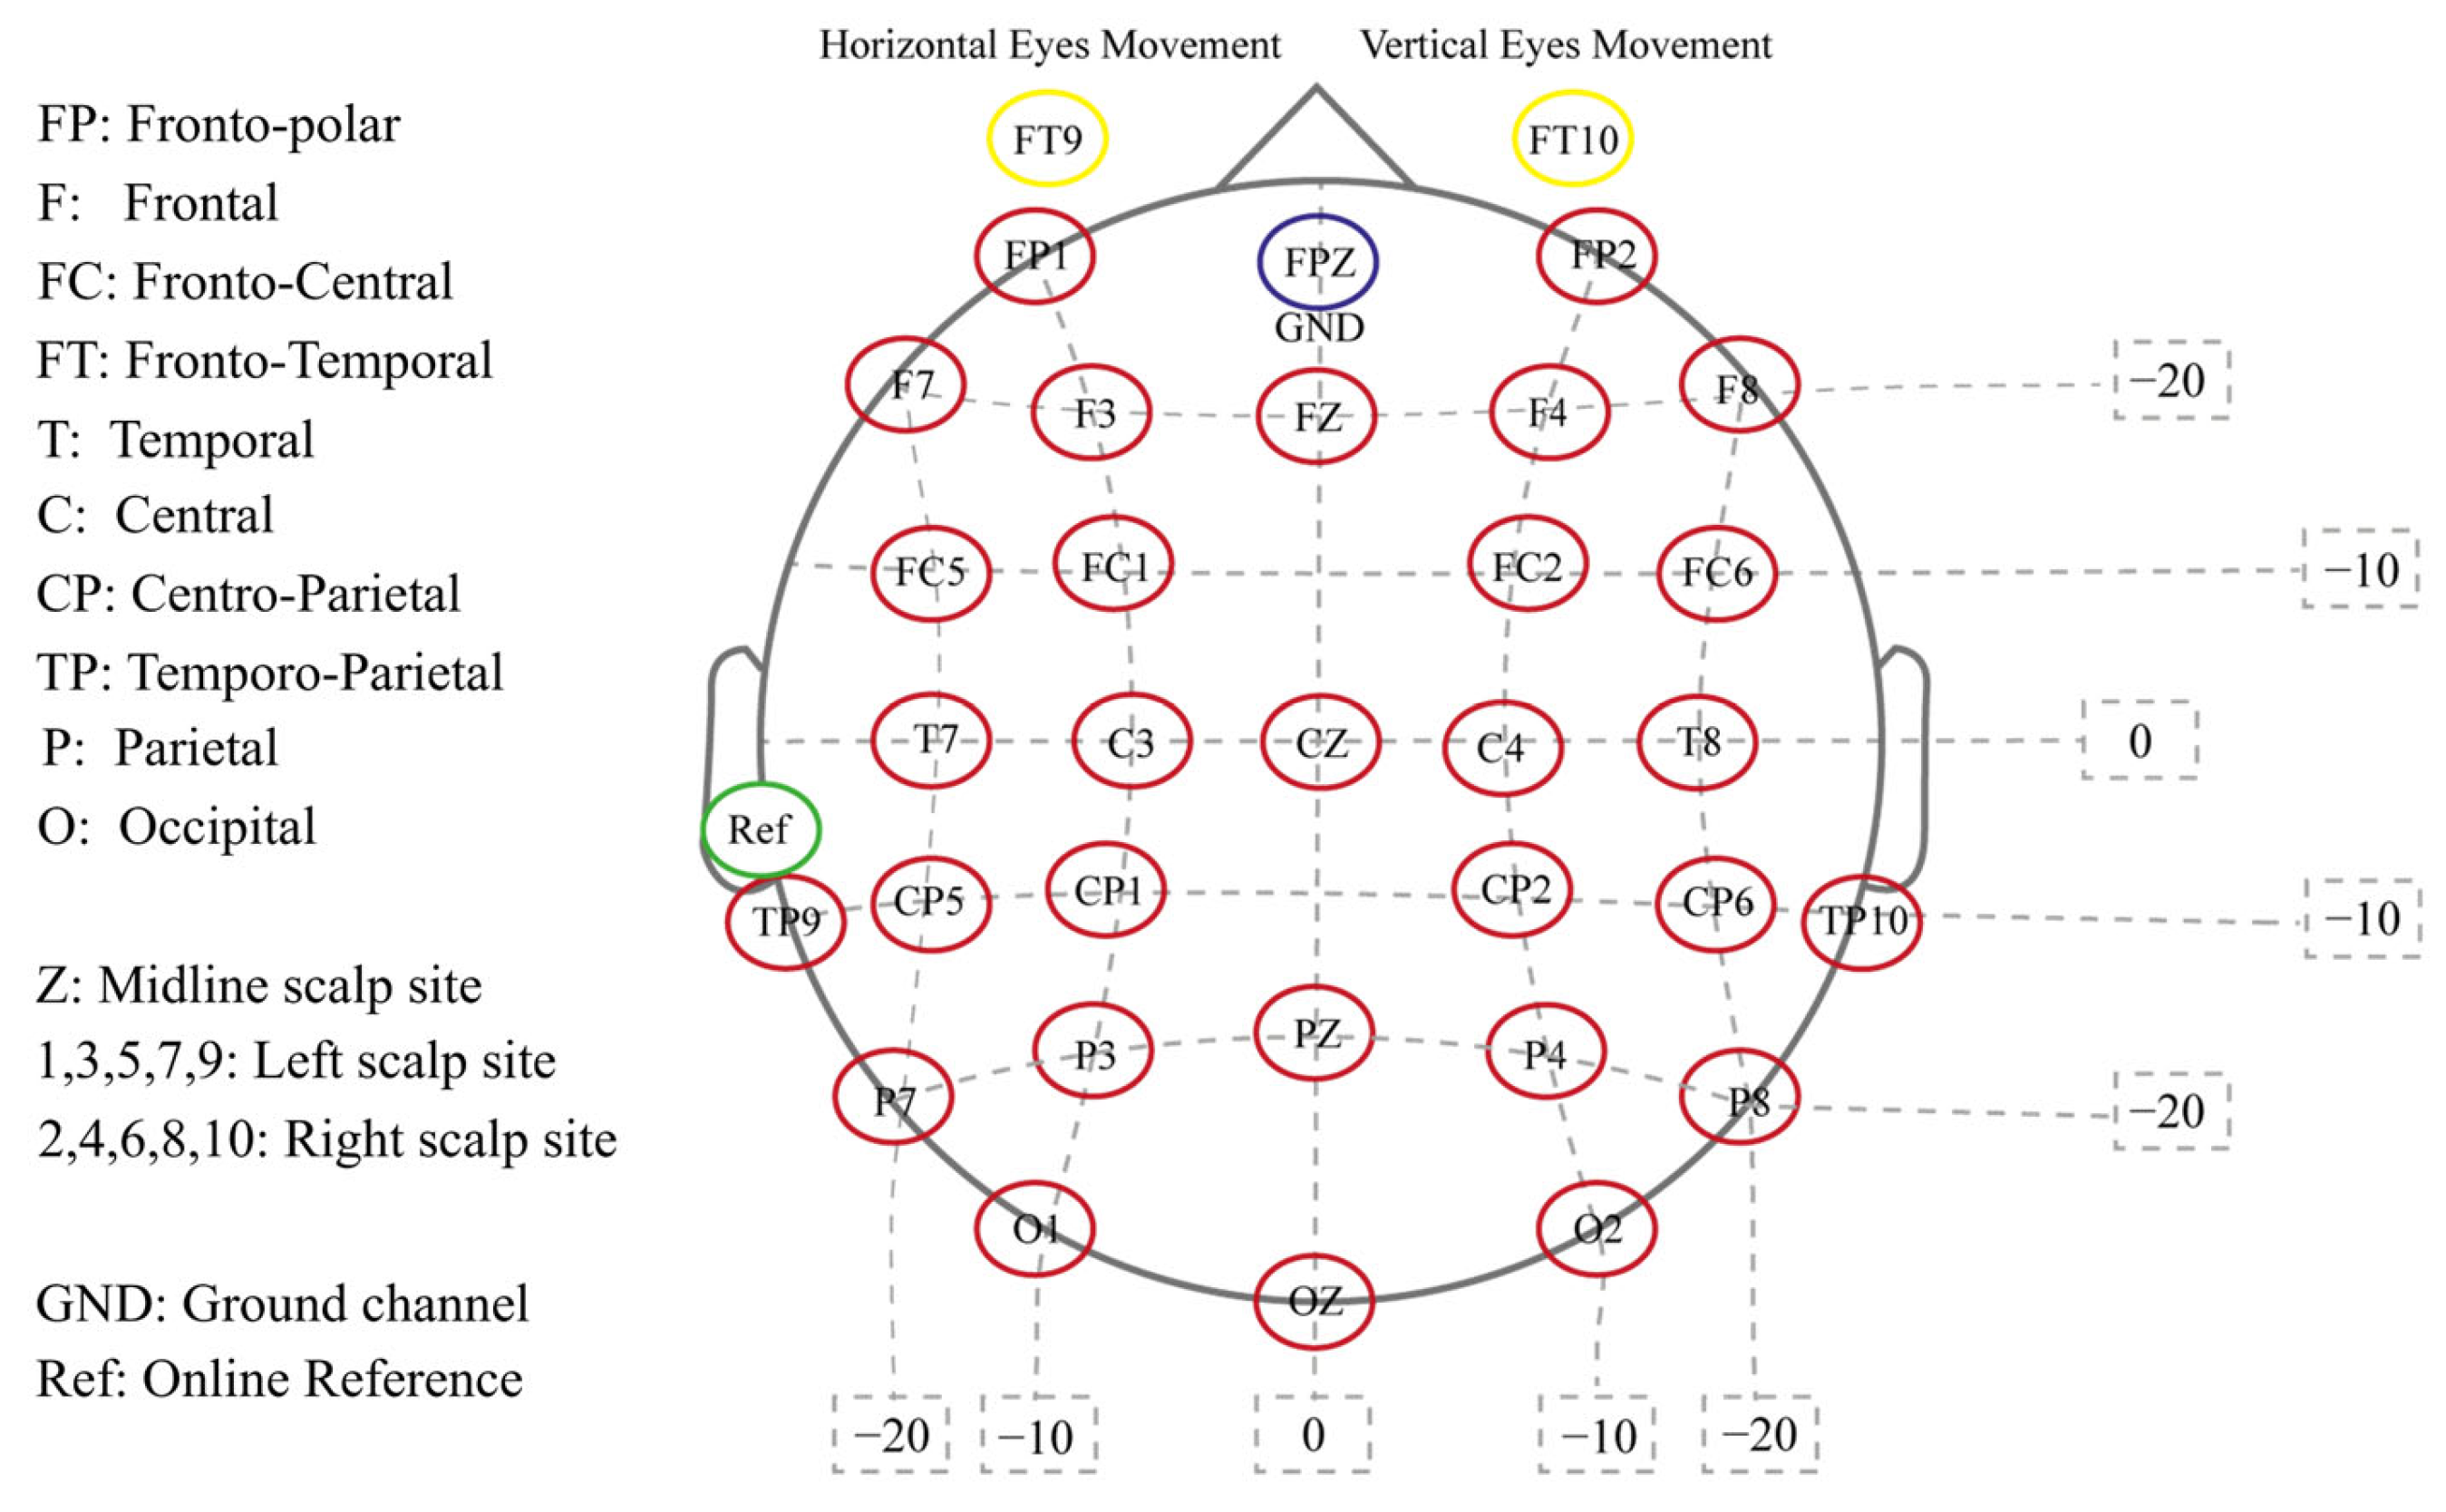
3.2.2. Selection of Electrode Signals

Electrodes placed along the scalp’s midline were selected to evaluate attentional processes (in Oddball and dual task paradigms), focusing on the P3 event-related potential (ERP). This includes electrodes located in midline cortical regions: FZ, CZ, and PZ. Furthermore, to assess cognitive processes related to time-to-arrival estimation, the CNV ERP component was analyzed at electrodes in fronto-medial scalp areas, specifically FZ, FC1, FC2, and CZ (see Figure A1).

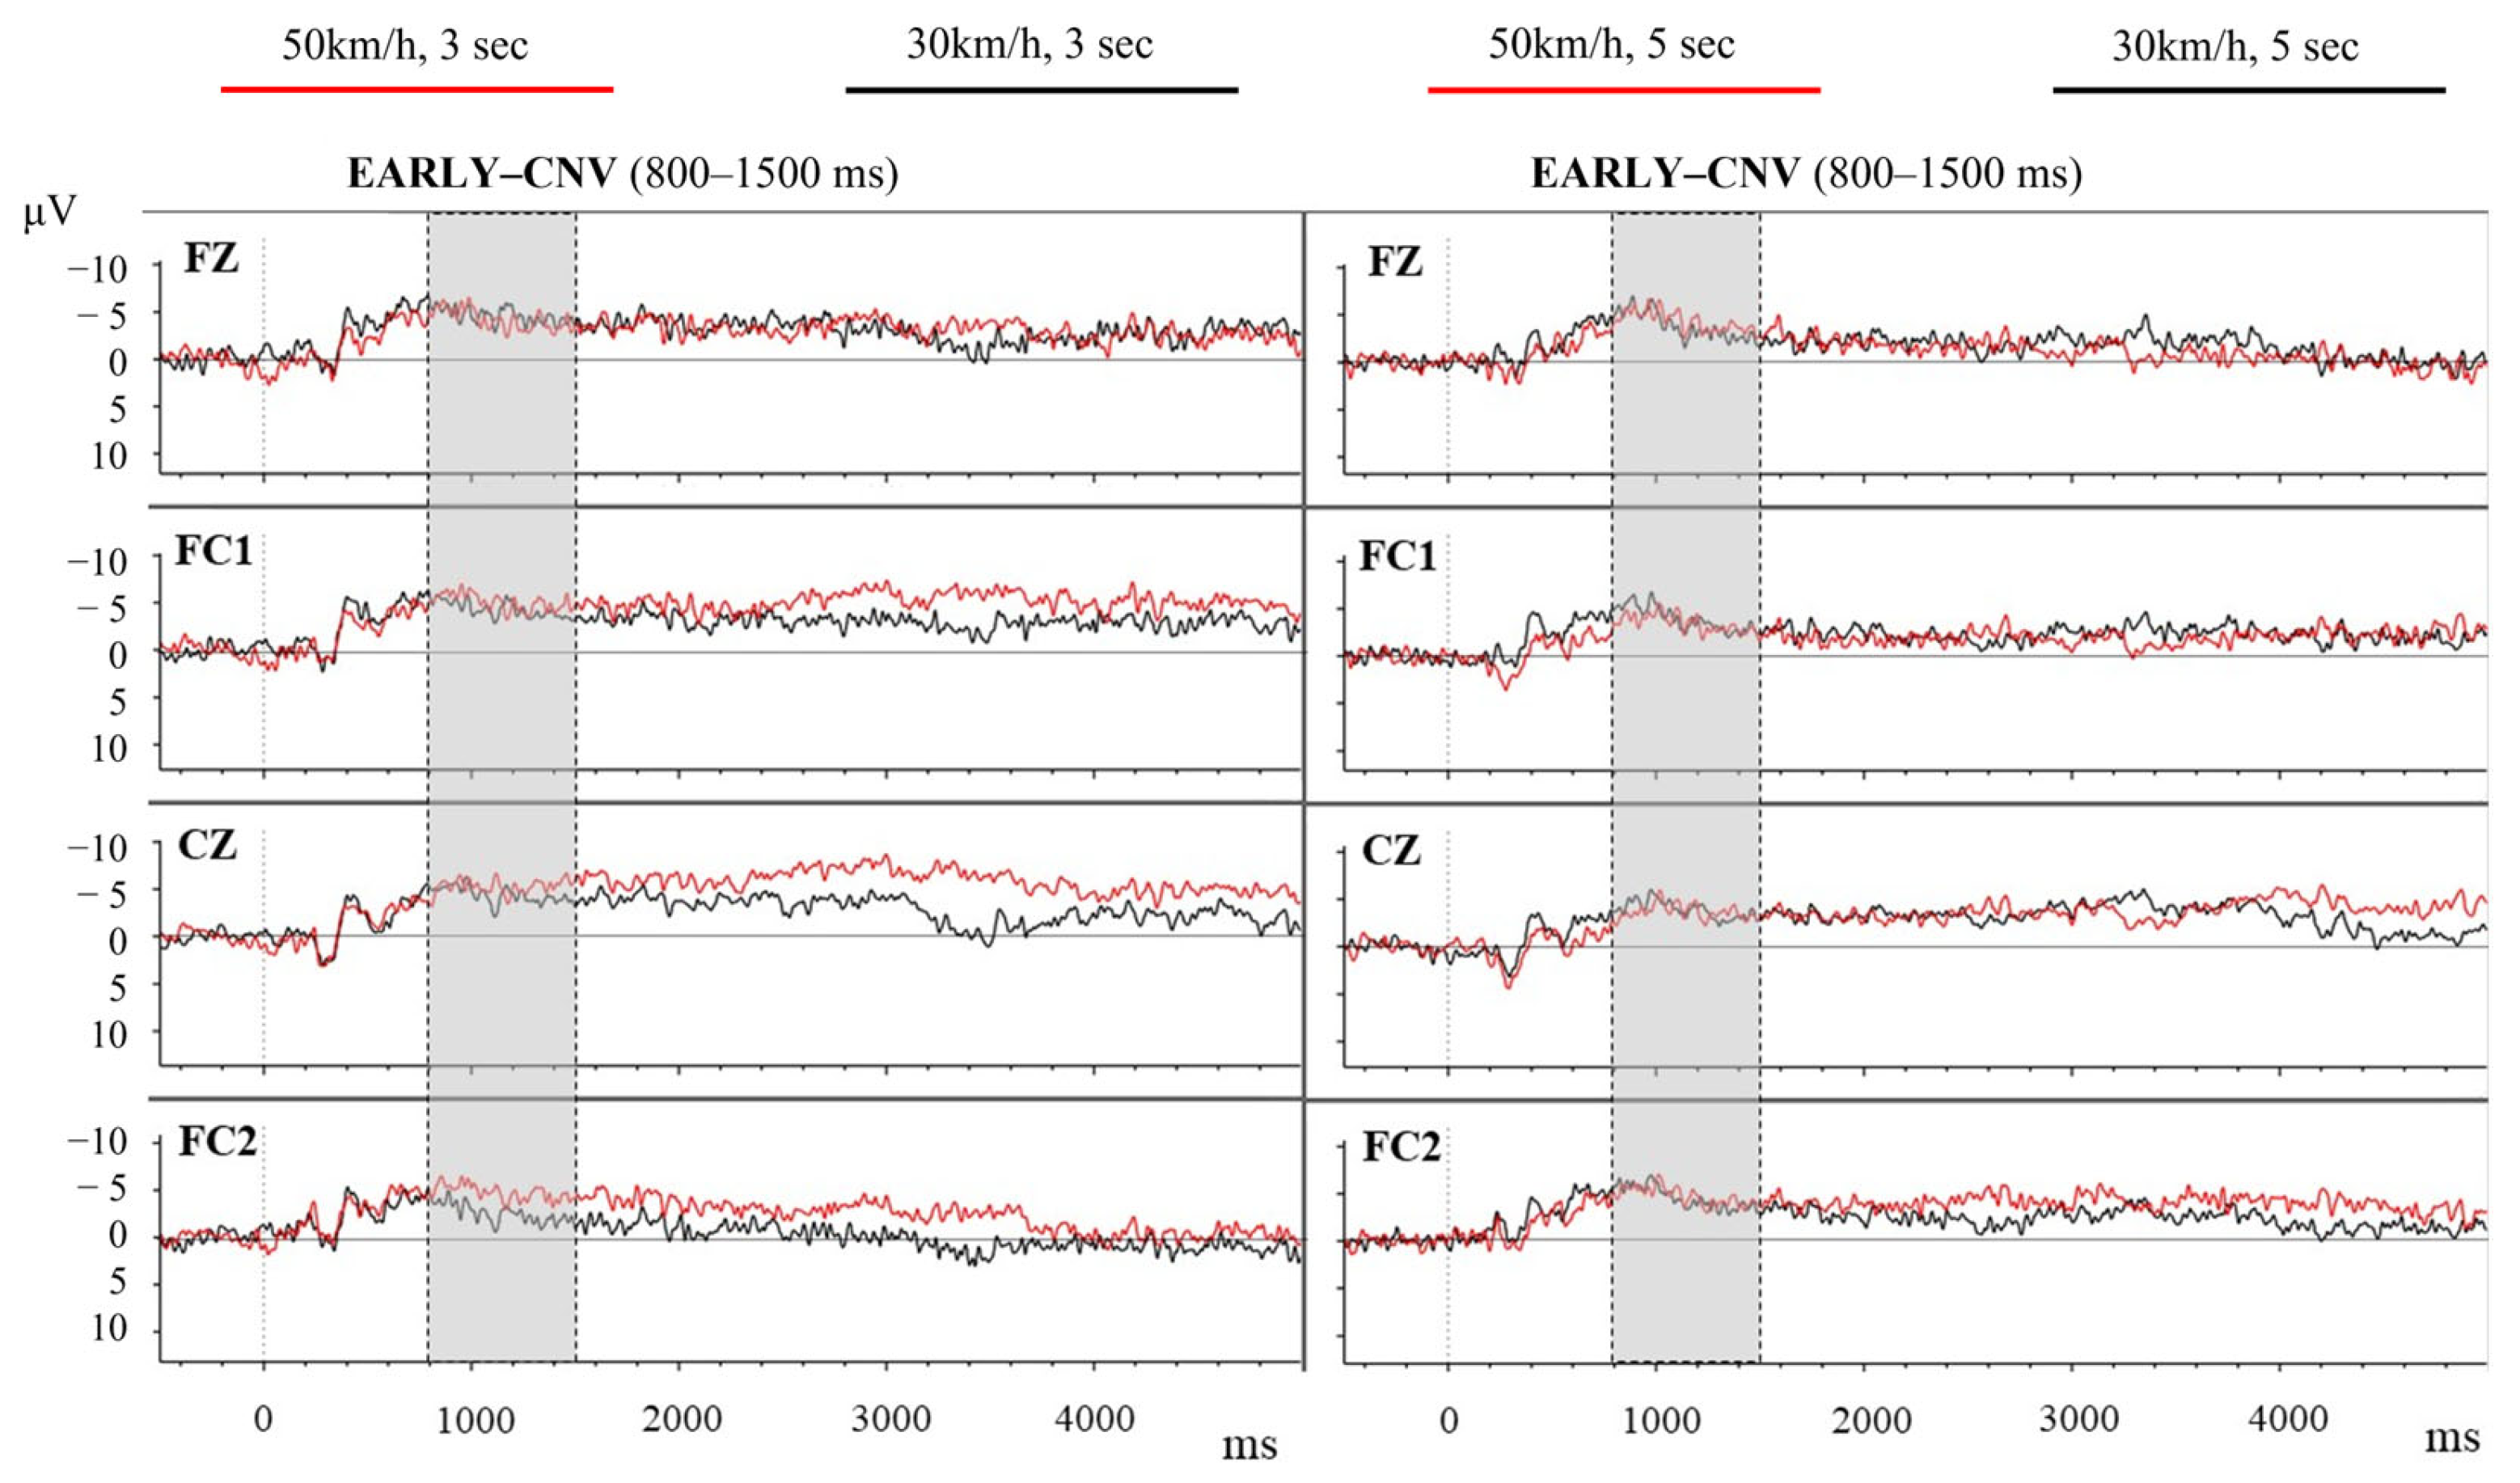
3.2.3. TTA Estimation

Initially, the EEG recordings were subjected to preprocessing to mitigate potential aliasing errors by applying a 60 Hz low-pass filter. Then, we downsampled the data to 256 Hz and employed a bandpass filter ranging from 0.1 to 30 Hz to retain the frequencies of interest selectively. To ensure a uniform reference across all recordings, we re-referenced the data to the expected average reference, standardizing the signal interpretation. Subsequent steps involved the utilization of Independent Component Analysis (ICA) to remove the ocular and cardiac components. The pivotal moment of cue onset was defined as the instance of the car’s disappearance, assigned as the 0 ms mark. Our experimental framework was structured around four distinct conditions, as defined in Section 2.4.2, based on a combination of speed (30 km/h vs. 50 km/h) and the timing of the car’s disappearance (at 3 s vs. 5 s after cue onset). The EEG signals were segmented into epochs extending from −500 to 5000 ms relative to the cue onset, incorporating a 500 ms pre-cue baseline for normalization. Trials exhibiting amplitude variations exceeding +/−100 μV were systematically rejected. Then, after averaging the EEG epochs, the EEG data from the four electrode sites mentioned before were extracted for in-depth analysis. Early-CNV was defined as the slow negative wave emerging between 400 and 2000 following the cue stimulus. To accurately quantify the Early-CNV, we calculated its mean amplitude across a specific time window from 800 ms to 1500 ms, ensuring the capture of the minimal features of this component.
To investigate the characteristics and differences of the Early-CNV component across various conditions, we employed a repeated-measures analysis of variance (RM-ANOVA). The analysis focused on two primary factors: the electrode site (FZ, FC1, FC2, and CZ) and the experimental conditions, whose resulting four distinct scenarios have been coded as 33 (speed at 30 km/h with the car disappearing at 3 s), 35 (speed at 30 km/h and 5 s of disappearance time), 53 (50 km/h and 3 s), and 55 (50 km/h and 5 s). Factors and factor interactions were accepted as statistically significant at p < 0.05. The effect size for the ANOVA was reported using partial eta squared (eta) to quantify the magnitude of observed phenomena. When the sphericity criteria were violated, Greenhouse–Geisser correction was applied. A Pearson correlation analysis was subsequently applied to explore the statistical relationship between EEG data and behavioral outcomes.
The RM-ANOVA did not show any significant difference between factors. On the other hand, an interaction was identified following the Pearson correlation involving Early-CNV and the correctness of users’ responses. In Condition 33, a significant positive correlation was observed between the amplitude of Early-CNV at the CZ electrode site (r = 0.85, p = 0.033), reflecting a reduction in CNV negativity when TTA estimations were more extended.
Figure 8 shows the grand-average Early-CNV at the FZ, FC1, FC2, and CZ electrodes. Table 2 indicates the mean amplitude and standard error (SE) of the Early-CNV for the four conditions and electrodes on TTA estimations.

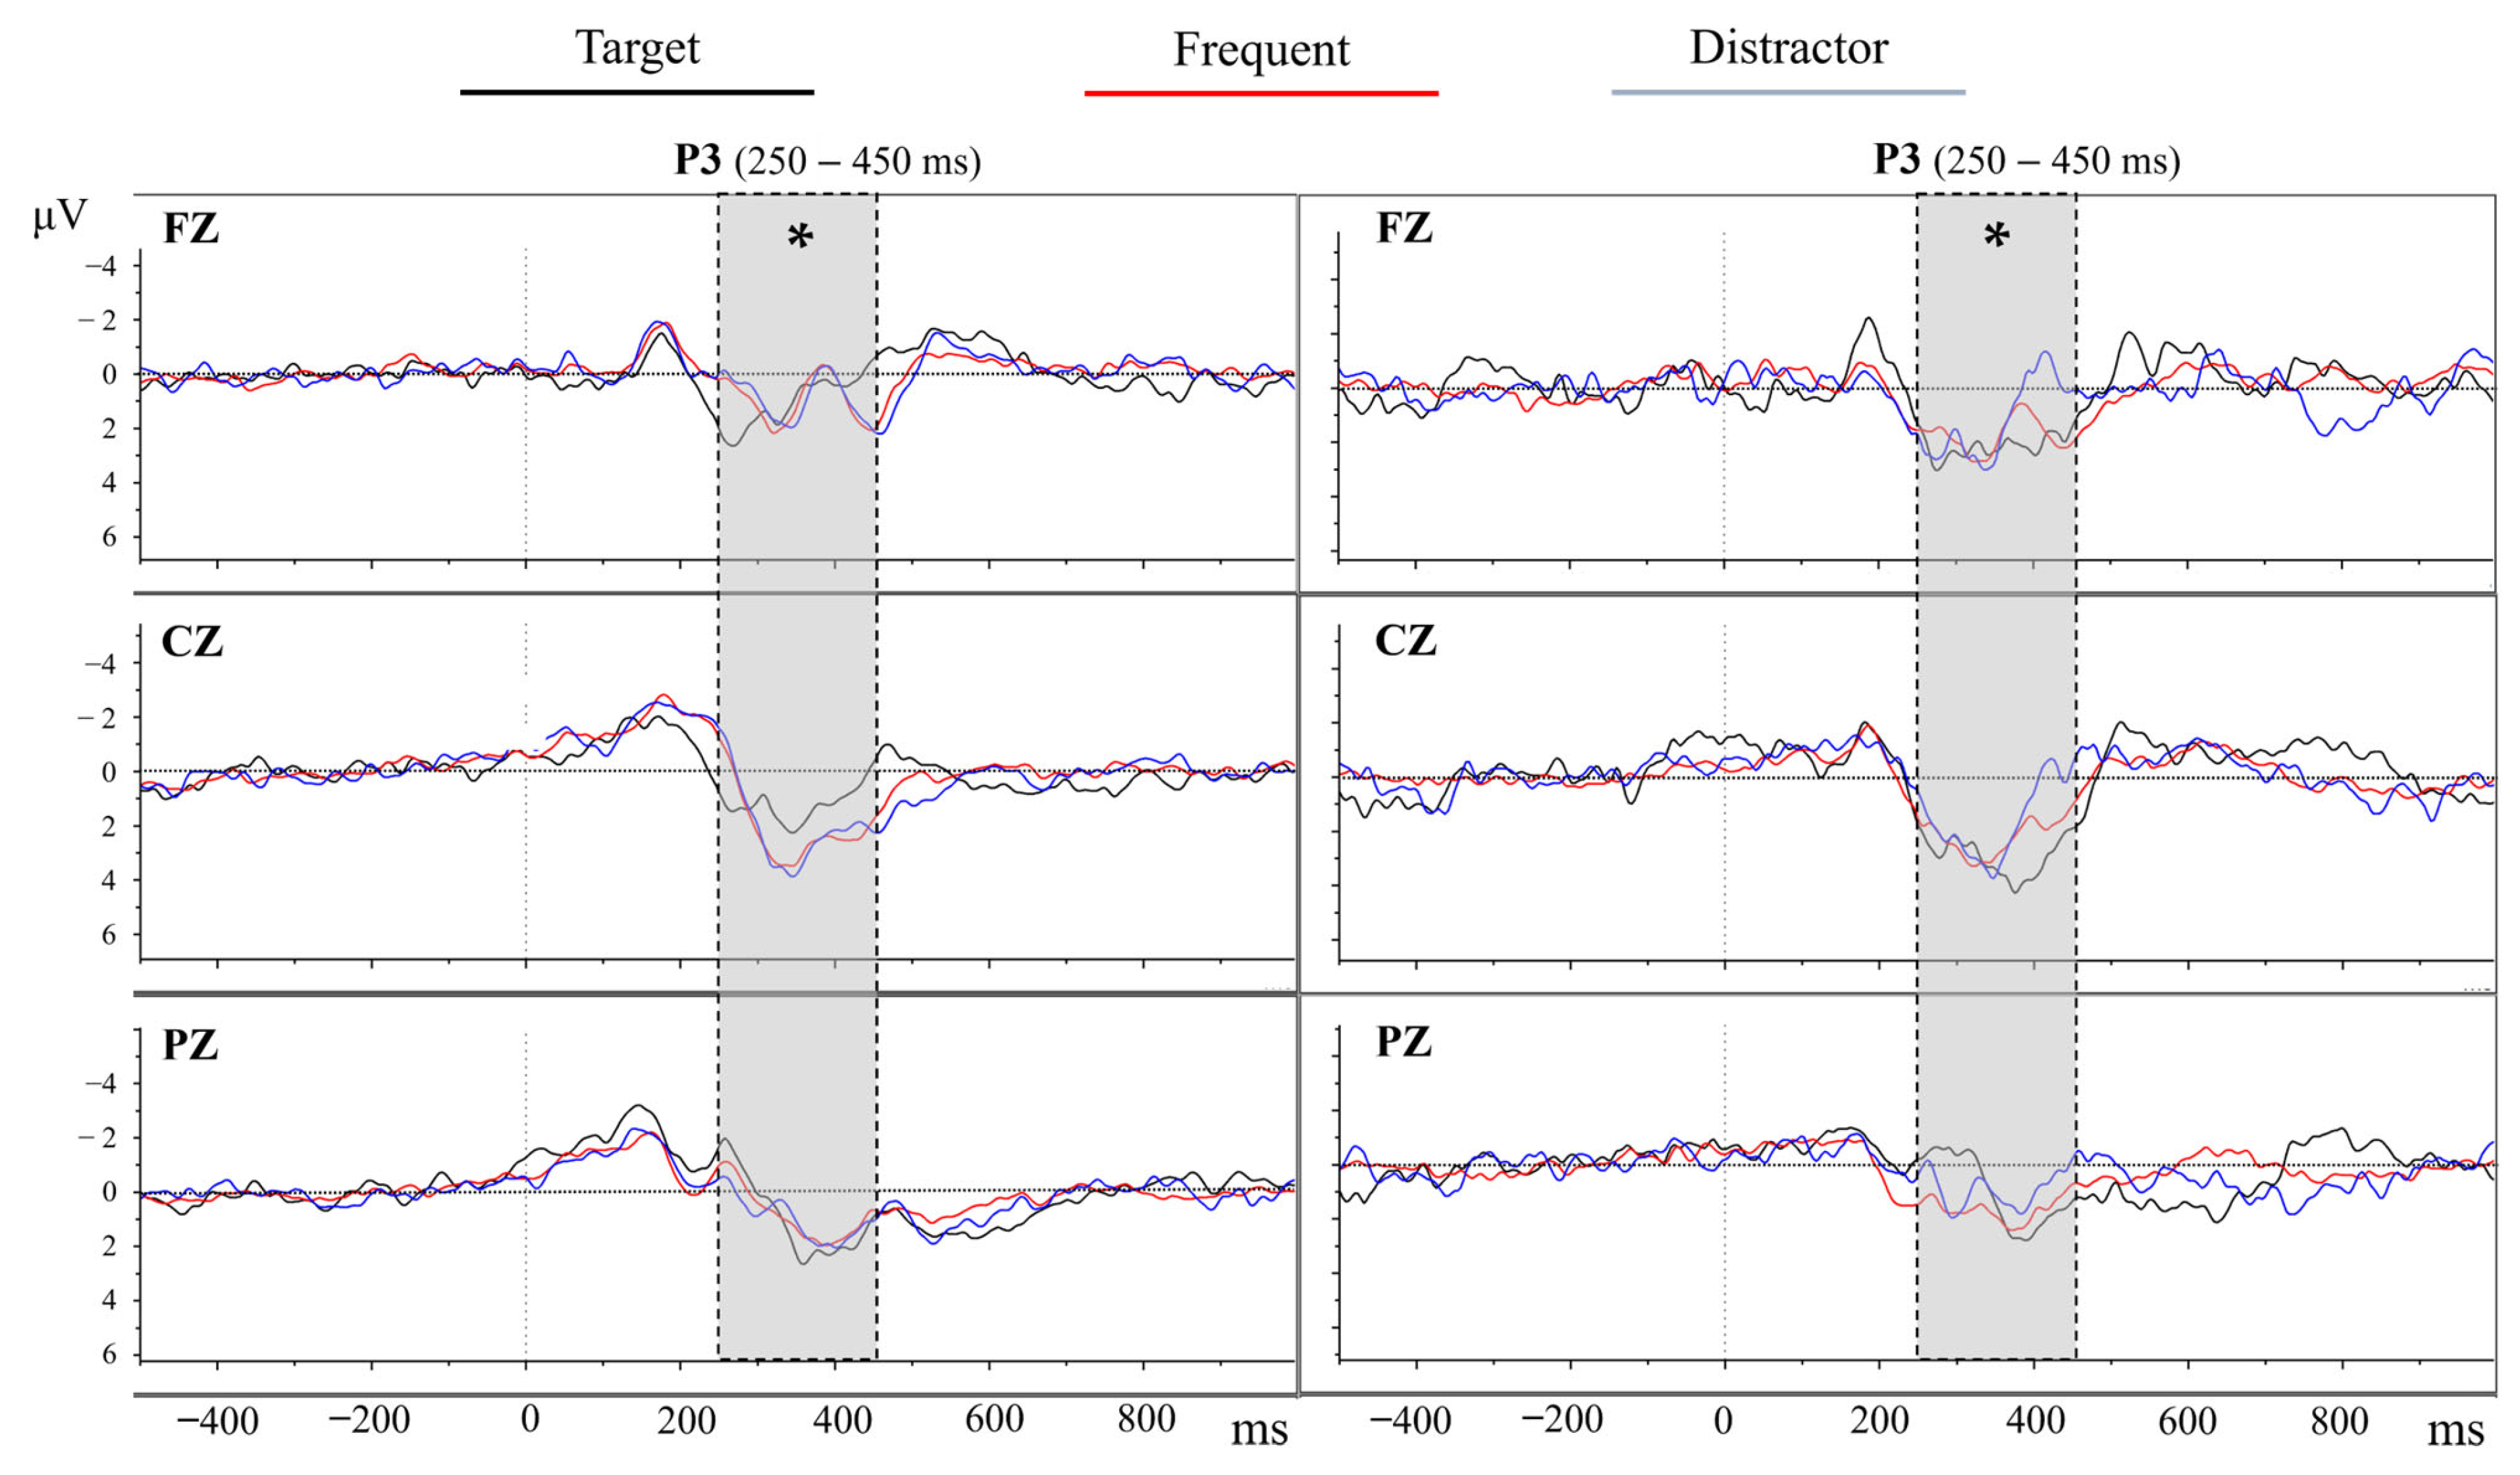
3.2.4. Oddball and Dual Tasks

We uniformly applied identical EEG and behavioral analysis protocols to investigate the same neural dynamics across both experimental paradigms. Initially, the EEG recordings were subjected to preprocessing to mitigate potential aliasing errors by applying a 60 Hz low-pass filter. Then, we downsampled the data to 256 Hz and employed a bandpass filter with a range of 0.1 to 30 Hz. All channels were re-referenced to the common average reference. The next step involved artifact subspace reconstruction (ASR), utilizing the open source “clean_rawdata” function within EEGLAB [52], specifically targeting the removal of muscle activity artifacts. A mild cutoff parameter (k = 20) was selected, grounded in findings from prior research [53]. Post-ASR, independent component analysis (ICA) was employed to remove ocular and cardiac components. The EEG signal was then segmented into epochs extending from −500 to 1000 ms relative to the onset of target (Tar), distractor (Dis), and frequent (Fre) stimuli, incorporating a 500 ms pre-cue period for baseline correction. As before, trials with an amplitude exceeding +/−100 μV were rejected. Subsequently, the EEG epochs were averaged, and the maximal peak values for all stimulus modalities (Tar, Dis, and Fre) within a 250–450 ms window were identified. These data served as the basis for defining and analyzing the P3 ERP component, focusing on midline electrodes (FZ, CZ, and PZ). Finally, two subjects with fewer than 50% of the total segments were omitted from the subsequent analyses.
An RM-ANOVA was utilized to assess the characteristics and variations of the mean P3 amplitude across different conditions. This analysis considered three primary factors: Paradigm (comprising Oddball and dual task conditions), Electrode (including FZ, CZ, and PZ), and Stimulus types (encompassing target, distractor, and frequent stimuli). Factors and factor interactions were accepted as statistically significant at p < 0.05. The effect size for the ANOVA was reported using partial eta squared (eta) to quantify the magnitude of observed phenomena. When the sphericity criteria were violated, Greenhouse–Geisser correction was applied. A Pearson correlation analysis was subsequently applied to highlight any statistical relationship between EEG data and the and the accuracy of RT for correct detections of target stimuli. Subsequently, a paired-sample t-test analysis was applied to assess the differences in RT between Oddball and dual task paradigms. The results were considered significant at p < 0.05.
A significant effect was found for the Paradigm factor [F(1, 9) = 32.729; p < 0.001; eta = 0.785] and for the Electrode factor [F(2, 18) = 26.578; p = 0.005; eta = 0.440]. Specifically, the mean P3 amplitude in the dual task paradigm was significantly higher than in the Oddball paradigm. Additionally, the mean P3 amplitude for the CZ electrode was higher compared to the FZ and PZ electrodes across both paradigms. There was no correlation in the Pearson correlations between EEG and RT. There was no correlation in the Pearson correlations between EEG and RT. Figure 9 shows the grand-average P3 amplitude at the FZ, CZ, and PZ electrodes. Table 3 presents the detailed examination of the behavioral and EEG measures for the Oddball and the Dual Task paradigms. There were no significant differences in the RT between paradigms.

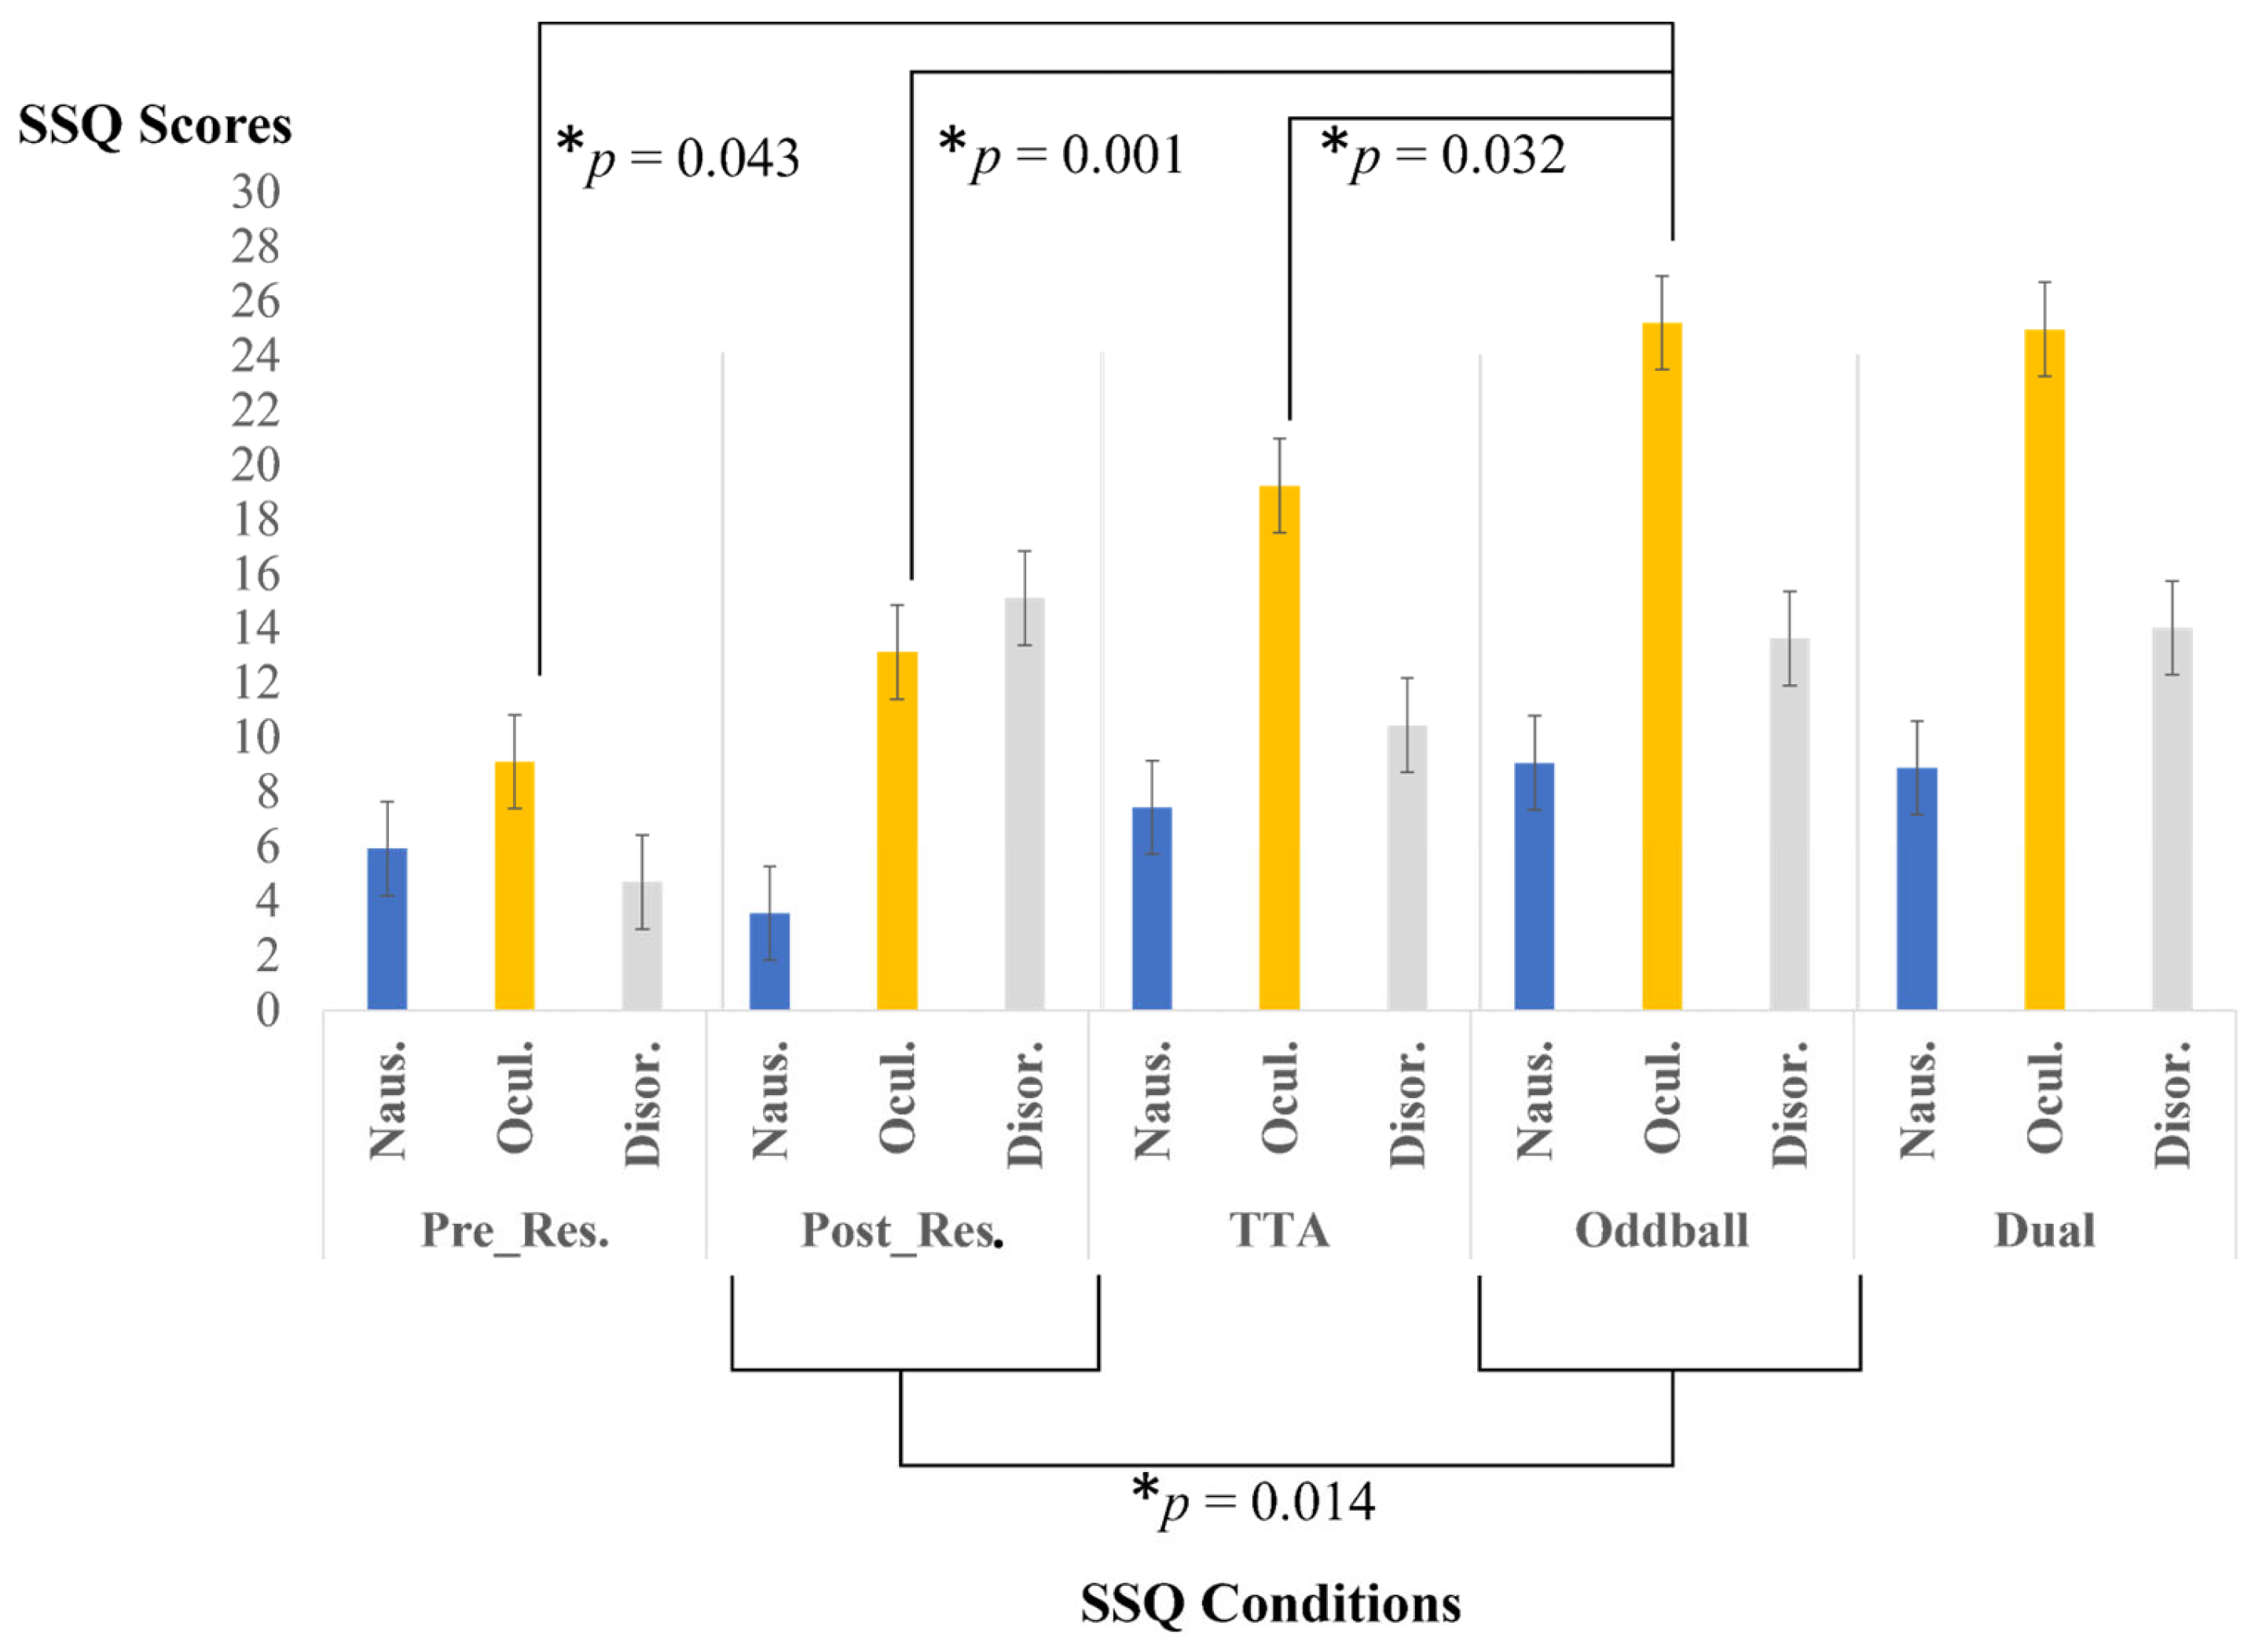
3.2.5. Cybersickness

To evaluate cybersickness symptoms during the VR experience, an RM-ANOVA was performed on SSQ responses collected throughout the study. The factors examined included Condition (pre-resting, post-resting, post-TTA, post-Oddball, and post-dual task) and Symptom (Nausea, Oculomotor, and Disorientation), with significance accepted at p < 0.05. Bonferroni corrections were applied to post hoc analyses, maintaining significance at p < 0.05. The effect size for the ANOVA was reported as partial eta squared (eta), employing Greenhouse–Geisser correction for violations of sphericity. A Pearson correlation analysis was initially performed to examine potential statistical relationships between cybersickness and behavioral outcomes, such as TTA estimations and Oddball and dual task RT. A Spearman correlation was then utilized for non-normally distributed dimensions, as determined by the Shapiro–Wilk normality test at a significance level of p = 0.05.
Significant effects for the factors Condition [F(1.607, 14.459) = 5.576; p = 0.021; eta = 0.383], Symptom [F(1.256, 11.308) = 9.221; p = 0.008; eta = 0.506] and for the Condition*Symptom [F(2.750, 24.750 = 5.104; p = 0.008; eta = 0.362] interaction factor were found. Concerning the Condition factor, it was found that the cybersickness sensation was significantly higher after performing the Oddball task than the cybersickness after the Resting task (p = 0.014). For the Symptom factor, we found that the Oculomotor symptoms were significantly higher than the Nausea (p = 0.026) and Disorientation (p = 0.004) symptoms. After pairwise comparisons between conditions, the Oculomotor symptom after the Oddball task was significantly higher than the Oculomotor symptoms at the pre-resting stage (p = 0.043) and after performing the resting task (p = 0.001) and the TTA task (p = 0.032), as shown in Figure 10. No correlations were found between the SSQ and the behavioral results.

3.2.6. Immersion/Presence

To evaluate the sense of presence, we examined the total score on the PQ administered after the TTA paradigm (PQ_1) and following the dual task paradigm (PQ_2), extracting the mean values (PQ_1: M = 103.36, SE = 10.10; PQ_2: M = 113.45, SE = 9.29) for each application. Next, a paired-sample t-test analysis was applied to assess the differences between both PQ applications. The results were considered significant at p < 0.05. The analysis showed significant differences between conditions (t-value = −3.595, p = 0.005).
We also investigated the potential relationship between PQ scores and EEG and behavioral measures. To this end, we conducted a Pearson correlation analysis between PQ dimensions, neural activity, and behavioral outcomes for each paradigm.
In the TTA paradigm, a relationship was identified between the CNV ERP at the CZ electrode site and the PQ dimensions. In condition 55 (50 km/h, 5 s), the CNV exhibited higher negativity when the sense of “Possibility to Act” (p = 0.04) and “Self-evaluation of Performance” (p = 0.03) were higher. Additionally, in condition 35 (30 km/h, 5 s), the CNV displayed increased negativity with higher levels of “Self-evaluation of Performance” (p = 0.004).
In the Oddball paradigm, the P3 amplitude at the PZ electrode site for the target stimulus was lower in the presence of a higher sense of “Self-evaluation of Performance” (p = 0.02). Similarly, for the target, the P3 amplitude at the CZ electrode site was lower with a higher sense of “Realism” (p = 0.14).
In the dual task paradigm, the P3 amplitude for the target stimulus at the FZ electrode site was more positive when the sense of “Self-evaluation of Performance” was higher (p = 0.037). Furthermore, at the PZ electrode site, the P3 amplitude was lower for the distractor stimulus, with higher scores of “Quality of Interference” (p = 0.046), and for the target, with higher scores of “Self-evaluation of Performance” (p = 0.033).
No correlations were identified between PQ and behavioral measures.

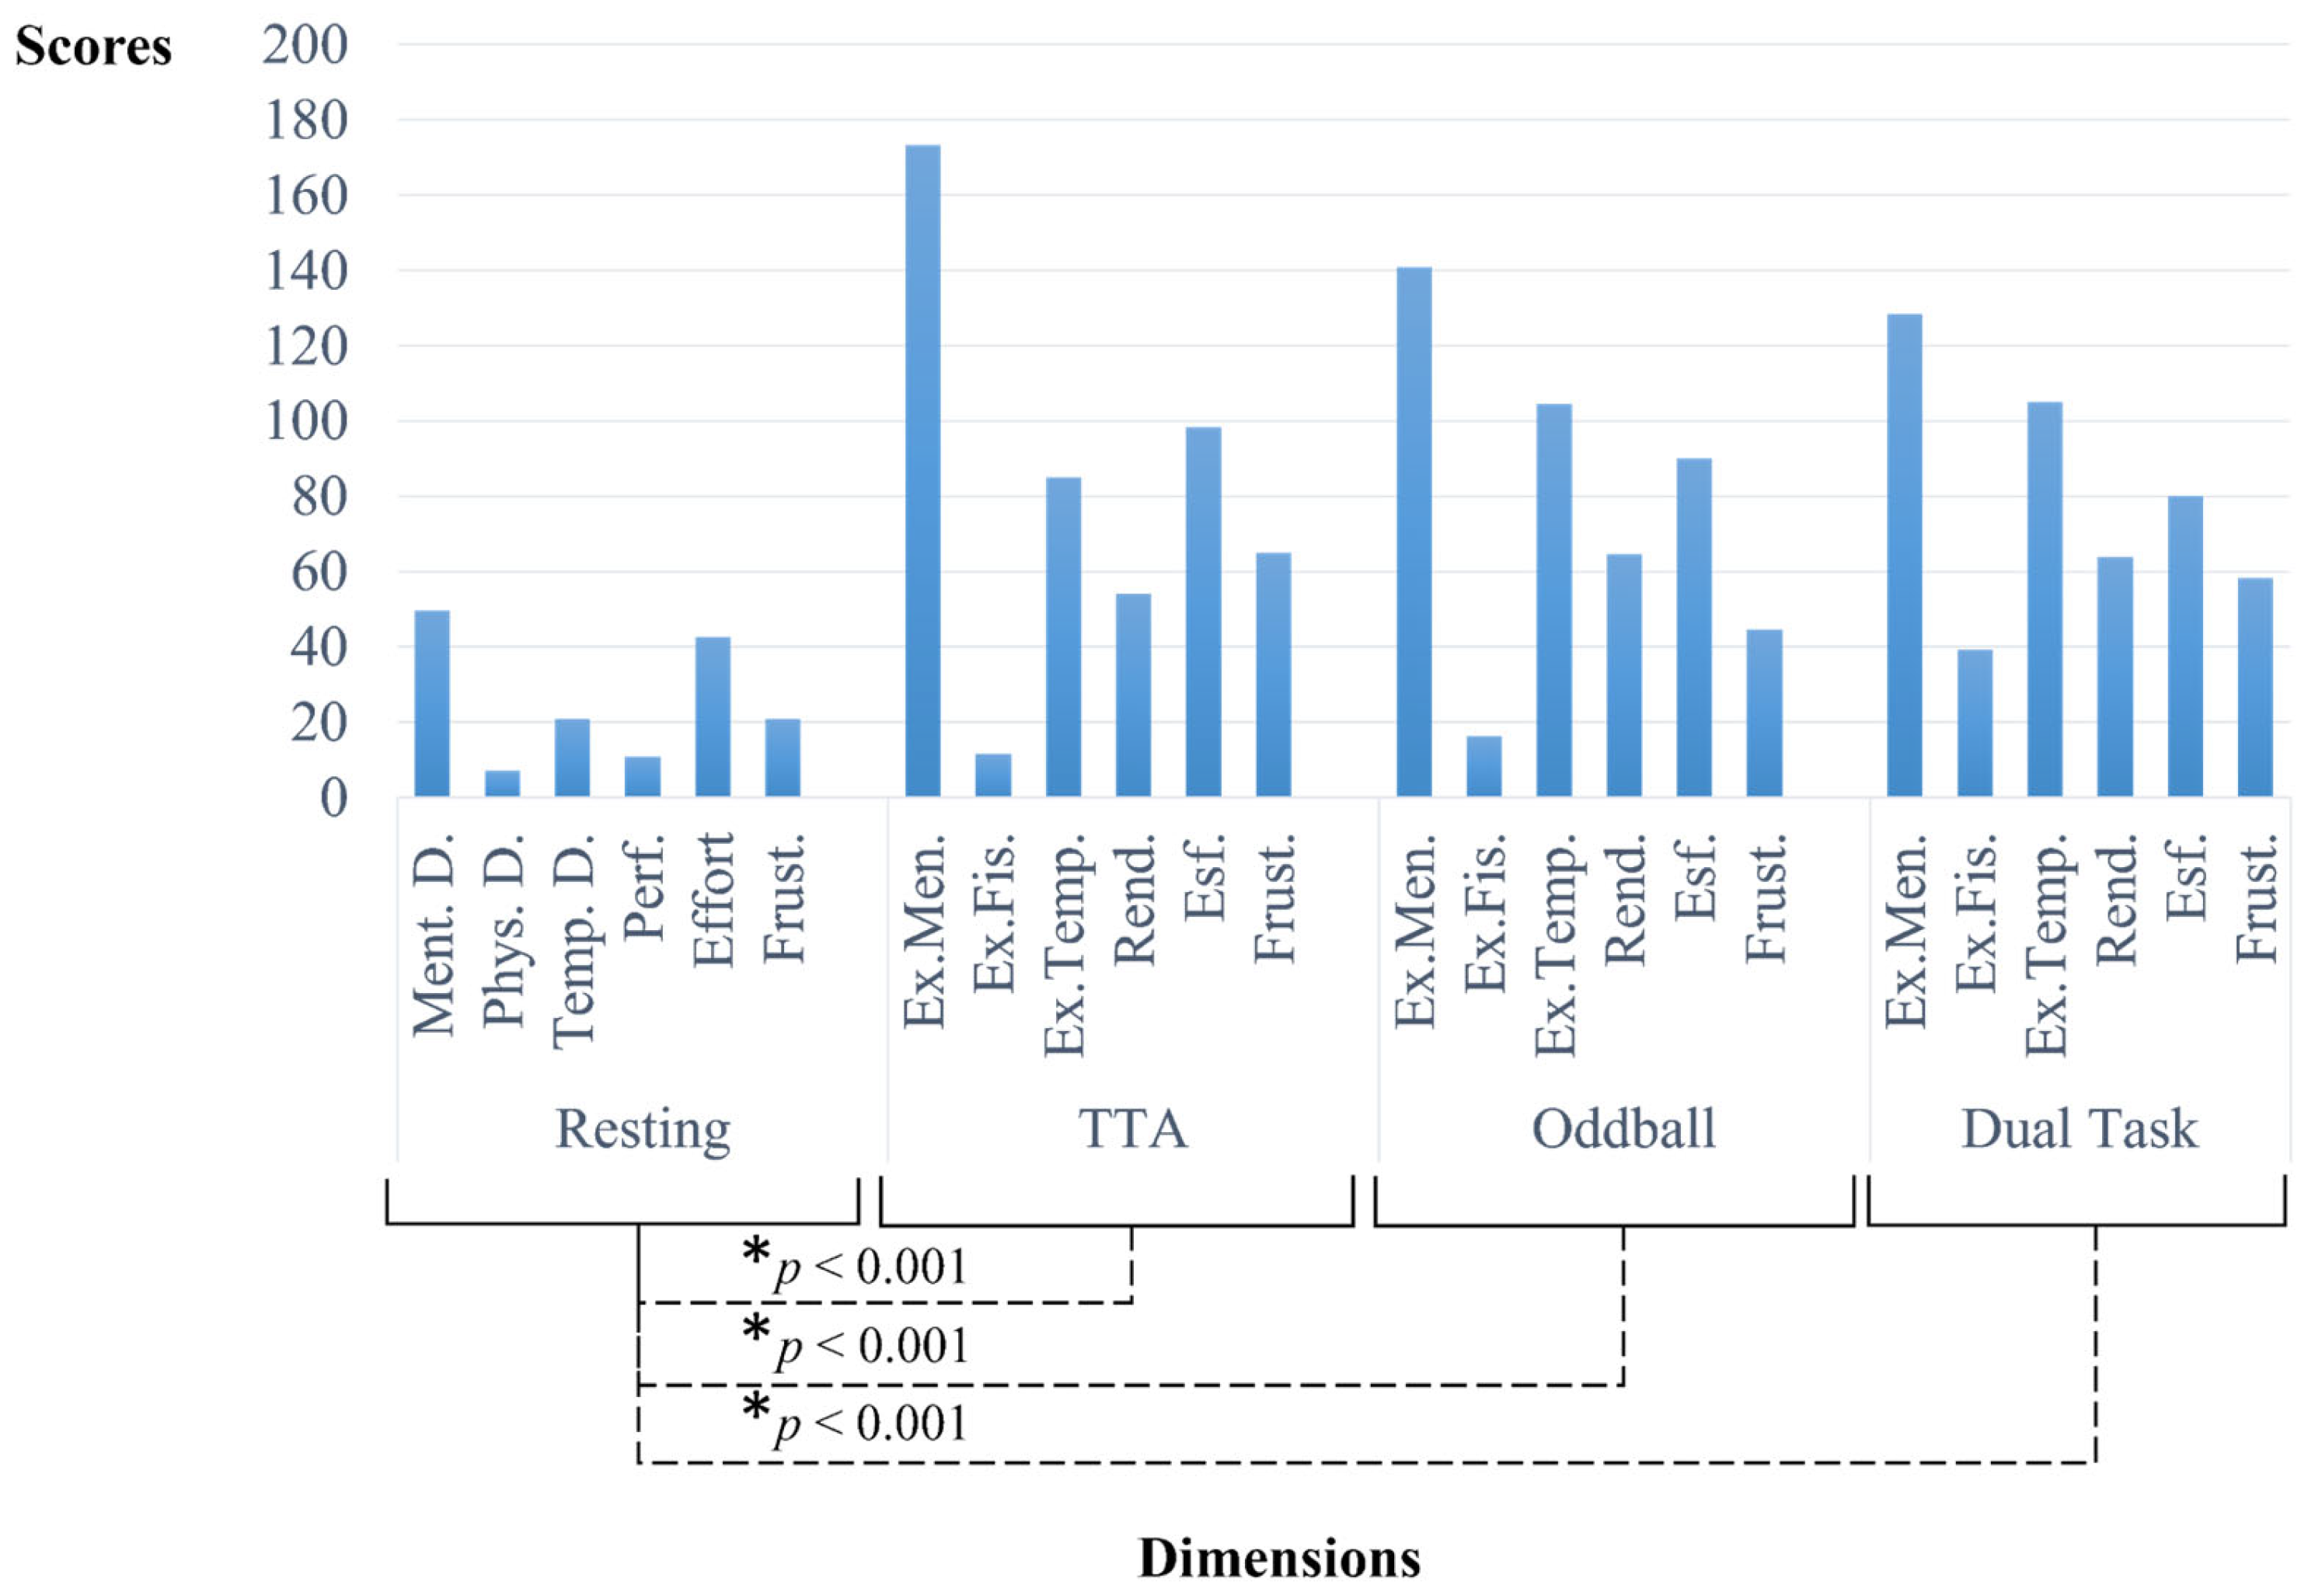
3.2.7. Cognitive Workload

Responses from the NASA-TLX questionnaire were analyzed using an RM-ANOVA to evaluate cognitive workload throughout the VR experience. The factors under consideration included Condition (resting, TTA, Oddball, and dual task) and Dimension (mental demand, physical demand, temporal demand, performance, effort, and frustration), with a significance threshold set at p < 0.05 for both factors and their interactions. Bonferroni adjustments were made for post hoc analyses, with significance also pegged at p < 0.05. The effect size for the ANOVA was reported using partial eta squared (eta), with Greenhouse–Geisser corrections applied in cases of sphericity violations. A Pearson correlation analysis was conducted to investigate potential correlations between cognitive workload indicators, EEG metrics, and behavioral outcomes, such as TTA estimations and Oddball and dual task RT.
Significant effects for the factors Condition [F(3, 33) = 25.833; p < 0.001; eta = 0.701], Dimension [F(5, 55) = 4.061; p = 0.003; eta = 0.270], and the interaction Condition*Dimension [F(15, 165) = 2.043; p = 0.015; eta = 0.157] were found. Concerning the Condition factor, it was found that the cognitive workload was significantly lower at the resting task than in the TTA paradigm (p < 0.001), Oddball paradigm (p < 0.001), and dual task paradigm (p < 0.001). There were no significant differences in the dimension factor. After pairwise comparisons between conditions, the mental demand was significantly lower at the resting task than after the TTA paradigm (p = 0.011), Oddball paradigm (p = 0.026), and the dual task paradigm (p = 0.046). Additionally, the performance difficulty at the resting task was significantly lower than after the TTA paradigm (p = 0.004), Oddball paradigm (p = 0.002), and the dual task paradigm (p = 0.001). No correlations were found between the SSQ and the behavioral results. Finally, effort was significantly lower at resting compared to the TTA paradigm (p = 0.04). No correlations were identified between NASA-TLX and behavioral measures, except in the TTA paradigm.
Significant relationships were observed when analyzing the TTA estimation. Under higher mental demands, the CNV exhibited a significantly less negative amplitude at the CZ electrode site for the 55 condition (p = 0.042). Also, a more negative CNV was identified with higher scores of frustration at the FC2 electrode site for the 53 condition (p = 0.045). Moreover, a correlation was observed in condition 35, indicating that increased TTA estimation was associated with higher frustration scores.
In the Oddball, higher levels of workload were recorded in NASA’s total score when P3 amplitude exhibited higher amplitudes at the electrode sites FZ for the frequent (p = 0.001), distractor (p = 0.009), and target (p = 0.007) stimuli; at PZ for the frequent (p = 0.39) stimulus; and at CZ for the distractor (p = 0.016) stimulus. Additionally, higher P3 amplitude was found when higher scores of temporal demand at the electrode sites PZ for the frequent (p = 0.016) and target (p = 0.032) stimuli and at CZ for the frequent (p = 0.019) and distractor (p = 0.002) stimuli.
In the dual task, the higher scores of temporal demands were correlated with higher P3 amplitudes at electrode sites FZ for the frequent (p = 0.026) stimulus and at PZ for the frequent (p = 0.006), distractor (p = 0.026), and target (p = 0.001) stimuli. Furthermore, the P3 amplitude was higher at the PZ electrode site for the distractor stimulus with higher effort (p = 0.037) scores. Figure 11 provides a visual summary of these results.

3.2.8. Relations between Cybersickness, Presence, and Cognitive Workload

Finally, to assess the relationship between VR-related sensations (cybersickness, presence, and cognitive load), a Pearson correlation analysis was conducted between the dimensions of the SSQ and the overall indices of NASA and PQ across different paradigms. Spearman correlation analysis was employed in cases where the dimensions’ scores did not adhere to the assumptions of normality, as determined by the Shapiro–Wilk test, with a significance level set at p = 0.05.
Significant correlations were observed between NASA’s scores after the resting period and the nausea dimension of the SSQ. Specifically, a higher sense of cognitive workload was associated with a reduced sense of nausea before (p = 0.015) and following (p = 0.039) the resting paradigm. Furthermore, symptoms of nausea following the Oddball paradigm showed a reduction correlated with an increased sense of presence (p = 0.021) by the experiment’s conclusion.
Moreover, significant correlations have been identified between NASA’s dimensions and the PQ. Specifically, an increased sense of presence in the middle of the experiment was associated with higher scores in NASA’s effort dimension (p = 0.042), a decreased sense of mental demands (p = 0.027) after the TTA paradigm, and a reduced global sense of cognitive workload at the end of the experiment following the dual task (p = 0.009).

4. Discussion

This study introduces a virtual reality protocol to assess pedestrian behavior in simulated road-crossing scenarios, focusing on VR’s ability to evoke critical ERP like P3 and CNV, indicative of decision-making processes. An ad hoc VR application was developed to explore pedestrian behaviors from a neurophysiological point of view utilizing EEG measurements. Early findings from a preliminary user analysis highlight VR’s capacity to illuminate pedestrian cognitive mechanisms in realistic yet controlled environments.
When considering the subjective dimensions captured by the three questionnaires used for this study, the findings highlight the nuanced balance between immersion and discomfort in our VR application. Following the standardized scores reported in [39] to assess the sense of realistic immersion through the PQ questionnaire, our study achieved fundamental scores confirming the realism of the developed VR environments.
The increase observed across the scenarios confirms participants’ perception of satisfactory immersion, particularly during prolonged exposure to VR and engagement in realistic scenarios. Moreover, the sense of presence did not show significant associations with certain other VR sensations. However, some correlations were identified. Specifically, presence sense contributed to the perception of cognitive workload and influenced the perceived effort required for accurate task execution, potentially indicating a heightened engagement in the correct resolution of cognitive tasks. Additionally, the sense of presence was observed to alleviate nausea symptoms toward the experiment’s conclusion. The SSQ reveals an almost linear increase in discomfort with continued exposure to VR. This issue was expected as it has already been identified in previous research, posing some limitations in prolonged VR engagement. However, our study shows that the increase in discomfort does not adversely affect cognitive function or workload. The NASA TLX demonstrates that paradigms involving behavioral engagement tend to increase sensations of cognitive load, as would be anticipated under more naturalistic conditions. Additionally, cognitive workload increases the P3 amplitude across the conditions and electrodes over various stimuli. This observation suggests that an elevated sense of workload may enhance attentional processes for tasks of moderate demand, manifested by an increase in the P3 component.
Concerning the TTA task, we can conclude that a consistent negative neural wave (Early-CNV) is obtained in the mid-frontocentral scalp for each experimental condition. However, the results obtained in scenario 33 (car speed at 30 km/h and a disappearance time of 3 s) are particularly notable, since the participants show a better estimation of the arrival time. Indeed, the TTA estimation in this condition positively correlates with the Early-CNV amplitude at electrode CZ. This can be interpreted as an indication of the relationship between higher cognitive demand, a possible reduction in preparatory neural activity, and increased difficulty in accurately estimating the arrival time.
Similarly, the scenarios designed for oddball and dual-task paradigms allowed obtaining an appropriate measure of the evoked potential P3. In both paradigms, the amplitude obtained was higher at electrode CZ. This finding suggests that, under the conditions of our experiment, the neural activity associated with processing target stimuli, as reflected in the P3 amplitude, is more pronounced in the central region of the scalp.
Furthermore, we observed a higher amplitude of the P3 component during the dual task than in the Oddball Task. This finding seems to contradict previous studies suggesting that CMI would lead to the opposite effect: a disruption of neural dynamics, such as a reduction in P3 amplitude during the dual task (walking) than in the standard Oddball task (standing) [25,54,55]. However, this discrepancy may be attributed to the relative simplicity of both tasks and the overall health profile of the young participants. As indicated in recent studies, healthy young adults can adapt their gait and task-related behavior during walking to optimize their response to cognitive stimuli [49,55]. This interpretation finds additional support in the results of RT and NASA questionnaire scores, suggesting that the dual task does not impose a higher cognitive load compared to the Oddball task. This is supported by the similarity in reaction time in both paradigms. A plausible explanation could be that, in the case of healthy young adults facing two tasks with relatively simple cognitive demands, walking may increase participant engagement. As proposed in [49], this may prompt individuals to adopt a deliberate strategy to maintain task accuracy while walking, which could involve neural reconfigurations. Similarly, it could facilitate a more efficient use of cognitive resources in the dual task, as demonstrated by the increased average P3 amplitude.
In summary, our methodology, though still in development, has shown promising results. Our primary aim is to lay a foundation for future research that broadens participant diversity and enhances the generalizability of findings. It is essential to ensure our experimental setup is effective, yields consistent results, and prioritizes participant safety before wider implementation. The outcomes of our study demonstrate the value of using virtual environments to explore cognitive load, utilizing a VR application enriched with 3D realistic models and essential features aligned with our study’s protocol. This approach successfully integrates various scenario elements to precisely elicit cognitive processing signals, such as P3 and CNV components, crucial for studying attention and decision making.

5. Conclusions and Future Works

Our study underscores VR’s utility in exploring human behavior, cognitive processes, and neurological functions within psychological and behavioral research. However, this application of VR encounters several obstacles that must be overcome to enhance its research validity and future utility.
A critical limitation of our study is the small sample size of participants in our trials, which restricts the generalizability of our findings. Expanding the participant pool and including a more comprehensive array of demographic variables would enhance the representativeness of the results and allow for the identification of varied responses to VR experiments. This could lead to more tailored experimental designs for different user groups. Additionally, we aim to randomize test sequences in future trials to counteract potential biases from test order and participant fatigue.
Cybersickness presents another notable challenge since it might potentially reduce participant engagement and performance. Despite the minimal observed impact on workload, variability in cybersickness susceptibility and spatial awareness could introduce bias. Investigating participants’ technological familiarity could further illuminate their comfort with VR and its influence on their responses to simulations.
From a technical perspective, a significant challenge is the limitations posed by current HMD technology, especially the narrower field of view (FoV), which often constrains users’ perception, thus reducing the sense of presence and immersion. Additionally, the digital rendering of three-dimensional spaces poses challenges for users’ spatial awareness and depth cues. This may impact accurately estimating distances and speeds, which is crucial for pedestrian behavior studies. Addressing these issues requires innovative display technology and optical design developments to allow for a broader FoV. These advancements aim to project clear, undistorted images across a larger area and support higher-resolution displays that maintain the overall image quality. On the other hand, relying on either augmented or mixed reality elements is expected to introduce real-world visual cues that support an intuitive grasp of spatial relationships. Developing adaptive interfaces that respond in real-time to user interactions is another possible solution to mitigate depth perception issues by offering a way to adjust the virtual scene dynamically.
A significant challenge in VR research is the gap between the simplicity of simulated environments and the dynamic complexity of the real world. These simulated settings often need more unpredictability and diversity crucial for accurately modeling pedestrian behavior, which may lead to inaccuracies in assessing cognitive load and decision-making processes. Although our research demonstrates VR’s effectiveness in eliciting expected brain activity, bridging the gap between simulation and reality is essential for enhancing the ecological validity of VR findings. In this context, augmented or mixed reality techniques could offer a solution by incorporating real-world variability and challenges into virtual environments, thereby providing a more authentic experience that mirrors everyday scenarios’ sensory and cognitive demands. Similarly, simulating dynamic interactions like pedestrian traffic remains a significant hurdle, requiring sophisticated algorithms to mimic human navigation realistically. Achieving high simulation fidelity demands advanced computational models and substantial processing power.
In summary, while VR provides a valuable lens for examining pedestrian workload, its application is constrained by realism, technology, and participant experience challenges. Addressing these challenges is essential for deepening our understanding of cognitive load and decision making within simulated traffic environments, providing critical insights for developing safer urban landscapes and traffic systems. In this way, our research is expected to contribute to accomplishing the Sustainable Development Goals focused on improving road safety and reducing casualties.

Author Contributions

Conceptualization, F.L., L.P., V.A., R.J.-B. and A.S.; methodology, R.J.-B., V.A., L.P. and A.S.; software, F.L.; validation, R.J.-B. and A.S.; formal analysis, V.A.; investigation, L.P., V.A. and F.L.; resources, R.J.-B. and A.S.; data curation, F.L. and V.A.; writing—original draft preparation, L.P. and V.A.; writing—review and editing, L.P., V.A., F.L., R.J.-B. and A.S.; visualization, V.A. and F.L.; supervision, R.J.-B. and A.S.; project administration, R.J.-B. and A.S.; funding acquisition, R.J.-B. and A.S. All authors have read and agreed to the published version of the manuscript.

Funding

This research was conducted within the scope of the following projects: project VULNEUREA Grants PID2021-122290OB-C21 and PID2021-122290OB-C22, funded by MCIN/AEI/10.13039/501100011033/“ERDF A way of making Europe”, EU; project VIRESTREEP Grant TED2021-131516B-I00, funded by MCIN/AEI/10.13039/501100011033 and by the “European Union NextGenerationEU/PRTR”; project SAFEDUCA VR Grant PDC2022-133381-I00 VR, funded by MCIN/AEI/10.13039/501100011033 and by the “European Union NextGenerationEU/PRTR”.

Data Availability Statement

The datasets presented in this article are not readily available because the data are part of an ongoing study. Further inquiries should be directed to the corresponding author.

Acknowledgments

The authors would like to thank CEDINT-UPM and the Faculty of Health Science—HM Hospitales of the University Camilo José Cela for their support in this research.

Conflicts of Interest

The authors received funding from the Project VULNEUREA, the Project VIRESTREEP, and the Project SAFEDUCA VR. The funder was not involved in the study design, collection, analysis, interpretation of data, the writing of this article or the decision to submit it for publication.

Appendix A

Below is a table of the acronyms used in the manuscript for easy reference. It lists each acronym alphabetically, along with its full form and a brief explanation, to improve text clarity.
Table A1. A summary of the principal acronyms utilized throughout the document, accompanied by their definitions within the context of this study.
AcronymFull NameMeaning
ANOVA
RM-ANOVA
(Repeated measures) Analysis of VarianceCollection of statistical models used to evaluate differences between group means
ASRArtifact Subspace ReconstructionMathematical method used for removing high-amplitude artifacts from EEG
C3, C4, CP1, CP2, CP5, CP6, CZName of the electrodes placed at the central (C) lobeLocations of the scalp electrodes as described by the International 10–20 system
(Early-/Late-) CNV(Early-/Late-) Contingent Negative VariationSlow, negative potential observed on the surface during the interval between cerebral responses to two stimuli, particularly when the second stimulus necessitates a motor response or a decision from the subject
CMICognitive–Motor InterferenceDecline in performance occurring during the concurrent execution of a cognitive and a motor task (dual task scenario)
dBDecibelUnit of measurement used for sound power in acoustics. Used to determine the environmental levels of environmental sounds in VR scenarios
DOFDegrees of FreedomNumber of axes that a rigid body can freely move in 3D space
EEGElectroencephalogramMethod used to record an electrogram of the bio-signals generated by the electrical activity of the brain
ERPEvent-Related PotentialsElectrophysiological response of the brain to an (internal or environmental) event
HMDHead-Mounted DisplaysHelmet-like visualization devices that can project computer-generated images onto a display located very close to the user’s eyes
F3, F4, F7, F8, FC1, FC2, FC5, FC6, FP1, FP2, FPZ, FT9, FT10, FZName of the electrodes placed at the frontal (F) lobeLocations of the scalp electrodes as described by the International 10–20 system
KKelvin degreesUnit of measurement of the color temperature of light sources. Used to set some specific color values in the VR scenarios
ICAIndependent Component AnalysisComputational technique used to decompose a multivariate signal into its additive subcomponents
ISMIndustrial, Scientifical, Medical (bands)Portions of the radio spectrum globally designated for industrial, scientific, and medical (ISM) uses
LAN/WANLocal/Wide Area NetworkComputer networks with different geographical coverage
LCDLiquid-Crystal DisplayType of flat panel display
LEDLight-Emitting DiodeA device that produces light as electrical current passes through it
LPDDRLow-Power Double Data Rate Type of synchronous dynamic random-access memory
MMeanA statistical measure of central tendency
MRMixed RealityCombination of virtual and augmented reality where both real and virtual objects and/or people can interact
NASA-TLXNASA Task Load IndexA subjective, multidimensional tool commonly used to evaluate perceived workload
O1, O2, OZName of the electrodes placed at the occipital (O) lobeLocations of the scalp electrodes as described by the International 10–20 system
P3, P4, P7, P8, PZName of the electrodes placed at the parietal (P) lobeLocations of the scalp electrodes as described by the International 10–20 system
PCIePeripheral Component Interconnect ExpressStandard interface used for connecting high-speed components
POSIX (time)Portable Operating System Interface for Unix (time)Date and time representation originally conceived for Unix operating systems
PQPresence QuestionnaireTool used to measure the personal, psychological state of “being there” experienced in immersive virtual environments
RGBRed-Green-BlueAdditive color model used to generate a wide range of colors for digital environments
RTReaction TimeAmount of time taken for a person to respond to a given stimulus
SEStandard ErrorMeasure of the deviation of the sample mean from the population mean
SSQSimulation Sickness QuestionnaireTool used to measure users’ level of (cyber)sickness levels in VR environments
T7, T8, TP9, TP10Name of the electrodes placed at the temporal (T) lobeLocations of the scalp electrodes as described by the International 10–20 system
TTATime-to-ArrivalTime required for a moving object to reach a stationary target
V6/V8 Six- or eight-cylinder piston engines whose banks are arranged in a V configuration
VRVirtual RealityComputer-generated environment whose simulated scenes and objects appear highly realistic
VRUVulnerable Road UsersNon-motorized road users, such as pedestrians, (motor-)cyclists, and persons with reduced mobility

Appendix B

An illustrative figure is provided to complement the electrode list in Section 2.2, showing EEG electrode placement via the International 10/20 System for standardized positioning and consistent recordings across various settings.
Figure A1. The electrode configuration of the 10/20 system presented alongside a legend used to elucidate the meaning of the electrode labels.
Electronics 13 01453 g0a1

References

  1. European Road Safety Observatory Annual Statistical Report on Road Safety in the EU, 2022. 2023. Available online: https://road-safety.transport.ec.europa.eu/document/download/287aa31e-48c2-4e04-a9cc-e2ca24d29cc2_en?filename=ERSO_annual_report_20220509.pdf (accessed on 27 March 2024).
  2. European Commission. Roadmap to a Single European Transport Area-Towards a Competitive and Resource Efficient Transport System. White Pap. Commun. 2011, 144. [Google Scholar]
  3. Pugliese, B.J.; Barton, B.K.; Davis, S.J.; Lopez, G. Assessing Pedestrian Safety across Modalities via a Simulated Vehicle Time-to-Arrival Task. Accid. Anal. Prev. 2020, 134, 105344. [Google Scholar] [CrossRef]
  4. Horberry, T.; Osborne, R.; Young, K. Pedestrian Smartphone Distraction: Prevalence and Potential Severity. Transp. Res. Part. F Traffic Psychol. Behav. 2019, 60, 515–523. [Google Scholar] [CrossRef]
  5. Hamacher, D.; Herold, F.; Wiegel, P.; Hamacher, D.; Schega, L. Brain Activity during Walking: A Systematic Review. Neurosci. Biobehav. Rev. 2015, 57, 310–327. [Google Scholar] [CrossRef] [PubMed]
  6. Marucci, M.; Di Flumeri, G.; Borghini, G.; Sciaraffa, N.; Scandola, M.; Pavone, E.F.; Babiloni, F.; Betti, V.; Aricò, P. The Impact of Multisensory Integration and Perceptual Load in Virtual Reality Settings on Performance, Workload and Presence. Sci. Rep. 2021, 11, 4831. [Google Scholar] [CrossRef] [PubMed]
  7. Losada, Á.; Páez, F.J.; Luque, F.; Piovano, L. Application of Machine Learning Techniques for Predicting Potential Vehicle-to-Pedestrian Collisions in Virtual Reality Scenarios. Appl. Sci. 2022, 12, 11364. [Google Scholar] [CrossRef]
  8. Losada, Á.; Páez, F.J.; Luque, F.; Piovano, L. Effectiveness of the Autonomous Braking and Evasive Steering System OPREVU-AES in Simulated Vehicle-to-Pedestrian Collisions. Vehicles 2023, 5, 1553–1569. [Google Scholar] [CrossRef]
  9. Slater, M. Place Illusion and Plausibility Can Lead to Realistic Behaviour in Immersive Virtual Environments. Philos. Trans. R. Soc. B Biol. Sci. 2009, 364, 3549–3557. [Google Scholar] [CrossRef]
  10. Tran, T.T.M.; Parker, C.; Tomitsch, M. A Review of Virtual Reality Studies on Autonomous Vehicle–Pedestrian Interaction. IEEE Trans. Hum. Mach. Syst. 2021, 51, 641–652. [Google Scholar] [CrossRef]
  11. Ridel, D.; Rehder, E.; Lauer, M.; Stiller, C.; Wolf, D. A Literature Review on the Prediction of Pedestrian Behavior in Urban Scenarios. In Proceedings of the 2018 21st International Conference on Intelligent Transportation Systems (ITSC), Maui, HI, USA, 4–7 November 2018; pp. 3105–3112. [Google Scholar]
  12. Riegler, A.; Riener, A.; Holzmann, C. A Systematic Review of Virtual Reality Applications for Automated Driving: 2009–2020. Front. Hum. Dyn. 2021, 3, 689856. [Google Scholar] [CrossRef]
  13. Feng, Y.; Duives, D.; Daamen, W.; Hoogendoorn, S. Data Collection Methods for Studying Pedestrian Behaviour: A Systematic Review. Build. Environ. 2021, 187, 107329. [Google Scholar] [CrossRef]
  14. Schneider, S.; Bengler, K. Virtually the Same? Analysing Pedestrian Behaviour by Means of Virtual Reality. Transp. Res. Part. F Traffic Psychol. Behav. 2020, 68, 231–256. [Google Scholar] [CrossRef]
  15. Bhagavathula, R.; Williams, B.; Owens, J.; Gibbons, R. The Reality of Virtual Reality: A Comparison of Pedestrian Behavior in Real and Virtual Environments. Proc. Hum. Factors Ergon. Soc. Annu. Meet. 2018, 62, 2056–2060. [Google Scholar] [CrossRef]
  16. Li, H.; Zhang, J.; Xia, L.; Song, W.; Bode, N.W.F. Comparing the Route-Choice Behavior of Pedestrians around Obstacles in a Virtual Experiment and a Field Study. Transp. Res. Part. C Emerg. Technol. 2019, 107, 120–136. [Google Scholar] [CrossRef]
  17. Fitzpatrick, K.; Brewer, M.A.; Turner, S. Another Look at Pedestrian Walking Speed. Transp. Res. Rec. 2006, 1982, 21–29. [Google Scholar] [CrossRef]
  18. Deb, S.; Carruth, D.W.; Sween, R.; Strawderman, L.; Garrison, T.M. Efficacy of Virtual Reality in Pedestrian Safety Research. Appl. Erg. 2017, 65, 449–460. [Google Scholar] [CrossRef] [PubMed]
  19. Iryo-Asano, M.; Hasegawa, Y.; Dias, C. Applicability of Virtual Reality Systems for Evaluating Pedestrians’ Perception and Behavior. Transp. Res. Procedia 2018, 34, 67–74. [Google Scholar] [CrossRef]
  20. Sauer, Y.; Sipatchin, A.; Wahl, S.; García García, M. Assessment of Consumer VR-Headsets’ Objective and Subjective Field of View (FoV) and Its Feasibility for Visual Field Testing. Virtual Real. 2022, 26, 1089–1101. [Google Scholar] [CrossRef]
  21. Maruhn, P.; Schneider, S.; Bengler, K. Measuring Egocentric Distance Perception in Virtual Reality: Influence of Methodologies, Locomotion and Translation Gains. PLoS ONE 2019, 14, e0224651. [Google Scholar] [CrossRef]
  22. Caserman, P.; Garcia-Agundez, A.; Gámez Zerban, A.; Göbel, S. Cybersickness in Current-Generation Virtual Reality Head-Mounted Displays: Systematic Review and Outlook. Virtual Real. 2021, 25, 1153–1170. [Google Scholar] [CrossRef]
  23. Bhardwaj, R.; Balasubramanian, V. EEG Based Assessment of Pedestrian Perception of Automobile in Low Illumination Road. In Proceedings of the 20th Congress of the International Ergonomics Association (IEA 2018), Florence, Italy, 26–30 August 2018; Bagnara, S., Tartaglia, R., Albolino, S., Alexander, T., Fujita, Y., Eds.; Springer International Publishing: Cham, Switzerland, 2019; pp. 397–405. [Google Scholar]
  24. Protzak, J.; Wiczorek, R.; Gramann, K. Peripheral Visual Perception during Natural Overground Dual-Task Walking in Older and Younger Adults. Neurobiol. Aging 2021, 98, 146–159. [Google Scholar] [CrossRef] [PubMed]
  25. Nenna, F.; Do, C.-T.; Protzak, J.; Gramann, K. Alteration of Brain Dynamics during Natural Dual-Task Walking. bioRxiv 2020. bioRxiv:2020.02.27.968164. [Google Scholar] [CrossRef]
  26. Maidan, I.; Fahoum, F.; Shustak, S.; Gazit, E.; Patashov, D.; Tchertov, D.; Giladi, N.; Hausdorff, J.M.; Mirelman, A. Changes in Event-Related Potentials during Dual-Task Walking in Aging and Parkinson’s Disease. Clin. Neurophysiol. 2019, 130, 224–230. [Google Scholar] [CrossRef]
  27. Gramann, K.; Gwin, J.T.; Bigdely-Shamlo, N.; Ferris, D.P.; Makeig, S. Visual Evoked Responses during Standing and Walking. Front. Hum. Neurosci. 2010, 4, 202. [Google Scholar] [CrossRef] [PubMed]
  28. Richardson, D.P.; Foxe, J.J.; Mazurek, K.A.; Abraham, N.; Freedman, E.G. Neural Markers of Proactive and Reactive Cognitive Control Are Altered during Walking: A Mobile Brain-Body Imaging (MoBI) Study. Neuroimage 2022, 247, 118853. [Google Scholar] [CrossRef] [PubMed]
  29. Chen, X.; Cao, L.; Haendel, B.F. Human Visual Processing during Walking: Dissociable Pre- and Post-Stimulus Influences. Neuroimage 2022, 264, 119757. [Google Scholar] [CrossRef]
  30. Polich, J. Detection of Change: Event-Related Potential and FMRI Findings; Springer: Berlin/Heidelberg, Germany, 2003. [Google Scholar]
  31. Fischer, T.; Langner, R.; Birbaumer, N.; Brocke, B. Arousal and Attention: Self-Chosen Stimulation Optimizes Cortical Excitability and Minimizes Compensatory Effort. J. Cogn. Neurosci. 2008, 20, 1443–1453. [Google Scholar] [CrossRef]
  32. Guo, M.; Jin, J.; Jiao, Y.; Wang, X.; Cichockia, A. Investigation of Visual Stimulus with Various Colors and the Layout for the Oddball Paradigm in Evoked Related Potential-Based Brain–Computer Interface. Front. Comput. Neurosci. 2019, 13, 24. [Google Scholar] [CrossRef]
  33. Röhricht, J.; Jo, H.G.; Wittmann, M.; Schmidt, S. Exploring the Maximum Duration of the Contingent Negative Variation. Int. J. Psychophysiol. 2018, 128, 52–61. [Google Scholar] [CrossRef] [PubMed]
  34. Battaglini, L.; Casco, C.; Isaacs, B.R.; Bridges, D.; Ganis, G. Electrophysiological Correlates of Motion Extrapolation: An Investigation on the CNV. Neuropsychologia 2017, 95, 86–93. [Google Scholar] [CrossRef] [PubMed]
  35. Van Rijn, H.; Kononowicz, T.W.; Meck, W.H.; Ng, K.K.; Penney, T.B. Contingent Negative Variation and Its Relation to Time Estimation: A Theoretical Evaluation. Front. Integr. Neurosci. 2011, 5, 91. [Google Scholar] [CrossRef] [PubMed]
  36. Al Boustani, G.; Weiß, L.J.K.; Li, H.; Meyer, S.M.; Hiendlmeier, L.; Rinklin, P.; Menze, B.; Hemmert, W.; Wolfrum, B. Influence of Auditory Cues on the Neuronal Response to Naturalistic Visual Stimuli in a Virtual Reality Setting. Front. Hum. Neurosci. 2022, 16, 809293. [Google Scholar] [CrossRef]
  37. Hart, S.G.; Staveland, L.E. Development of NASA-TLX (Task Load Index): Results of Empirical and Theoretical Research. Adv. Psychol. 1988, 52, 139–183. [Google Scholar] [CrossRef]
  38. Kennedy, R.S.; Lane, N.E.; Berbaum, K.S.; Lilienthal, M.G. Simulator Sickness Questionnaire: An Enhanced Method for Quantifying Simulator Sickness. Int. J. Aviat. Psychol. 1993, 3, 203–220. [Google Scholar] [CrossRef]
  39. Witmer, B.G.; Singer, M.J. Measuring Presence in Virtual Environments: A Presence Questionnaire. Presence 1998, 7, 225–240. [Google Scholar] [CrossRef]
  40. Llinares, C.; Higuera-Trujillo, J.L.; Montañana, A.; Castilla, N. Improving the Pedestrian’s Perceptions of Safety on Street Crossings. Psychological and Neurophysiological Effects of Traffic Lanes, Artificial Lighting, and Vegetation. Int. J. Environ. Res. Public Health 2020, 17, 8576. [Google Scholar] [CrossRef]
  41. Dinh, H.Q.; Walker, N.; Hodges, L.F.; Song, C.; Kobayashi, A. Evaluating the Importance of Multi-Sensory Input on Memory and the Sense of Presence in Virtual Environments. In Proceedings of the IEEE Virtual Reality (Cat. No. 99CB36316), Houston, TX, USA, 13–17 March 1999; pp. 222–228. [Google Scholar]
  42. Nan, C.; Wang, G.; Wang, H.; Wang, X.; Liu, Z.; Xiao, L.; Bai, H.; Wu, S. The P300 Component Decreases in a Bimodal Oddball Task in Individuals with Depression: An Event-Related Potentials Study. Clin. Neurophysiol. 2018, 129, 2525–2533. [Google Scholar] [CrossRef] [PubMed]
  43. Lockley, S.W.; Evans, E.E.; Scheer, F.A.J.L.; Brainard, G.C.; Czeisler, C.A.; Aeschbach, D. Short-Wavelength Sensitivity for the Direct Effects of Light on Alertness, Vigilance, and the Waking Electroencephalogram in Humans. Sleep 2006, 29, 161–168. [Google Scholar] [CrossRef]
  44. Vandewalle, G.; Maquet, P.; Dijk, D.J. Light as a Modulator of Cognitive Brain Function. Trends Cogn. Sci. 2009, 13, 429–438. [Google Scholar] [CrossRef]
  45. Pala, P.; Cavallo, V.; Dang, N.T.; Granié, M.A.; Schneider, S.; Maruhn, P.; Bengler, K. Analysis of Street-Crossing Behavior: Comparing a CAVE Simulator and a Head-Mounted Display among Younger and Older Adults. Accid. Anal. Prev. 2021, 152, 106004. [Google Scholar] [CrossRef] [PubMed]
  46. Brunia, C.H.M.; Damcn, E.J.P. Distribution of Slow Brain Potentials Related to Motor Preparation and Stimulus Anticipation in a Time Estimation Task. Electroencephalogr. Clin. Neurophysiol. 1988, 69, 234–243. [Google Scholar] [CrossRef] [PubMed]
  47. Protzak, J.; Wiczorek, R. On the Influence of Walking on Hazard Detection for Prospective User-Centered Design of an Assistance System for Older Pedestrians. i-com 2017, 16, 87–98. [Google Scholar] [CrossRef]
  48. Dommes, A.; Cavallo, V. The Role of Perceptual, Cognitive, and Motor Abilities in Street-Crossing Decisions of Young and Older Pedestrians. Ophthalmic Physiol. Opt. 2011, 31, 292–301. [Google Scholar] [CrossRef]
  49. Patelaki, E.; Foxe, J.J.; Mazurek, K.A.; Freedman, E.G. Young Adults Who Improve Performance during Dual-Task Walking Show More Flexible Reallocation of Cognitive Resources: A Mobile Brain-Body Imaging (MoBI) Study. Cereb. Cortex 2023, 33, 2573–2592. [Google Scholar] [CrossRef]
  50. De Arquer, I.; Nogareda, C. NTP 544: Estimación de La Carga Mental de Trabajo: El Método NASA TLX. Madrid: Instituto Nacional de Higiene y Seguridad en el Trabajo, Ministerio de Trabajo y Seguridad Social del Gobierno de España. 2000. Available online: https://www.insst.es/documents/94886/326853/ntp_544.pdf/ (accessed on 27 March 2024).
  51. Jerome, C.J.; Singer, M.J. The Factor Structure of the Presence Questionnaire. Presence Teleoperators Virtual Environ. 2005, 14, 298–312. [Google Scholar]
  52. Delorme, A.; Makeig, S. EEGLAB: An Open Source Toolbox for Analysis of Single-Trial EEG Dynamics Including Independent Component Analysis. J. Neurosci. Methods 2004, 134, 9–21. [Google Scholar] [CrossRef] [PubMed]
  53. Chang, C.Y.; Hsu, S.H.; Pion-Tonachini, L.; Jung, T.P. Evaluation of Artifact Subspace Reconstruction for Automatic Artifact Components Removal in Multi-Channel EEG Recordings. IEEE Trans. Biomed. Eng. 2020, 67, 1114–1121. [Google Scholar] [CrossRef] [PubMed]
  54. Pizzamiglio, S.; Naeem, U.; Abdalla, H.; Turner, D.L. Neural Correlates of Single-and Dual-Task Walking in the Real World. Front. Hum. Neurosci. 2017, 11, 460. [Google Scholar] [CrossRef]
  55. Patelaki, E.; Foxe, J.J.; Mantel, E.P.; Kassis, G.; Freedman, E.G. Paradoxical Improvement of Cognitive Control in Older Adults under Dual-Task Walking Conditions Is Associated with More Flexible Reallocation of Neural Resources: A Mobile Brain-Body Imaging (MoBI) Study. Neuroimage 2023, 273, 120098. [Google Scholar] [CrossRef]
Figure 1. Schematic representation of the methodological approach followed in this work. The initial and experimental phases are detailed in Section 2. Data analysis is covered in Section 3.
Electronics 13 01453 g001
Figure 2. The EEG and VR equipment: (a) Main components of the EEG recorder kit; (b) Main components of the VR equipment; (c) The final setup worn by participants during the experiments. Readers may refer to Table 1 for the description and numbering of components.
Electronics 13 01453 g002
Figure 3. Interfaces within the VR application: (a) Main interface to create/load users and select a trial scenario; (b) Interface for customizing audio files (ambient and engines).
Electronics 13 01453 g003
Figure 4. Sketch scenario with calibrated limits. The red circle represents the center of the playing area.
Electronics 13 01453 g004
Figure 5. A view of the VR scenario, where the different tasks are executed. The avatar is placed in the typical starting position of each task.
Electronics 13 01453 g005
Figure 6. The experimenter interface used to monitor participants’ activity in the VR environment.
Electronics 13 01453 g006
Figure 7. Views of the user engaged in the TTA-estimation task: (a) Perspective view showing a green box to highlight the area within which the vehicle remains invisible to the participant. This box is not displayed to users; (b) The point of view of the user seeing the vehicle approaching him/her.
Electronics 13 01453 g007
Figure 8. The ERP responses across four cueing conditions in the TTA paradigm. The shaded areas delineate the Early-CNV ERP component, spanning from 400 to 1500 milliseconds post-stimulus. On the (left), the grand average ERP responses, time-locked to the cue stimuli at electrodes FZ, FC1, CZ, and FC2, for conditions 33 (black line) and 53 (red line), are shown. On the (right), the figure similarly displays grand average ERP responses for conditions 55 (black line) and 35 (red line).
Electronics 13 01453 g008
Figure 9. Comparison of the ERPs within the Oddball (left) and dual task (right) paradigms. The shaded regions highlight the P3 ERP component between 250 to 450 milliseconds. In both panels, the grand average ERP is shown with responses time-locked to electrodes FZ, CZ, and PZ for three distinct stimuli: the target (black line), distractor (in blue), and frequent (red line). Notably, the P3 mean amplitude is significantly higher (*) in the dual task scenario than in the Oddball task, with a statistical significance of p < 0.001.
Electronics 13 01453 g009
Figure 10. The Simulator Sickness Questionnaire scores for each symptom category—Nausea (N), Oculomotor Discomfort (O), and Disorientation (D)—across various conditions: pre-resting, post-resting, TTA task, Oddball task, and Dual task. The SSQ scores are systematically presented to illustrate the differential impact of each task condition on participants’ reported symptoms. Comparisons between conditions that are statistically significant are denoted by an asterisk (*).
Electronics 13 01453 g010
Figure 11. The NASA Task Load Index scores across various dimensions: mental demand, physical demand, temporal demand, performance, effort, and frustration, for each experimental condition—resting, TTA, Oddball, and dual task. The figure provides a comprehensive overview of the cognitive and physical workload experienced by participants under each condition. Differences between conditions that are statistically significant are indicated by an asterisk (*).
Electronics 13 01453 g011
Table 1. Description of the EEG equipment used throughout this study. The index corresponds to the numbering in Figure 1 (blue refers to EEG equipment, green refers to VR equipment. See online copy of this article). The EEG equipment is a solution from Brain Products GmbH, Gilching, Germany.
Index EEG and VR EquipmentTechnical DetailsFunctional Description
Electronics 13 01453 i001ActiCAP snap electrodes cap32 channels cap with slide-in electrode holdersWorn by participants during experiments for EEG recordings
Electronics 13 01453 i002ActiCap slim 32 electrodes set (100 cm flat ribbon)32 high-quality Ag/AgCl slim active electrodes with LED feedbackPlugged into electrode cap for EEG recordings
Electronics 13 01453 i003Ground electrodeHigh-quality Ag/AgCl slim active electrode with LED feedbackPositioned at the frontopolar midline electrode site
Electronics 13 01453 i004Reference electrodeHigh-quality Ag/AgCl slim active electrode with LED feedbackPositioned at left mastoid
Electronics 13 01453 i005LiveAmp
  • Wireless data transmission: In 2.402 to 2.480 GHz ISM band
  • Sampling Rate: 500 Hz
Compact wireless EEG amplifier for mobile EEG to send wirelessly recorded data to the recording laptop
Electronics 13 01453 i006BrainVision Recorder software (EEG recording laptop) To register the EEG signal of the sessions coming from LiveAmp and the triggers sent by the TriggerBox
Electronics 13 01453 i007Wireless USB AntennaWireless data reception: In 2.402 to 2.480 GHz ISM band To receive the wireless data from LiveAmp
Electronics 13 01453 i008Wireless TriggerBox
  • Wireless data transmission: In the 2.4 GHz ISM band
  • Wireless transmission range: up to 10 m indoors
  • Minimum duration between two subsequent triggers: 50 ms
Connected to Sensor & Trigger Extension for LiveAmp, carried by participants, and to the VR laptop with a USB cable
Electronics 13 01453 i009Meta Quest II Headset
  • Qualcomm Snapdragon XR2 chipset
  • 6 GB LPDDR4X memory
  • Fast Switch LCD panel (1832 × 1932
    per eye)
  • 90 Hz refresh rate
  • 6DOF inside-out tracking through 4 built-in cameras
  • 2 built-in speakers for spatial sound
To display the VR scenario to the user and track their positional data
Electronics 13 01453 i010Meta Quest II Touch
Controller
  • 6DOF input controller with accelerometers and gyroscopes
  • 1 trigger, 2 buttons, and an analog joystick
To allow for user interaction in the different VR tasks
Electronics 13 01453 i011HP Omen 17 (cb1003ns)
VR laptop
  • Intel Core i7-10750H (2.6 GHz, 12 MB L3 cache, 6 cores)
  • 16 GB DDR4-2933 SDRAM (2 × 8 GB)
  • NVIDIA GeForce RTX 2060 (6 GB GDDR6 dedicated)
  • 512 GB PCIe NVMe M.2 SSD
To run the VR application as well as conduct and manage the experiments. It also sends the triggers to the TriggerBox through a USB 2.0 cable
Electronics 13 01453 i012TP-Link Archer C80-AC1900 Wi-Fi Router
  • 802.11ac Wave2 Wi-Fi—1300 Mbps on the 5 GHz
  • 4 × LAN and 1 × WAN Gigabit Ethernet ports
To receive the video and audio signal from the VR laptop through the LAN port and send them wirelessly to the Meta Quest II headset
Table 2. Mean (M) and standard error (SE) for the time-to-arrival (TTA) estimation and the amplitude registered for each electrode (FZ, FC1, FC2, and CZ) for the four TTA conditions (33, 35, 53, and 55).
ConditionTTA (ms)Electrode (μV)
FZFC1FC2CZ
30 km/h, 3 s (33)M583.16−3.188−3.293−1.530−3.185
SE156.701.2380.9791.1240.620
30 km/h, 5 s (35)M692.14−2.516−3.073−3.756−2.554
SE171.820.6880.4410.5871.340
50 km/h, 3 s (53)M831.15−2.451−4.659−3.323−4.187
SE313.321.2970.9990.6961.553
50 km/h, 5 s (55)M882.97−3.827−2.596−4.159−3.372
SE378.990.8620.5880.6611.505
Table 3. Behavioral and EEG measures in Oddball and dual task paradigms. Mean (M) and standard error (SE) for the RT and amplitude registered for each electrode (FZ, CZ, and PZ) at the target stimulus, and the mean percentage (%) of Correct, Incorrect, and Missed. The way these percentages are computed is described in Section 2.4.3.
ParadigmRT (ms)Correct (%)Incorrect (%)Missed (%)Electrode (μV)
FZCZPZ
OddballM462.7199.750.150.003.3413.6623.502
SE43.952.1571.5911.633
Dual TaskM460.8899.310.780.836.0046.1814.406
SE32.762.2473.0092.972
Disclaimer/Publisher’s Note: The statements, opinions and data contained in all publications are solely those of the individual author(s) and contributor(s) and not of MDPI and/or the editor(s). MDPI and/or the editor(s) disclaim responsibility for any injury to people or property resulting from any ideas, methods, instructions or products referred to in the content.

