
MW-Scale High-Voltage Direct-Current Power Conversion for Large-Spacecraft Electric Propulsion


Abstract
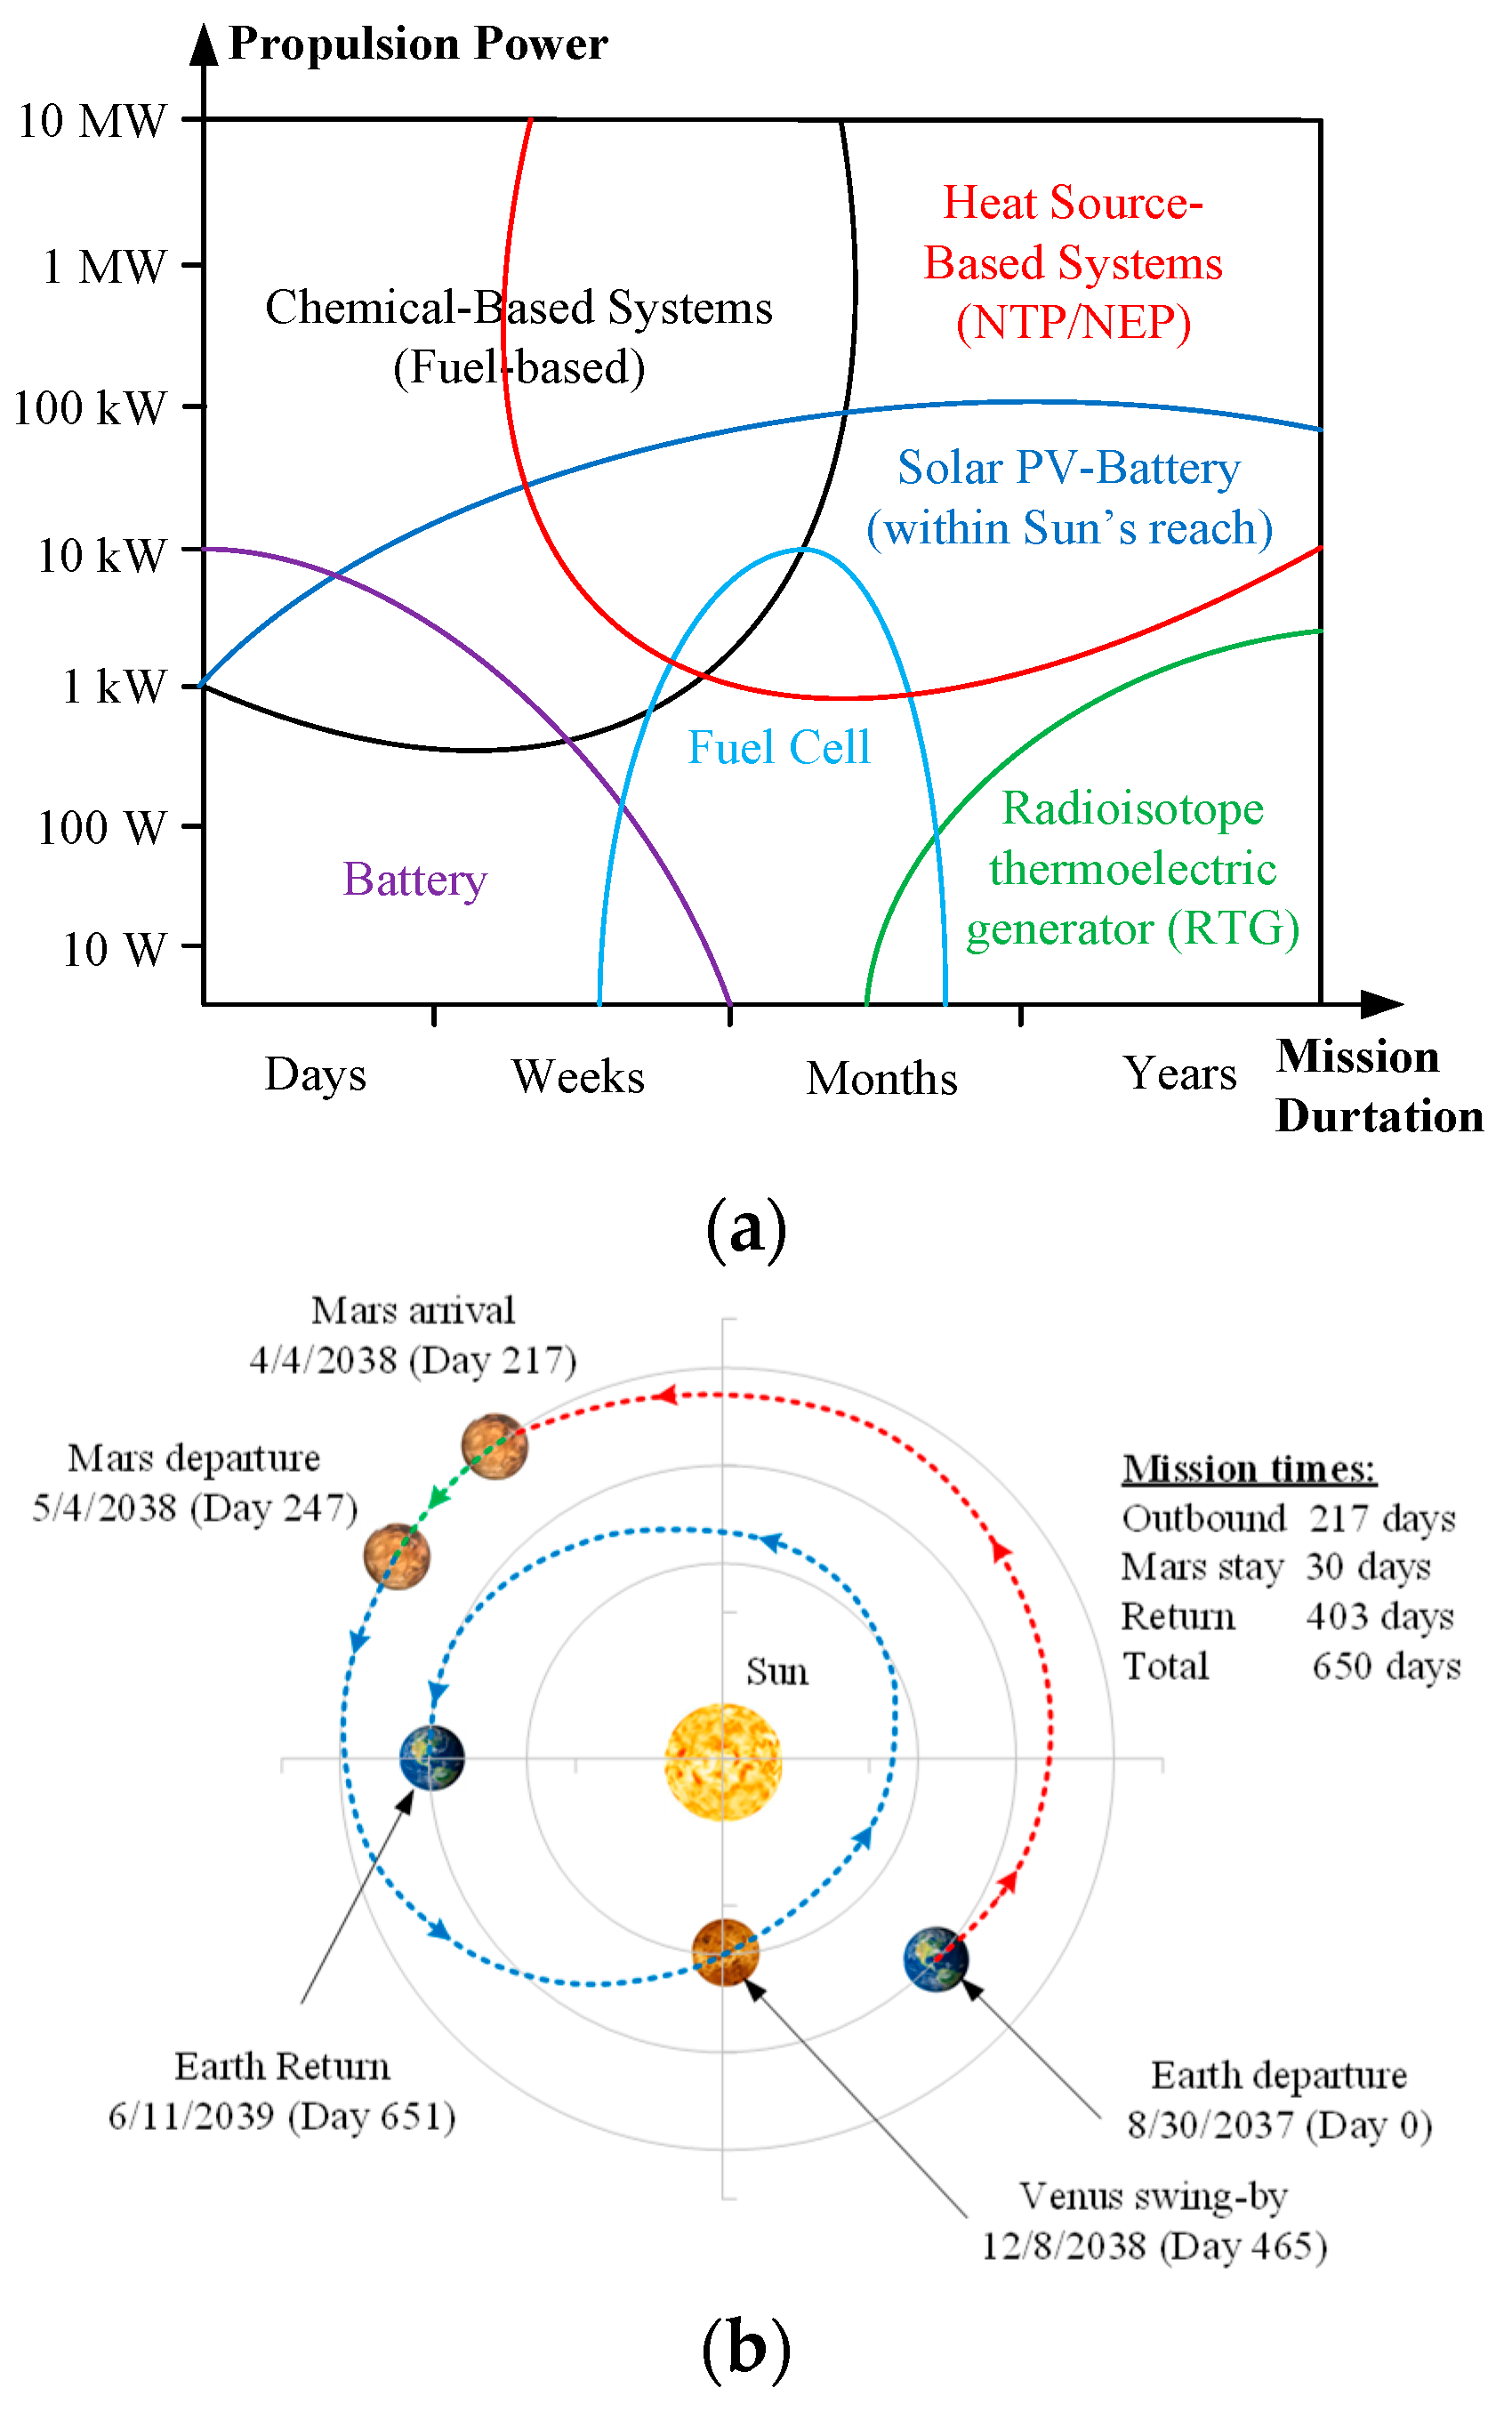
:1. Introduction
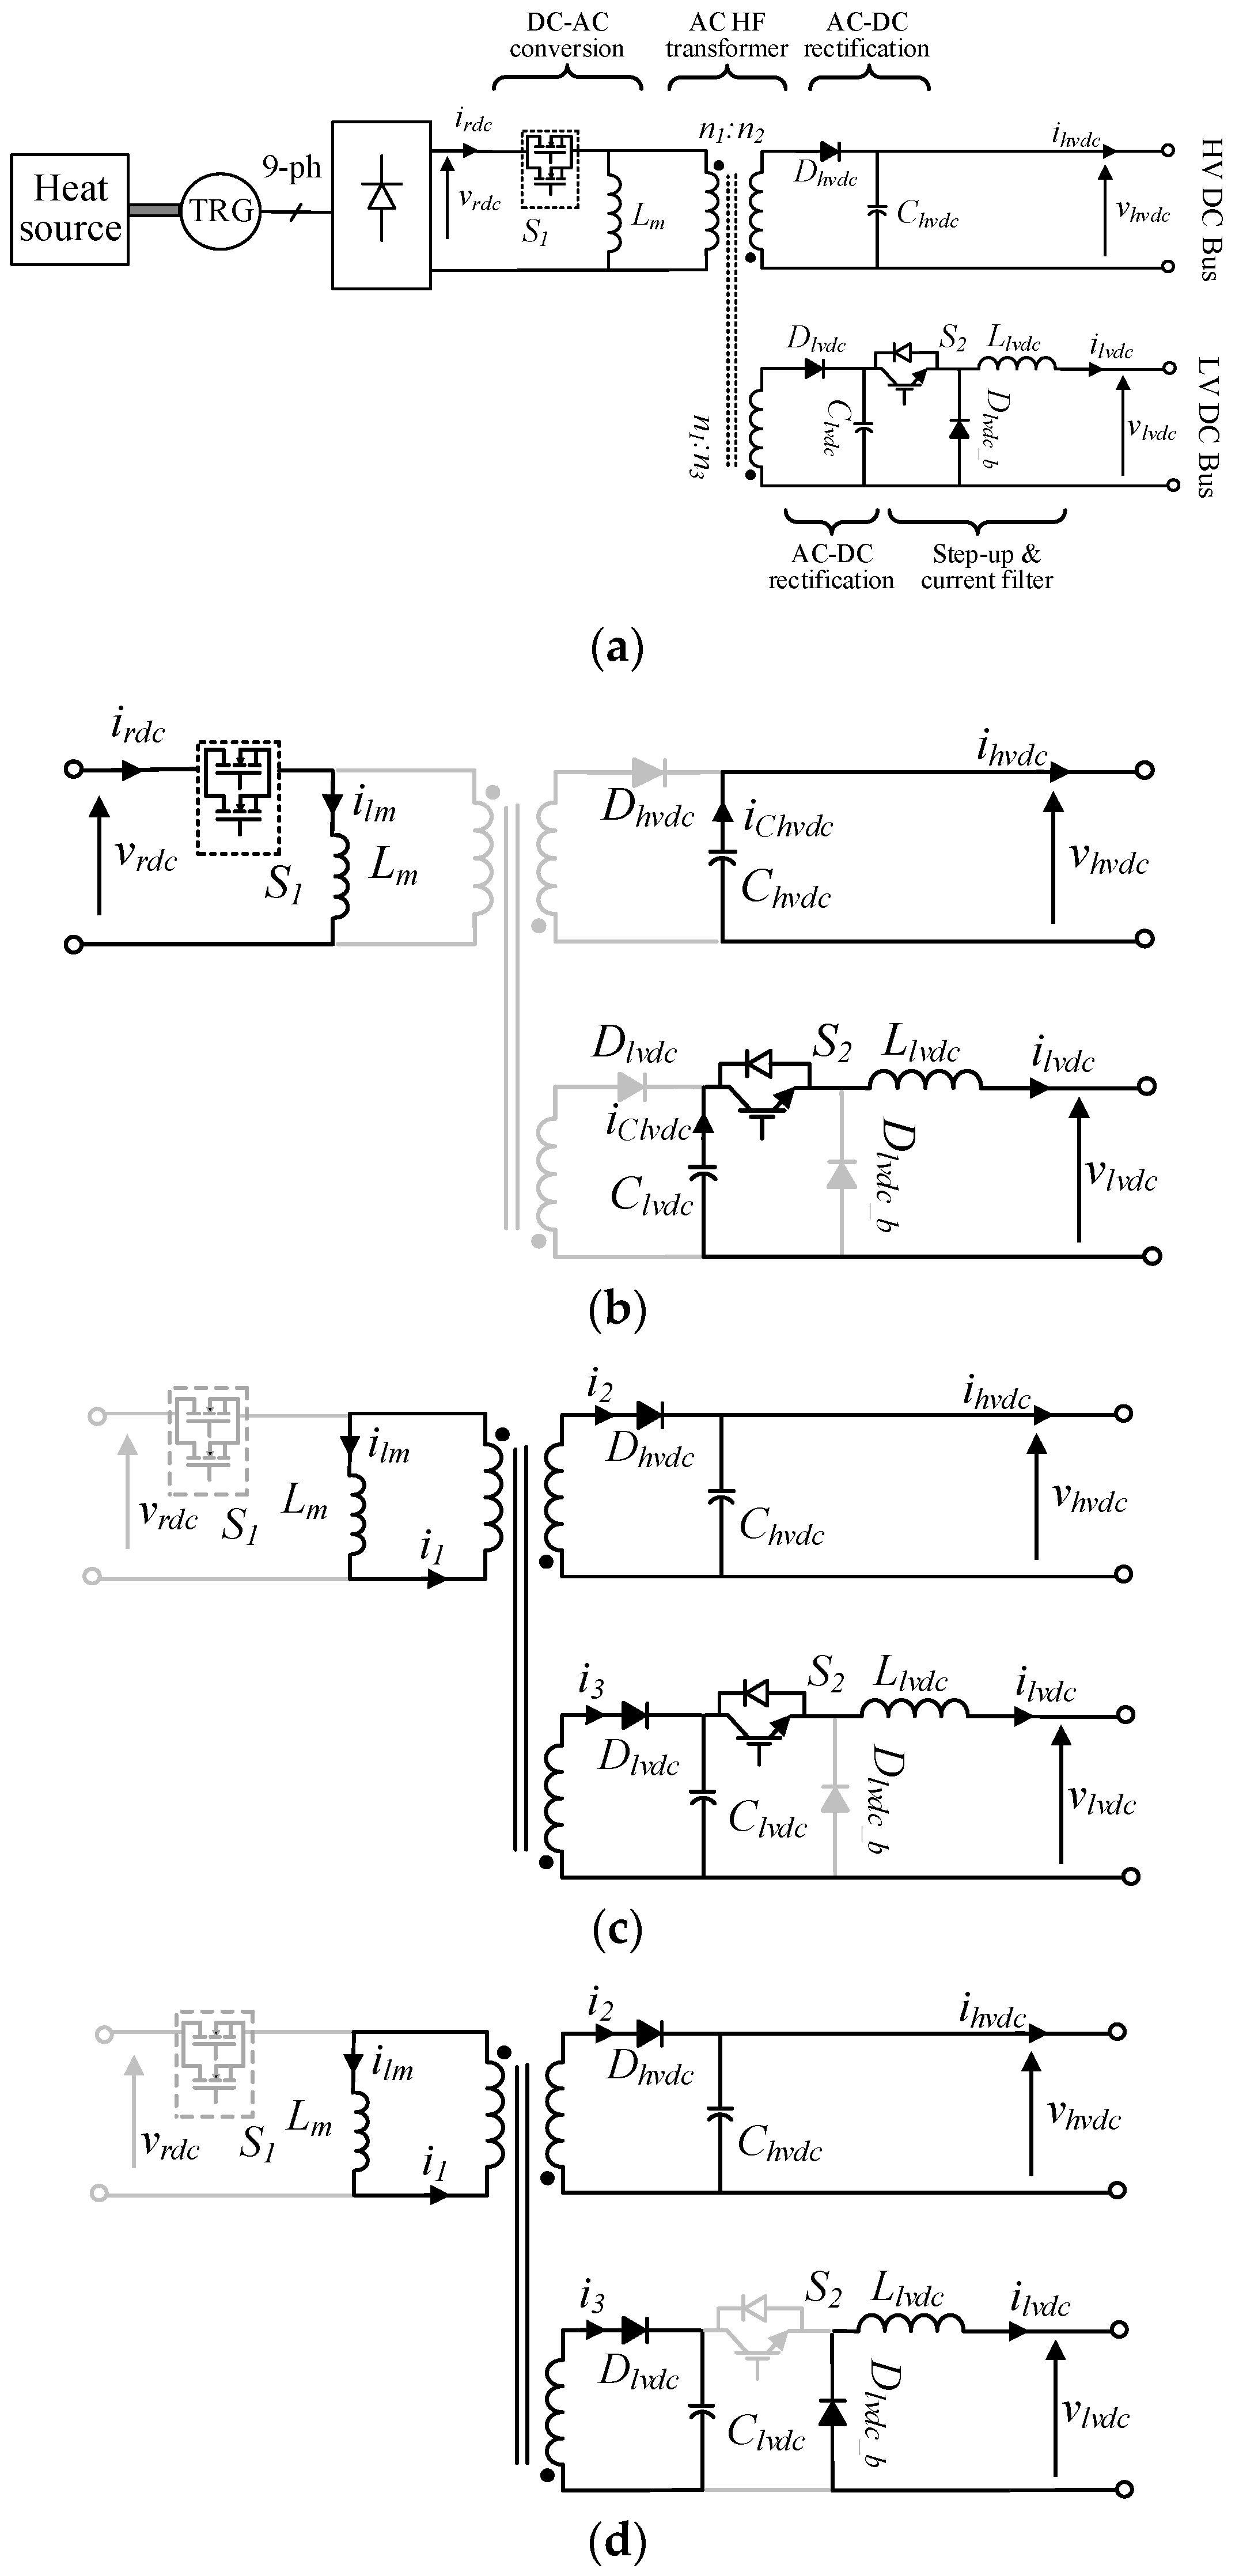
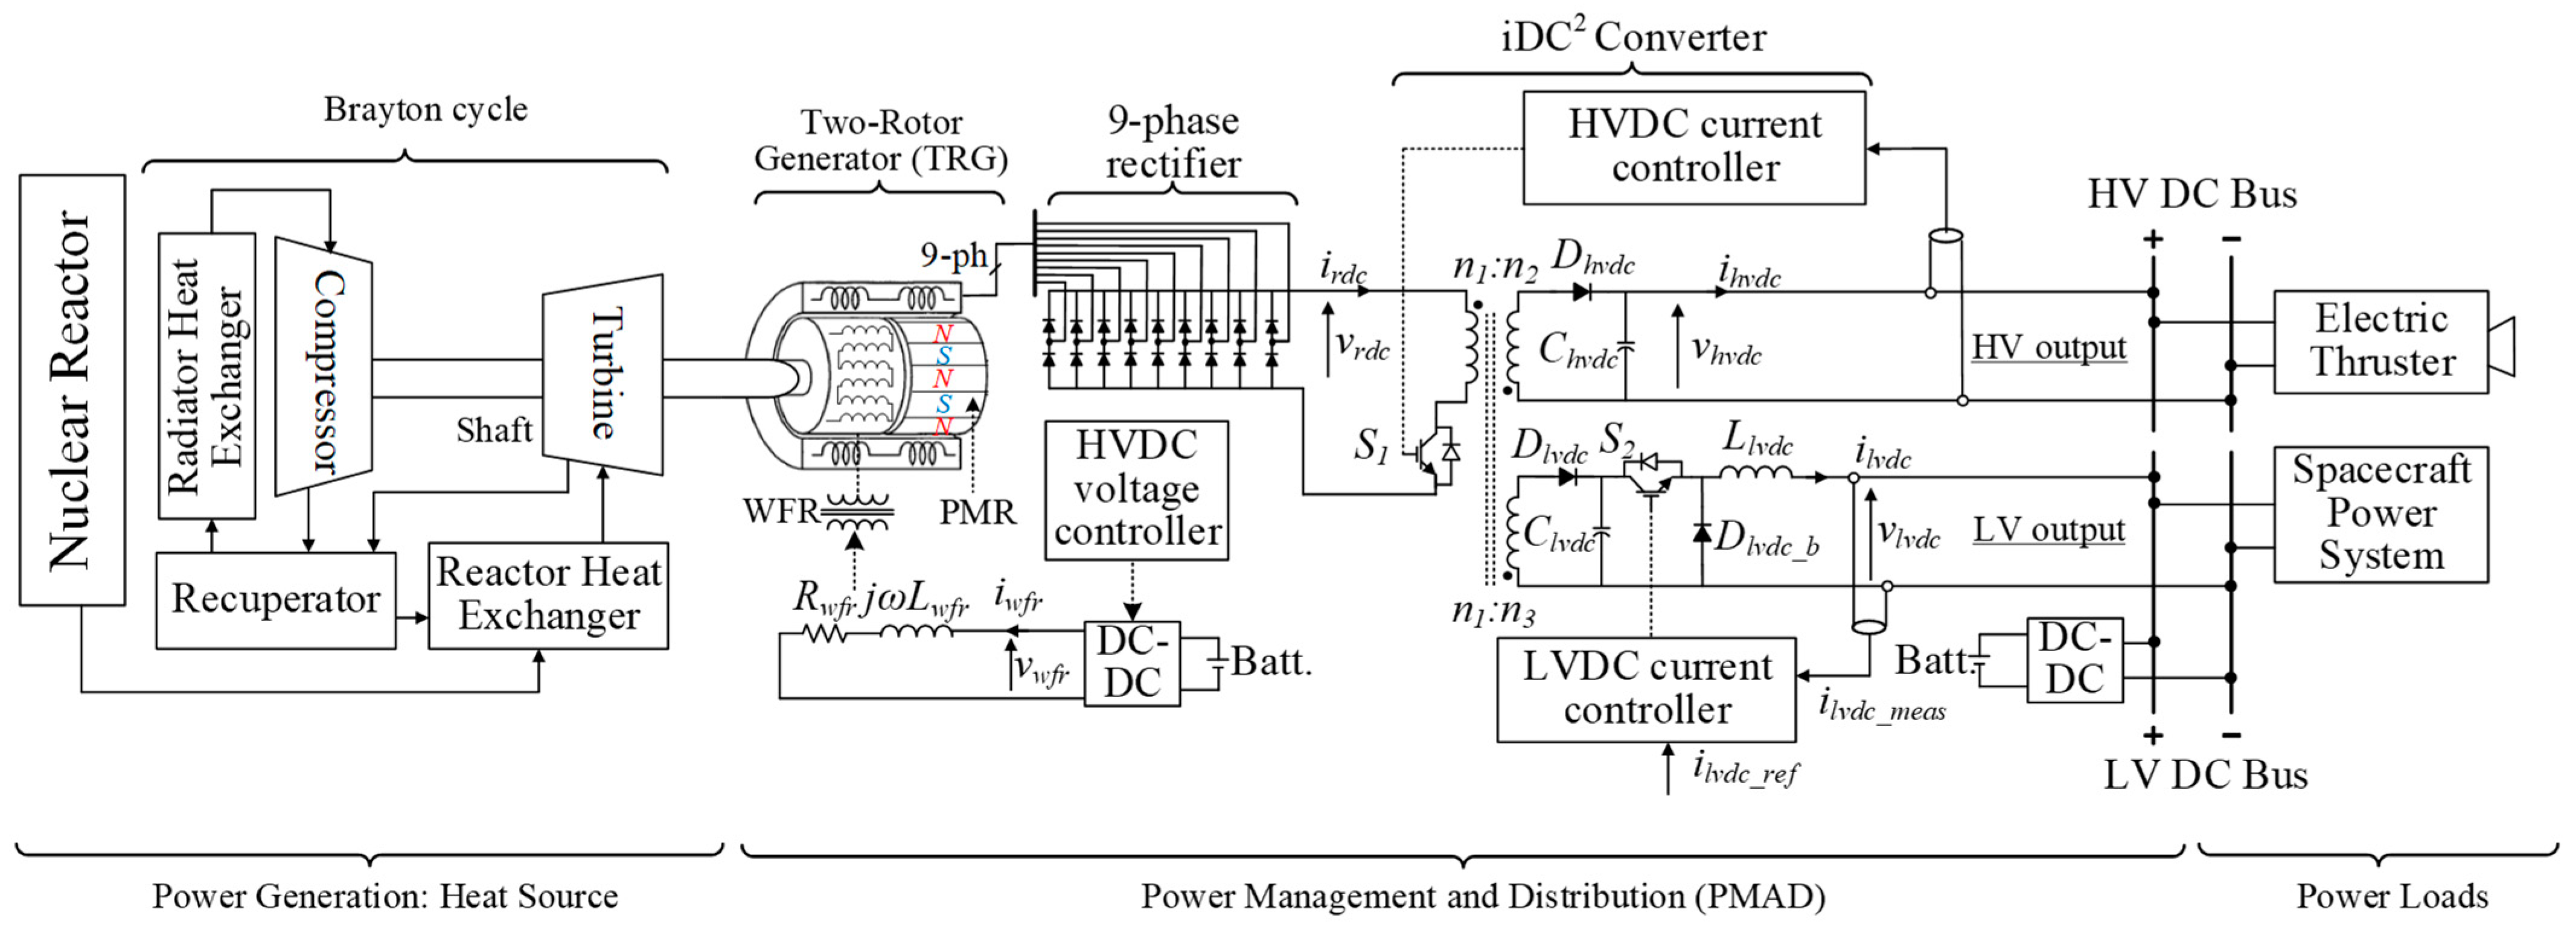
2. Proposed In-Space Electric Propulsion Scheme
3. Design Considerations
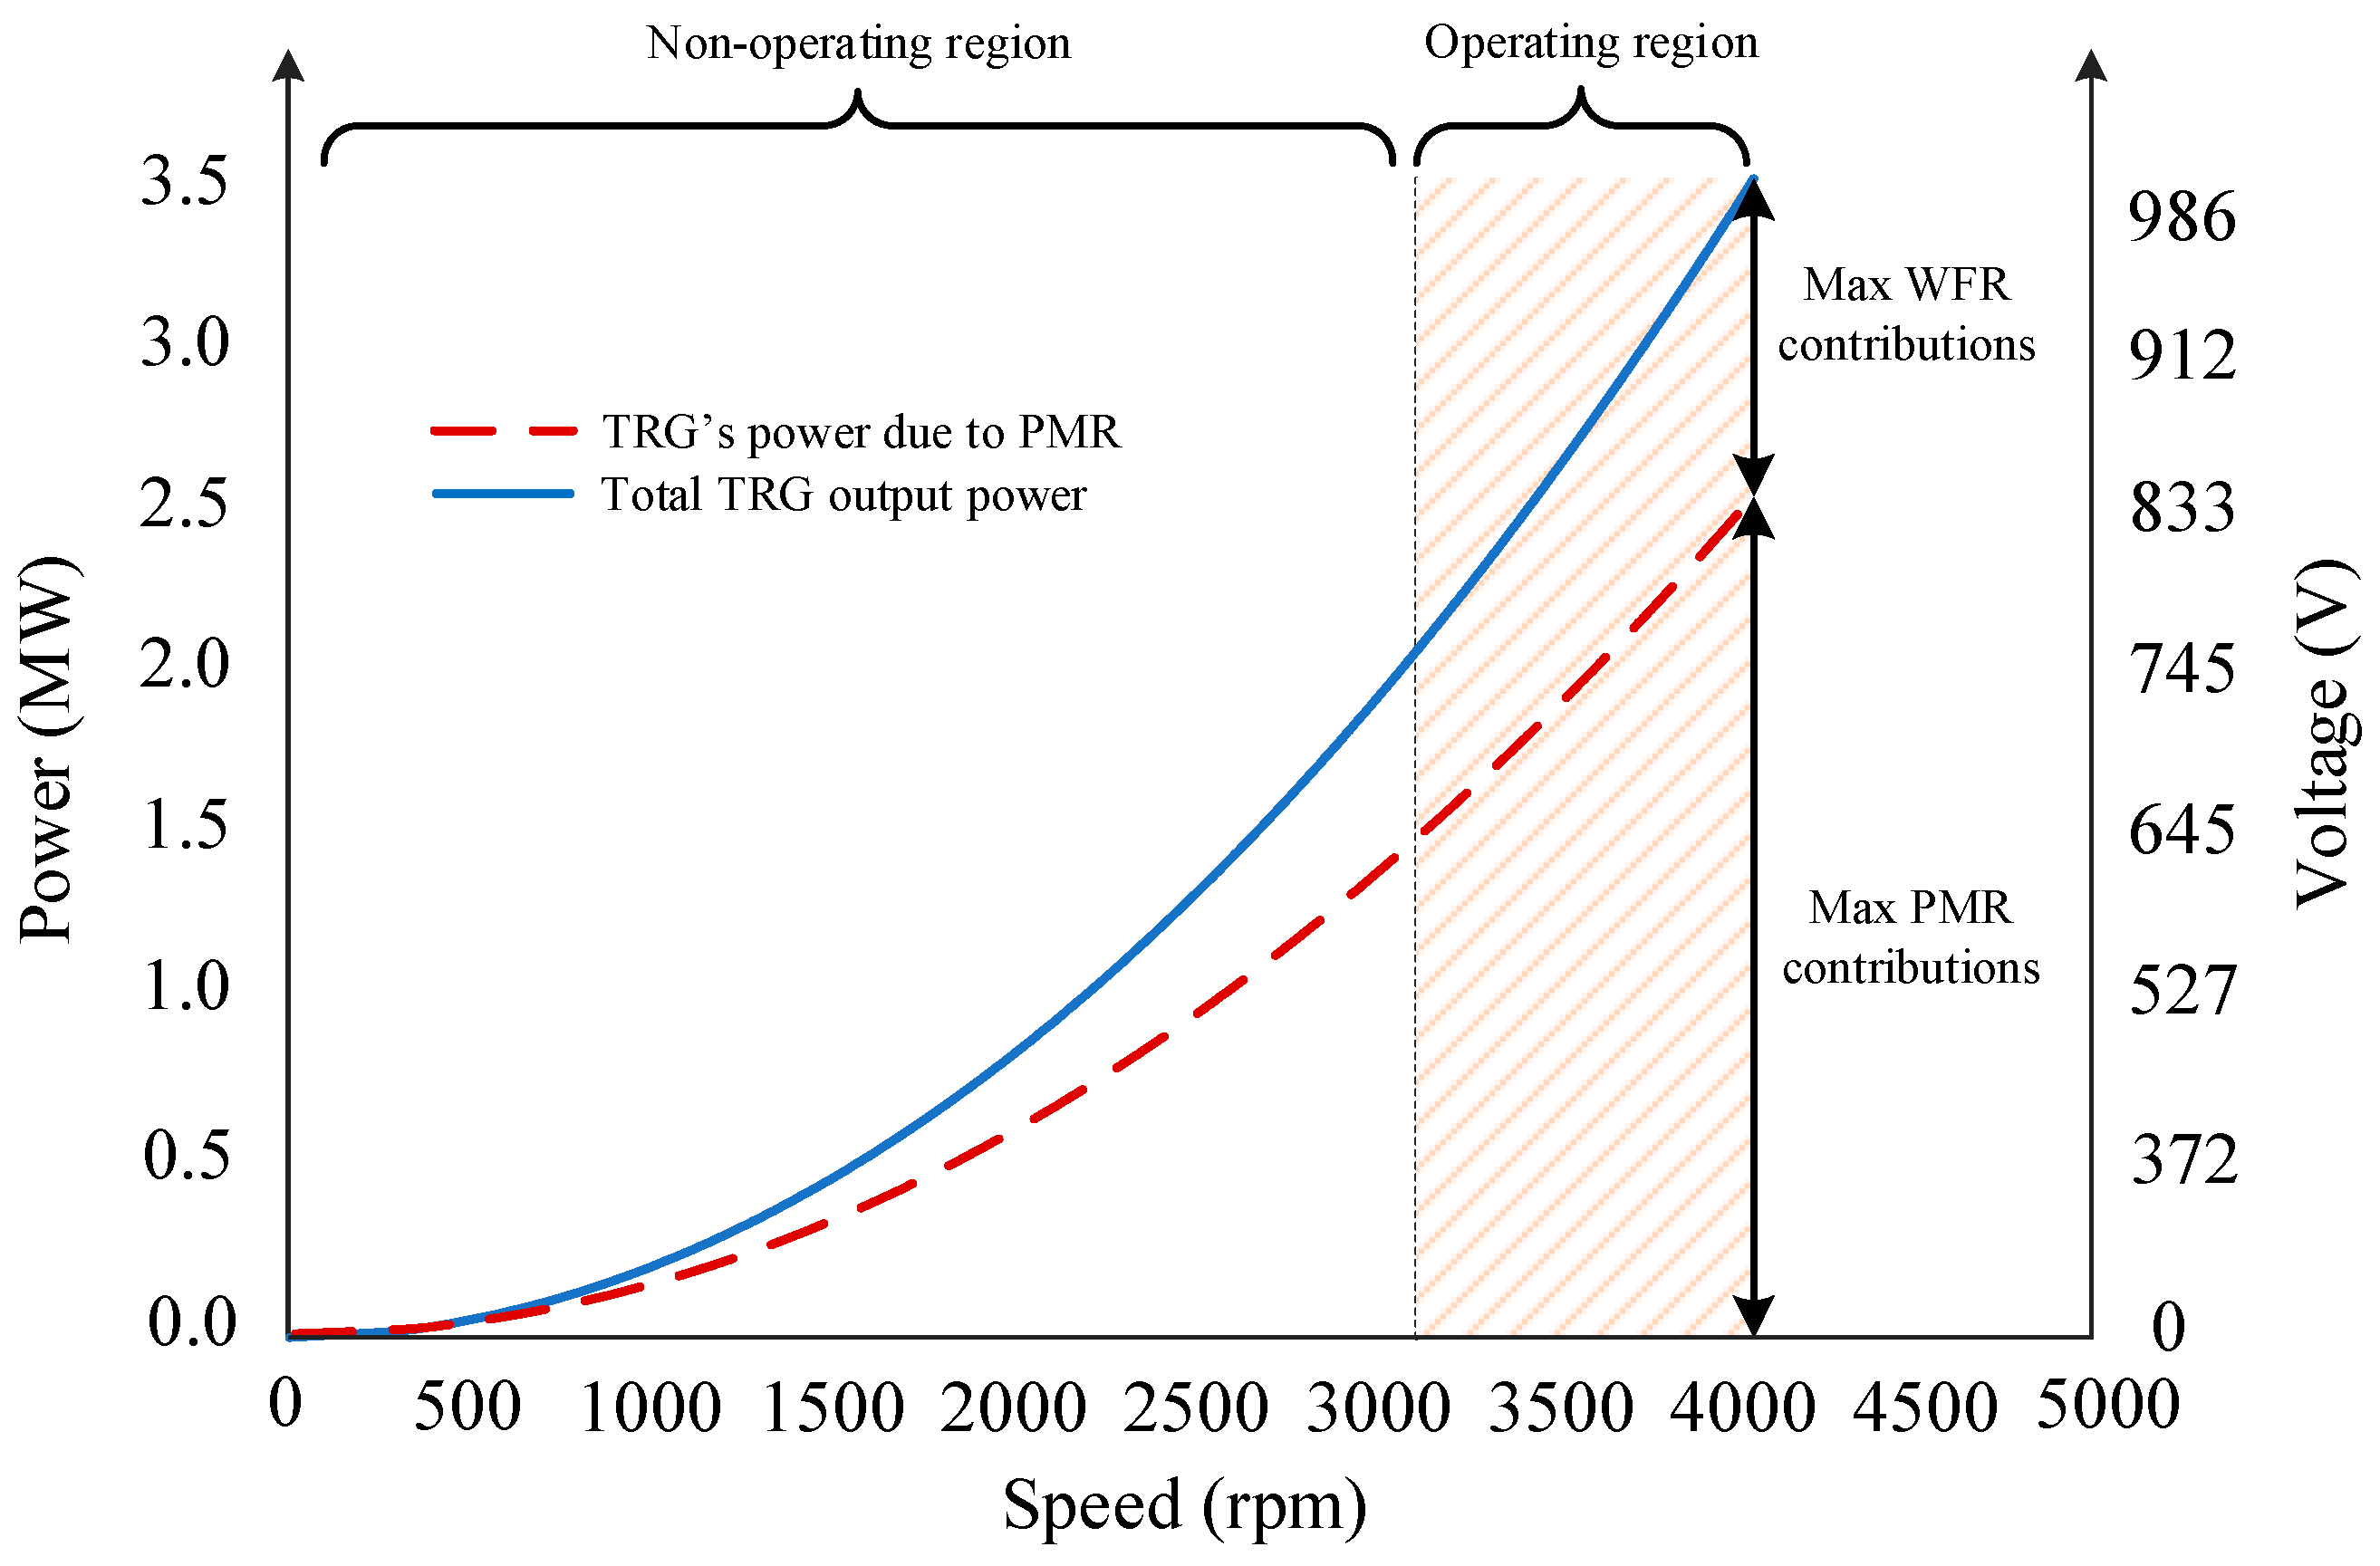
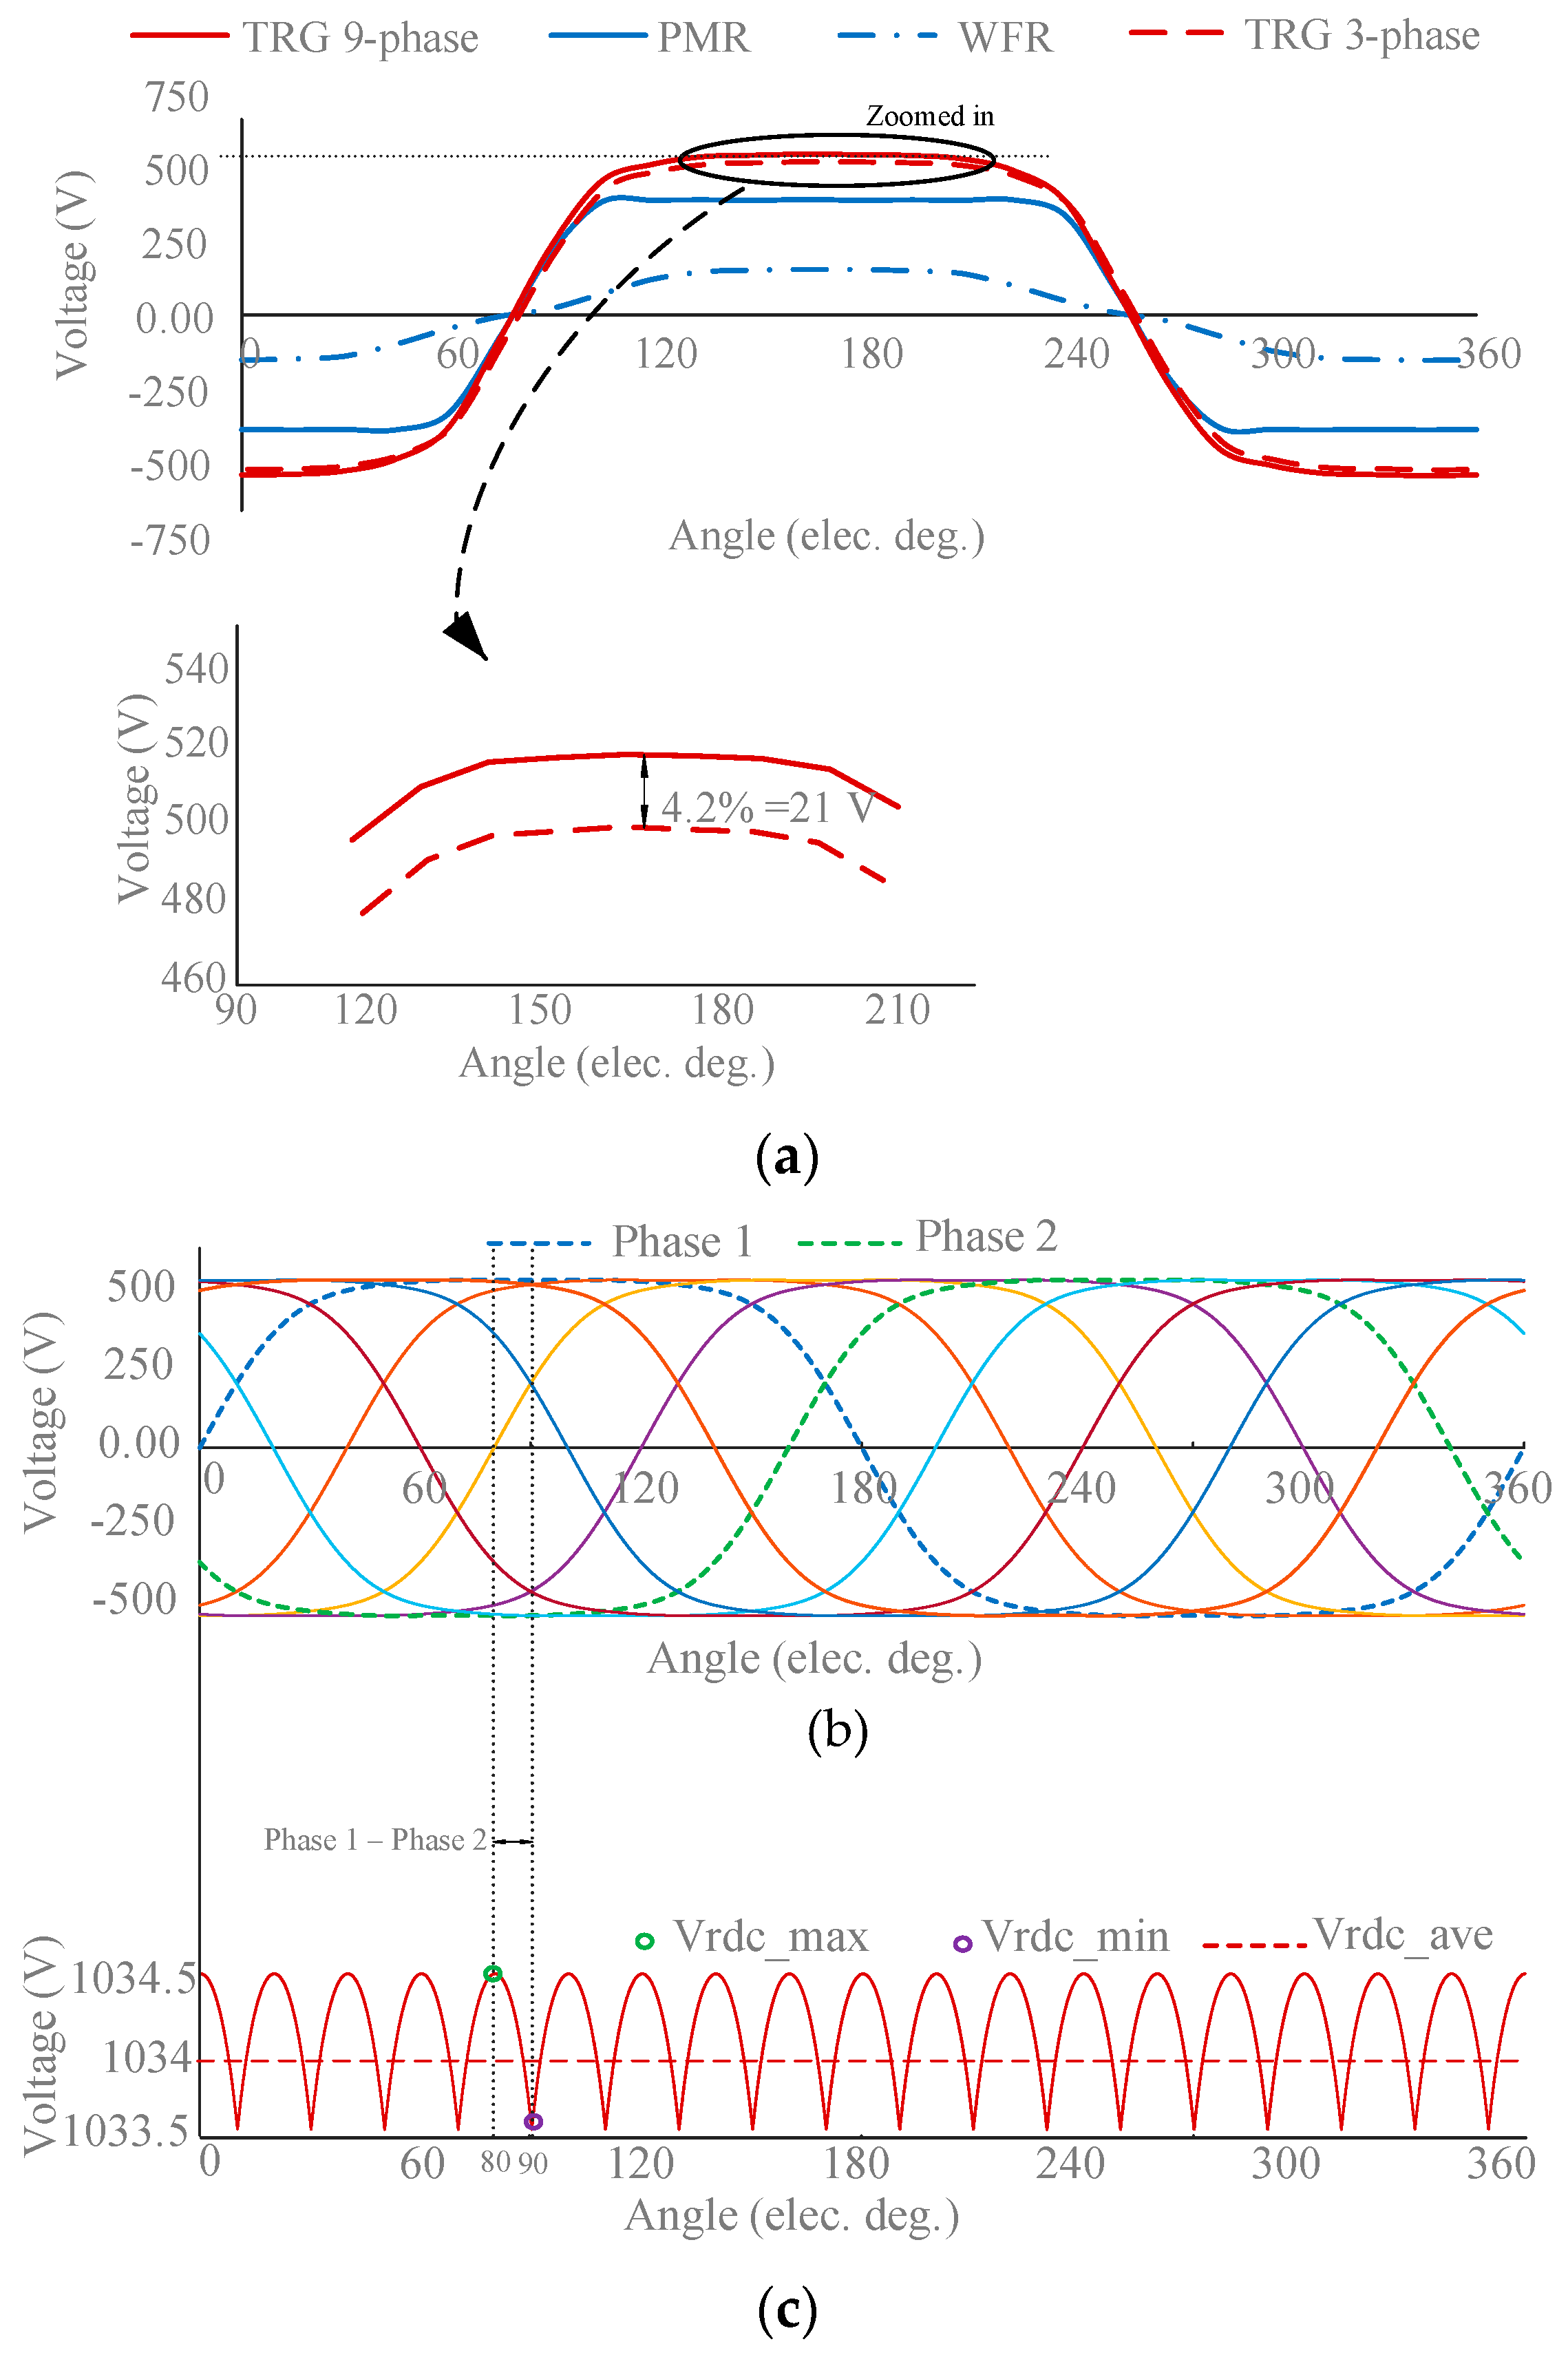
3.1. TRG
3.2. iDC2 Converter
- Mode 1 (Figure 5b: Switches : ON, : ON): Magnetizing inductance is energized, while the opposite polarity of transformer outputs with respect to the primary reverse-biases diodes and block the output current flow. The capacitors and will discharge to their respective output.
- Mode 2 (Figure 5c: Switches : OFF, : ON): Once the switch turns OFF, the stored energy in is discharged through the transformer’s primary winding to the outputs. Diodes and are forward-biased, transferring the energy to their respective output while charging capacitors and . In this mode, the inductor will be charged, while diode is reverse-biased.
- Mode 3 (Figure 5d: Switches : OFF, : OFF): The operation of the converter is similar to in Mode 2; however, in the step-down stage, as switch turns OFF, the diode is forward-biased, and the inductor will be discharged to the LVDC bus.
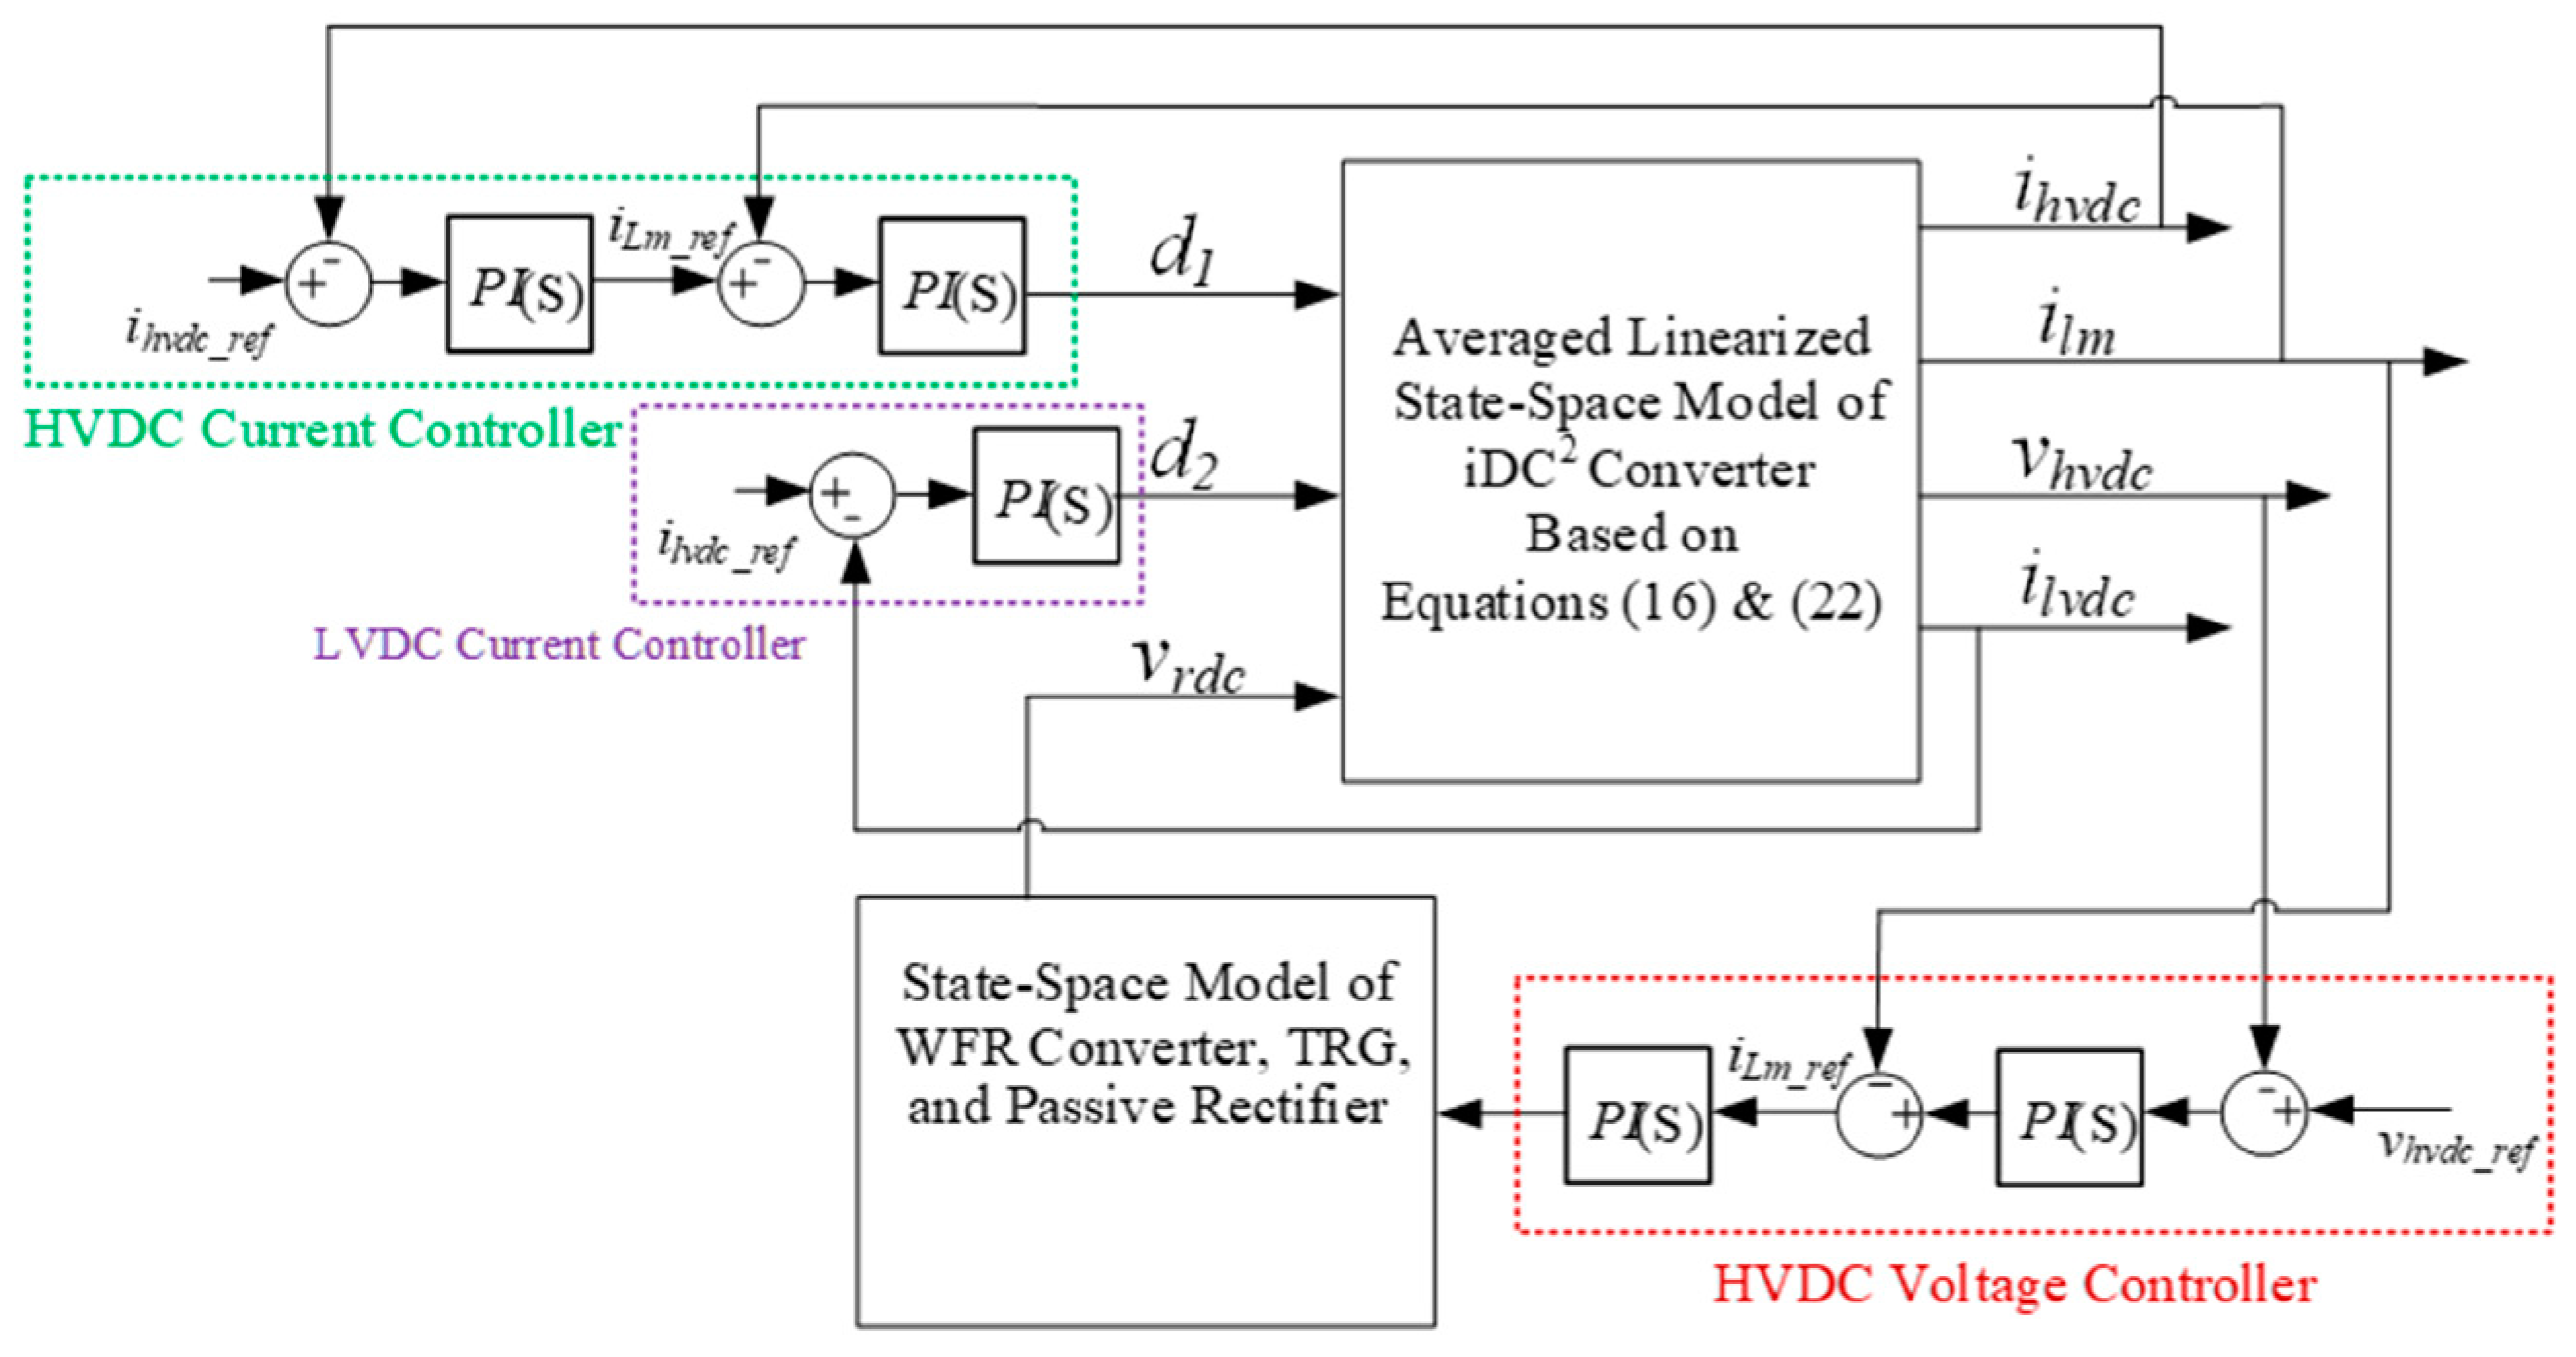
3.3. Controllers
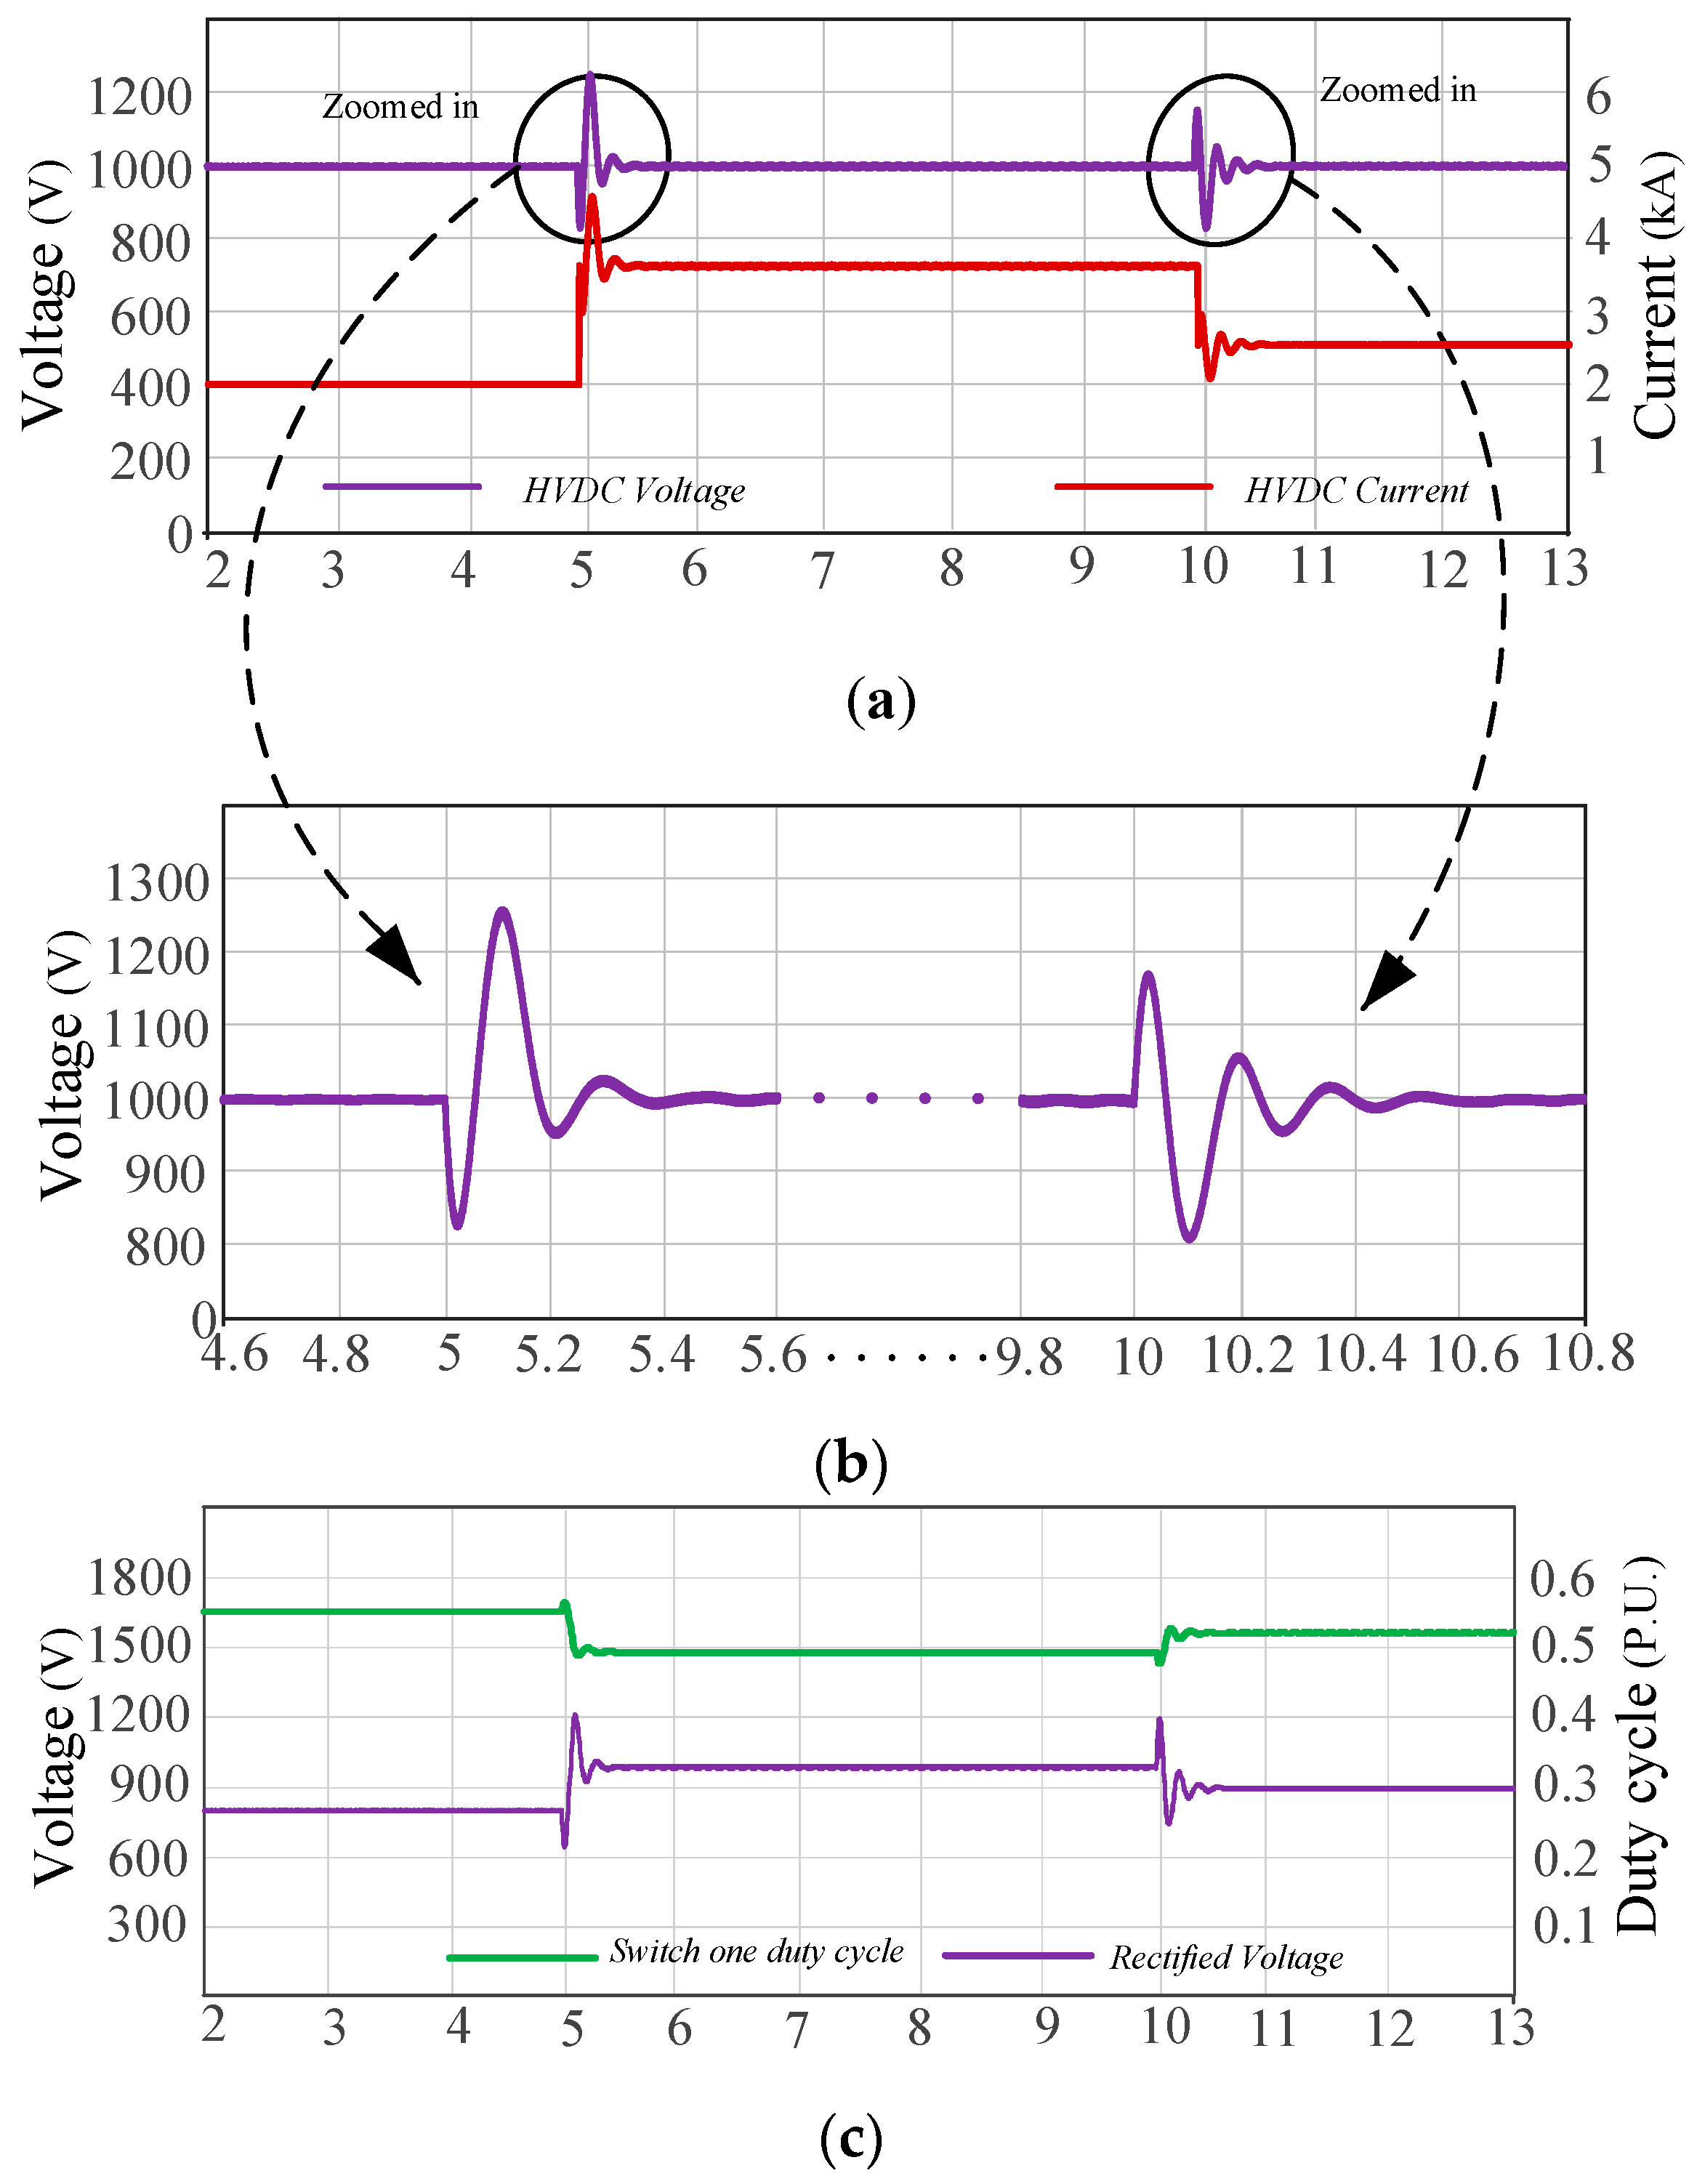
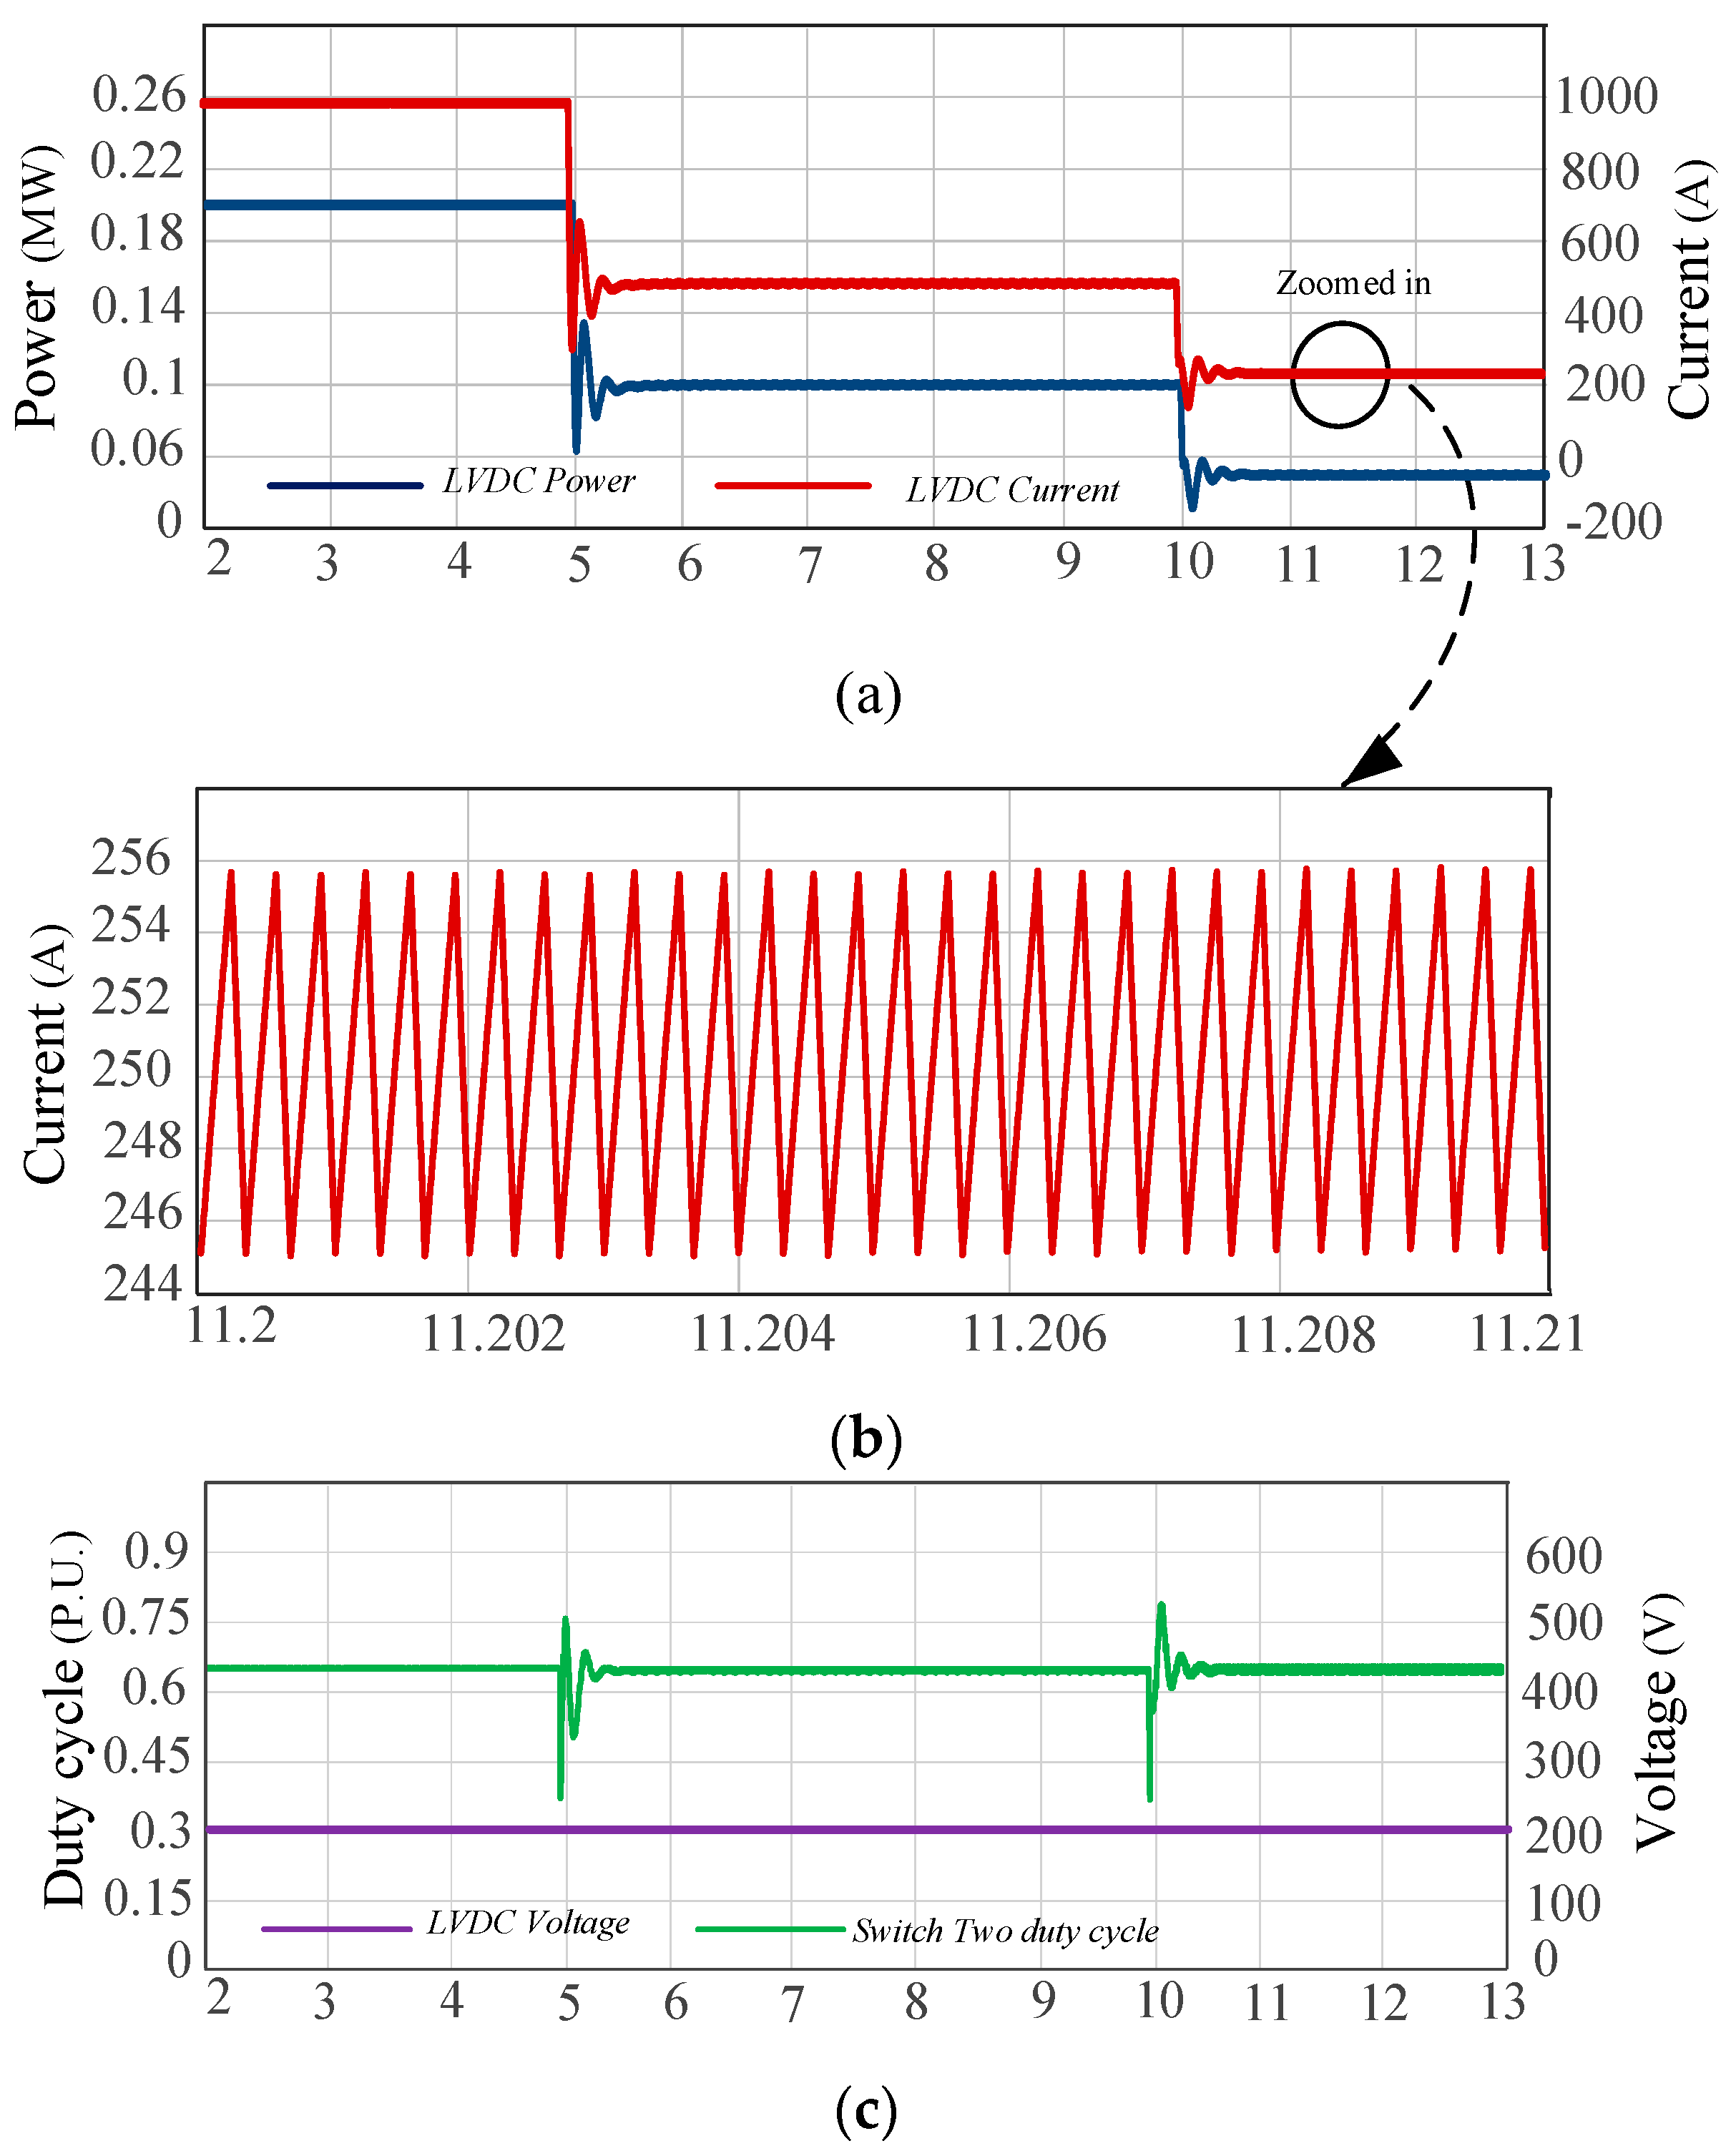
4. Simulation
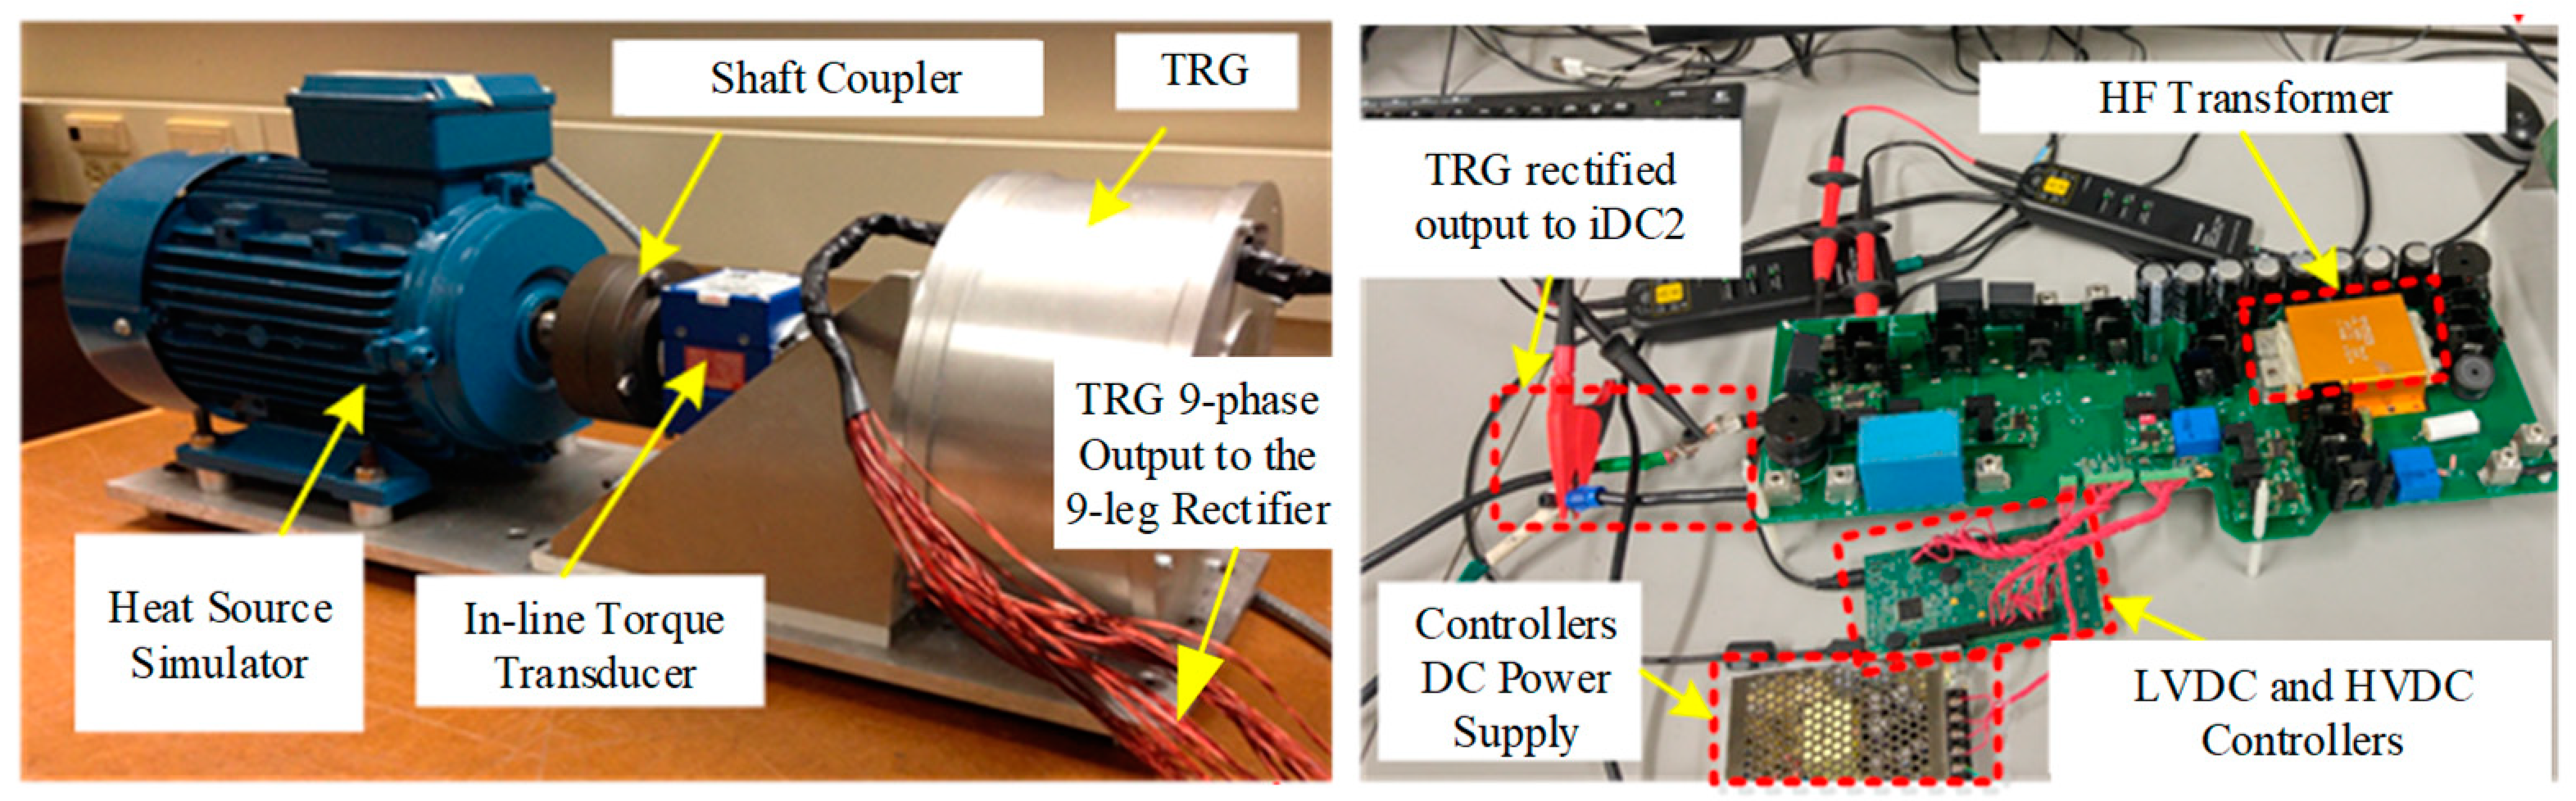
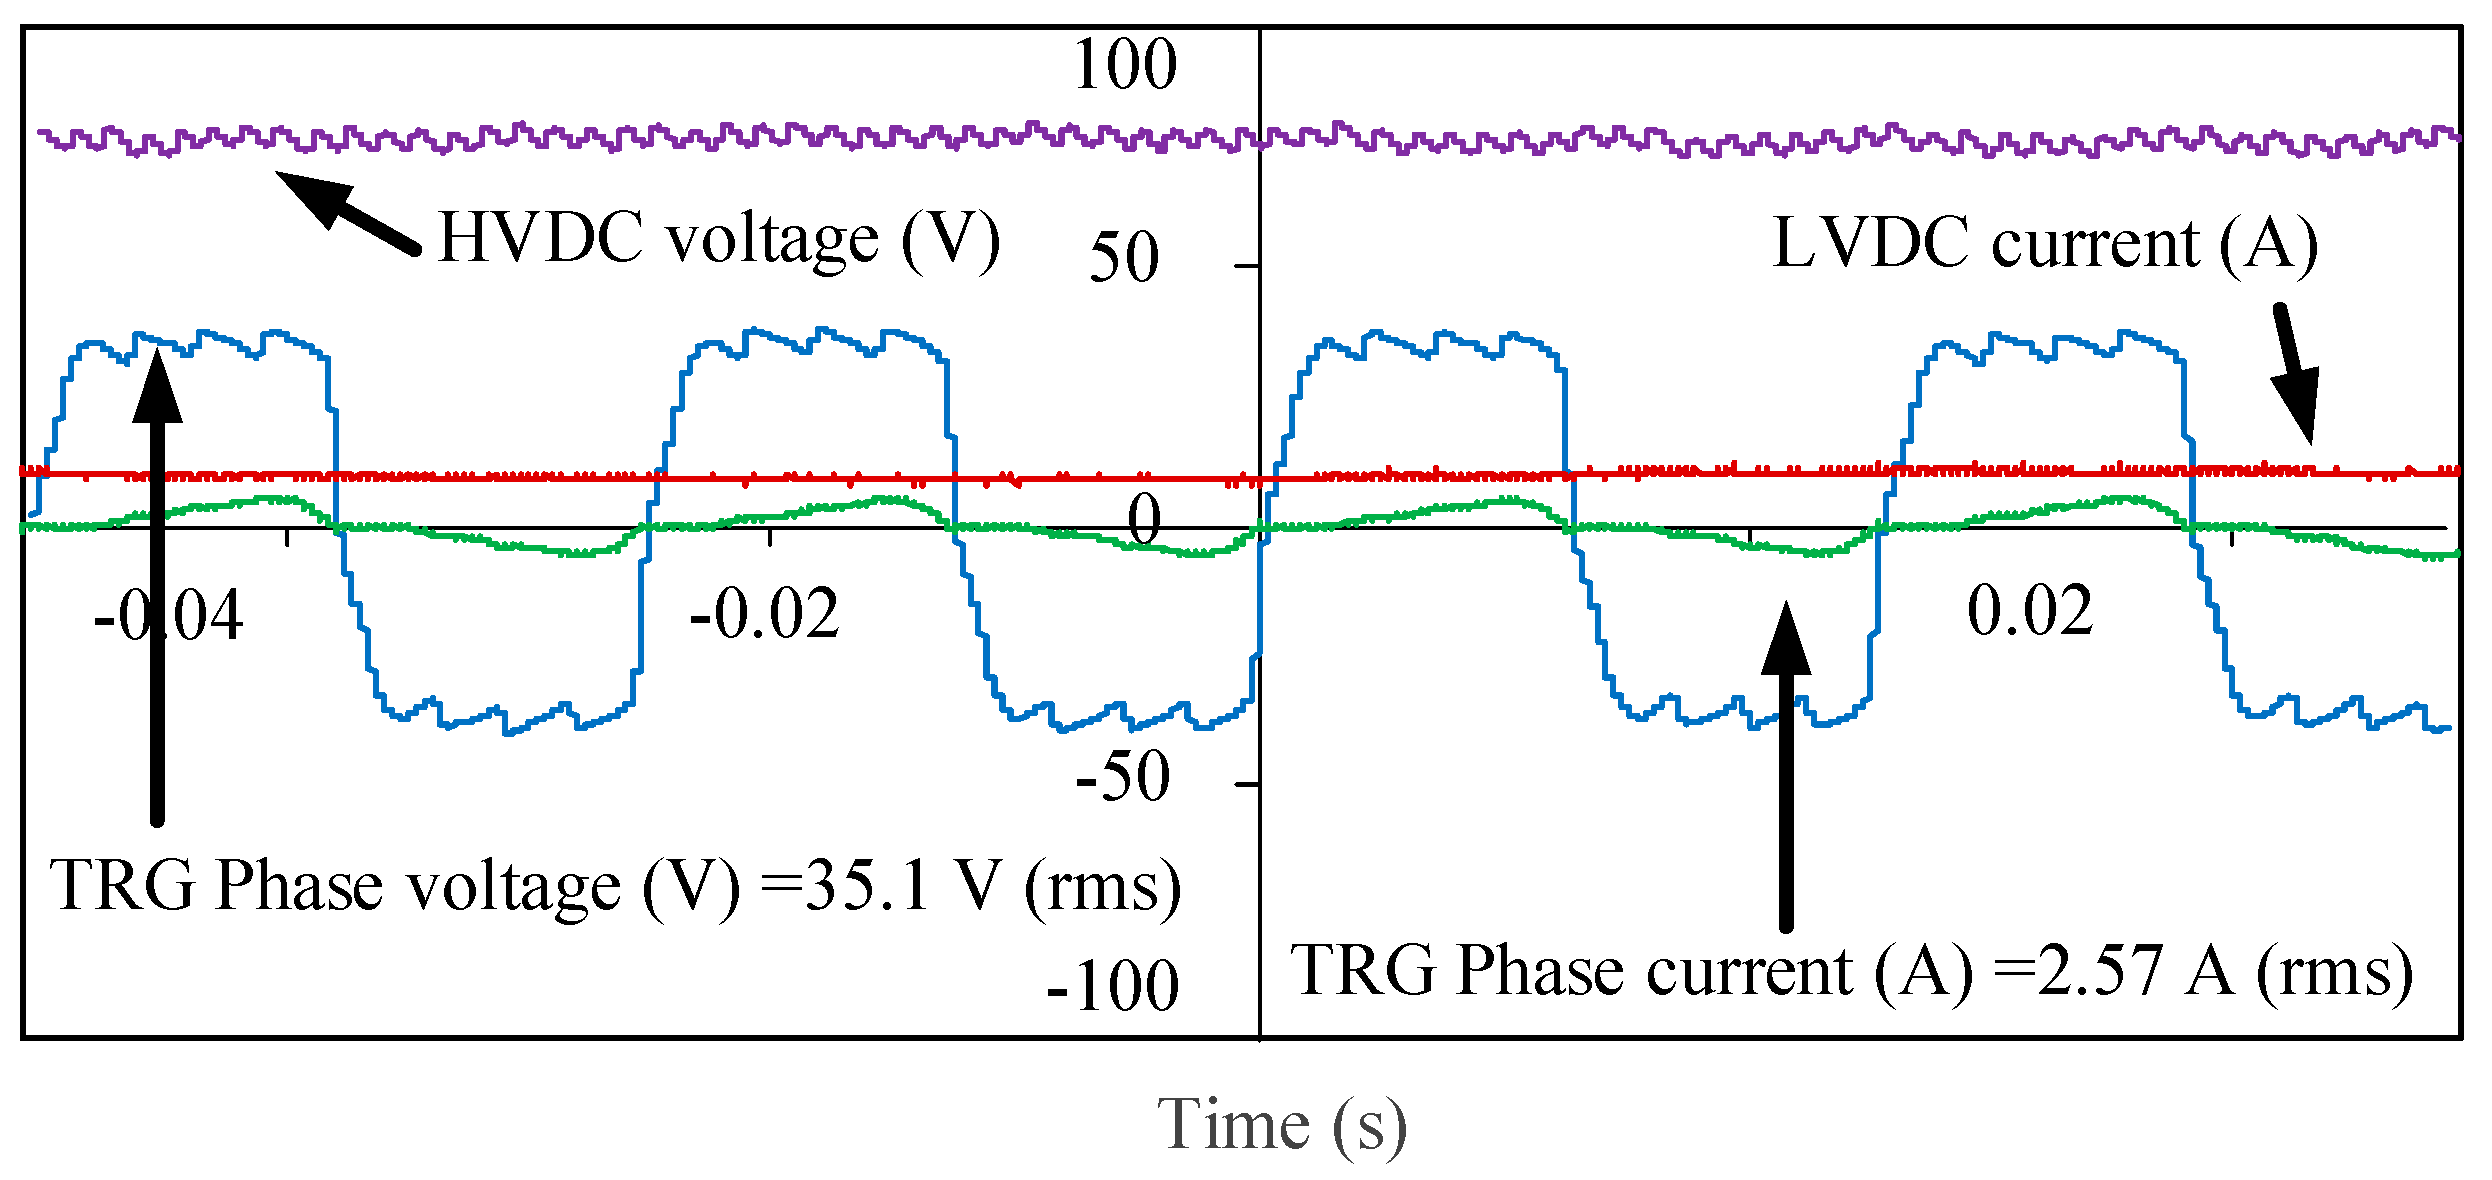
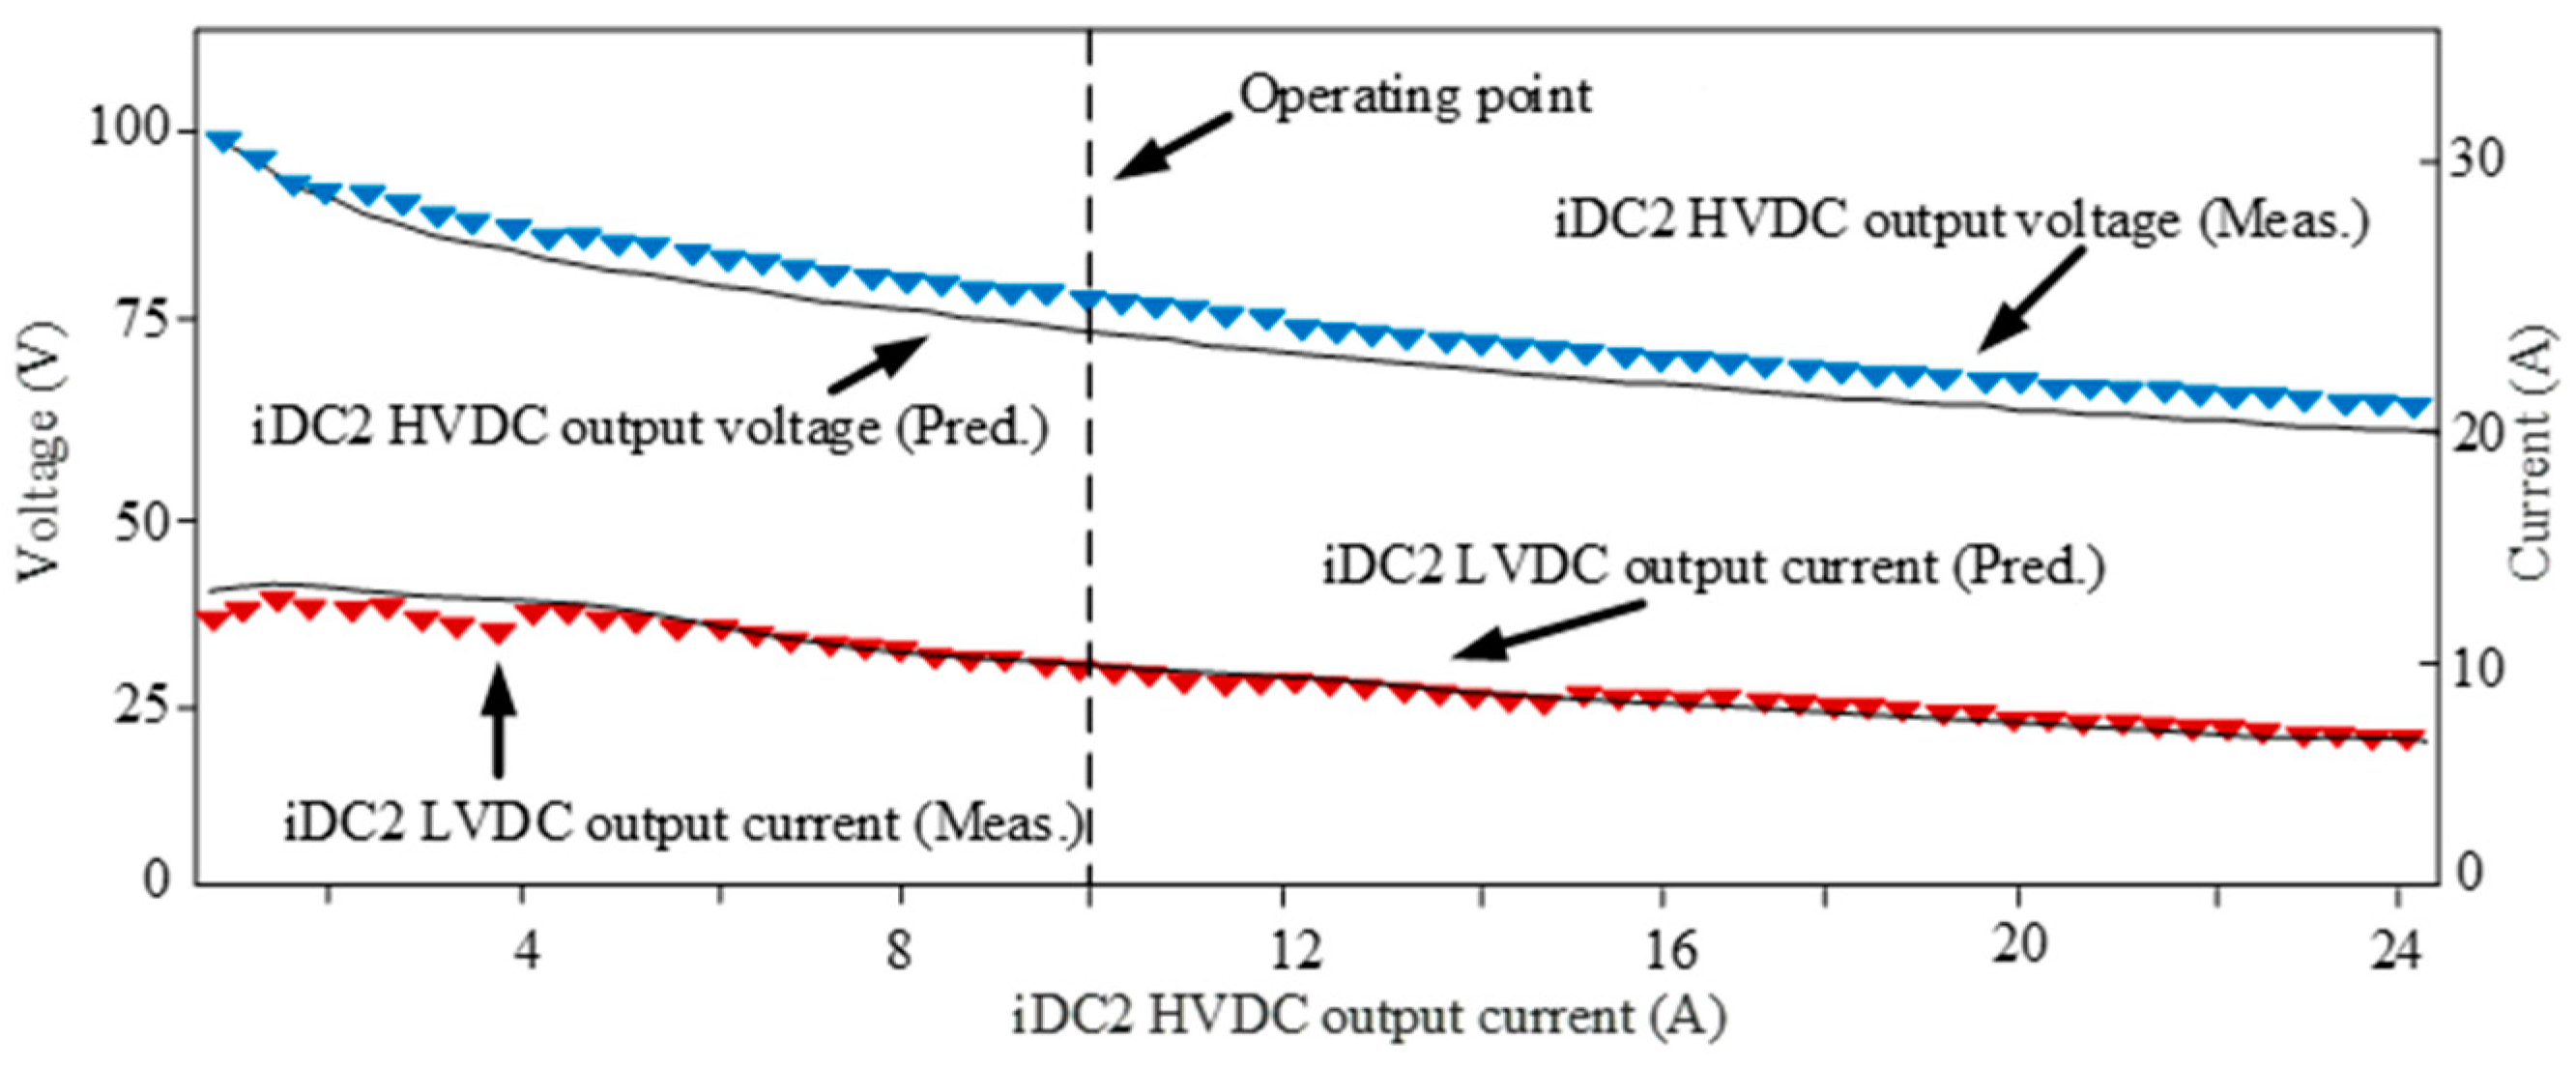
5. Experimental Results
6. Conclusions
Author Contributions
Funding
Data Availability Statement
Conflicts of Interest
References
- Beik, O.; Patel, M.R.; Talebzadeh, S. Large Spacecraft Electric Propulsion Using Multiphase Generator. In Proceedings of the 2023 IEEE Aerospace Conference, Big Sky, MT, USA, 4–11 March 2023; pp. 1–8. [Google Scholar]
- Patel, M.R.; Beik, O. Spacecraft Power Systems; CRC Press: Boca Raton, FL, USA, 2023. [Google Scholar]
- Krejci, D.; Lozano, P. Space Propulsion Technology for Small Spacecraft. Proc. IEEE 2018, 106, 362–378. [Google Scholar] [CrossRef]
- Djamal, D.; Mohamed, K.; Aslan, A.R. RESISTOJET Propulsion System for Small Satellite. In Proceedings of the 9th International Conference on Recent Advances in Space Technologies (RAST), Istanbul, Turkey, 11–14 June 2019. [Google Scholar]
- Jovel, D.R.; Walker, M.L.R.; Herman, D. Review of High-Power Electrostatic and Electrothermal Electric Propulsion. J. Propuls. Power 2022, 38, 1051–1081. [Google Scholar] [CrossRef]
- NASA—Ion Propulsion. Available online: https://www.nasa.gov/centers/glenn/about/fs21grc.html (accessed on 10 August 2023).
- Psyche’s Hall Thruster. Available online: https://www.jpl.nasa.gov/images/pia24030-psyches-hall-thruster (accessed on 10 August 2023).
- Polzin, K.; Martin, A.; Little, J.; Promislow, C.; Jorns, B.; Woods, J. State-of-the-Art and Advancement Paths for Inductive Pulsed Plasma Thrusters. Aerospace 2020, 7, 105. [Google Scholar] [CrossRef]
- Baranov, O.O.; Cvelbar, U.; Bazaka, K. Concept of a Magnetically Enhanced Vacuum Arc Thruster with Controlled Distribution of Ion Flux. IEEE Trans. Plasma Sci. 2018, 46, 304–310. [Google Scholar] [CrossRef]
- Gonzalez-Llorente, J.; Lidtke, A.A.; Hatanaka, K.; Kawauchi, R.; Okuyama, K.-I. Solar Module Integrated Converters as Power Generator in Small Spacecrafts: Design and Verification Approach. Aerospace 2019, 6, 61. [Google Scholar] [CrossRef]
- Matthes, C.S.R.; Woerner, D.F.; Hendricks, T.J.; Fleurial, J.-P.; Oxnevad, K.I.; Barklay, C.D.; Zakrajsek, J.F. Next-generation radioisotope thermoelectric generator study. In Proceedings of the 2018 IEEE Aerospace Conference, Big Sky, MT, USA, 3–10 March 2018; pp. 1–9. [Google Scholar]
- DART: Double Asteroid Redirection Test. 2022. Available online: https://dart.jhuapl.edu/Mission/ (accessed on 10 August 2023).
- Voyager 1 & 2. Available online: https://rps.nasa.gov/missions/12/voyager-1-2/ (accessed on 10 August 2023).
- Braun, B.; Myers, R. Space Nuclear Propulsion for Human Mars Exploration; The National Academies of Sciences: Washington, DC, USA, 2021. [Google Scholar]
- Peakman, A.; Lindley, B. A review of nuclear electric fission space reactor technologies for achieving high-power output and operating with HALEU fuel. Prog. Nucl. Energy 2023, 163, 104815. [Google Scholar] [CrossRef]
- Meyer, M.L.; Hartwig, J.W.; Sutherlin, S.G.; Colozza, A.J. Recent concept study for cryogenic fluid management to support opposition class crewed missions to Mars. Cryogenics 2023, 129, 103622. [Google Scholar] [CrossRef]
- Borowski, S.K.; McCurdy, D.R.; Packard, T.W. Nuclear Thermal Propulsion (NTP): A proven growth technology for human NEO/Mars exploration missions. In Proceedings of the 2012 IEEE Aerospace Conference, Big Sky, MT, USA, 3–10 March 2012; pp. 1–20. [Google Scholar]
- Nikitaeva, D.; Thomas, L.D. Propulsion Alternatives for Mars Transportation Architectures. J. Spacecr. Rocket. 2023, 60, 520–532. [Google Scholar] [CrossRef]
- Nikitaev, D.; Thomas, L.D. Impacts of In Situ Alternative Propellant on Nuclear Thermal Propulsion Mars Vehicle Architectures. Available online: https://www1.grc.nasa.gov/space/sep/gridded-ion-thrusters-next-c/ (accessed on 10 August 2023).
- Shen, D.; Yue, Y.; Wang, X. Manned Mars Mission Analysis Using Mission Architecture Matrix Method. Aerospace 2022, 9, 604. [Google Scholar] [CrossRef]
- Machemer, W.S.; Duchek, M.E.; Nikitaev, D. Considerations for Radiator Design in Multi-Megawatt Nuclear Electric Propulsion Applications. In Proceedings of the AIAA SCITECH Forum 2023, National Harbor, MD, USA, 23–27 January 2023. [Google Scholar]
- Oleson, S.R.; Burke, L.M.; Ma son, L.S.; Turnbull, E.R.; Mccarty, S.; Colozza, A.J.; Fittje, J.E.; Yim, J.T.; Smith, M.; Packard, T.W.; et al. Compass Final Report: Nuclear Electric Propulsion (NEP)-Chemical Vehicle 1.2. No. CD-2020-181. 2021. Available online: https://ntrs.nasa.gov/api/citations/20210017131/downloads/TM-20210017131_errata.pdf (accessed on 28 March 2024).
- Kokan, T.S.; Horton, J.F.; Joyner, C.R.; Levack, D.J.; Morris, D.E.; Muzek, B.J.; Noble, R.W.; Reynolds, C.B. Nuclear Electric Propulsion/Chemical Propulsion Hybrid Human Mars Exploration Campaign: From Start to Steady-State. In Proceedings of the ASCEND 2021, Las Vegas, NV, USA, 15–17 November 2021; p. 4013. [Google Scholar]
- Duchek, M.; Clark, M.; Pensado, A.; Harnack, C.; Machemer, W.; Grella, E.; Qu, M. Hybrid NEP-Chemical Vehicle and Propulsion Technology Study for Crewed Mars Missions. In Proceedings of the 68th JANNAF Propulsion Meeting 2021, Virtual, 7–17 June 2021. [Google Scholar]
- Independent Assessment of the Technical Maturity of Nuclear Electric Propulsion (NEP) and Nuclear Thermal Propulsion (NTP) Systems; NASA Engineering & Safety Center: Hampton, VA, USA, 2020.
- Polzin, K.A.; Martin, A.K.; Curran, A.; Myers, R.; Rodriguez, M. Strategy for Developing Technologies for Mega-watt-class Nuclear Electric Propulsion Systems. In Proceedings of the International Electric Propulsion Conference, Boston, MA, USA, 19–23 June 2022. [Google Scholar]
- Martin, A.K.; Polzin, K.A.; Curran, F.M.; Myers, R.M.; Rodriguez, M.A. A Technology Maturation Plan for the Development of Nuclear Electric Propulsion. In Proceedings of the Joint Army-Navy-NASA-Air Force (JANNAF) Meeting, Huntsville, AL, USA, 5–9 December 2022. [Google Scholar]
- Harnack, C.; Machemer, W.; Duchek, M.; Grella, E.; Nikitaev, D.; Smith, C. Brayton Cycle Power Conversion Model for MW-Class Nuclear Electric Propulsion Mars Missions. In Proceedings of the Nuclear and Emerging Technologies for Space (NETS-2022), Cleveland, OH, USA, 8–12 May 2022. [Google Scholar]
- Nikitaev, D.; Smith, C.; Duchek, M.; Harnack, C.; Machemer, W.; Grella, E. Nuclear Electric Propulsion Modular Power Conversion Model. In Proceedings of the Nuclear and Emerging Technologies for Space (NETS-2022), Cleveland, OH, USA, 8–12 May 2022. [Google Scholar]
- Machemer, W.; Duchek, M.; Harnack, C.; Grella, E.; Nikitaev, D.; Smith, C. Mass Modeling of NEP Power Conversion Concepts for Human Mars Exploration. In Proceedings of the Nuclear and Emerging Technologies for Space (NETS-2022), Cleveland, OH, USA, 8–12 May 2022. [Google Scholar]
- Nikitaev, D.; Duchek, M.E.; Harnack, C.; Machemer, W.; Rao, D. Heat Pipe Heat Exchanger for Nuclear Electric Propulsion Power Conversion System. In Proceedings of the AIAA ASCEND 2022, Las Vegas, NV, USA, 24–26 October 2022. [Google Scholar]
- Dyson, R.; Rao, D.; Duchek, M.; Harnack, C.; Scheidegger, R.; Mason, L.; Juhasz, A.; Rodriguez, L.; Leibach, R.; Geng, S.; et al. Nuclear Electric Propulsion Brayton Power Conversion Working Fluid Considerations. In Proceedings of the Nuclear and Emerging Technologies for Space (NETS-2022), Cleveland, OH, USA, 8–12 May 2022. [Google Scholar]
- Li, Z.; Yang, X.; Wang, J.; Zhang, Z. Off-design performance and control characteristics of space reactor closed Brayton cycle system. Ann. Nucl. Energy 2019, 128, 318–329. [Google Scholar] [CrossRef]
- Koroteev, A.S.; Oshev, Y.A.; Popov, S.A.; Karevsky, A.V.; Solodukhin, A.Y.; Zakharenkov, L.E.; Semenkin, A.V. Nuclear power propulsion system for spacecraft. Therm. Eng. 2015, 62, 971–980. [Google Scholar] [CrossRef]
- Nuclear Electric Propulsion. Available online: https://nap.nationalacademies.org/read/25977/chapter/5 (accessed on 10 March 2024).
- Harnack, C.; Machemer, W.; Nikitaeva, D.; Duchek, M. Component-level Performance and Mass Sensitivity Analysis of NEP MW-class Power System. In Proceedings of the AIAA ASCEND 2022, Las Vegas, NV, USA, 24–26 October 2022. [Google Scholar]
- Ducheck, M.; Machemer, W.; Harnack, C.; Clark, M.A.; Pensado, A.R.; Palomares, K.B.; Polzin, K.A.; Martin, A.; Curran, F.; Myers, R.; et al. Key Performance Parameters for MW-Class NEP Elements and their Interfaces. In Proceedings of the AIAA ASCEND 2022, Las Vegas, NV, USA, 24–26 October 2022. [Google Scholar]
- Bidirectional Dual Active Bridge Power Converter for Spacecraft Power Systems. Available online: https://techport.nasa.gov/view/90266 (accessed on 28 March 2024).
- State-of-the-Art of Small Spacecraft Technology; NASA: Washington, DC, USA, 2024.
- Polzin, K. Technology Development for In-Space Nuclear Electric Propulsion; Marshall Space Flight Center: Huntsville, AL, USA, 2021. [Google Scholar]
- Soeder, R.S.J. Spacecraft Bus Voltage Selection; NASA Glenn Research Center: Cleveland, OH, USA, 2015. [Google Scholar]
- Al-Adsani, A.S.; Jarushi, A.M.; Beik, O. ICE/HPM generator range extender for a series hybrid EV powertrain. IET Electr. Syst. Transp. 2020, 10, 96–104. [Google Scholar] [CrossRef]
- Al-Adsani, A.S.; Beik, O. Multiphase Hybrid Electric Machines: Application for Electrified Powertrians; Springer International: Cham, Switzerland, 2021. [Google Scholar]
- Beik, O.; Schofield, N. High-Voltage Hybrid Generator and Conversion System for Wind Turbine Applications. IEEE Trans. Ind. Electron. 2017, 65, 3220–3229. [Google Scholar] [CrossRef]
- Beik, O.; Al-Adsani, A.S. A Wind Turbine Generator Design and Optimization for DC Collector Grids. IEEE J. Emerg. Sel. Top. Power Electron. 2021, 10, 484–493. [Google Scholar] [CrossRef]
- Balasubramanian, S.; Henke, M. Determination and Optimization of Multiphase Fractional-Slot Windings used in Permanent Magnet Synchronous Machines. In Proceedings of the 2021 24th International Conference on Electrical Machines and Systems (ICEMS), Gyeongju, Republic of Korea, 31 October–3 November 2021. [Google Scholar]
- Li, W.; Cheng, M. Investigation of influence of winding structure on reliability of permanent magnet machines. CES Trans. Electr. Mach. Syst. 2020, 4, 87–95. [Google Scholar] [CrossRef]
- Wang, S.; Zhu, Z.; Pride, A.; Shi, J.; Deodhar, R.; Umemura, C. Comparison of Different Winding Configurations for Dual Three-Phase Interior PM Machines in Electric Vehicles. World Electr. Veh. J. 2022, 13, 51. [Google Scholar] [CrossRef]
- Beik, O.; Al-Adsani, A.S. DC Wind Generation Systems: Design, Analysis, and Multiphase Turbine Technology; Springer: Cham, Switzerland, 2020. [Google Scholar]
- Yang, S.; Bryant, A.; Mawby, P.; Xiang, D.; Ran, L.; Tavner, P. An Industry-Based Survey of Reliability in Power Electronic Converters. IEEE Trans. Ind. Appl. 2011, 47, 1441–1451. [Google Scholar] [CrossRef]
- Qin, B.; Liu, W.; Zhang, R.; Liu, J.; Li, H. Review on Short-circuit Current Analysis and Suppression Techniques for MMC-HVDC Transmission Systems. Appl. Sci. 2020, 10, 6769. [Google Scholar] [CrossRef]
- High Power, High Frequency Transformers. Available online: https://www.murata.com/en-us/products/transformers/highpower-highfrequency-transformers (accessed on 10 March 2024).
- Roth, M.E. Evaluation of a Multi-Kw. High Frequency Transformer for Space Applications; Lewis Research Center: Cleveland, OH, USA, 1994. [Google Scholar]
- Optimization of Nuclear Fuel Assembly Loading Patterns. Available online: https://quantumcomputinginc.com/optimization-of-nuclear-fuel-assembly-loading-patterns (accessed on 10 March 2024).
- Sarfi, G.; Beik, O. High Voltage Wind Turbine Conversion System with Dual DC Converter for MVDC Grids. In Proceedings of the 2023 IEEE Energy Conversion Congress and Exposition (ECCE), Nashville, TN, USA, 29 October–2 November 2023; pp. 563–567. [Google Scholar]
- Khan, M.Y.A.; Liu, H.; Habib, S.; Khan, D.; Yuan, X. Design and Performance Evaluation of a Step-Up DC–DC Converter with Dual Loop Controllers for Two Stages Grid Connected PV Inverter. Sustainability 2022, 14, 811. [Google Scholar] [CrossRef]
- Noruzi, S.; Ghoreishy, H.; Ahmad, A.A.; Tahami, F.; Ahmadiahangar, R.; Rosin, A. Variable Frequency Control method of Boost Converter Operating in Boundary Conduction Mode. In Proceedings of the IEEE International Scientific Conference on Power and Electrical Engineering of Riga Technical University (RTUCON), Riga, Latvia, 5–7 November 2020; pp. 1–6. [Google Scholar]
- Xiang, Y.; Chung, H.S.-H.; Lin, H. Light Implementation Scheme of ANN-Based Explicit Model-Predictive Control for DC–DC Power Converters. IEEE Trans. Ind. Inform. 2023, 20, 4065–4078. [Google Scholar] [CrossRef]


| TRG [42,43,44,45] | Rated power (MW) | 3.6 |
| Number of poles (p.u.) | 10 | |
| Rated speed (rpm) | 600 | |
| Nine-phase per-phase RMS back-EMF (V) | 579 | |
| Per-phase resistance (Ω) | 0.7 | |
| Per-phase synchronous inductance (mH) | 226.91 | |
| WFR winding resistance (Ω) | 0.078 | |
| iDC2 | HVDC bus rated voltage (V) | 1000 |
| LVDC bus rated voltage (V) | 200 | |
| Rectified rated DC voltage (V) | 1000 | |
| Rated Power (MW) | 3.6 | |
| HF transformer turns ratio (n2: n1) | 1:1 | |
| HF transformer turns ratio (n3: n1) | 0.3:1 |
| No. of primary turns () | 1000 |
| No. of secondary turns () | 1000 |
| No. of tertiary turns () | 300 |
| Primary magnetizing inductance () | 598 mH |
| Step-down stage inductance () | 1.78 mH |
| Tertiary capacitance () | 8230 μF |
| Secondary capacitance () | 8772 μF |
| Time | 2–5 s | 5–10 s | 10–13 s |
|---|---|---|---|
| HVDC power | 2 MW | 3.5 MW | 2.5 MW |
| LVDC power | 0.2 MW | 0.1 MW | 0.05 MW |
| HVDC current | 2000 A | 3500 A | 2500 A |
| LVDC current | 1000 A | 500 A | 250 A |
| HVDC voltage | 1000 V | 1000 V | 1000 V |
| Rectified voltage | 800 V | 1000 V | 900 V |
| duty cycle | 0.55556 | 0.5 | 0.526 |
| duty cycle | 0.66667 | 0.66667 | 0.66667 |
| HVDC power | 2 MW | 3.5 MW | 2.5 MW |
| LVDC power | 0.2 MW | 0.1 MW | 0.05 MW |
| Setup Information | IM max. speed | 3000 RPM |
| IM rated power | 2 kW | |
| TRG rated phase back-EMF | 75 V RMS | |
| TRG rated power | 2 kW | |
| TRG number of phases | 9 (concentric winding) | |
| iDC2 rated voltage | 100 V DC | |
| iDC2 rated current | 30 A | |
| Experimental Results (Shown in Figure 10, based on the O.P. shown in Figure 11) | IDC2 HVDC output voltage | 75 V @ tested O.P. |
| IDC2 HVDC output current | 10 A @ tested O.P. | |
| IDC2 LVDC output current | 10 A @ tested O.P. | |
| IDC2 LVDC output voltage | 20 V fixed |
Disclaimer/Publisher’s Note: The statements, opinions and data contained in all publications are solely those of the individual author(s) and contributor(s) and not of MDPI and/or the editor(s). MDPI and/or the editor(s) disclaim responsibility for any injury to people or property resulting from any ideas, methods, instructions or products referred to in the content. |
© 2024 by the authors. Licensee MDPI, Basel, Switzerland. This article is an open access article distributed under the terms and conditions of the Creative Commons Attribution (CC BY) license (https://creativecommons.org/licenses/by/4.0/).
Share and Cite
Sarfi, G.; Beik, O. MW-Scale High-Voltage Direct-Current Power Conversion for Large-Spacecraft Electric Propulsion. Electronics 2024, 13, 1455. https://doi.org/10.3390/electronics13081455
Sarfi G, Beik O. MW-Scale High-Voltage Direct-Current Power Conversion for Large-Spacecraft Electric Propulsion. Electronics. 2024; 13(8):1455. https://doi.org/10.3390/electronics13081455
Chicago/Turabian StyleSarfi, Ghazaleh, and Omid Beik. 2024. "MW-Scale High-Voltage Direct-Current Power Conversion for Large-Spacecraft Electric Propulsion" Electronics 13, no. 8: 1455. https://doi.org/10.3390/electronics13081455