
Frame Loss Effects on Visual Fatigue in Super Multi-View 3D Display Technology

Abstract
1. Introduction
2. Materials and Methods
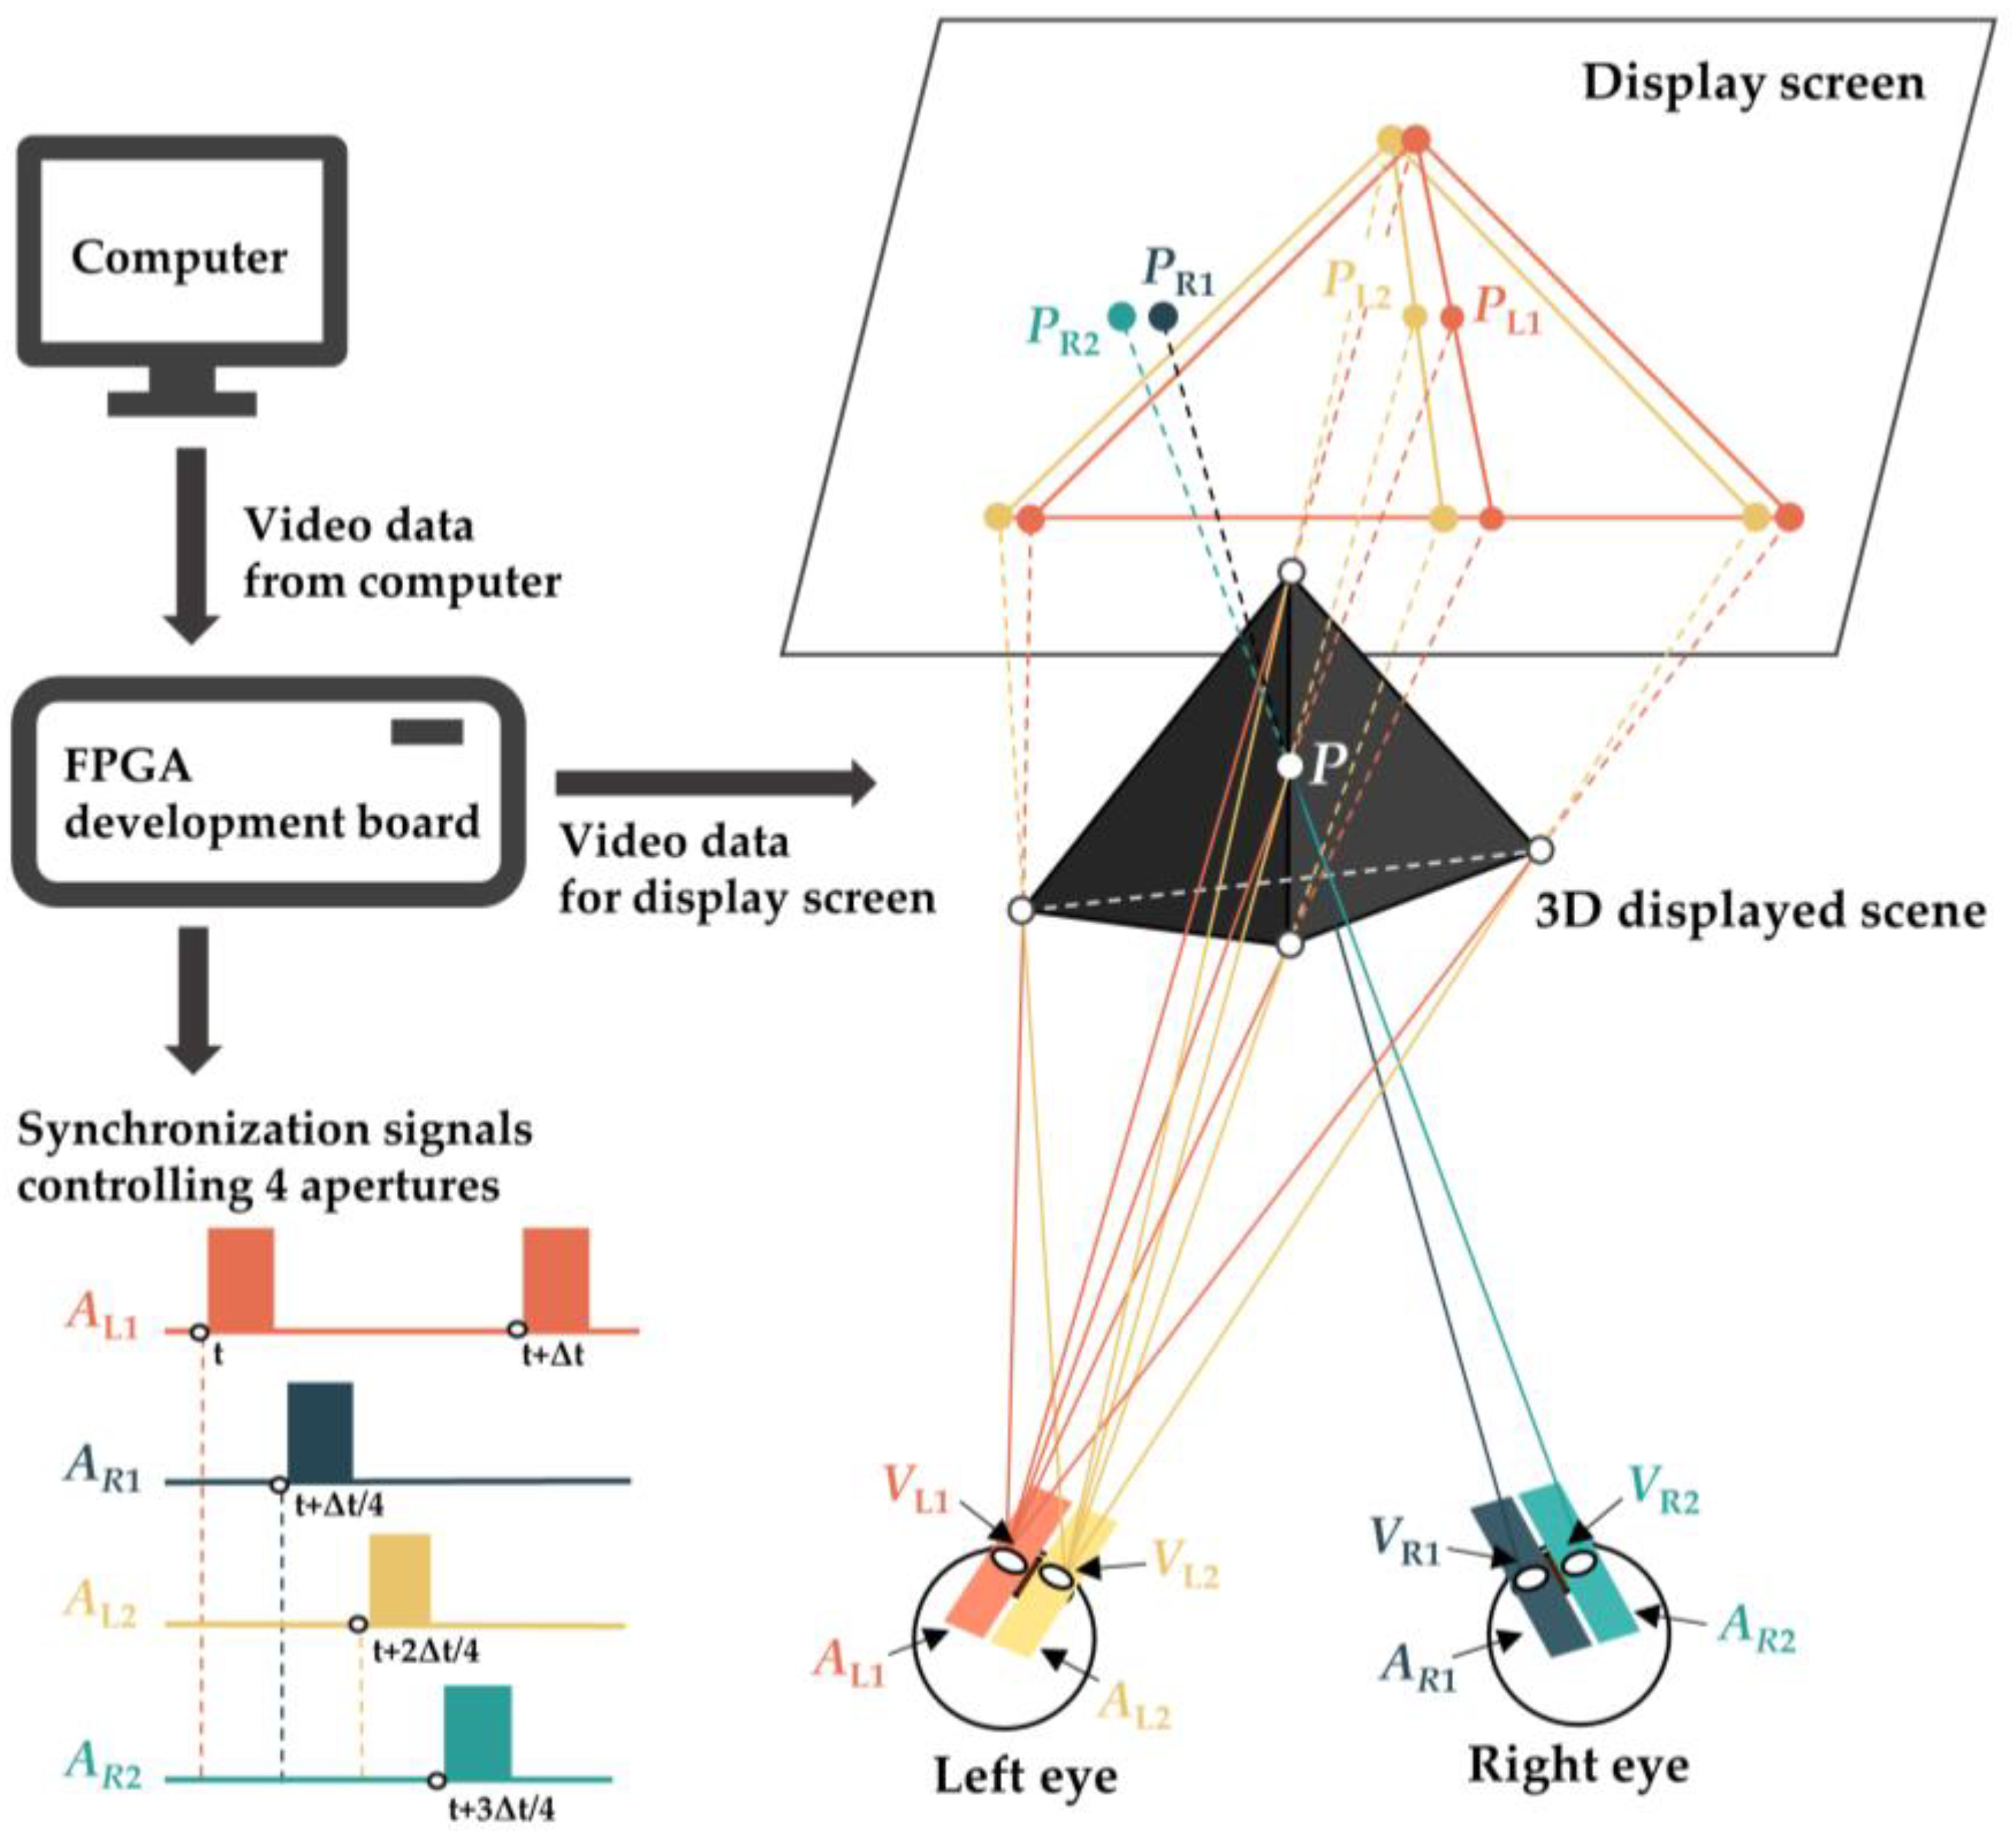
2.1. Experiment Device
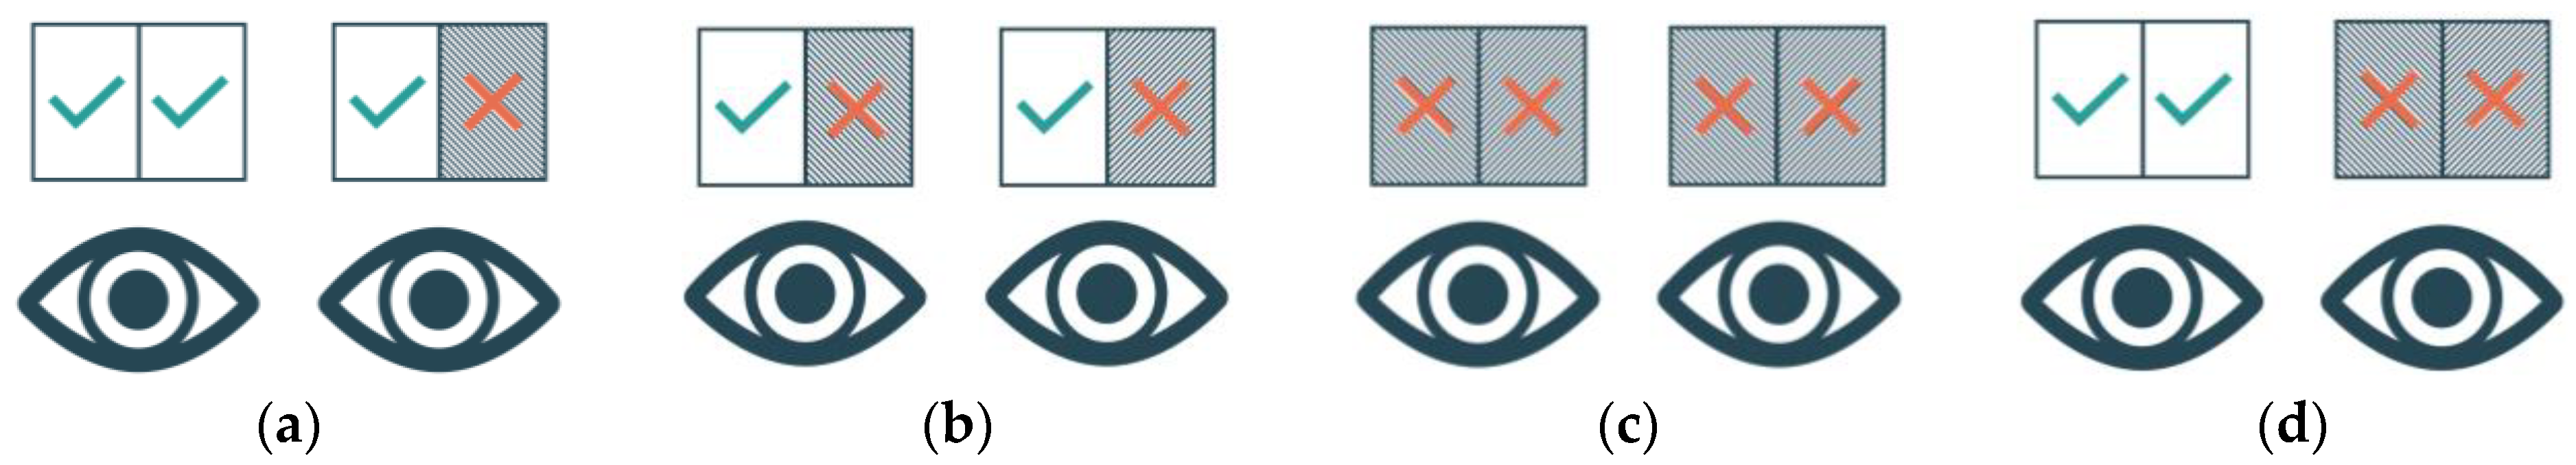
2.2. Frame Loss Setting
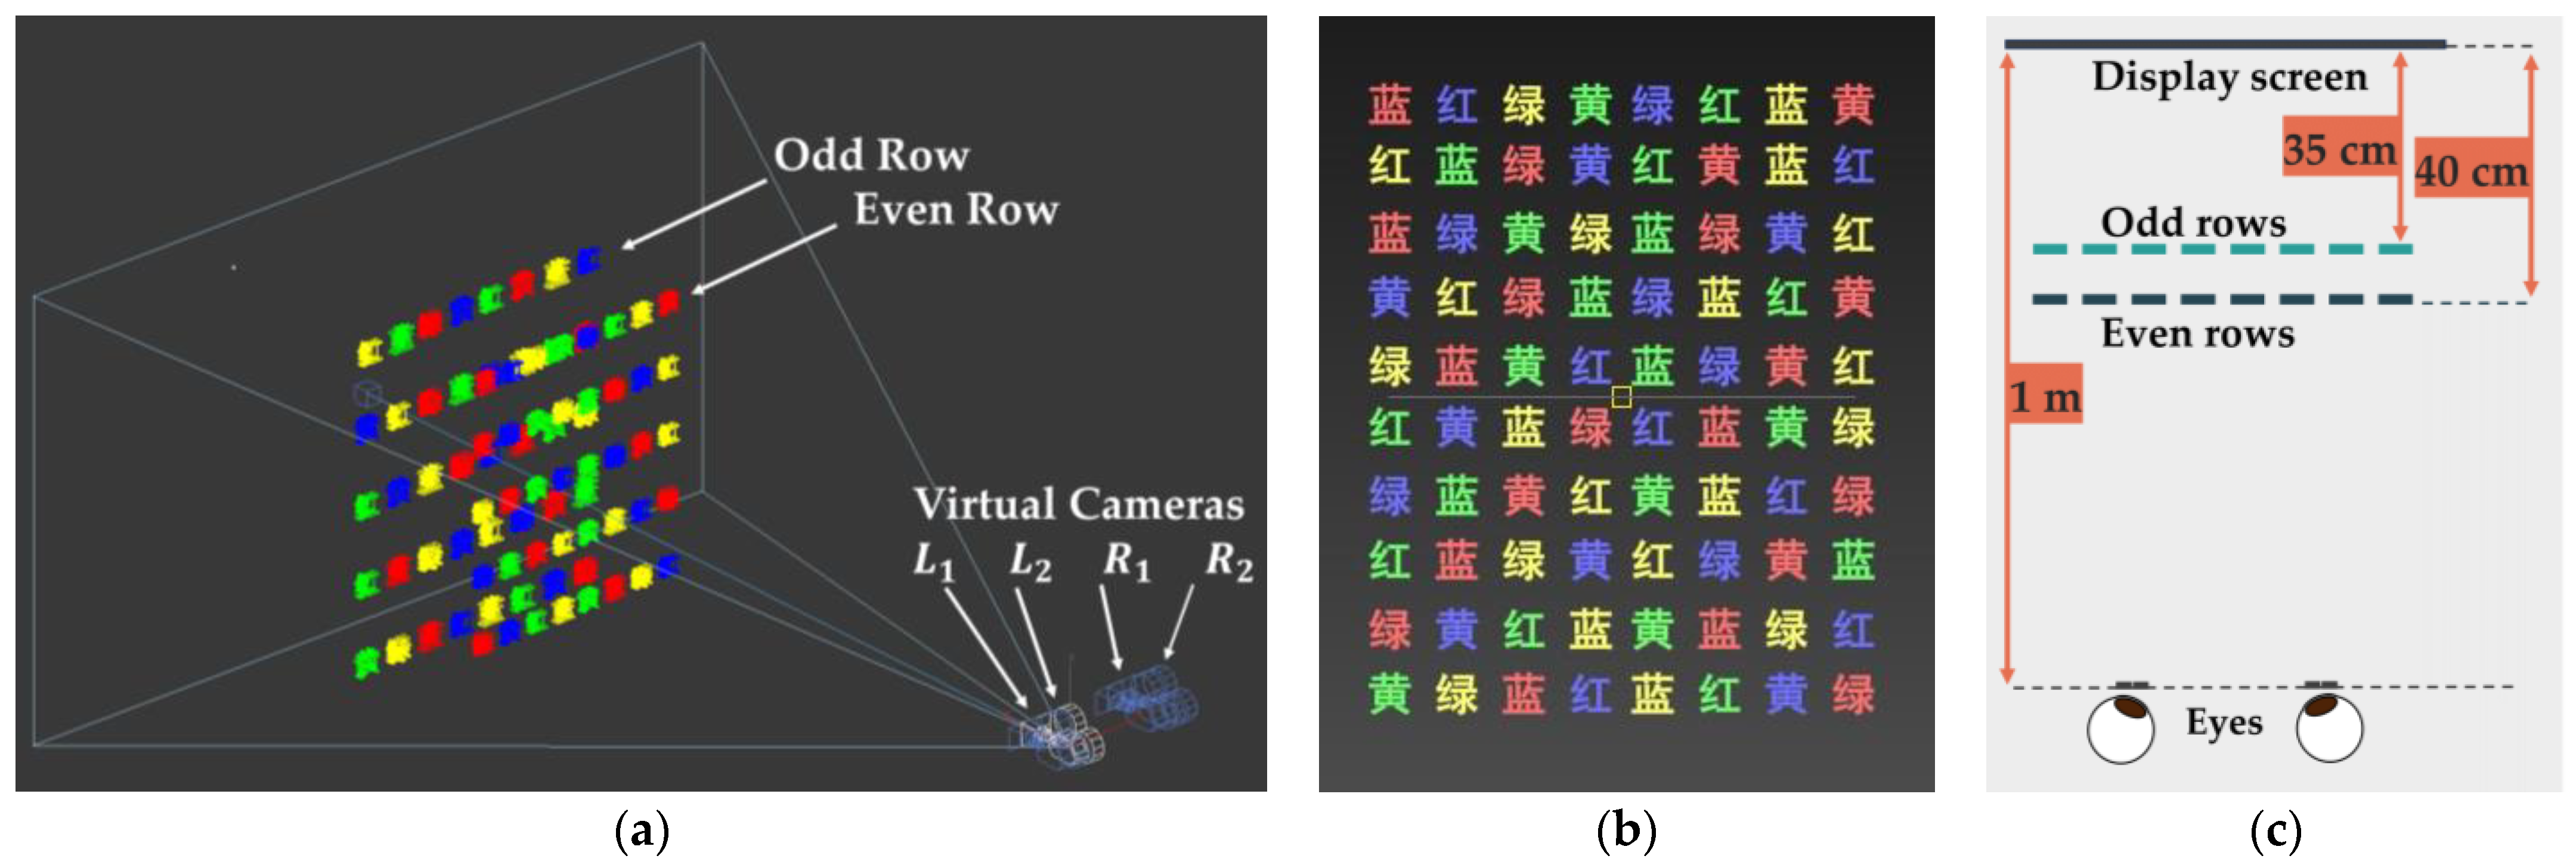
2.3. Stroop Test and Experiment Objects
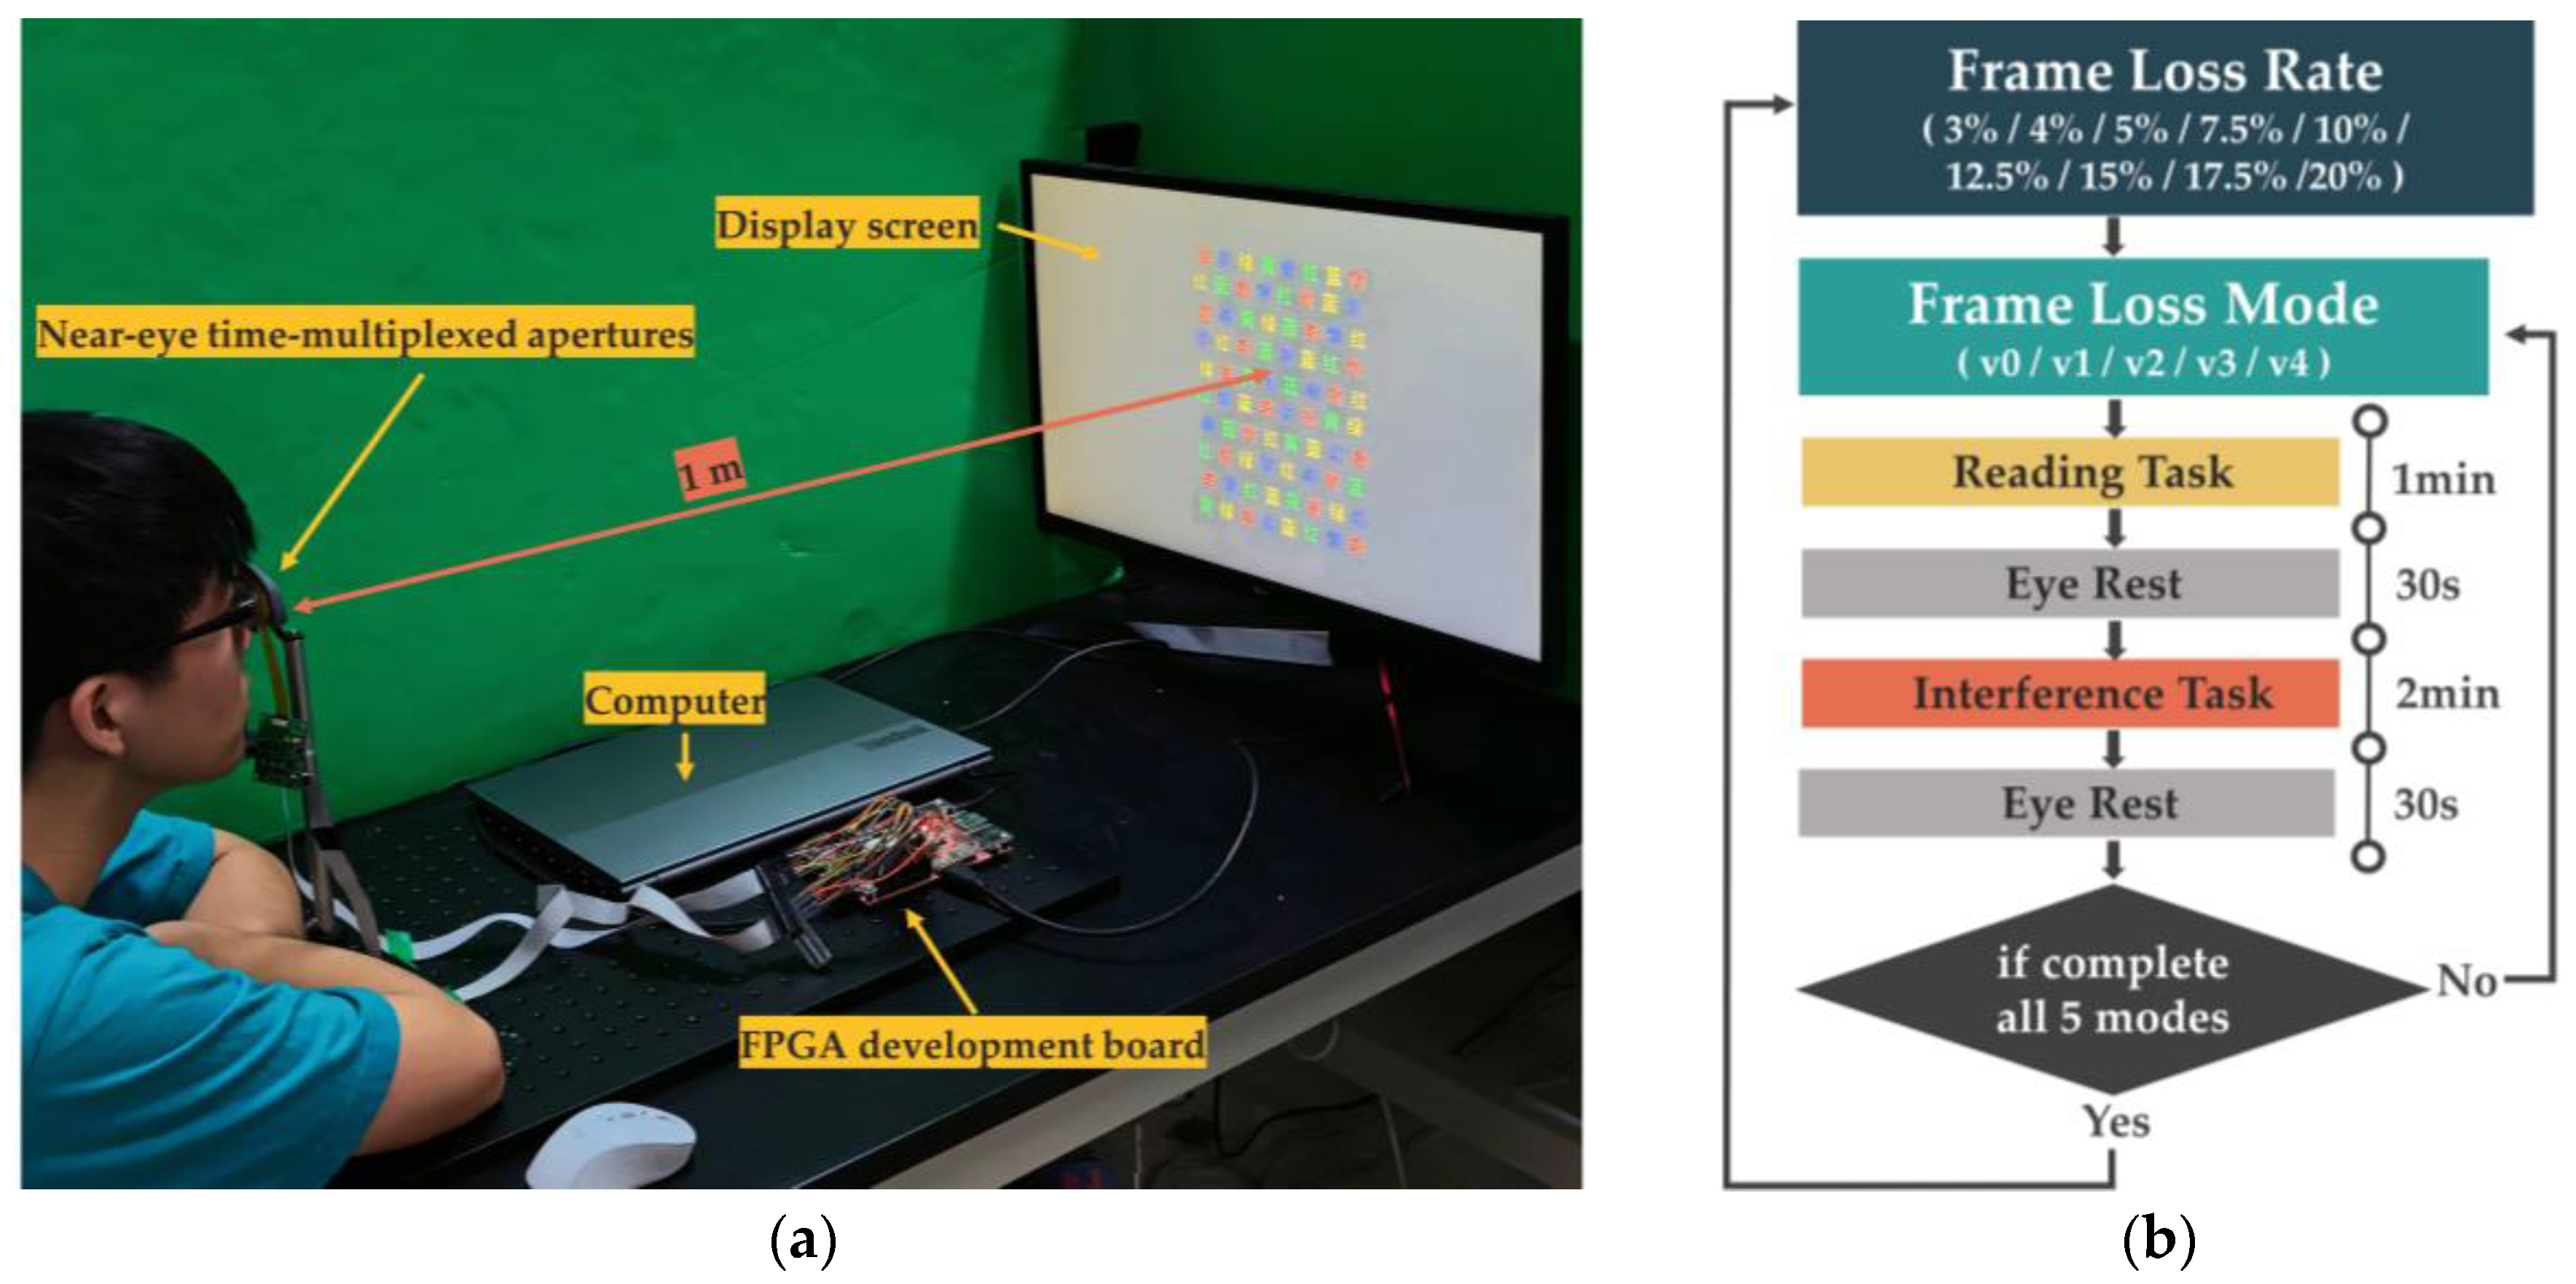
2.4. Subjects and Display Device
2.5. Procedure and Testing
3. Results
4. Discussion and Summary
Author Contributions
Funding
Data Availability Statement
Acknowledgments
Conflicts of Interest
References
- Ueno, T.; Takaki, Y. Approximated Super Multi-View Head-Mounted Display to Reduce Visual Fatigue. Opt. Express 2020, 28, 14134–14150. [Google Scholar] [CrossRef] [PubMed]
- Wan, W.; Qiao, W.; Pu, D.; Chen, L. Super Multi-View Display Based on Pixelated Nanogratings under an Illumination of a Point Light Source. Opt. Lasers Eng. 2020, 134, 106258. [Google Scholar] [CrossRef]
- Yano, S.; Ide, S.; Mitsuhashi, T.; Thwaites, H. A Study of Visual Fatigue and Visual Comfort for 3D HDTV/HDTV Images. Displays 2002, 23, 191–201. [Google Scholar] [CrossRef]
- Ukai, K.; Howarth, P.A. Visual Fatigue Caused by Viewing Stereoscopic Motion Images: Background, Theories, and Observations. Displays 2008, 29, 106–116. [Google Scholar] [CrossRef]
- Sun, D.; Wang, C.; Teng, D.; Liu, L. Three-Dimensional Display on Computer Screen Free from Accommodation-Convergence Conflict. Opt. Commun. 2017, 390, 36–40. [Google Scholar] [CrossRef]
- Liu, L.; Ye, Q.; Pang, Z.; Huang, H.; Lai, C.; Teng, D. Polarization Enlargement of FOV in Super Multi-View Display Based on near-Eye Timing-Apertures. Opt. Express 2022, 30, 1841–1859. [Google Scholar] [CrossRef] [PubMed]
- Zhou, Y.; Xiang, W.; Wang, G. Frame Loss Concealment for Multiview Video Transmission Over Wireless Multimedia Sensor Networks. IEEE Sens. J. 2015, 15, 1892–1901. [Google Scholar] [CrossRef]
- Chang, Y.-L.; Lin, T.-L.; Cosman, P.C. Network-Based H.264/AVC Whole-Frame Loss Visibility Model and Frame Dropping Methods. Ieee Trans. Image Process. 2012, 21, 3353–3363. [Google Scholar] [CrossRef] [PubMed]
- Hoffman, D.M.; Girshick, A.R.; Akeley, K.; Banks, M.S. Vergence-Accommodation Conflicts Hinder Visual Performance and Cause Visual Fatigue. J. Vis. 2008, 8, 33. [Google Scholar] [CrossRef] [PubMed]
- Kim, J.; Kane, D.; Banks, M.S. The Rate of Change of Vergence-Accommodation Conflict Affects Visual Discomfort. Vis. Res. 2014, 105, 159–165. [Google Scholar] [CrossRef] [PubMed]
- Iatsun, I.; Larabi, M.-C.; Fernandez-Maloigne, C. Investigation and Modeling of Visual Fatigue Caused by S3D Content Using Eye-Tracking. Displays 2015, 39, 11–25. [Google Scholar] [CrossRef]
- Yang, X.; Wang, D.; Hu, H.; Yue, K. P-31: Visual Fatigue Assessment and Modeling Based on ECG and EOG Caused by 2D and 3D Displays. SID Symp. Dig. Tech. Pap. 2016, 47, 1237–1240. [Google Scholar] [CrossRef]
- Kim, Y.; Hong, K.; Kim, J.; Yang, H.K.; Hwang, J.-M.; Lee, B. Accommodation Measurement According to Angular Resolution Density in Three-Dimensional Display; Blankenbach, K., Chien, L.-C., Lee, S.-D., Wu, M.H., Eds.; SPIE: San Francisco, CA, USA, 2011; p. 79560Q. [Google Scholar] [CrossRef]
- Kim, Y.; Kim, J.; Hong, K.; Yang, H.K.; Jung, J.-H.; Choi, H.; Min, S.-W.; Seo, J.-M.; Hwang, J.-M.; Lee, B. Accommodative Response of Integral Imaging in Near Distance. J. Disp. Technol. 2012, 8, 70–78. [Google Scholar] [CrossRef]
- Mizushina, H.; Nakamura, J.; Takaki, Y.; Ando, H. Super Multi-View 3D Displays Reduce Conflict between Accommodative and Vergence Responses: SMV Displays Solve Vergence-Accommodation Conflict. J. Soc. Inf. Disp. 2016, 24, 747–756. [Google Scholar] [CrossRef]
- Inama, M.; Spolverato, G.; Impellizzeri, H.; Bacchion, M.; Creciun, M.; Casaril, A.; Moretto, G. Cognitive Load in 3d and 2d Minimally Invasive Colorectal Surgery. Surg. Endosc. 2020, 34, 3262–3269. [Google Scholar] [CrossRef] [PubMed]
- Souchet, A.D.; Philippe, S.; Lourdeaux, D.; Leroy, L. Measuring Visual Fatigue and Cognitive Load via Eye Tracking While Learning with Virtual Reality Head-Mounted Displays: A Review. Int. J. Hum. Comput. Interact. 2021, 38, 801–824. [Google Scholar] [CrossRef]
- Amin, H.U.; Malik, A.S.; Mumtaz, W.; Badruddin, N.; Kamel, N. Evaluation of Passive Polarized Stereoscopic 3D Display for Visual & Mental Fatigues. In Proceedings of the 2015 37th Annual International Conference of the IEEE Engineering in Medicine and Biology Society (EMBC), Milan, Italy, 25–29 August 2015; IEEE: Piscataway, NJ, USA, 2015; pp. 7590–7593. [Google Scholar] [CrossRef]
- Park, S.; Mun, S.; Lee, D.W.; Whang, M. IR-Camera-Based Measurements of 2D/3D Cognitive Fatigue in 2D/3D Display System Using Task-Evoked Pupillary Response. Appl. Opt. 2019, 58, 3467–3480. [Google Scholar] [CrossRef] [PubMed]
- MacLeod, C.M. Half a Century of Research on the Stroop Effect: An Integrative Review. Psychol. Bull. 1991, 109, 163–203. [Google Scholar] [CrossRef] [PubMed]
- Rauch, W.A.; Schmitt, K. Fatigue of Cognitive Control in the Stroop-Task. Proc. Annu. Meet. Cogn. Sci. Soc. 2009, 37, 750–755. [Google Scholar]
- Daniel, F.; Kapoula, Z. Induced Vergence-Accommodation Conflict Reduces Cognitive Performance in the Stroop Test. Sci. Rep. 2019, 9, 1247. [Google Scholar] [CrossRef] [PubMed]
- Zhao, T.; Liu, Q.; Chen, C.W. QoE in Video Transmission: A User Experience-Driven Strategy. IEEE Commun. Surv. Tutor. 2017, 19, 285–302. [Google Scholar] [CrossRef]
- Su, G.-M.; Su, X.; Bai, Y.; Wang, M.; Vasilakos, A.; Wang, H. QoE in Video Streaming over Wireless Networks: Perspectives and Research Challenges. Wirel. Netw. 2015, 22, 1571–1593. [Google Scholar] [CrossRef]
- Hasan, M.M.; Hossain, M.d.A.; Alotaibi, N.; Arnold, J.F.; Azad, A. Binocular Rivalry Impact on Macroblock-Loss Error Concealment for Stereoscopic 3D Video Transmission. Sensors 2023, 23, 3604. [Google Scholar] [CrossRef] [PubMed]
- Park, E.; Cho, M.; Ki, C.-S. Correct Use of Repeated Measures Analysis of Variance. Ann. Lab. Med. 2009, 29, 1–9. [Google Scholar] [CrossRef] [PubMed]
- Armstrong, R.A.; Eperjesi, F.; Gilmartin, B. The Application of Analysis of Variance (ANOVA) to Different Experimental Designs in Optometry. Ophthalmic Physiol. Opt. 2002, 22, 248–256. [Google Scholar] [CrossRef] [PubMed]
- Pastrana-Vidal, R.R.; Gicquel, J.C.; Colomes, C.; Cherifi, H. Sporadic Frame Dropping Impact on Quality Perception; Rogowitz, B.E., Pappas, T.N., Eds.; SPIE: San Jose, CA, USA, 2004; p. 182. [Google Scholar] [CrossRef]
- Tommasi, F.; De Luca, V.; Melle, C. Packet Losses and Objective Video Quality Metrics in H.264 Video Streaming. J. Vis. Commun. Image Represent. 2015, 27, 7–27. [Google Scholar] [CrossRef]
- Grossberg, S.; Yazdanbakhsh, A.; Cao, Y.; Swaminathan, G. How Does Binocular Rivalry Emerge from Cortical Mechanisms of 3-D Vision? Vis. Res. 2008, 48, 2232–2250. [Google Scholar] [CrossRef] [PubMed]
- Patterson, R.; Winterbottom, M.; Pierce, B.; Fox, R. Binocular Rivalry and Head-Worn Displays. Hum. Factors 2007, 49, 1083–1096. [Google Scholar] [CrossRef] [PubMed]
- Chang, Y.-H.; Lee, J.B.; Kim, N.S.; Lee, D.W.; Chang, J.H.; Han, S.-H. The Effects of Interocular Differences in Retinal Illuminance on Vision and Binocularity. Graefe’s Arch. Clin. Exp. Ophthalmol. 2006, 244, 1083–1088. [Google Scholar] [CrossRef] [PubMed]
- Lovasik, J.V.; Szymkiw, M. Effects of Aniseikonia, Anisometropia, Accommodation, Retinal Illuminance, and Pupil Size on Stereopsis. Investig. Ophthalmol. Vis. Sci. 1985, 26, 741–750. [Google Scholar]


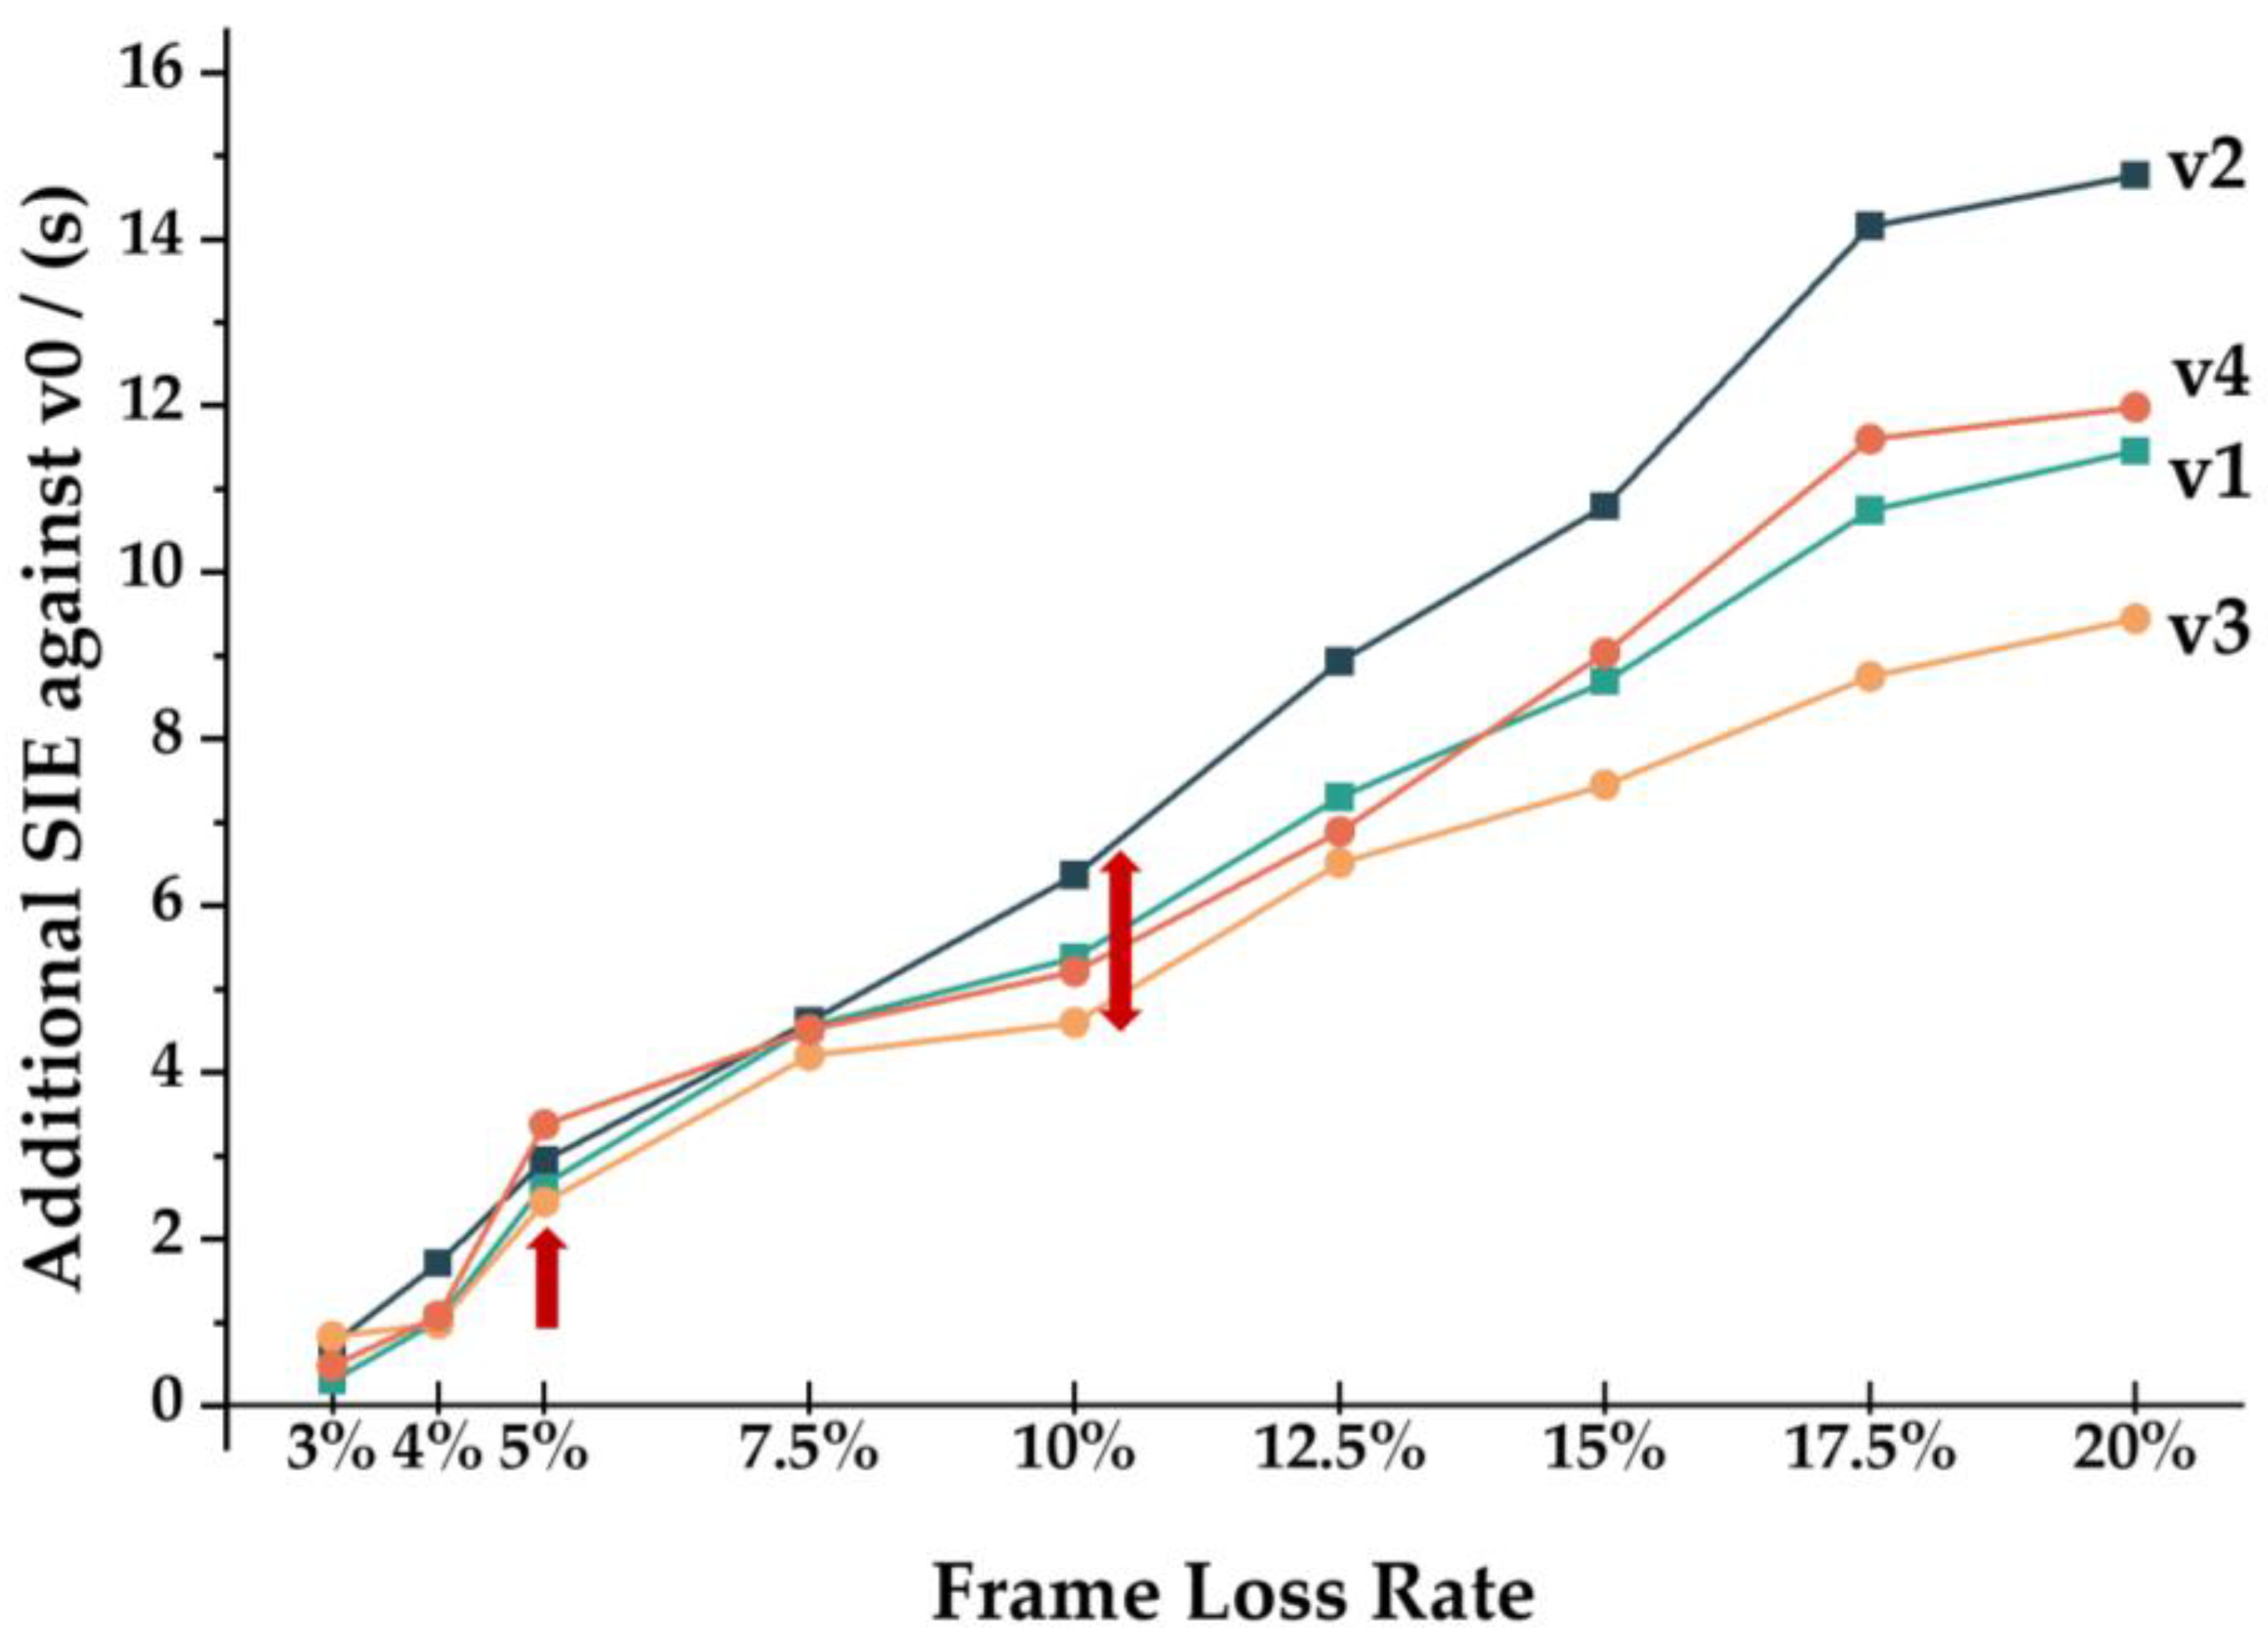
| Frame Loss Rate | 3% | 4% | 5% | 7.5% | 10% | 12.5% | 15% | 17.5% | 20% |
|---|---|---|---|---|---|---|---|---|---|
| Means/(s) | 0.59 | 1.14 | 2.82 | 4.36 | 5.26 | 7.15 | 8.74 | 11.14 | 11.75 |
| /(s) | 0.24 | 0.34 | 0.42 | 0.24 | 0.74 | 1.06 | 1.33 | 2.11 | 2.26 |
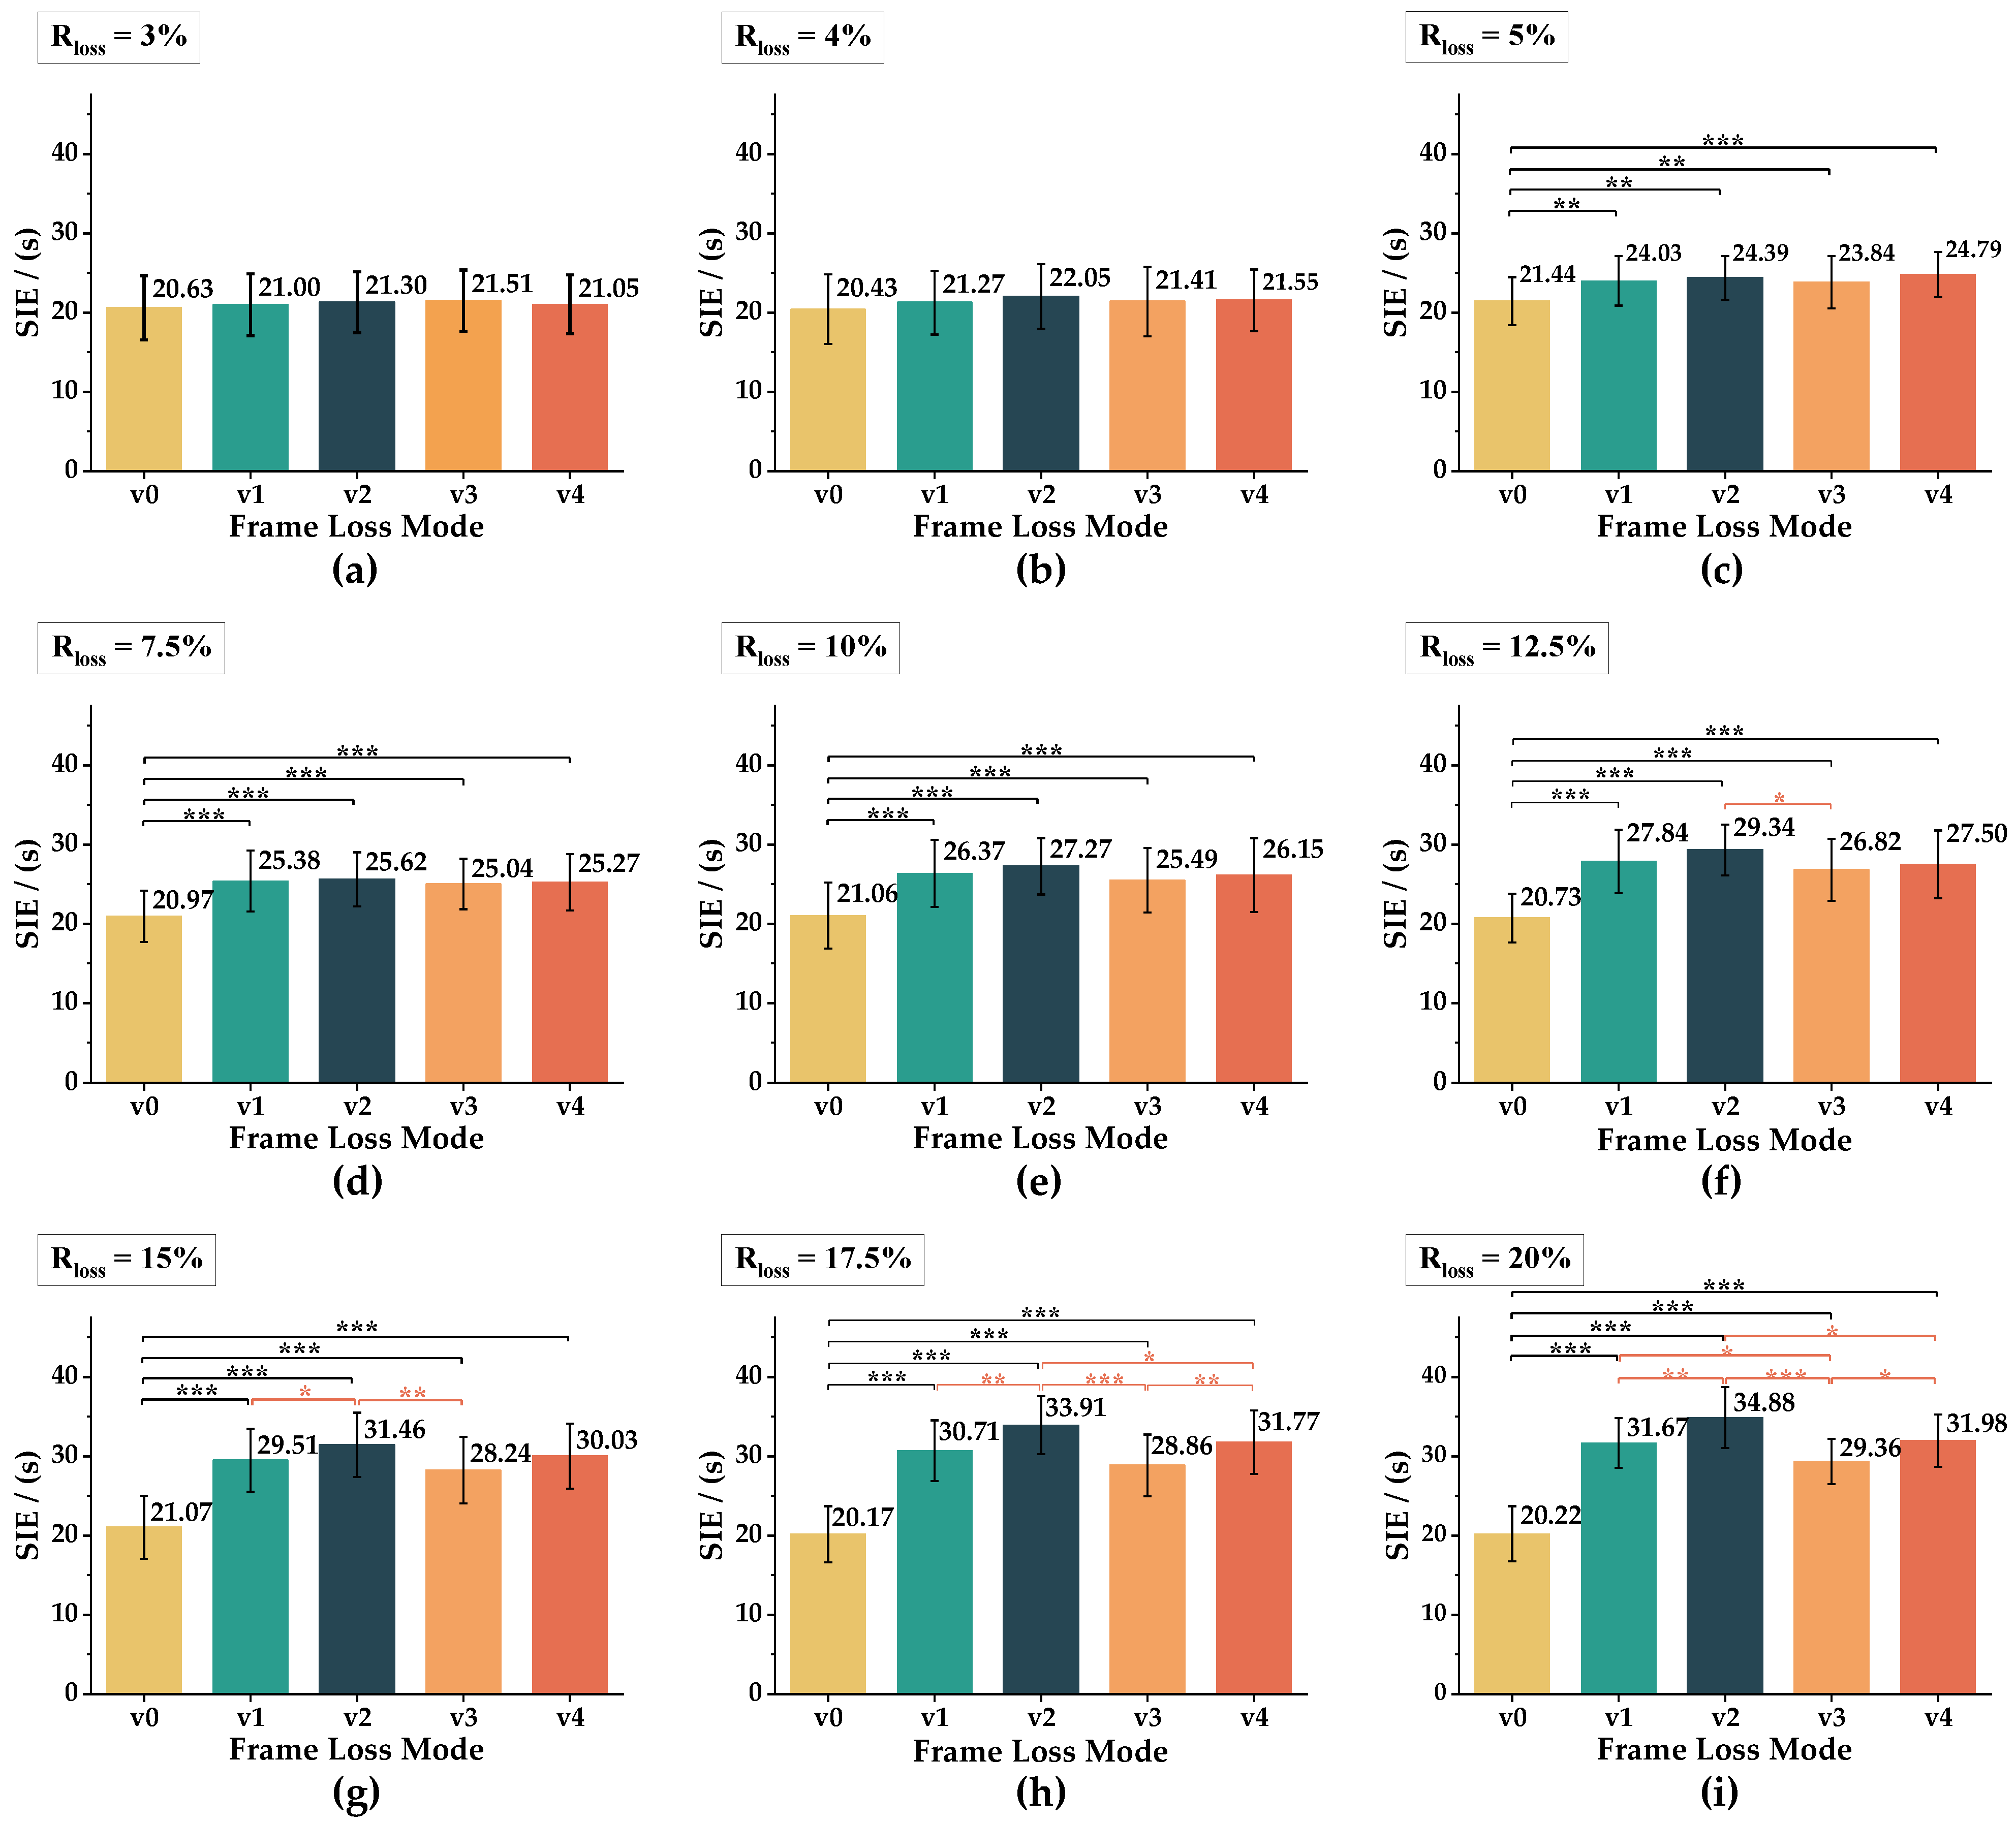
| Frame Loss Rate | Repeated Measures ANOVA Results | Post hoc Results | |
|---|---|---|---|
| 3% | F = 0.570 p = 0.655 partial η2 = 0.029 | / | |
| 4% | F = 1.14 p = 0.341 partial η2 = 0.057 | / | |
| 5% | F = 5.75 p = 0.002 ** partial η2 = 0.232 | v0–v1: MD = 2.58, p = 0.001 ** v0–v3: MD = −2.40, p = 0.001 ** | v0–v2: MD = −2.95, p = 0.003 ** v0–v4: MD = −3.35, p < 0.001 *** |
| 7.5% | F = 8.76 p < 0.001 *** partial η2 = 0.316 | v0–v1: MD = −4.41, p < 0.001 *** v0–v3: MD = −4.07, p < 0.001 *** | v0–v2: MD = −4.65, p < 0.001 *** v0–v4: MD = −4.30, p < 0.001 *** |
| 10% | F = 10.28 p < 0.001 *** partial η2 = 0.351 | v0–v1: MD = −5.31, p < 0.001 *** v0–v3: MD = −4.44, p < 0.001 *** | v0–v2: MD = −6.21, p < 0.001 *** v0–v4: MD = −5.10, p < 0.001 *** |
| 12.5% | F = 22.36 p < 0.001 *** partial η2 = 0.541 | v0–v1: MD = −7.12, p < 0.001 *** v0–v3: MD = −6.10, p < 0.001 *** v2–v3: MD = 2.52, p = 0.016 * | v0–v2: MD = −8.62, p < 0.001 *** v0–v4: MD = −6.77, p < 0.001 *** |
| 15% | F = 71.29 p < 0.001 *** partial η2 = 0.790 | v0–v1: MD = −8.44, p < 0.001 *** v0–v3: MD = −7.18, p < 0.001 *** v1–v2: MD = −1.95, p = 0.035 * | v0–v2: MD = −10.39, p < 0.001 *** v0–v4: MD = −8.97, p < 0.001 *** v2–v3: MD = 3.22, p = 0.003 ** |
| 17.5% | F = 41.48 p < 0.001 *** partial η2 = 0.686 | v0–v1: MD = −10.54, p < 0.001 *** v0–v3: MD = −8.69, p < 0.001 *** v1–v2: MD = −3.20, p = 0.001 ** v3–v4: MD = −2.91, p = 0.009 ** | v0–v2: MD = −13.73, p < 0.001 *** v0–v4: MD = −11.60, p < 0.001 *** v2–v3: MD = 5.05, p < 0.001 *** v2–v4: MD = 2.13, p = 0.031 * |
| 20% | F = 66.57 p < 0.001 *** partial η2 = 0.778 | v0–v1: MD = −11.44, p < 0.001 *** v0–v3: MD = −9.13, p < 0.001 *** v1–v2: MD = −3.22, p = 0.004 ** v2–v3: MD = 5.53, p < 0.001 *** v3–v4: MD = −2.63, p = 0.016 * | v0–v2: MD = −14.66, p < 0.001 *** v0–v4: MD = −11.76, p < 0.001 *** v1–v3: MD = 2.31, p = 0.012 * v2–v4: MD = 2.90, p = 0.019 * |
Disclaimer/Publisher’s Note: The statements, opinions and data contained in all publications are solely those of the individual author(s) and contributor(s) and not of MDPI and/or the editor(s). MDPI and/or the editor(s) disclaim responsibility for any injury to people or property resulting from any ideas, methods, instructions or products referred to in the content. |
© 2024 by the authors. Licensee MDPI, Basel, Switzerland. This article is an open access article distributed under the terms and conditions of the Creative Commons Attribution (CC BY) license (https://creativecommons.org/licenses/by/4.0/).
Share and Cite
Fang, H.; Chen, Y.; Teng, D.; Luo, J.; Wu, S.; Zheng, J.; Wang, J.; Chen, Z.; Liu, L. Frame Loss Effects on Visual Fatigue in Super Multi-View 3D Display Technology. Electronics 2024, 13, 1461. https://doi.org/10.3390/electronics13081461
Fang H, Chen Y, Teng D, Luo J, Wu S, Zheng J, Wang J, Chen Z, Liu L. Frame Loss Effects on Visual Fatigue in Super Multi-View 3D Display Technology. Electronics. 2024; 13(8):1461. https://doi.org/10.3390/electronics13081461
Chicago/Turabian StyleFang, Hongjin, Yu Chen, Dongdong Teng, Jin Luo, Siying Wu, Jianming Zheng, Jiahui Wang, Zimin Chen, and Lilin Liu. 2024. "Frame Loss Effects on Visual Fatigue in Super Multi-View 3D Display Technology" Electronics 13, no. 8: 1461. https://doi.org/10.3390/electronics13081461
APA StyleFang, H., Chen, Y., Teng, D., Luo, J., Wu, S., Zheng, J., Wang, J., Chen, Z., & Liu, L. (2024). Frame Loss Effects on Visual Fatigue in Super Multi-View 3D Display Technology. Electronics, 13(8), 1461. https://doi.org/10.3390/electronics13081461