Article

Enhancing Precision of Telemonitoring of COVID-19 Patients through Expert System Based on IoT Data Elaboration

1
Department of Information Engineering, University of Pisa, 56122 Pisa, Italy
2
Tuscan Agenzia Regionale Sanità, 50141 Florence, Italy
3
Department of Clinical and Experimental Medicine, University of Pisa, 56126 Pisa, Italy
4
Operational Unit Medicine I, Azienda Ospedaliera Universitaria Pisana (AOUP), 56126 Pisa, Italy
*
Authors to whom correspondence should be addressed.
Electronics 2024, 13(8), 1462; https://doi.org/10.3390/electronics13081462
Submission received: 1 March 2024 / Revised: 9 April 2024 / Accepted: 10 April 2024 / Published: 12 April 2024

Abstract

:
The emergence of the highly contagious coronavirus disease has led to multiple pandemic waves, resulting in a significant number of hospitalizations and fatalities. Even outside of hospitals, general practitioners have faced serious challenges, stretching their resources and putting themselves at risk of infection. Telemonitoring systems based on Internet of things technology have emerged as valuable tools for remotely monitoring disease progression, facilitating rapid intervention, and reducing the risk of hospitalization and mortality. They allow for personalized monitoring strategies and tailored treatment plans, which are crucial for improving health outcomes. However, determining the appropriate monitoring intensity remains the responsibility of physicians, which poses challenges and impacts their workload, and thus, can hinder timely responses. To address these challenges, this paper proposes an expert system designed to recommend and adjust the monitoring intensity for COVID-19 patients receiving home treatment based on their medical history, vital signs, and reported symptoms. The system underwent initial validation using real-world cases, demonstrating a favorable performance (F1-score of 0.85). Subsequently, once integrated with an Internet of Things telemonitoring system, a clinical trial will assess the system’s reliability in creating telemonitoring plans comparable with those of medics, evaluate its effectiveness in reducing medic–patient interactions or hospitalizations, and gauge patient satisfaction and safety.

1. Introduction

Coronavirus disease 2019 (COVID-19) has emerged as a highly transmissible viral disease [1] given the inherent characteristics of the virus [2,3], the initial absence of specific antibodies in the majority of the population, and the rapid development of several different variants of the original SARS-CoV-2 [4], making the immunization obtained from previous infection or vaccinations less effective in counteracting the spread of the disease. Owing to these characteristics, several pandemic waves have been recorded in different countries, and complete protection from SARS-CoV-2 infection has not been achieved, even with the development of effective vaccines [3]. The magnitude of the pandemic waves, the lack of knowledge about the disease, and the absence of effective therapies capable of treating the more advanced stages of COVID-19 syndrome often made the response by healthcare facilities insufficient, leading to a significant number of hospitalizations and in-hospital deaths during the first and second pandemic waves. One of the factors that had the greatest impact on the prognosis of patients hospitalized for COVID-19 was the use of healthcare system facilities only in the advanced stages of illness, when not only bilateral pneumonia but also multi-organ systemic involvement contributed to the prognosis [5]. In addition, the substantial flow of patients with severe forms of COVID-19 in the hospitals has diverted significant resources away from the management of other frail patients with chronic diseases who could not get the same level of care provided in the pre-pandemic period due to the shortages caused by hospital beds and physicians being dedicated to pandemic management [6,7,8]. Even in the out-of-hospital setting, the number of positive cases has often exceeded the management capacity of general practitioners (GPs), who have been forced to make a significant effort, combined with the high risk of infection, to best manage positive cases. This has led to the wide application of telemedicine in the management of the COVID-19 pandemic, with several experiences described in the scientific literature [9,10] showing that telemonitoring is safe [11] and holds benefits for both patients and healthcare providers [12,13,14]. Furthermore, telemedicine provides a viable means to aid in the treatment of other illnesses and chronic conditions [15].
Through the use of telemonitoring systems, the hospital or community physicians have remote control of the evolution of the disease, ultimately enabling rapid intervention in the case of early signs of deterioration [16] and maximizing the possibility of establishing effective therapies aimed at reducing the risk of hospitalization [17] and mortality [18]. Modern remote monitoring systems also allow for flagging subjects that are at higher risk of deterioration, thus enabling streamlining and reducing repeated home visits for stable patients [19]. This helps in concentrating the time dedicated by physicians to the care of patients that require more intensive support [20] and decreasing unnecessary exposure of patients and personnel to SARS-CoV-2 [15].
The provision of effective, accessible, and patient-centered telemonitoring services, which is applicable to both COVID-19 patients and individuals with chronic conditions, relies on Internet of things (IoT) technology and its associated applications [21,22,23]. These technologies facilitate the remote collection, transmission, storage, and analysis of patient health data. Specifically, telemonitoring systems based on IoT seamlessly integrate a variety of interconnected smart devices and biomedical sensor networks that patients employ to actively monitor their health parameters, such as different vital signs [24,25,26] and activity levels [27]. These IoT devices include digital scales; blood pressure monitors; thermometers; pulse oximeters; electrocardiographs; spirometers; and a wide range of wearable devices, such as smart bracelets, chest straps, and sensorized shirts. The acquired health data is collected by an IoT gateway, which is typically deployed with either mobile applications [28] or specialized embedded systems [29], using wireless communication protocols (i.e., Bluetooth, Wi-Fi, Zigbee). Subsequently, these data are forwarded to a centralized cloud-based platform, which ensures secure storage, anywhere and anytime data access to physicians, and scalable processing of incoming data [30], as well as exploiting artificial intelligence (AI) for prevention, diagnosis, clinical risk assessment, and alarm generation purposes.
The versatility and modular design of IoT telemonitoring systems enable establishing personalized remote monitoring strategies and treatment plans aligned with individual patient risk and actual needs [31], which are vital to improving health outcomes. For example, Ref. [32] reported 87% fewer hospitalizations and 77% fewer deaths in patients followed-up at home with telemonitoring. In this regard, choosing the appropriate monitoring intensity (i.e., the kind and frequency of data collection) throughout the progression of the disease is essential for constructing a precise and comprehensive dataset that accurately reflects the patient’s real condition. This enables the timely identification of indicators that predicts complications, thereby assisting clinicians in making more informed interventions.
Nevertheless, even in the most recent telemonitoring systems, physicians still bear full responsibility for managing the monitoring intensity, which can significantly impact their workload. This poses two potential challenges to the effective implementation of telemonitoring services in COVID-19 management. The first arises from the initial selection of the monitoring plan, which can be challenging [33] and often relies on subjective rather than objective criteria determined by physicians. Additionally, the workload imposed on hospital and community physicians during pandemics often hinders prompt responses to potential changes in patients’ clinical conditions [34]. Consequently, the deterioration of a clinical parameter and the subsequent adjustment of the monitoring plan may require significant time, reducing the opportunity to capture reliable and early disease progression trajectories. It is worth noticing that similar challenges exist in other progressive diseases characterized by acute manifestations requiring hospitalization, typically following phases of health rapid deterioration (e.g., heart failure and pulmonary diseases).
In order to reduce physicians’ workloads and support their decision-making processes for personalized treatment tailored to each patient’s unique needs, telemonitoring systems can be integrated with analytic AI-based algorithms [35]. These algorithms mainly assist in the initial diagnosis, screening, and prediction of patients at risk, as well as the detection of patterns, trends, anomalies, and changes in health status by analyzing patients’ individual clinical, anamnestic, instrumental, and IoT data [36,37].
In the literature, numerous examples showcase the utilization of AI tools in addressing the COVID-19 pandemic. For instance, Mufid et al. [38] introduced a rule-based expert system (ES) for early COVID-19 diagnosis, utilizing 16 questions to calculate a risk score for contracting the virus. Henderi et al. [39] proposed a forward-chaining reasoning method to achieve the same objective based on 10 possible experienced symptoms. In [40], a decision tree that incorporated medical knowledge was utilized for the early detection and severity stratification of viral infections, taking into account respiratory and cardiovascular parameters. Additionally, Mohebbi et al. [41] presented a fuzzy inference system for categorizing COVID-19 patients based on illness severity, using inputs such as oxygen saturation, lung infection rate, respiratory rate, and the presence of clinical symptoms. Concerning the progression of the disease, a rule-based ES that aims at detecting dangerous trends in the patient’s short- and long-term vital signs is presented in [42]. In addition to ESs, machine learning (ML) techniques are applied to support healthcare professionals. For example, the AI-SCoRE algorithm employs ML models to analyze chest X-ray images (CXIs) and clinical data obtained from patients at the onset of COVID-19 symptoms, providing a prognostic risk score [43]. Guarrasi et al. [44] utilized convolutional neural networks (CNNs) on CXIs for COVID-19 diagnosis. Panicacci et al., in contrast, proposed ML tools in [45] for the early identification of high-risk patients with concurrent chronic diseases starting from administrative and socio-economics data. In [46], a support vector machine (SVM) and random forest (RF) were instead applied to CXIs for COVID-19 diagnosis and severity prediction, respectively. Moreover, the same ML classification schemes (i.e., SVM and RM) were used in [47] for the early determination of the presence of the virus and predict the risk based on vital parameters and perceived symptoms. Moreover, CNNs are also widely used to classify the COVID-19 patient health status by exploiting IoT physiological data, such as body temperature, heart rate, oxygen level, blood pressure, and couch-related audio signals [48,49,50]. It is worth noting that state-of-the-art AI applications use datasets whose richness is fixed or decided case by case by physicians. Consequently, datasets do not adapt to changing conditions or require additional effort from experts. To the best of our knowledge, there is currently no evidence in the literature of AI tools that were specifically designed to recommend the monitoring intensity based on a patient’s initial medical history and disease progression that also adapt to the dataset depth.
To tackle the aforementioned challenges, this paper introduces an expert system (ES) designed to suggest and adjust the monitoring intensity for COVID-19 patients undergoing home treatment according to the patient’s anamnesis, vital parameters, and reported symptoms. This solution, which is integrated with an IoT telemonitoring system, aims to streamline the identification of optimal monitoring strategies for patients experiencing rapid deterioration from COVID-19. By enhancing the precision and accuracy of personalized monitoring, it helps to increase the possibility of early interventions to mitigate unfavourable outcomes (i.e., hospitalization or death), as well as reducing the physician’s workload. Furthermore, this solution complements state-of-the-art data analysis solutions for risk prediction, alarm generation, etc., allowing the latter to rely on up-to-date and patient-tailored datasets.
The remainder of this paper is organized as follows. Section 2 describes the design of the knowledge base and the implementation of the ES. Section 3 presents the validation results. Section 4 outlines the clinical trial defined to assess the ES’s impact in medical practice. Section 5 discusses and contextualizes the results. Finally, conclusions are drawn in Section 6.

2. Expert System

2.1. Design

In broad terms, an ES is a computer program designed to mimic the decision-making abilities of a human expert in a particular field [51]. It employs AI and knowledge engineering techniques to replicate the expertise and reasoning of a skilled professional. Expert systems are utilized across multiple domains to address complex problems, make or support decisions, and provide valuable insights [52].
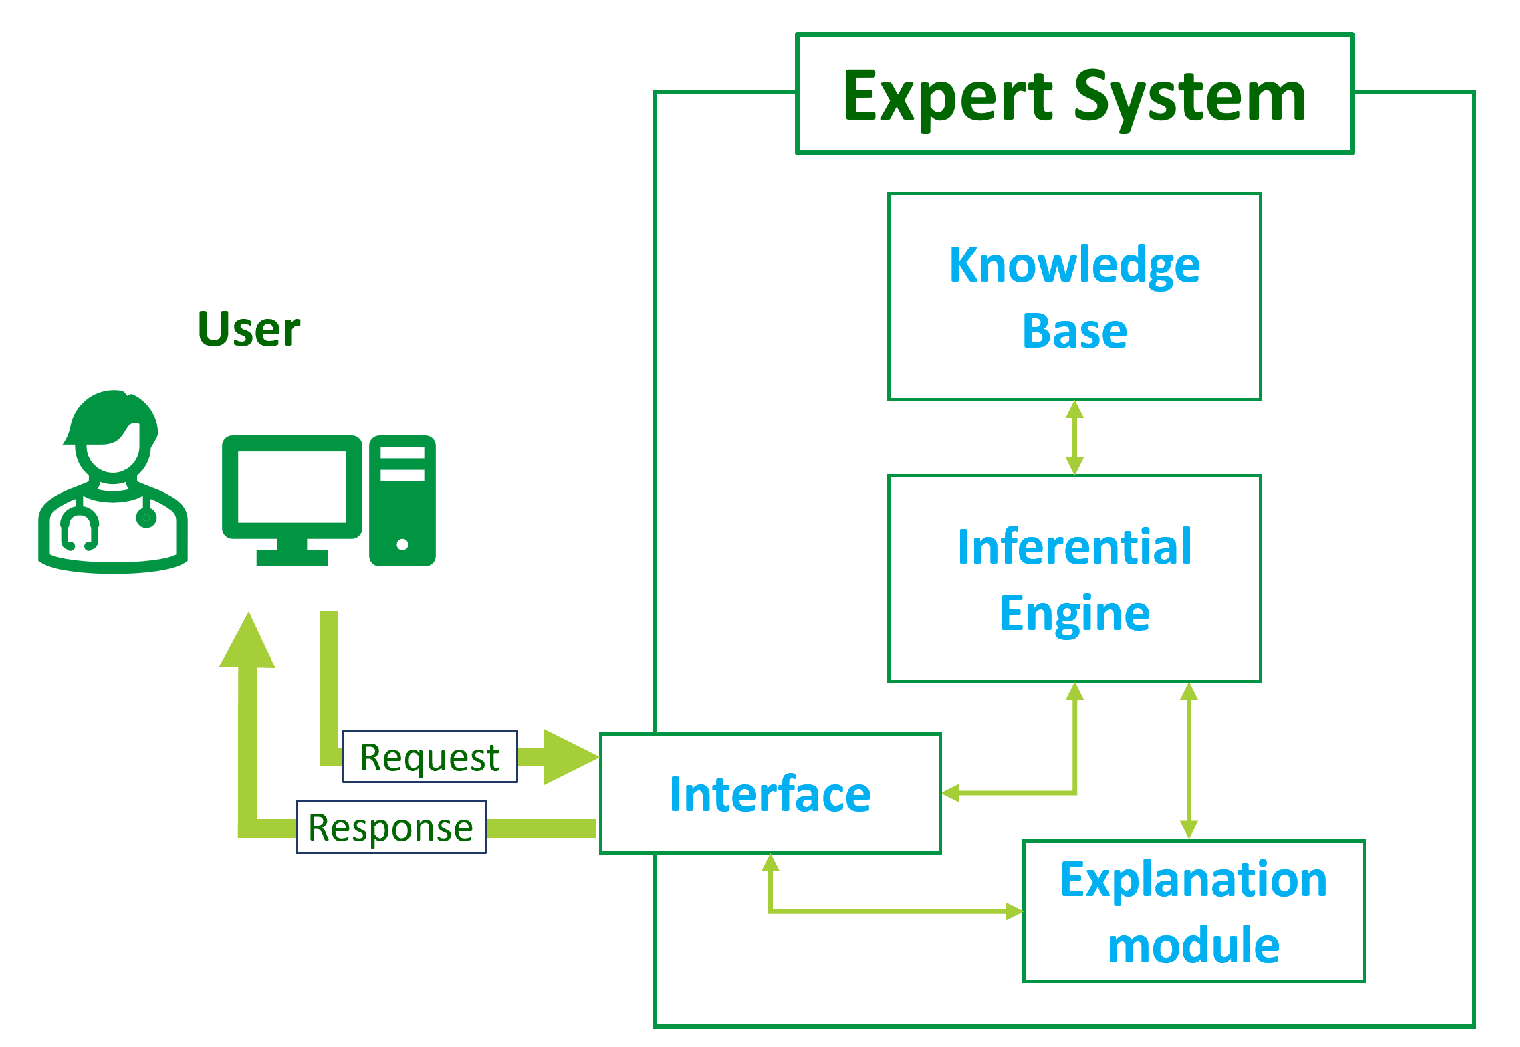
The general architecture of an ES consists of several modules (Figure 1):
  • Knowledge base: This central component stores information, facts, rules, and heuristics related to the specific domain of expertise. It encapsulates the knowledge of the human experts and is used for problem-solving.
  • Inferential engine: This is the reasoning component that processes information from the knowledge base using logical rules and inference mechanisms. It interprets incoming data, derives conclusions, and makes decisions based on the available knowledge.
  • Interface: This module allows for interacting with the ES to input data, ask questions, and receive recommendations or decisions. It can take various forms, including a graphical user interface, a command-line interface, or application programming interface (API) to enable machine-to-machine communication.
  • Explanation module: Such a module is often included to provide transparent insights into the reasoning process of the expert system. It helps users to understand the system’s decision-making logic and is crucial for building trust and confidence in the system’s decisions.
The design of an ES involves several steps, from knowledge acquisition to testing and validation. The first one consists of gathering knowledge from human experts in the targeted domain. This may involve interviews, documentation review, and observations to capture tacit knowledge (i.e., information that is not explicitly articulated or documented but is embedded in the experiences, intuitions, and practices of human experts). In the case of the proposed ES, the expert panel was a multidisciplinary medical team composed of general practitioners and specialized professionals proficient in managing and treating COVID-19 patients.
Then, the acquired knowledge needs to be modeled into a format suitable for computer processing. This often includes structuring information and defining relationships in a way that the inferential engine can use. Subsequently, the design of the inference mechanism takes place: it involves defining the logical processes and algorithms that the system will use to perform reasoning based on the information stored in the knowledge base; it focuses on creating the rules and procedures that guide the system’s inferential capabilities. Finally, before the testing and validation phases, the ES is provided with an interaction interface, which allows for effective bidirectional communication with the system.
The primary objective of the ES is to recommend the most suitable monitoring intensity for the patient at any given moment. This results in the proposal of more intensive monitoring for individuals considered to be at higher risk of deterioration and, conversely, milder monitoring in patients at lower risk. Therefore, the ES first assesses the patient’s risk level, then matches the risk with a monitoring plan whose intensity allows for enhancing the early detection of signs of aggravation. In this process, risk definition is based on a comprehensive patient characterization, which includes both pre-existing medical conditions and newly acquired IoT data coming from telemonitoring systems. In particular, the expert team identified nine relevant data categories that are representative of the knowledge to be analyzed for decision making:
  • Sex and potential menopausal status for females;
  • Anthropometric profile;
  • Age;
  • Working conditions;
  • Presence of problematic health conditions among the patient’s family members (e.g., arterial hypertension, diabetes, cardiomyopathy, and heart failure);
  • Habits related to smoking, alcohol, and substance use;
  • Underlying comorbidities the patient may have;
  • Antibody titer status for SARS-CoV-2 resulting from vaccinations and/or previous infections;
  • Vital parameters and symptoms.
To account for the significant amount of data that the ES uses, which may not always be completely available, the experts identified the most relevant factors for observing disease progression and made them strictly required for the input. This guarantees that the minimum dataset required to make a decision is always present, still leaving the possibility of improving the outcome personalization by providing the rest of the optional data.
Overall, the input data categories were modeled into 61 variables, as reported in Table 1. The table delineates each variable’s type, data source, optional or mandatory status, whether it belongs to static or dynamic patient knowledge, and its associated reasoning block.
These variables may be the result of some pre-processing, as in the case of data coming from IoT devices, or directly conveying the information already present in the electronic health record (EHR), as for anamnestic variables. In some cases, they are the result of a mixture of sources, as for “fever” (anamnesis and IoT device) or “signs of pneumonia” (anamnesis and EHR clinical registrations). A data source also reflects data variability: in fact, anamnestic data are expected to vary rarely or much slower than the disease progression, whereas information gathered from IoT devices changes at any time. For these reasons, the former are defined as “static” data and the latter as “dynamic”.
As far as the data type is concerned, a variable can be of type numerical, Boolean, select, or multiselect. In the case of a numerical variable, the rules compare its value against threshold to classify the patient into a category; in the other cases, the decision is based on equality checks over the assumed value. In the case of data coming from anamnesis, evaluation is done directly on the data as it is; in contrast, data from IoT devices are subjected to a more complex pre-processing, which is required to transform multiple sources of timestamped data into a single variable. In fact, IoT data comprise vital parameters obtained from biomedical sensors and responses from surveys conveyed through telemonitoring systems. Since the objective is to monitor the progression of the disease through the collection of clinical symptoms and the analysis of trends and variations, the processing of this data must consider the collection timestamp. In addition, the establishment of a health condition baseline is crucial, which is done using the initial anamnesis. Then, the contribution of surveys is dual: in some cases, they report symptoms that cannot be measured using sensors (e.g., cough); in others, they contribute to reported episodes that may have occurred but have not been measured. For instance, fever pre-processing is aimed at identifying its presence and determining its duration, particularly if it is has persisted beyond 72 h. Hence, the anamnesis is used to find out how many days the patient has been feverish at the time of enrollment, whereas the incoming temperature measurements and surveys are used to reconstruct the trend over time, especially over the past 72 h.
Table 2 reports the subset of input variables that are the result of the pre-processing of multiple data sources and details the associated vital parameter, whether surveys contribute to the evaluation, and what is the contribution of the anamnesis.
As already mentioned, IoT data (i.e., temperature, heart rate, respiratory acts, pulse oximetry, and survey) constitute the “dynamic” part of the input data, and its role is crucial in determining the evolution of COVID-19. Indeed, while static data provide the necessary clinical context for the patient, it is the IoT data that mainly enable timely and accurate updates to the monitoring intensity, giving dynamism and responsiveness to the whole system. This ultimately allows for enhancing the precision of the telemonitoring, with the aiming to improve the detection of potential rapid deteriorations of the clinical status.
The last column of Table 1 shows the variables’ reasoning block pertinence within the overall system. In fact, as the reasoning done by experts consists of several sub-decisions that collectively contribute to the final evaluation, to mimic this behavior, the knowledge base was organized into hierarchical blocks.
In general, a block is composed of a set of rules that together concur to give a value for a specific intermediate variable, which is provided as the output of the block. Intermediate variables from the decisions made at previous steps are maintained and propagated to subsequent levels of the hierarchy; hence, they also represent inputs to other blocks. In contrast, each block of the first layer uses a subset of the variables of Table 1 as the input, whereas the output of the last block represents the final output of the ES.
Table 3 further details the intermediate variables indicating the represented knowledge (the decision), the position in the reasoning hierarchy, and the values they can assume. It is worth noticing that these values are labels representing a category in which the patient can be framed; hence, their meaning is not immediately intelligible without additional support. On the whole, however, the explainability of the decision process is guaranteed, as explained in Section 2.2.
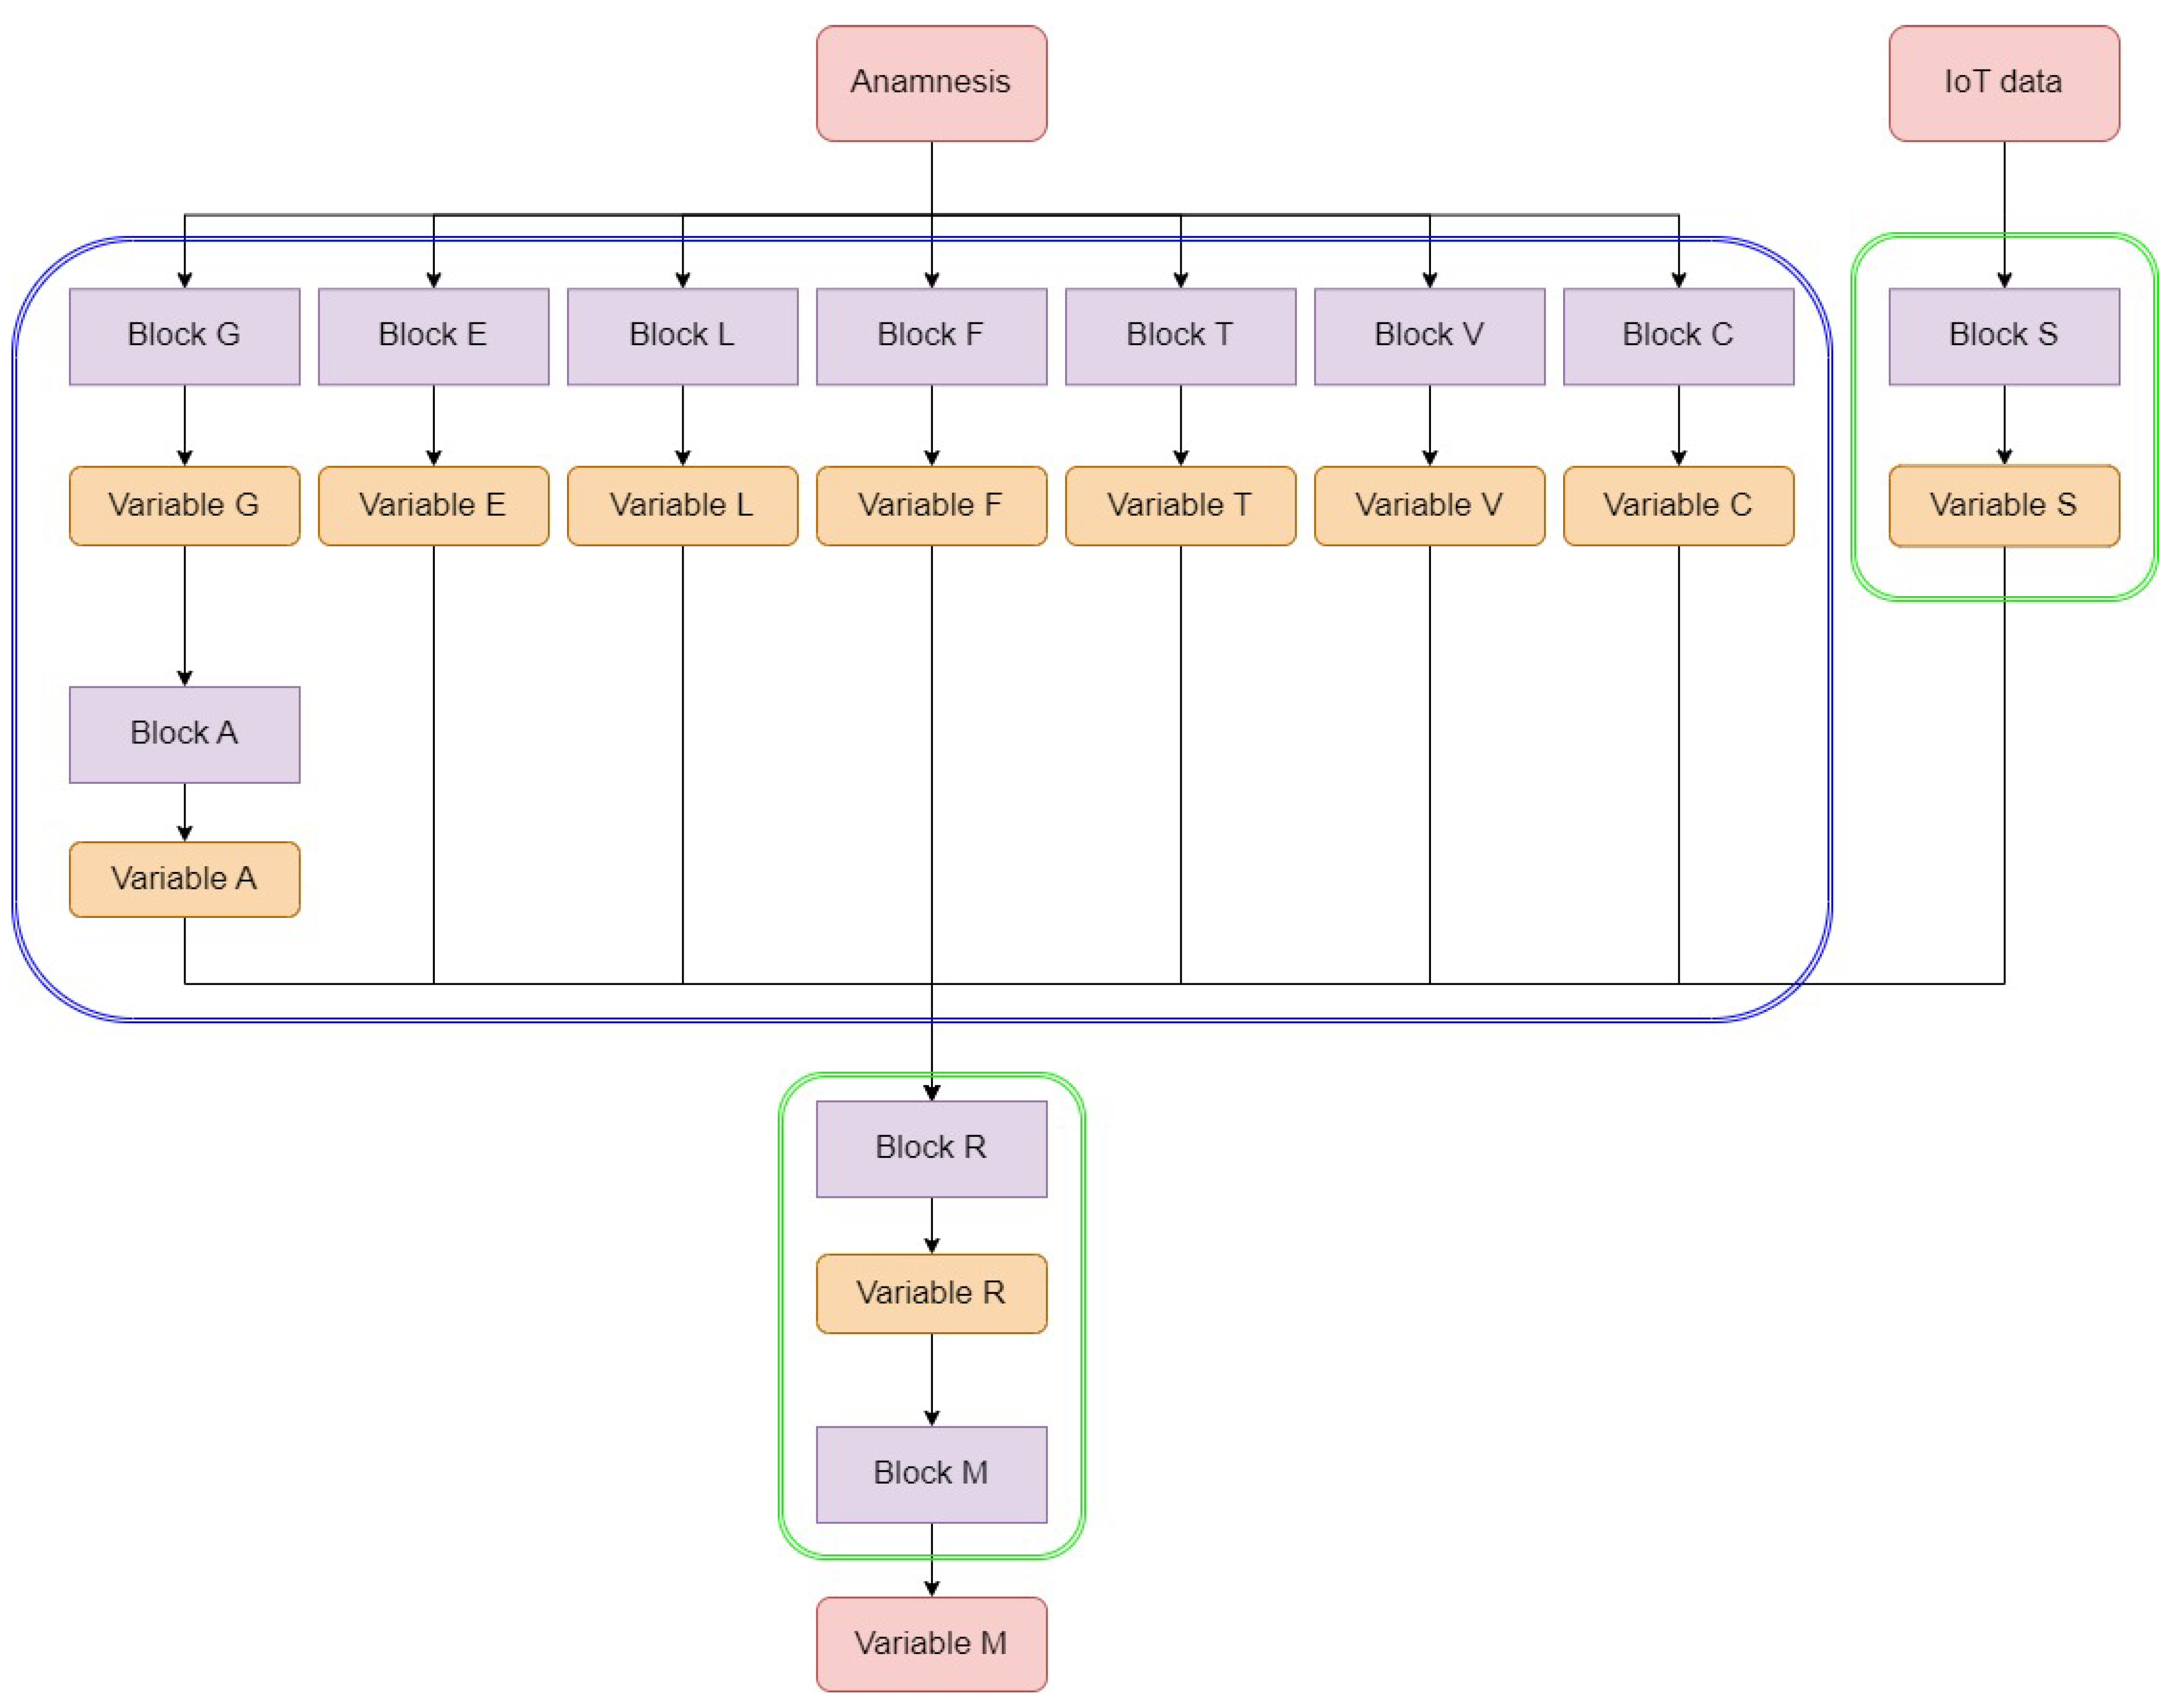
Figure 2 shows the block diagram of the proposed ES. Rounded red squares represent inputs and outputs of the ES, purple squares represent rule-based reasoning blocks, and the rounded orange squares are the intermediate variables. The ES is composed of a total of 11 blocks, whose evaluation proceeds from top to bottom: first, it takes partial decisions on ES input data that together provide a risk estimation (block R); then, it categorizes the risk into a specific monitoring intensity that can be low (LM), medium (MM), or high (HM).
Each block has a well-defined input, output, and decision role in the chain. More in detail:
  • Block S determines the value of the S variable, which is related to the stage of the disease (i.e., the level of severity), using the ES input data regarding vital parameters and clinical signs/symptoms present.
  • Block G provides the variable G, which identifies the sex of the patient and the possible menopausal condition in the case of females.
  • Block E calculates the variable E, which is aimed at identifying the age group to which the patient belongs. The only mandatory numeric input parameter is the patient’s age.
  • Block L identifies the working conditions and related risks to which the patient being evaluated is subjected. Output variable L is evaluated from a single optional input variable “Working condition”.
  • Block F considers the input data regarding the patient’s family history to determine the value of the output variable F, which is related to the specific risk due to the presence of diseases among the patient’s family members. In the presence of multiple familiarities related to different levels of risk, the policy is to consider the one with higher severity as the F output value.
  • Block T evaluates the patient’s smoking, alcohol, and substance abuse habits. Its output variable T can assume multiple values.
  • Block C is responsible for calculating the value of the multivalued variable C related to relevant past illnesses present in the patient being evaluated (i.e., comorbidities).
  • Block V decides the value of variable V, which represents the antibody titer status for SARS-CoV-2, which is derived from vaccinations received and/or the presence of prior infections.
  • Block A deals with the calculation of anthropometric characterization of the patient being evaluated from the anthropometric input variables shown in Table 1 and the partial output of block G. Output variable A represents an index of patient risk related to anthropometric factors.
  • Block R evaluates the overall risk by processing the intermediate results obtained from blocks S, A, E, L, F, T, C, and V. Thus, the output variable R provides an indication of the risk for the patient given the general and specific pictures outlined by the preceding blocks. The R stage does not directly receive any user-supplied input value.
  • Block M, which is the terminal of the processing chain, is responsible for defining the monitoring intensity for the patient based on the risk class calculated by the preceding R block. The output of the block, which is coincident with that of the whole system, is represented by the variable M.
Table 4 reports, for each block, the number of rules, the number of used inputs, and the name of the output variable. For the exhaustive list of the inputs, refer to Table 1 for the ES input data (the last column “Block pertinence” indicates the block to which the variable is provided as input) and Table 3 for the intermediate variables.
The designed block-based structure provides modularity to the system, facilitating the extension of the rule base and adaptation of the ES to various objectives. For instance, it is possible to reuse the static risk evaluation and simply substitute the block for vital parameter-based disease stage evaluation to create a new ES capable of supporting other diseases. Alternatively, by modifying only the M block, a different evaluation outcome for COVID-19 can be pursued.
In its entirety, the knowledge base comprises 140 rules and 72 variables for input, intermediate, and output results. Given the specific decision-oriented nature of the rules and the designed structure of the ES, the distinction made for input data into dynamic and static classes is also reflected in the rules: out of 140 rules, 76 are dedicated to dynamic data processing and 64 to static data processing. The distinction is also visible in Figure 2: block S receives incoming dynamic inputs, which are then propagated down in the hierarchy through variable S to block R and, ultimately, block M. This allows for considering dynamic health-related IoT data along the entire reasoning chain, improving the ES’s ability to provide suitable monitoring intensity for the patient. Figure 2 highlights static blocks by encircling them in blue and the dynamic ones in green.
Overall, the extensive rule set allows for intricate reasoning simulations, incorporating multiple pieces of clinical evidence, and delivering a comprehensive patient characterization that surpasses existing state-of-the-art tools.
As illustrated in Figure 2, the last deductive step consists of associating the monitoring intensity and the corresponding plan (i.e., the ES ultimate output) to the decided risk. A monitoring plan delineates the list of activities and their frequencies that the patient must undertake at home while utilizing a telemonitoring system. These activities encompass not only vital parameter measurements (such as temperature, pressure, and oximetry) but also walking tests and surveys.
The expert team formulated five distinct plans, which are detailed in Table 5. The three main plans (namely, LM, MM, and HM) exhibit a progressive escalation in the quantity and frequency of activities, which corresponds to an increasing level of patient risk. Additionally, two supplementary plans were introduced to prevent two contrasting scenarios: the complete absence of monitoring and excessive monitoring intensity for a non-severe/asymptomatic patient. The former may happen if the ES is not able to make a decision, for example, in the case of contradictory, imprecise, or incomplete input data. To mitigate the consequences of such a problem and safeguard the safety and health of patients, a precautionary principle is implemented: in case no decision is made, the “Mparachute” plan is given as output, which follows the most complete and intensive plan available. Conversely, to alleviate an unnecessary burden, the “Msurvey” plan is proposed after a patient has followed the LM plan for 7 consecutive days. In this case, the patient is considered at low risk and there have been, for a sufficient amount of time, no notable exacerbations necessitating heightened monitoring, which justifies the easing. This approach offers enhanced patient comfort while leaving minimal monitoring in place, thus allowing for preserving the detection of any changes and a subsequent timely response.
In summary, the designed ES initially establishes the patient’s baseline risk by considering anthropometric, physiological, family, and pharmacological data, along with a clinical-pathological history, comorbidities, and SARS-CoV-2 vaccination status. Subsequently, the stage of COVID-19 is determined through the analysis of measured vital parameters and clinical symptoms. These deductions contribute to define the overall risk classification, which ultimately contributes to the selection or development of a tailored monitoring plan for the current clinical scenario.

2.2. Implementation

The implementation phase involved translating the conceptual framework, rules, and logic defined during the design stage into a working software application. The proposed ES was implemented utilizing the well-known Spring framework (version 5.1.5) for the application development and incorporates the Java library RuleBook (version 0.12), which provides a programmer-friendly way to build and evaluate a custom set of rules.
Specifically, RuleBook provides a Java domain-specific language (DSL) using the given–when–then format to implement rules and an inferential engine to infer knowledge from the input data. RuleBook’s inferential engine is based on forward chaining and implements the “chain of responsibility” (CoR) pattern. The former is a reasoning strategy in which the expert system starts with available data or facts and works forward to infer conclusions or make decisions; it involves applying rules to the existing data and triggering actions based on the conditions specified in those rules. The latter is a behavioral design pattern where a set of handler objects are organized in a chain and each of them has the capability to process a request that may either handle it or pass it along the chain to the next handler. Utilizing the CoR, rules are systematically examined in sequential order, and this adherence to a structured examination is crucial for maintaining alignment with the designed system. Moreover, the flexibility of the CoR allows for the incorporation of thousands of rules, providing ample capability for the ES’s intended purposes.
RuleBook works with rules and facts. Rules are the basic building blocks and the knowledge handlers of the CoR pattern. They evaluate and act on facts, which are the information provided in the form of a name/value pair. The same set of rules can be used in different threads with different facts without conflicts. Furthermore, the generated outcomes are appropriately partitioned on a per-thread basis, and there is provision for thread pooling. Consequently, the execution of an ES with varying facts across multiple threads ensures distinct results, effectively avoiding conflicts and definitively improving the performance. This characteristic makes a RuleBook-defined ES perfectly suited for the Spring framework environment.
Rule specification is achievable either through a Lambda-enabled DSL or by utilizing user-defined plain old Java objects (POJOs) that are properly annotated. Considering the choice of the Spring framework and the fact that RuleBook instances can be injected if created as annotated POJOs, this latter strategy was adopted. A rule is therefore implemented with a dedicated Java class and annotated with the @Rule and @RuleBean specific annotations, which enable proper management and injection within the Spring environment. Such a class must also have two private fields annotated with @Given and @Result, respectively, to map the input and the output of the rule, and it must define two methods, namely, one annotated with @When and the other with @Then. These are the fundamental elements of a rule since the former defines the condition that verifies the rule and “fires” the corresponding action, which is detailed in the latter method.
Considering the aforementioned method, the entire knowledge base was translated into Java classes, one per rule, and the admissible values for input and intermediate variables were mapped on primitive and enumeration Java types.
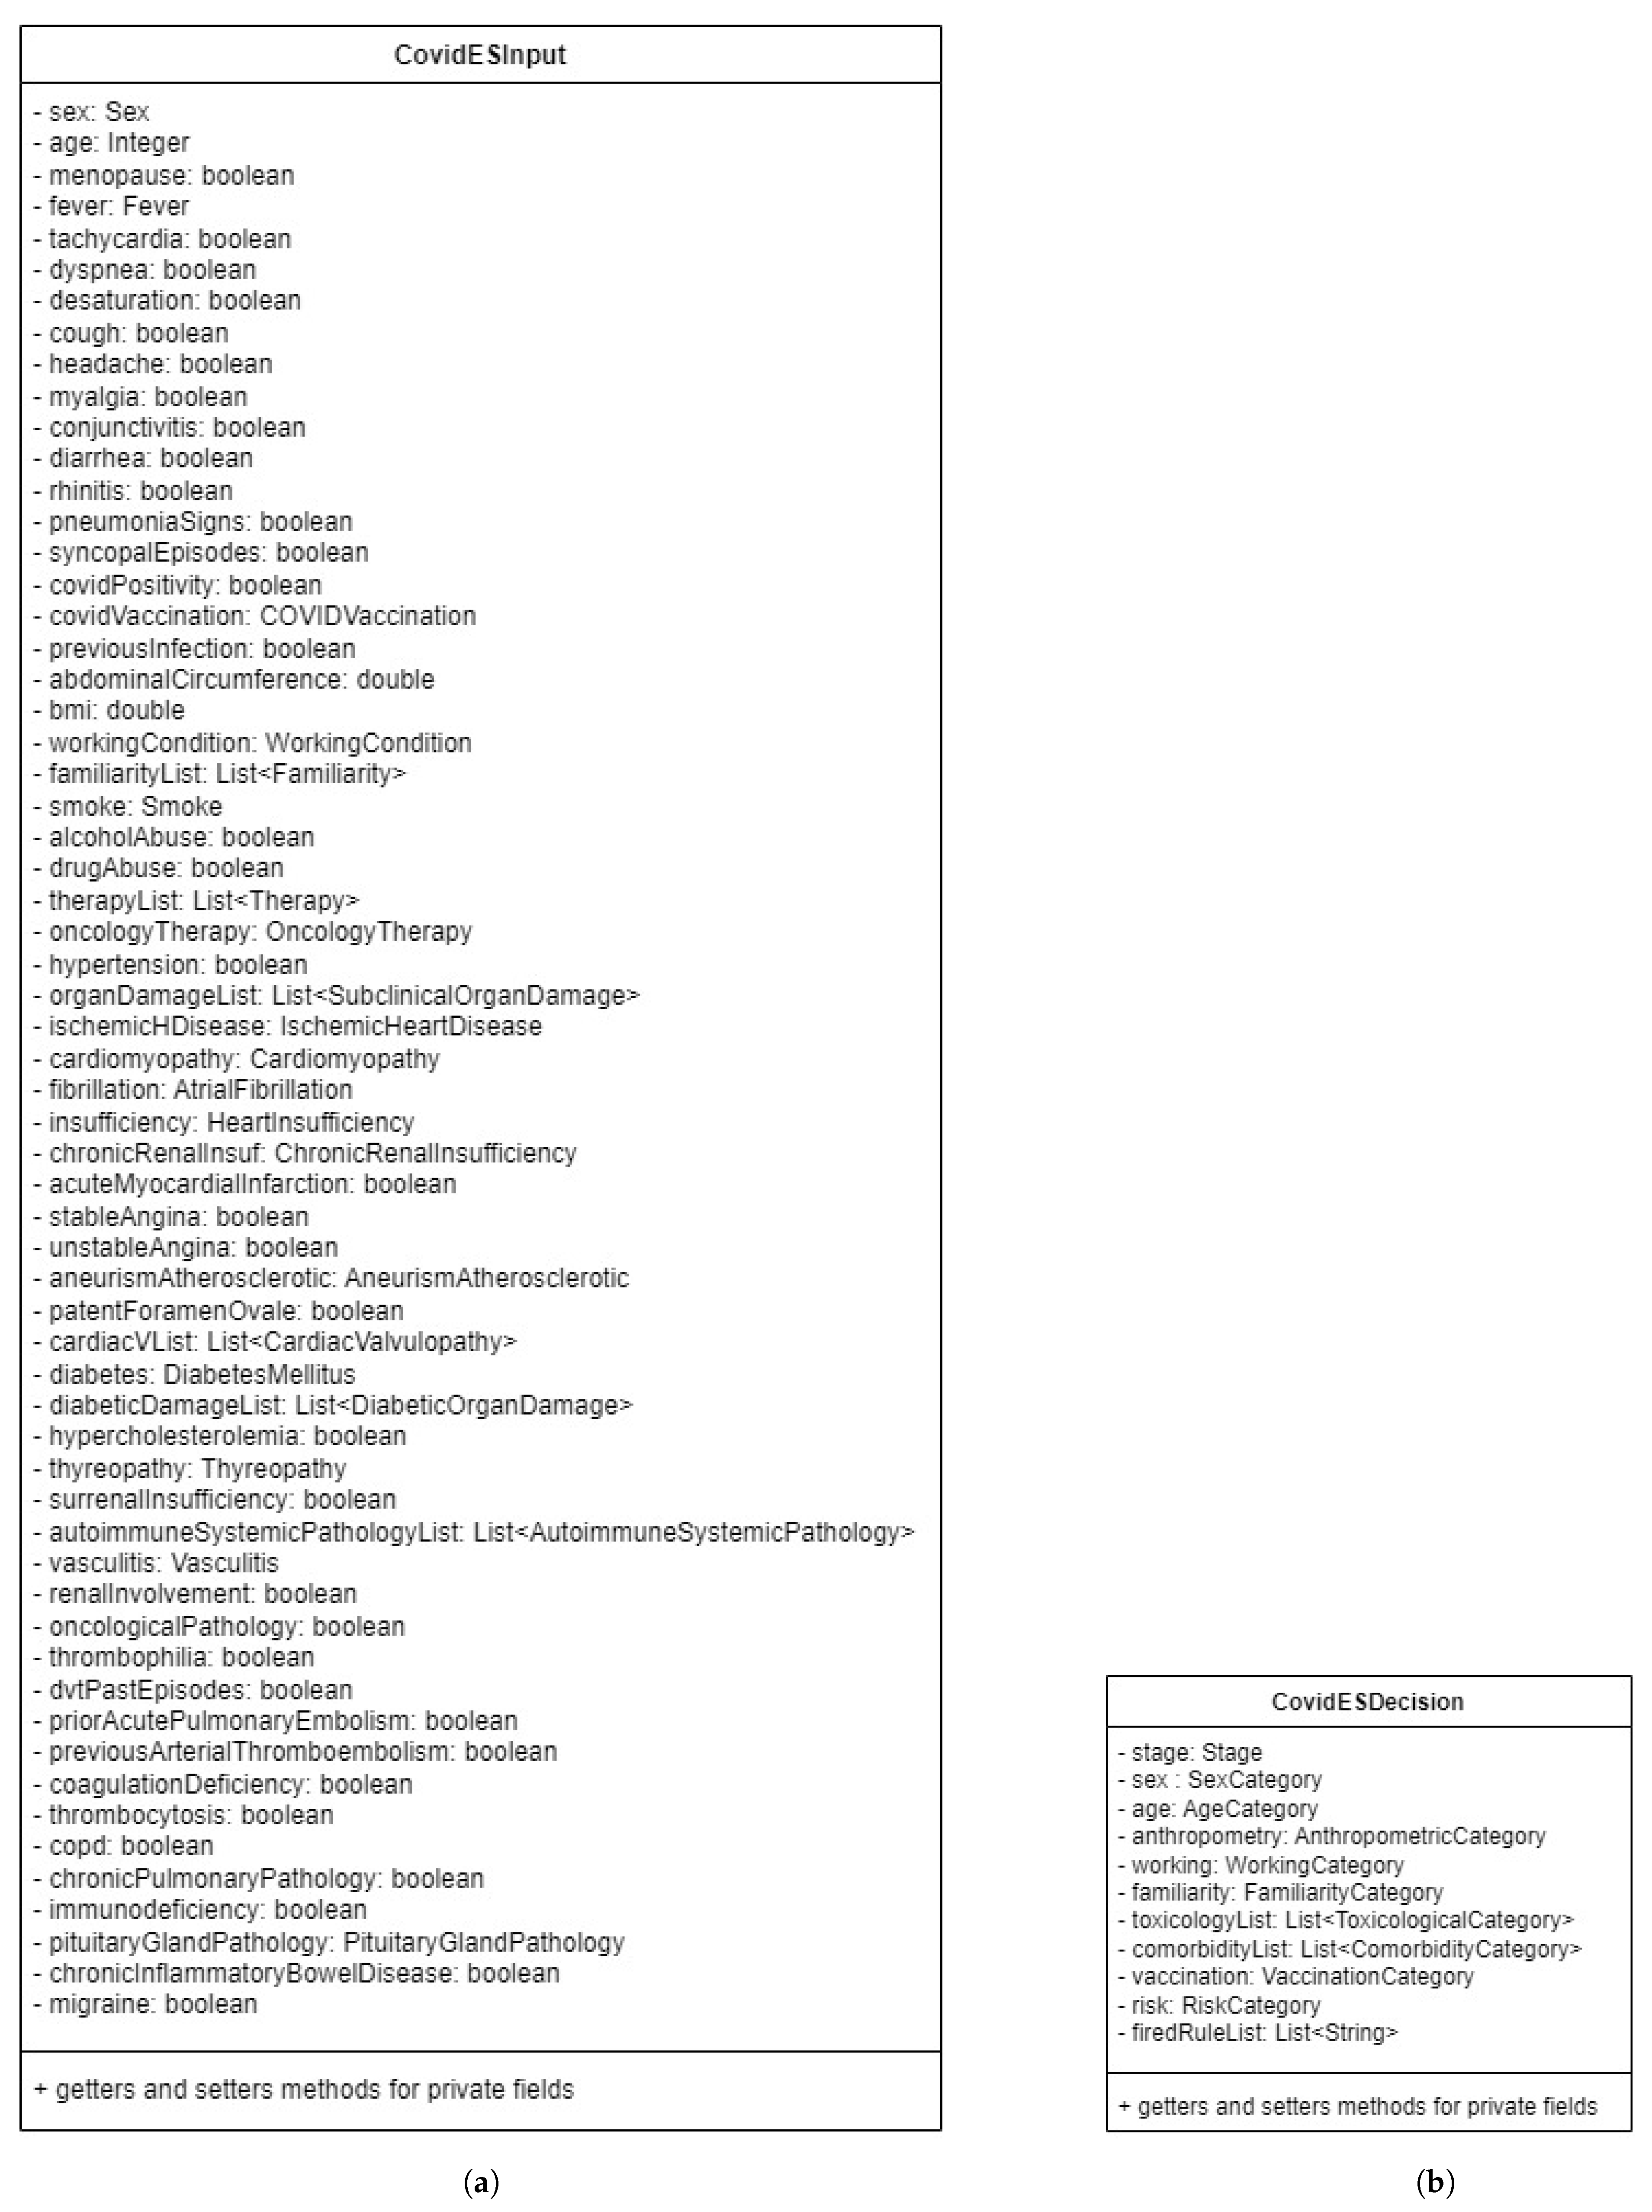
In addition, two custom classes were defined: one that is used to model the input of the ES and used as an input fact (i.e., the @Given-annotated object), and the other to represent the outcome of the system (i.e., the @Result-annotated field). The input class contains all the variables defined in Table 1, whereas the output class accommodates both the intermediate and output variables. Although the ES output consists solely of the chosen monitoring plan, for explanation purposes, the ES also provides information about the intermediate decisions taken and the list of rules activated during the facts evaluation. RuleBook supports such information propagation by exploiting the @Given and @Result objects, whose instances are passed through all the rules and their values can be updated as part of the action done when the rule is fired. A simplified class diagram of the input and output classes (CovidESInput and CovidESDecision, respectively) is shown in Figure 3.
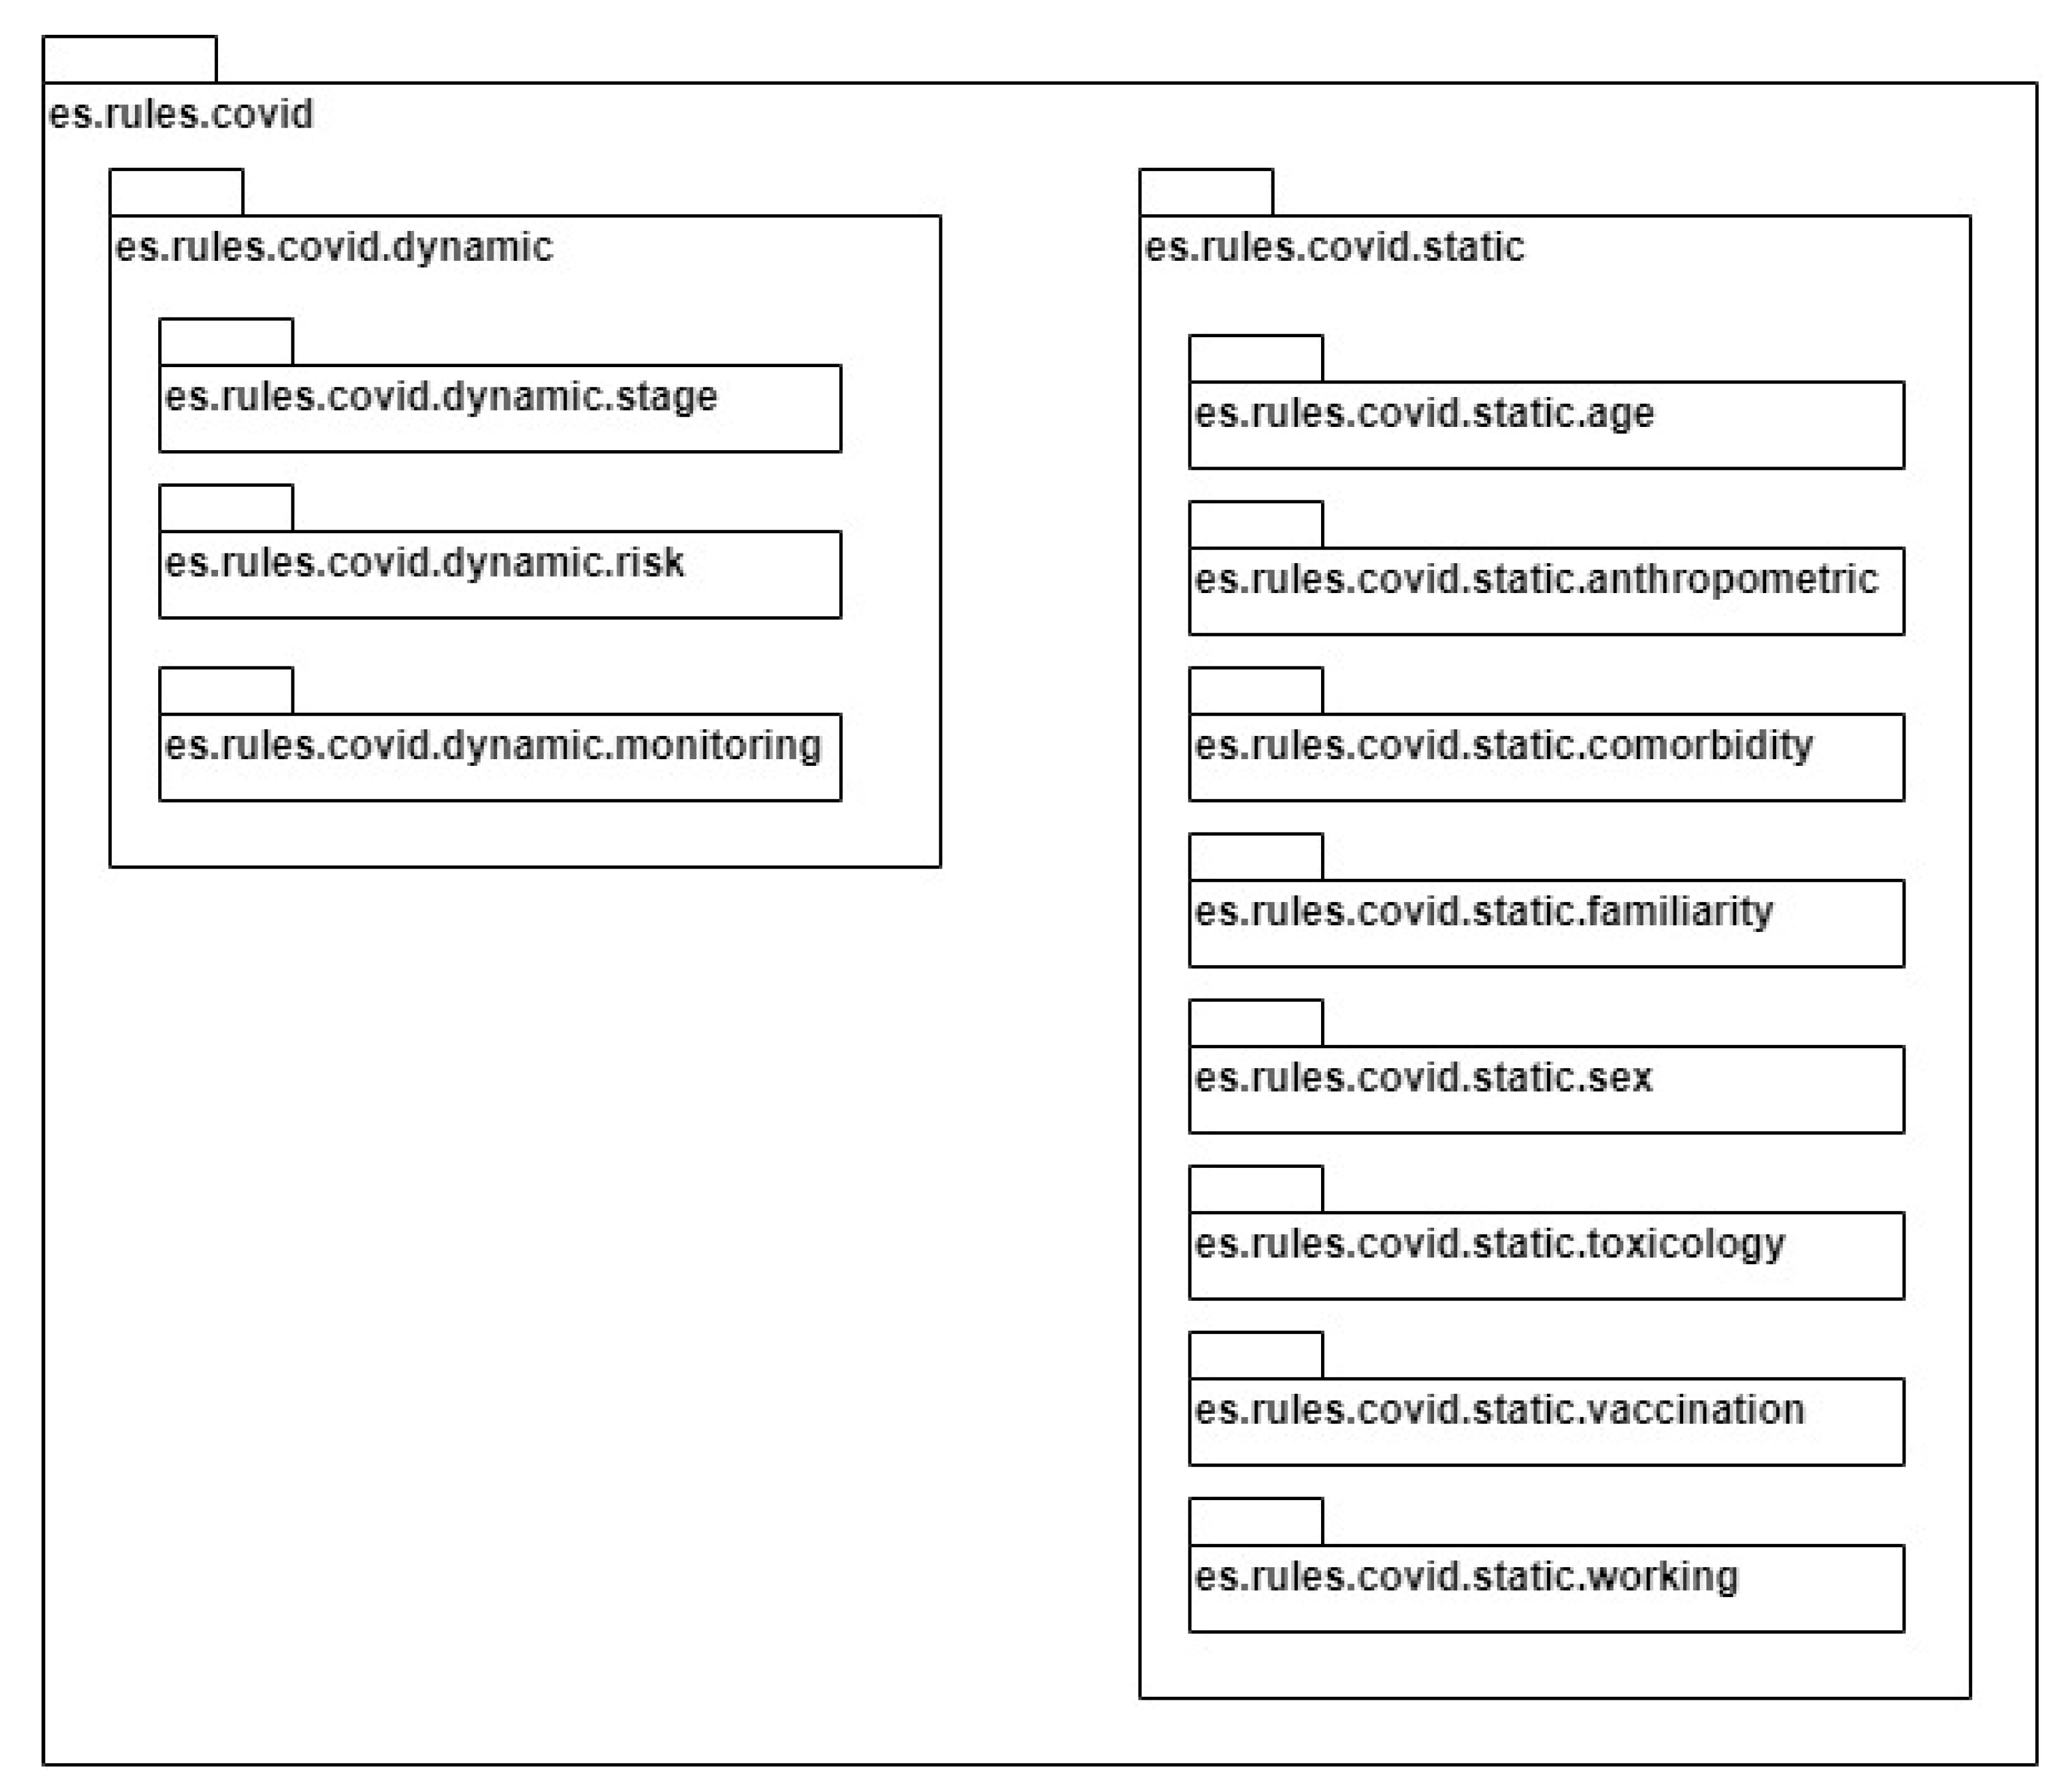
The designed rule hierarchy is reflected in the ES package organization, as shown in Figure 4: in addition to the top-level package enclosing the whole rule set, each block has a dedicated subpackage containing POJO classes, and the latter are further grouped into two middle-level packages for static and dynamic blocks. This allows for an easier injection of the RuleBook ES instance into the main Spring application through special configuration classes containing references to desired package names.
The implemented package organization also provides modularity to the expert system. Given the configuration policy through the package name, it is possible to make the system use only a subset of the complete rule base. As a result, in the case of the proposed ES, it enables configuring (and injecting into different components) multiple RuleBook objects, with each one taking decisions on a specific data category. It is therefore possible, for example, to store the decision taken on the static data categories (e.g., comorbidities, sex, age) and then re-evaluate only the dynamic portion of the rule set when new IoT data are received. This approach may also result in an overall scalability improvement.
Although the hierarchy is provided at the code level through package organization, the actual rule ordering at the execution time is conveyed by a class-specific order property. In fact, RuleBook’s rules are evaluated randomly unless a specific order level is indicated in the @Rule annotation. Ordering is expressed with an integer value: the lower the value, the higher the priority, and rules presenting the same order are evaluated randomly. Consequently, the designed ordering of Figure 2 is implemented by assigning values to rules per block, as shown in Table 6. Even though forcing the desired sorting is sufficient to differentiate the priority values by one unit, it was chosen to maintain a delta between successive blocks of 10 units to allow for possible future extensions to the rule base. In addition, note that the only strictly required ordering is between S, G, E, A, L, F, T, C, and V and R and M (i.e., M must be the last and R the second to last). However, forcing an overall ordering helps to maintain modularity, eases future extensions, and improves the explainability automation.
Explainability is, in fact, a fundamental aspect of an expert system: it involves making the reasoning and decision-making process of the system transparent and interpretable to human users, and this is particularly crucial in domains where the decisions taken have significant consequences, such as in healthcare. As previously stated, the proposed ES addresses explainability mainly through the CovidESDecision output object. In fact, during the execution phase, an instance of this class is sequentially passed from one rule to the next, accumulating intermediate decisions and identifiers of activated rules as the process unfolds. In particular, rule identifiers are kept in the activation order and are useful to allow for the reconstruction of the decision process in a verbose manner by associating a description with each of them. Overall, a domain expert user is able to comprehend the whole reasoning process behind a decision taken by the ES.
In order to deal with the potential absence of optional input data, which manifests as exceptions thrown when running rules, the RuleBook library provides three alternative behaviors: CONTINUE_ON_FAILURE, ERROR_ON_FAILURE, and STOP_ON_FAILURE. The first option allows the engine to skip the rule and proceed to the subsequent in the chain; the second halts the rule chain evaluation and propagates the exception to the uppermost layers; the third one stops the rule chain without propagating the exception. The behavior is configured on a per-rule basis, and all the rules of the proposed system follow the CONTINUE_ON_FAILURE policy. This consistent approach enables the ES to always complete the evaluation process even in the presence of missing data or general execution errors. This, combined with the adoption of the “parachute” monitoring precautionary principle, maximizes the likelihood of formulating a truly personalized monitoring plan and ensures continuous surveillance for the patient.
The implemented ES is an independent software module, and it offers a representational state transfer (REST) application program interface (API) for seamless integration into pre-existing telemedicine systems. This API facilitates a request–response mechanism, enabling the expert system to receive input data and provide the determined monitoring plan along with explainability information. Both requests and responses adhere to a specifically defined schema and can be encoded in either JSON or XML formats. This setup allows any platform to effectively utilize the ES by submitting patient characterization and subsequently taking actions based on the received monitoring plan. More in detail, the ES provides a single REST endpoint that requests a CovidESInput object and returns a CovidESDecision, which are two objects mentioned earlier. In addition, it can be easily extended with a graphical user interface (GUI), allowing the tool to be fully adaptable and integrable into any other health service, whether through machine-to-machine or human-to-machine interaction.

3. Verification and Validation

Ensuring the accuracy and reliability of the ES is of paramount importance, particularly in critical domains, such as healthcare, where decisions relying on the system’s outcomes can have significant consequences on patients. To this end, the proposed ES has undergone rigorous verification, validation processes, and is currently undergoing a clinical trial. The contribution of the medical team has been pivotal in these phases, specifically in validating the feasibility of implementing the solution within their clinical practice.
Verification involved the analysis of both variables and rules. Variable verification checked the correctness of the information modeling in terms of the completeness, non-redundancy, value admissibility, and coherence with respect to their use in rules. Particular attention was given to the minimal set of variables strictly required as input to the ES. This allowed for the subsequent analysis of the rule set aimed at confirming the presence of a minimum group of rules that can provide a valid output using exclusively required input data. In addition, rules verification covered, on one hand, the detection of redundant, conflicting, or circular patterns in the rule set, and on the other, the use of proper values and thresholds when evaluating dynamic data. Finally, the clarity of both variable naming and rule descriptions was also addressed in order to improve the explainability and facilitate the user comprehension of the system’s outputs.
The validation of the ES correctness and the evaluation of its performance in producing the expected results were accomplished through a set of test cases.
To this end, a medical team elaborated upon the test dataset by exploiting literature and in-the-field experience to cover a wider range of actual patient characterizations and clinical presentations, and hence, risk and desired monitoring classes. Each test case comprised data about the patient history, clinical background, vital signs, and clinical indicators, along with the expected decision of the ES. This decision is the one an experienced physician would have made when faced with the same clinical case. All test cases included the required data but vary in the richness of the optional ones. Overall, the validation dataset consisted of 76 cases, which is in line with other examples in the literature [53], distributed as follows: 24 cases for LM, 36 for MM, and 16 for HM.
In order to ease the complexity of the datasets, IoT data series subjected to pre-processing were directly provided to the ES in the processed format. For example, instead of presenting a set of timestamped temperature measurements and survey answers, the dataset presented the “Fever” variable value. In other words, each test case directly included a CovidESInput object and the corresponding expected monitoring class. Instead, the pre-processing procedure was tested separately by exploiting unit tests, and thus, the adopted approach did not expose the validation and the whole system to errors due to unchecked components.
The classification performance of the ES was evaluated by exploiting a weighted confusion matrix (WCM) and the macro F1-score.
The adoption of the WCM was based on the understanding that within the specific application context, an erroneous decision favoring increased monitoring intensity was relatively less critical and, to some degree, still tolerable. Conversely, misclassification resulting in reduced monitoring could potentially endanger the patient. In addition, the more the distance from the expected output, the higher the weight associated. Consequently, a 0.25 weight was assigned to cases misclassified as one level of more intense monitoring and 0.5 to those misclassified as two levels of more intense monitoring; a similar approach was also applied to misclassifications toward less intense monitoring plans, but in this case the values chosen were 1.25 and 1.5, respectively, to underline the potential risk that would affect the patient. Figure 5a, Figure 5b, and Figure 5c show the original unweighted confusion matrix, the applied weight matrix, and the final WCM, respectively.
Out of the 76 test cases provided, 56 were correctly classified, i.e., they gave the expected monitoring class as the output. Fourteen cases resulted in a one level more intense plan and one case as two levels more intensive. Finally, five cases resulted in a misclassification of one level less intensive but no case resulted in the most critical misclassification error.
The values presented in the WCM were then used to compute the precision, recall, and F1-score of each class. Table 7 reports the calculated metrics for the three categories: none of them outlay the others, and each class presented good classification performance.
The choice of macro F1-score for the overall classification performance was dictated by the multi-class decision outcome of the ES and the unbalanced distribution of test cases. Thus, the class-specific F1-scores were aggregated according to Formula (1), obtaining a final value of 0.85, which demonstrates the applicability of the proposed ES in COVID-19 telemonitoring contexts.
macro F 1 - score = sum ( F 1 score ) number of classes

4. Clinical Trial

A clinical trial has been defined to assess the feasibility of using the ES in real settings, evaluate its effectiveness in the context of telemonitoring COVID-19 patients, and document patient satisfaction with the system. Toward this aim, the ES will be coupled with a telemonitoring system that by using the ES’s API, will provide patient data to be evaluated, and will be able to properly exploit the generated decisions. Such a system is a consolidated CE medical device that was already successfully employed in the COVID-19 pandemic [54] and features a web-based medical record and monitoring kits containing a tablet and several Bluetooth biomedical sensors. Through tablet notifications, patients will be supported in adhering to personalized care plans, while clinicians will be alerted when vital signs surpass predefined thresholds. In the traditional setup, monitoring plans will be initially set and subsequently adjusted by medical personnel as necessary, impacting their workload. Indeed, within this framework, the telemonitoring platform will utilize the ES to automatically devise an appropriate monitoring plan upon patient enrollment and subsequently adjust it based on changes in the clinical status reflected by the IoT data.
The clinical trial, which was already approved by the ethics committee, will be a non-profit, interventional, non-pharmacological, controlled, randomized, parallel, and single-blind study. It will involve recruiting a total of 32 COVID-19 patients who will be followed up at home via telemonitoring for at least 14 days, half with the support of the ES and half without. In both groups, patients will be monitored by their own GP.
The enrollment process and signing of informed consent will be overseen by the GP during outpatient or home visits. Upon enrollment, the patient will receive a monitoring kit that comprises a tablet, thermometer, pulse oximeter, and sphygmomanometer. Simultaneously, the GP will collect anamnestic data and baseline vital parameters for inclusion in the medical record. In addition, if the patient is assigned to the control group, the GP will also manually define the initial monitoring plan.
In addition to confirming the classification capabilities of the ES obtained during the validation phase, the primary objectives of this study are as follows:
  • To assess the reliability of the ES in setting up monitoring plans that overlap with those devised by GPs (primary endpoint).
  • To evaluate the effectiveness of ES-supported telemonitoring in reducing GP–patient contacts, including home visits and phone calls, and patient hospitalizations (secondary endpoint).
  • To document the patients’ and medical professionals’ satisfaction and safety with ES-supported telemonitoring (tertiary endpoint).
The primary endpoint will be evaluated by retrospectively comparing monitoring plans set by GPs in the control group with those that would have been set by the ES. Concordance between the actual plan and the ES-elaborated one will be considered as an index of the expert system’s accuracy.
The secondary endpoint will involve assessing a composite measure of the effectiveness of the ES, including a potential reduction in hospitalizations, GP–patient contacts, and urgent home visits. Differences in hospitalization duration between treatment groups, if applicable, will also be analyzed.
The third endpoint will be assessed through questionnaires administered to patients via the tablet at the end of the monitoring period. The questionnaire will address various aspects of the telemonitoring experience, including the appropriateness of measurement frequency, confidence in the system’s ability to adapt, and impact on the patient–caregiver relationship. Finally, surveys will be distributed to the GPs whose patients participated in the trial, with the aim to evaluate the impact of the new tool onto their workload and overall perceived experience.

5. Discussion

The objective of the proposed ES is to enhance the accuracy of home monitoring using IoT systems, thereby amplifying the benefits associated with this treatment approach in managing COVID-19 patients, as outlined in the literature. Indeed, different studies highlighted that precise monitoring enables early intervention in the event of deterioration and better outcomes. This impacts the number of hospitalizations and deaths, with results ranging from a reduction of 87% and 77%, respectively [32], to scenarios with no hospital admissions and zero fatalities [14].
Simultaneously, the ES aims to reduce the workload of physicians in applying personalized monitoring and to provide them with adequate and timely data to facilitate supplementary decision making (e.g., recall for examination, adjust therapy, prescribe in-depth examinations, and decide whether hospitalization is necessary). This is based on an objective clinical picture outlined by the patient’s self-measured data and clinical history.
The validation results were very promising, highlighting the system’s ability to provide accurate recommendations on the best monitoring intensity in COVID-19 patients undergoing home treatment. It demonstrated its feasibility and applicability in telemonitoring contexts, effectively replicating the decision-making process of experienced physicians. In particular, the clinical trial is mainly intended to quantify all the aforementioned benefits in the case study, especially the impact of such an application in clinical practice.
To the best of our knowledge, our proposal represents the first application of artificial intelligence for the aforementioned specific purpose. With respect to classification performance, the achieved results are in line with other AI applications presented in the literature, even if aimed at different tasks in the medical context [42,55]. Furthermore, considering the unweighted confusion matrix (Figure 5a), it is also worth noticing that the majority of misclassifications occurred above the main diagonal, and thus, in a region where their impact was relatively less significant, whereas only in very few cases were there an underestimation of the patient risk of at most one class. In addition, the best classification performance was obtained for the highest disease severity class (i.e., HM), while the per-class precision and recall ranged from 0.77 to 0.90 and from 0.77 to 0.92, respectively. These findings are consistent with those observed in reviews of AI applications within the medical domain [56].
With respect to the state of the art, the proposed ES complements existing AI systems in the literature that calculate clinical risk or detect abnormal parameters [41,42,47,48,49,50] since it enables the construction and adaptation of precise and customized datasets specific to individual patients. From these datasets, existing systems can then process their outputs more effectively.
Finally, the obtained results could be further improved by integrating other sources and types of data, thus extending the current knowledge base, and by using upstream patient risk stratification techniques, e.g., ML techniques, based on socio-administrative data [45].

6. Conclusions

The COVID-19 pandemic has highlighted the critical need for innovative approaches to patient care, particularly in remote monitoring and management. The use of telemedicine and IoT-enabled telemonitoring systems has emerged as a promising way to improve patient outcomes and alleviate the burden on healthcare systems. However, the challenge of determining appropriate monitoring intensity with respect to the actual patient’s conditions remains a significant hurdle that impacts care effectiveness and poses additional strain on healthcare providers.
To tackle the aforementioned challenge, this paper proposes an expert system aimed at suggesting tailored monitoring plans for COVID-19 patients undergoing home treatment, thereby enhancing the precision and efficiency of care delivery. The system evaluates up to 61 input variables about clinical history and health status conveyed through IoT data, and decides on the most suitable monitoring intensity for early detection of aggravations by choosing between three levels. The validation results are encouraging, demonstrating the system’s capability to deliver accurate recommendations, with a notable F1-score of 0.85.
Looking ahead, the integration of this expert system with existing IoT telemonitoring infrastructure holds great promise for revolutionizing the delivery of remote healthcare services. Through a rigorous clinical trial, we aim to demonstrate the system’s reliability and effectiveness in reducing unnecessary medic–patient interactions, hospitalizations, and associated healthcare costs, as well as demonstrate its applicability in clinical practice. Additionally, by prioritizing patient satisfaction and safety, we seek to ensure that these technological advancements translate into tangible improvements in the overall quality of care.
In conclusion, the development and implementation of innovative solutions, such as the proposed expert system, represent critical steps toward building a more resilient and responsive healthcare ecosystem in the face of evolving challenges posed by infectious disease outbreaks, like COVID-19. By harnessing the power of technology and collaborative research efforts, we can continue to advance the forefront of patient-centered care and, ultimately, safeguard the health and well-being of individuals and communities worldwide.

Author Contributions

Conceptualization, M.O., M.D., A.V., S.M. and A.B.; funding acquisition, S.M. and L.F.; investigation, M.O., M.D., A.V., I.P. and S.M.; methodology, M.O., M.D., A.V., S.M. and A.B.; project administration, M.D., S.M. and L.F.; resources, M.O. and M.D.; software, M.O. and M.D.; supervision, M.O., S.M., A.B. and L.F.; validation, M.O., M.D., A.V., I.P., S.M. and A.B.; visualization, M.O. and M.D.; writing—original draft preparation, M.O., M.D. and S.M.; writing—review and editing, M.O. and M.D. All authors read and agreed to the published version of the manuscript.

Funding

This research was partially funded by the Bando Ricerca COVID-19 Toscana—PAR FSC 2007–2013—AIRTELTE COVID-19 project, which is a research collaboration between Pisa University, Azienda ospedaliero-universitaria pisana, and Agenzia Regionale Sanità della Toscana.

Institutional Review Board Statement

The study was conducted in accordance with the Declaration of Helsinki and approved by the Institutional Ethics Committee of Tuscany Region—North West Area (protocol code VALIDATE Ref. 24317 approved on 23 May 2023).

Informed Consent Statement

Informed consent was obtained from all subjects involved in the study.

Data Availability Statement

Data are contained within the article.

Acknowledgments

Work was partially supported by the Italian Ministry of Education and Research (MUR) in the framework of the FoReLab and CrossLab projects (Departments of Excellence).

Conflicts of Interest

The authors declare no conflicts of interest.

Abbreviations

The following abbreviations are used in this manuscript:
AIArtificial intelligence
APIApplication programming interface
CNNConvolutional neural network
CoRChain of responsibility
COVID-19Coronavirus disease 2019
CXIChest X-ray images
DSLDomain specific language
EHRElectronic health record
ESExpert system
GPGeneral practitioner
GUIGraphical user interface
IoTInternet of things
MLMachine learning
POJOPlain old Java object
RESTRepresentational state transfer
RFRandom forest
SVMSupport vector machine
UMLUnified modeling language
WCMWeighted confusion matrix

References

  1. Cascella, M.; Rajnik, M.; Aleem, A.; Dulebohn, S.C.; Di Napoli, R. Features, Evaluation, and Treatment of Coronavirus (COVID-19); StatPearls Publishing: St. Petersburg, FL, USA, 2023. [Google Scholar]
  2. Wang, M.Y.; Zhao, R.; Gao, L.J.; Gao, X.F.; Wang, D.P.; Cao, J.M. SARS-CoV-2: Structure, Biology, and Structure-Based Therapeutics Development. Front. Cell. Infect. Microbiol. 2020, 10, 587269. [Google Scholar] [CrossRef]
  3. Bali Swain, R.; Lin, X.; Wallentin, F.Y. COVID-19 pandemic waves: Identification and interpretation of global data. Heliyon 2024, 10, e25090. [Google Scholar] [CrossRef]
  4. Negi, S.S.; Sharma, K.; Bhargava, A.; Singh, P. A comprehensive profile of SARS-CoV-2 variants spreading during the COVID-19 pandemic: A genomic characterization study from Chhattisgarh State, India. Arch. Microbiol. 2024, 206, 68. [Google Scholar] [CrossRef] [PubMed]
  5. Goshua, G.; Pine, A.B.; Meizlish, M.L.; Chang, C.H.; Zhang, H.; Bahel, P.; Baluha, A.; Bar, N.; Bona, R.D.; Burns, A.J.; et al. Endotheliopathy in COVID-19-associated coagulopathy: Evidence from a single-centre, cross-sectional study. Lancet Haematol. 2020, 7, e575–e582. [Google Scholar] [CrossRef] [PubMed]
  6. Coma, E.; Mora, N.; Méndez, L.; Benítez, M.; Hermosilla, E.; Fàbregas, M.; Fina, F.; Mercadé, A.; Flayeh, S.; Guiriguet, C.; et al. Primary care in the time of COVID-19: Monitoring the effect of the pandemic and the lockdown measures on 34 quality of care indicators calculated for 288 primary care practices covering about 6 million people in Catalonia. BMC Fam. Pract. 2020, 21, 208. [Google Scholar] [CrossRef]
  7. Einstein, A.J.; Shaw, L.J.; Hirschfeld, C.; Williams, M.C.; Villines, T.C.; Better, N.; Vitola, J.V.; Cerci, R.; Dorbala, S.; Raggi, P.; et al. International Impact of COVID-19 on the Diagnosis of Heart Disease. J. Am. Coll. Cardiol. 2021, 77, 173–185. [Google Scholar] [CrossRef] [PubMed]
  8. Maringe, C.; Spicer, J.; Morris, M.; Purushotham, A.; Nolte, E.; Sullivan, R.; Rachet, B.; Aggarwal, A. The impact of the COVID-19 pandemic on cancer deaths due to delays in diagnosis in England, UK: A national, population-based, modelling study. Lancet Oncol. 2020, 21, 1023–1034. [Google Scholar] [CrossRef] [PubMed]
  9. Keesara, S.; Jonas, A.; Schulman, K. Covid-19 and Health Care’s Digital Revolution. N. Engl. J. Med. 2020, 382, e82. [Google Scholar] [CrossRef]
  10. Kichloo, A.; Albosta, M.; Dettloff, K.; Wani, F.; El-Amir, Z.; Singh, J.; Aljadah, M.; Chakinala, R.C.; Kanugula, A.K.; Solanki, S.; et al. Telemedicine, the current COVID-19 pandemic and the future: A narrative review and perspectives moving forward in the USA. Fam. Med. Community Health 2020, 8, e000530. [Google Scholar] [CrossRef]
  11. Mártinez-García, M.; Bal-Alvarado, M.; Guerra, F.; Ares-Rico, R.; Suárez-Gil, R.; Rodríguez, A.M.G.; Pérez-López, A.; Casariego-Vales, E.; Rial, A.F.; Rey, R.R.; et al. Monitoring of COVID-19 Patients via Telemedicine With Telemonitoring. Rev. Clín. Esp. (Engl. Ed.) 2020, 220, 472–479. [Google Scholar] [CrossRef]
  12. Shaver, J. The State of Telehealth Before and After the COVID-19 Pandemic. Prim. Care Clin. Off. Pract. 2022, 49, 517–530. [Google Scholar] [CrossRef] [PubMed]
  13. McKinstry, B.; Alexander, H.; Maxwell, G.; Blaikie, L.; Patel, S.; Guthrie, B. The Use of Telemonitoring in Managing the COVID-19 Pandemic: Pilot Implementation Study. JMIR Form. Res. 2021, 5, e20131. [Google Scholar] [CrossRef] [PubMed]
  14. Panicacci, S.; Donati, M.; Lubrano, A.; Vianello, A.; Ruiu, A.; Melani, L.; Tomei, A.; Fanucci, L. Telemonitoring in the Covid-19 Era: The Tuscany Region Experience. Healthcare 2021, 9, 516. [Google Scholar] [CrossRef] [PubMed]
  15. Nittari, G.; Savva, D.; Tomassoni, D.; Tayebati, S.K.; Amenta, F. Telemedicine in the COVID-19 Era: A Narrative Review Based on Current Evidence. Int. J. Environ. Res. Public Health 2022, 19, 5101. [Google Scholar] [CrossRef] [PubMed]
  16. Monteleone, G.; Terzulli, G.; Cefaloni, F.; Bonini, M.; Richeldi, L. The Impact of Telemedicine during Severe Acute Respiratory Syndrome Coronavirus 2 Pandemic and Future Perspectives: A Systematic Review. Respiration 2023, 102, 879–890. [Google Scholar] [CrossRef] [PubMed]
  17. Seixas, A.A.; Olaye, I.M.; Wall, S.P.; Dunn, P. Optimizing Healthcare through Digital Health and Wellness Solutions to Meet the Needs of Patients with Chronic Disease During the COVID-19 Era. Front. Public Health 2021, 9, 667654. [Google Scholar] [CrossRef] [PubMed]
  18. Casariego-Vales, E.; Blanco-López, R.; Rosón-Calvo, B.; Suárez-Gil, R.; Santos-Guerra, F.; Dobao-Feijoo, M.J.; Ares-Rico, R.; Bal-Alvaredo, M.; on behalf of the TELEA-COVID Lugo Comanagement Team. Efficacy of Telemedicine and Telemonitoring in At-Home Monitoring of Patients with COVID-19. J. Clin. Med. 2021, 10, 2893. [Google Scholar] [CrossRef]
  19. Perrone, G.; Zerbo, S.; Bilotta, C.; Malta, G.; Argo, A. Telemedicine during Covid-19 pandemic: Advantage or critical issue? Med. Legal J. 2020, 88, 76–77. [Google Scholar] [CrossRef]
  20. Tang, M.; Holmgren, A.J.; McElrath, E.E.; Bhatt, A.S.; Varshney, A.S.; Lee, S.G.; Vaduganathan, M.; Adler, D.S.; Huckman, R.S. Investigating the Association Between Telemedicine Use and Timely Follow-Up Care After Acute Cardiovascular Hospital Encounters. JACC Adv. 2022, 1, 100156. [Google Scholar] [CrossRef]
  21. Farahani, B.; Firouzi, F.; Chang, V.; Badaroglu, M.; Constant, N.; Mankodiya, K. Towards fog-driven IoT eHealth: Promises and challenges of IoT in medicine and healthcare. Future Gener. Comput. Syst. 2018, 78, 659–676. [Google Scholar] [CrossRef]
  22. Anu Shilvya, J.; George, S.T.; Subathra, M.S.P.; Manimegalai, P.; Mohammed, M.A.; Jaber, M.M.; Kazemzadeh, A.; Al-Andoli, M.N. Home Based Monitoring for Smart Health-Care Systems: A Survey. Wirel. Commun. Mob. Comput. 2022, 2022, 1829876. [Google Scholar] [CrossRef]
  23. Bhuiyan, M.N.; Rahman, M.M.; Billah, M.M.; Saha, D. Internet of Things (IoT): A Review of Its Enabling Technologies in Healthcare Applications, Standards Protocols, Security, and Market Opportunities. IEEE Internet Things J. 2021, 8, 10474–10498. [Google Scholar] [CrossRef]
  24. Debnath, P.; Mahmud, A.; Hossain, A.K.; Rahman, S.M.I. Design and Application of IOT-Based Real-Time Patient Telemonitoring System Using Biomedical Sensor Network. SN Comput. Sci. 2022, 4, 94. [Google Scholar] [CrossRef]
  25. Salem, M.; Elkaseer, A.; El-Maddah, I.A.M.; Youssef, K.Y.; Scholz, S.G.; Mohamed, H.K. Non-Invasive Data Acquisition and IoT Solution for Human Vital Signs Monitoring: Applications, Limitations and Future Prospects. Sensors 2022, 22, 6625. [Google Scholar] [CrossRef] [PubMed]
  26. Mandalis, K.; Pardos, A.; Menychtas, A.; Gallos, P.; Panagopoulos, C.; Maglogiannis, I. Integrating IoT Wearable Devices in Telemonitoring Platforms for Continuous Assisted Living Services. In Studies in Health Technology and Informatics; IOS Press: Amsterdam, The Netherlands, 2023; pp. 612–615. [Google Scholar] [CrossRef]
  27. Panicacci, S.; Giuffrida, G.; Donati, M.; Lubrano, A.; Ruiu, A.; Fanucci, L. Empowering Home Health Monitoring of Covid-19 Patients with Smartwatch Position and Fitness Tracking. In Proceedings of the 2021 IEEE 34th International Symposium on Computer-Based Medical Systems (CBMS), Aveiro, Portugal, 7–9 June 2021; pp. 348–353. [Google Scholar] [CrossRef]
  28. El-Rashidy, N.; El-Sappagh, S.; Islam, S.M.R.; M. El-Bakry, H.; Abdelrazek, S. Mobile Health in Remote Patient Monitoring for Chronic Diseases: Principles, Trends, and Challenges. Diagnostics 2021, 11, 607. [Google Scholar] [CrossRef] [PubMed]
  29. Ninikrishna, T.; Kumar, M.; Kumar, N.; Karn, P.; Rachana, S.V. An Efficient IoT Based Body Parameters Telemonitoring System. In Proceedings of the 2020 Second International Conference on Inventive Research in Computing Applications (ICIRCA), Coimbatore, India, 15–17 July 2020; pp. 1167–1171. [Google Scholar] [CrossRef]
  30. Sharma, D.K.; Boddu, R.S.K.; Bhasin, N.K.; Nisha, S.S.; Jain, V.; Mohiddin, M.K. Cloud Computing in Medicine: Current trends and Possibilities. In Proceedings of the 2021 International Conference on Advancements in Electrical, Electronics, Communication, Computing and Automation (ICAECA), Coimbatore, India, 8–9 October 2021; pp. 1–5. [Google Scholar] [CrossRef]
  31. Sahu, M.L.; Atulkar, M.; Ahirwal, M.K.; Ahamad, A. Vital Sign Monitoring System for Healthcare Through IoT Based Personal Service Application. Wirel. Pers. Commun. 2022, 122, 129–156. [Google Scholar] [CrossRef]
  32. Pronovost, P.J.; Cole, M.D.; Hughes, R.M. Remote Patient Monitoring During COVID-19: An Unexpected Patient Safety Benefit. JAMA 2022, 327, 1125–1126. [Google Scholar] [CrossRef] [PubMed]
  33. Gijsbers, H.; Feenstra, T.M.; Eminovic, N.; van Dam, D.; Nurmohamed, S.A.; van de Belt, T.; Schijven, M.P. Enablers and barriers in upscaling telemonitoring across geographic boundaries: A scoping review. BMJ Open 2022, 12, e057494. [Google Scholar] [CrossRef] [PubMed]
  34. Mogharab, V.; Ostovar, M.; Ruszkowski, J.; Hussain, S.Z.M.; Shrestha, R.; Yaqoob, U.; Aryanpoor, P.; Nikkhoo, A.M.; Heidari, P.; Jahromi, A.R.; et al. Global burden of the COVID-19 associated patient-related delay in emergency healthcare: A panel of systematic review and meta-analyses. Glob. Health 2022, 18, 58. [Google Scholar] [CrossRef]
  35. Huang, J.A.; Hartanti, I.R.; Colin, M.N.; Pitaloka, D.A. Telemedicine and artificial intelligence to support self-isolation of COVID-19 patients: Recent updates and challenges. Digit. Health 2022, 8, 20552076221100634. [Google Scholar] [CrossRef]
  36. Nayak, J.; Naik, B.; Dinesh, P.; Vakula, K.; Rao, B.K.; Ding, W.; Pelusi, D. Intelligent system for COVID-19 prognosis: A state-of-the-art survey. Appl. Intell. 2021, 51, 2908–2938. [Google Scholar] [CrossRef] [PubMed]
  37. Chang, Z.; Zhan, Z.; Zhao, Z.; You, Z.; Liu, Y.; Yan, Z.; Fu, Y.; Liang, W.; Zhao, L. Application of artificial intelligence in COVID-19 medical area: A systematic review. J. Thorac. Dis. 2021, 13, 7034–7053. [Google Scholar] [CrossRef] [PubMed]
  38. Mufid, M.R.; Basofi, A.; Mawaddah, S.; Khotimah, K.; Fuad, N. Risk Diagnosis and Mitigation System of COVID-19 Using Expert System and Web Scraping. In Proceedings of the 2020 International Electronics Symposium (IES), Surabaya, Indonesia, 29–30 September 2020; pp. 577–583. [Google Scholar] [CrossRef]
  39. Henderi; Maulana, M.; Warnars, H.L.H.S.; Setiyadi, D.; Qurrohman, T. Model Decision Support System For Diagnosis COVID-19 Using Forward Chaining: A Case in Indonesia. In Proceedings of the 2020 8th International Conference on Cyber and IT Service Management (CITSM), Pangkal, Indonesia, 23–24 October 2020; pp. 1–4. [Google Scholar] [CrossRef]
  40. Chrimes, D. Using Decision Trees as an Expert System for Clinical Decision Support for COVID-19. Interact. J. Med Res. 2023, 12, e42540. [Google Scholar] [CrossRef] [PubMed]
  41. Mohebbi, N.; Alavi, M.; Kargari, M. Determining COVID-19 Severity with Fuzzy Inference System. In Proceedings of the 2022 27th International Computer Conference, Computer Society of Iran (CSICC), Tehran, Iran, 23–24 February 2022; pp. 1–5. [Google Scholar] [CrossRef]
  42. D’Auria, D.; Russo, R.; Fedele, A.; Addabbo, F.; Calvanese, D. An intelligent telemonitoring application for coronavirus patients: reCOVeryaID. Front Big Data 2023, 6, 1205766. [Google Scholar] [CrossRef] [PubMed]
  43. Palmisano, A.; Vignale, D.; Boccia, E.; Nonis, A.; Gnasso, C.; Leone, R.; Montagna, M.; Nicoletti, V.; Bianchi, A.G.; Brusamolino, S.; et al. AI-SCoRE (artificial intelligence-SARS CoV2 risk evaluation): A fast, objective and fully automated platform to predict the outcome in COVID-19 patients. Radiol. Med. 2022, 127, 960–972. [Google Scholar] [CrossRef] [PubMed]
  44. Guarrasi, V.; D’Amico, N.C.; Sicilia, R.; Cordelli, E.; Soda, P. A Multi-Expert System to Detect COVID-19 Cases in X-ray Images. In Proceedings of the 2021 IEEE 34th International Symposium on Computer-Based Medical Systems (CBMS), Aveiro, Portugal, 7–9 June 2021; pp. 395–400. [Google Scholar] [CrossRef]
  45. Panicacci, S.; Donati, M.; Profili, F.; Francesconi, P.; Fanucci, L. Trading-Off Machine Learning Algorithms towards Data-Driven Administrative-Socio-Economic Population Health Management. Computers 2021, 10, 4. [Google Scholar] [CrossRef]
  46. Abbasi, W.A.; Abbas, S.A.; Andleeb, S.; ul Islam, G.; Ajaz, S.A.; Arshad, K.; Khalil, S.; Anjam, A.; Ilyas, K.; Saleem, M.; et al. COVIDC: An expert system to diagnose COVID-19 and predict its severity using chest CT scans: Application in radiology. Inform. Med. Unlocked 2021, 23, 100540. [Google Scholar] [CrossRef] [PubMed]
  47. Raihan, M.; Hassan, M.M.; Hasan, T.; Bulbul, A.A.M.; Hasan, M.K.; Hossain, M.S.; Roy, D.S.; Awal, M.A. Development of a Smartphone-Based Expert System for COVID-19 Risk Prediction at Early Stage. Bioengineering 2022, 9, 281. [Google Scholar] [CrossRef]
  48. Yu, L.; Vijay, M.; Sunil, J.; Vincy, V.A.G.; Govindan, V.; Khan, M.I.; Ali, S.; Tamam, N.; Abdullaeva, B.S. Hybrid deep learning model based smart IOT based monitoring system for Covid-19. Heliyon 2023, 9, e21150. [Google Scholar] [CrossRef]
  49. Yelure, B.S.; Deokule, N.S.; Mane, S.S.; Bhosale, M.V.; Chavan, A.B.; Satpute, V.C. Remote monitoring of Covid-19 patients using IoT and AI. In Proceedings of the 2022 Second International Conference on Artificial Intelligence and Smart Energy (ICAIS), Coimbatore, India, 23–25 February 2022; pp. 73–80. [Google Scholar] [CrossRef]
  50. Jaber, M.M.; Alameri, T.; Ali, M.H.; Alsyouf, A.; Al-Bsheish, M.; Aldhmadi, B.K.; Ali, S.Y.; Abd, S.K.; Ali, S.M.; Albaker, W.; et al. Remotely Monitoring COVID-19 Patient Health Condition Using Metaheuristics Convolute Networks from IoT-Based Wearable Device Health Data. Sensors 2022, 22, 1205. [Google Scholar] [CrossRef]
  51. Agarwal, M.; Goel, S. Expert system and it’s requirement engineering process. In Proceedings of the International Conference on Recent Advances and Innovations in Engineering (ICRAIE-2014), Jaipur, India, 9–11 May 2014; pp. 1–4. [Google Scholar] [CrossRef]
  52. Tan, C.; Wahidin, L.; Khalil, S.; Tamaldin, N.; Hu, J.; Rauterberg, G. The application of expert system: A review of research and applications. ARPN J. Eng. Appl. Sci. 2016, 11, 2448–2453. [Google Scholar]
  53. Istiadi; Sulistiarini, E.B.; Joegijantoro, R.; Suksmawati, A.N.; Nugroho, K.S.; Akbar, I. Expert System Integrated with Medical Record for Infectious Diseases using Certainty Factor. In Proceedings of the 2022 IEEE International Conference on Cybernetics and Computational Intelligence (CyberneticsCom), Malang, Indonesia, 16–18 June 2022; pp. 451–456. [Google Scholar] [CrossRef]
  54. Panicacci, S.; Ruiu, A.; Lubrano, A.; Donati, M.; Olivelli, M.; Fanucci, L. SatNav E@syCare Telemedicine Platform in the Management of Covid-19 Patients: Field Trial Results. In Proceedings of the 2022 IEEE International Conference on Pervasive Computing and Communications Workshops and other Affiliated Events (PerCom Workshops), Pisa, Italy, 21–25 March 2022. [Google Scholar] [CrossRef]
  55. Sevani, N.; Sagala, N.; Kristiani, E. The Development of Integrated Medical Expert System for Diabetes Mellitus Patient. Komputika J. Sist. Komput. 2020, 9, 95–104. [Google Scholar] [CrossRef]
  56. Wang, L.; Zhang, Y.; Wang, D.; Tong, X.; Liu, T.; Zhang, S.; Huang, J.; Zhang, L.; Chen, L.; Fan, H.; et al. Artificial Intelligence for COVID-19: A Systematic Review. Front. Med. 2021, 8, 704256. [Google Scholar] [CrossRef] [PubMed]
Figure 1. Modules comprising an expert system: knowledge base, inferential engine, interface, and explanation module.
Electronics 13 01462 g001
Figure 2. Block diagram of the proposed expert system.
Electronics 13 01462 g002
Figure 3. UML class diagrams of the (a) CovidESInput object and (b) CovidESInput object.
Electronics 13 01462 g003
Figure 4. UML package diagram of the implemented rules hierarchy.
Electronics 13 01462 g004
Figure 5. Confusion matrix representing the classification performance of the ES on low (LM), medium (MM), and high (HM) monitoring intensities: (a) original unweighted matrix, (b) weight matrix applied to consider the misclassification relevance, and (c) final weighted matrix.
Electronics 13 01462 g005
Table 1. List and characterization of input variables used by the expert system.
Input VariableOptional (O) /Required (R)TypeSourceStatic (S) /Dynamic (D)Block Pertinence
AgeRNumericalAnamnesisSE
SexRSelectAnamnesisSG
MenopauseOBooleanAnamnesisSG
Abdominal circumferenceRNumericalAnamnesisSA
Body mass indexRNumericalAnamnesisSA
Working conditionsOSelectAnamnesisSL
FeverRSelectAnamnesis and IoT deviceDS
TachycardiaRBooleanAnamnesis and IoT deviceDS
DyspneaRBooleanAnamnesis and IoT deviceDS
DesaturationRBooleanAnamnesis and IoT deviceDS
Covid positivityRBooleanAnamnesisSS
CoughRBooleanAnamnesis and IoT deviceDS
HeadacheRBooleanAnamnesis and IoT deviceDS
MyalgiaRBooleanAnamnesis and IoT deviceDS
DiarrheaRBooleanAnamnesis and IoT deviceDS
ConjunctivitisRBooleanAnamnesis and IoT deviceDS
RhinitisRBooleanAnamnesis and IoT deviceDS
Signs of pneumoniaOBooleanAnamnesis and clinical registrationsDS
Syncopal episodesOBooleanAnamnesis and clinical registrationsDS
Family historyOMultiselectAnamnesisSF
SmokingOSelectAnamnesisST
Alcohol abuseOBooleanAnamnesisST
Drug abuseOBooleanAnamnesisST
Oncology therapyOSelectAnamnesisST
TherapyRMultiselectAnamnesisST
COVID-19 vaccination statusRSelectAnamnesisSV
Prior COVID-19 infectionRBooleanAnamnesisSV
Arterial hypertensionOBooleanAnamnesisSC
Subclinical organ damageOMultiselectAnamnesisSC
Ischemic heart diseaseOSelectAnamnesisSC
CardiomyopathyOSelectAnamnesisSC
Chronic atrial fibrillationOSelectAnamnesisSC
Heart failureOSelectAnamnesisSC
Chronic renal failureOSelectAnamnesisSC
Previous acute myocardial infarctionOBooleanAnamnesisSC
Stable anginaOBooleanAnamnesisSC
Unstable anginaOBooleanAnamnesisSC
Atherosclerotic aneurysmOSelectAnamnesisSC
Uncorrected patent foramen ovaleOBooleanAnamnesisSC
Cardiac valvulopathyOMultiselectAnamnesisSC
Diabetes mellitusOSelectAnamnesisSC
Diabetic organ damageOMultiselectAnamnesisSC
Hypercholesterolemia under drug treatmentOBooleanAnamnesisSC
ThyreopathiesOSelectAnamnesisSC
Adrenal insufficiency (even if on cortisone replacement therapy)OBooleanAnamnesisSC
Systemic autoimmune diseaseOMultiselectAnamnesisSC
VasculitisOSelectAnamnesisSC
Renal involvementOBooleanAnamnesisSC
Oncologic pathologyOBooleanAnamnesisSC
ThrombophiliaOBooleanAnamnesisSC
Previous episodes of venous thrombosisOBooleanAnamnesisSC
Previous acute pulmonary embolismOBooleanAnamnesisSC
Prior arterial thromboembolismOBooleanAnamnesisSC
Coagulation deficitsOBooleanAnamnesisSC
ThrombocytosisOBooleanAnamnesisSC
Chronic obstructive pulmonary diseaseOBooleanAnamnesisSC
Chronic pulmonary diseaseOBooleanAnamnesisSC
ImmunodeficiencyOBooleanAnamnesisSC
Diseases affecting the pituitary glandOBooleanAnamnesisSC
Chronic inflammatory bowel diseaseOBooleanAnamnesisSC
Migraine headachesOBooleanAnamnesisSC
The column “Block pertinence” details the block name to which the variable refers. An appropriate explanation is provided later in the paragraph.
Table 2. Pre-processed input variables: contribution of vital parameters, survey, and anamnesis.
Input VariableMeasured Vital ParameterSurvey ContributionAnamnesis Contribution
FeverTemperatureYesBasal value
TachycardiaHeart rateYesBasal value
DyspneaRespiratory actsYesBasal value
DesaturationPulse oximetry-Basal value
Coug-YesBasal value
Headache-YesBasal value
Myalgia-YesBasal value
Diarrhea-YesBasal value
Conjunctivitis-YesBasal value
Rhinitis-YesBasal value
Table 3. Intermediate variables: represented knowledge, usage, and values.
Intermediate VariableRepresented KnowledgePositioning in the HierarchyPossible Values
SCOVID-19 disease stageOutput of block S, input of block RS1, S2, ..., S4
GSex categorizationOutput of block G, input of block AG0, G1, G2
EAge categorizationOutput of block E, input of block RE0, E1, ..., E3
AAntropomethric categorizationOutput of block A, input of block RA0, A1, ..., A3
LWorking-related categorizationOutput of block L, input of block RL0, L1
FFamily comorbidities categorizationOutput of block F, input of block RF0, F1, F2
TToxicology categorizationOutput of block T, input of block RT0, T1, ..., T5
CComorbidities categorizationOutput of block C, input of block RC0, C1, ..., C36
VSARS-CoV-2 vaccination categorizationOutput of block V, input of block RV0, V1, ..., V5
RRisk categorizationOutput of block R, input of block RR0, R1, ..., R4
MDecided monitoring planOutput of block MLM, MM, HM
Table 4. Expert system blocks: number of rules, number of inputs, and output variable.
BlockNumber of RulesNumber of InputsOutput Variable
S413S
G32G
E31E
A43A
L21L
F31F
T65T
C3834C
V52V
R658R
M71M
Table 5. Available monitoring plans: activities and their frequencies.
Monitoring Plan NameTemperaturePressureOxymetrySurveyWalking Test
LMTwice/dayOnce/dayOnce/dayOnce/day-
MMThree times/dayThree times/dayThree times/dayOnce/dayOnce/day
HMFour times/dayFour times/dayFour times/dayTwice/dayOnce/day
MparachuteFour times/dayFour times/dayFour times/dayTwice/dayOnce/day
Msurvey---Once/week-
Table 6. Order level assignment per block.
BlockRule Ordering
S10
G20
E30
A40
L50
F60
T70
C80
V90
R100
M110
Table 7. Precision, recall, and F1-score metrics obtained on individual classes.
ClassPrecisionRecallF1-Score
LM0.770.890.83
MM0.90.770.83
HM0.860.920.89
Disclaimer/Publisher’s Note: The statements, opinions and data contained in all publications are solely those of the individual author(s) and contributor(s) and not of MDPI and/or the editor(s). MDPI and/or the editor(s) disclaim responsibility for any injury to people or property resulting from any ideas, methods, instructions or products referred to in the content.

