1. Introduction
In accordance with national transportation strategies such as ‘Belt and Road’, and ‘building a strong transportation nation’, the demand for building a modern comprehensive transportation system has experienced explosive growth in China. As one of the important components, intermodal passenger transport serves as a cornerstone for improving the quality and standards of integrated transportation services, bearing significant importance in expediting structural reforms in transportation service supply and driving the development of modern comprehensive transportation systems. Currently, the implementation of intermodal transportation faces numerous challenges. From the macro point of view of the government, there are socio-economic issues such as accessibility and inclusiveness, impact on the ecological environment, urban development and land planning, and legal and policy safeguards, as well as economic benefits and costs. From the narrow point of view of the passenger, there is a demand for a more convenient transfer service, a more convenient security check service, a simpler ticketing service and a more accurate information service. The resolution of these issues is inseparable from breaking down data silos to achieve an interconnectivity of information resources between different modes of transportation, such as railways, civil aviation, expressways and urban public transportation. Nowadays, the comprehensive utilization of transportation big data has garnered increasingly widespread attention. In particular, it is necessary to promote integrated data utilization between forms of transport, to realize the vision of route planning with a ‘unified map’, operating control with a ‘unified table’, and travelling with a ‘unified ticket’, so as to better serving the economic and social development of metropolitan areas and improving people’s lives [
1].
As a strategic asset and business-driving factor, the data resources of transportation enterprises are currently used separately, with the separation of ownership and use right. Consequently, data silos of transportation resources have led to a dilemma in data sharing and exchange that the requirements for secure sharing and development cannot satisfy. Due to the diversity of data sources and the risk of data transmission, cross-entity, cross-domain, and even cross-mode data exchange may suffer from severe issues, such as data leakage, data compliance issues, data loss and security vulnerabilities. Therefore, it is imperative to supervise and conduct real-time monitoring of the security of relevant entities from the overall perspective to ensure the smooth operation of critical information infrastructure concerning intermodal transportation.
There has been some research on the security evaluation of datasets and access entities for cross-domain interaction. In order to prevent data quality from affecting the secondary application, a multi-level assessment framework based on a business scenario is established to objectively evaluate the data quality of intelligent transportation [
2]. A service trust assessment model towards a cross-domain alliance of services is proposed, which combines the characteristics of the service collaboration, the characteristics of service entities, various links in service life cycle and inter-domain security policy [
3]. Considering the influence brought by the confidentiality, as well as the synchronization of the trusted measurement frequency with the progress, a multilevel dynamic trusted measurement model based on information flow theory is raised [
4]. In order to solve the identity credibility problem in cross-domain authentication under the blockchain-based heterogeneous identity alliance infrastructure, the identity credibility evaluation method of alliance member consensus has been designed [
5]. With a trust-based logical framework and trust measurement model, the vicious competition of agents in smart cities can be solved, and agents can adopt a cooperative strategy [
6].
The various research mentioned above has realized a flexible and scalable trust measurement of cross-domain information resources, but there are still some shortcomings for the scenario of intermodal transportation. Firstly, as for the data quality assessment, the framework should combine with the properties of traffic big data, where the spatiotemporal characteristics should be adequately addressed. Secondly, considering the information collaboration requirements, data quality should be taken as a great factor of data trust. In fact, the outcome of a business analysis task is directly influenced by the quality of input data, especially in complex analysis tasks; thus, it directly affects the security of data applications. For example, decision-making and predictions based on patterns and trends with poor quality or failing to capture real insights and images of current operational status, can lead to unnecessary risks and losses for transportation organizations, and may have effect on the safety and convenience of passengers’ travelling experience [
7]. Thirdly, the trust measurement should be dynamically updated with data flow between entities in the network environment, considering both static and dynamic evidence for different types of entities. In this way, the data security situation of organizations at all levels can be understood in due course, and the integration of comprehensive supervision of data security realized. Finally, in order to ensure the data security of the whole network, it is necessary to provide an effective visual method to find security threats and judge the trend of data security from a global perspective.
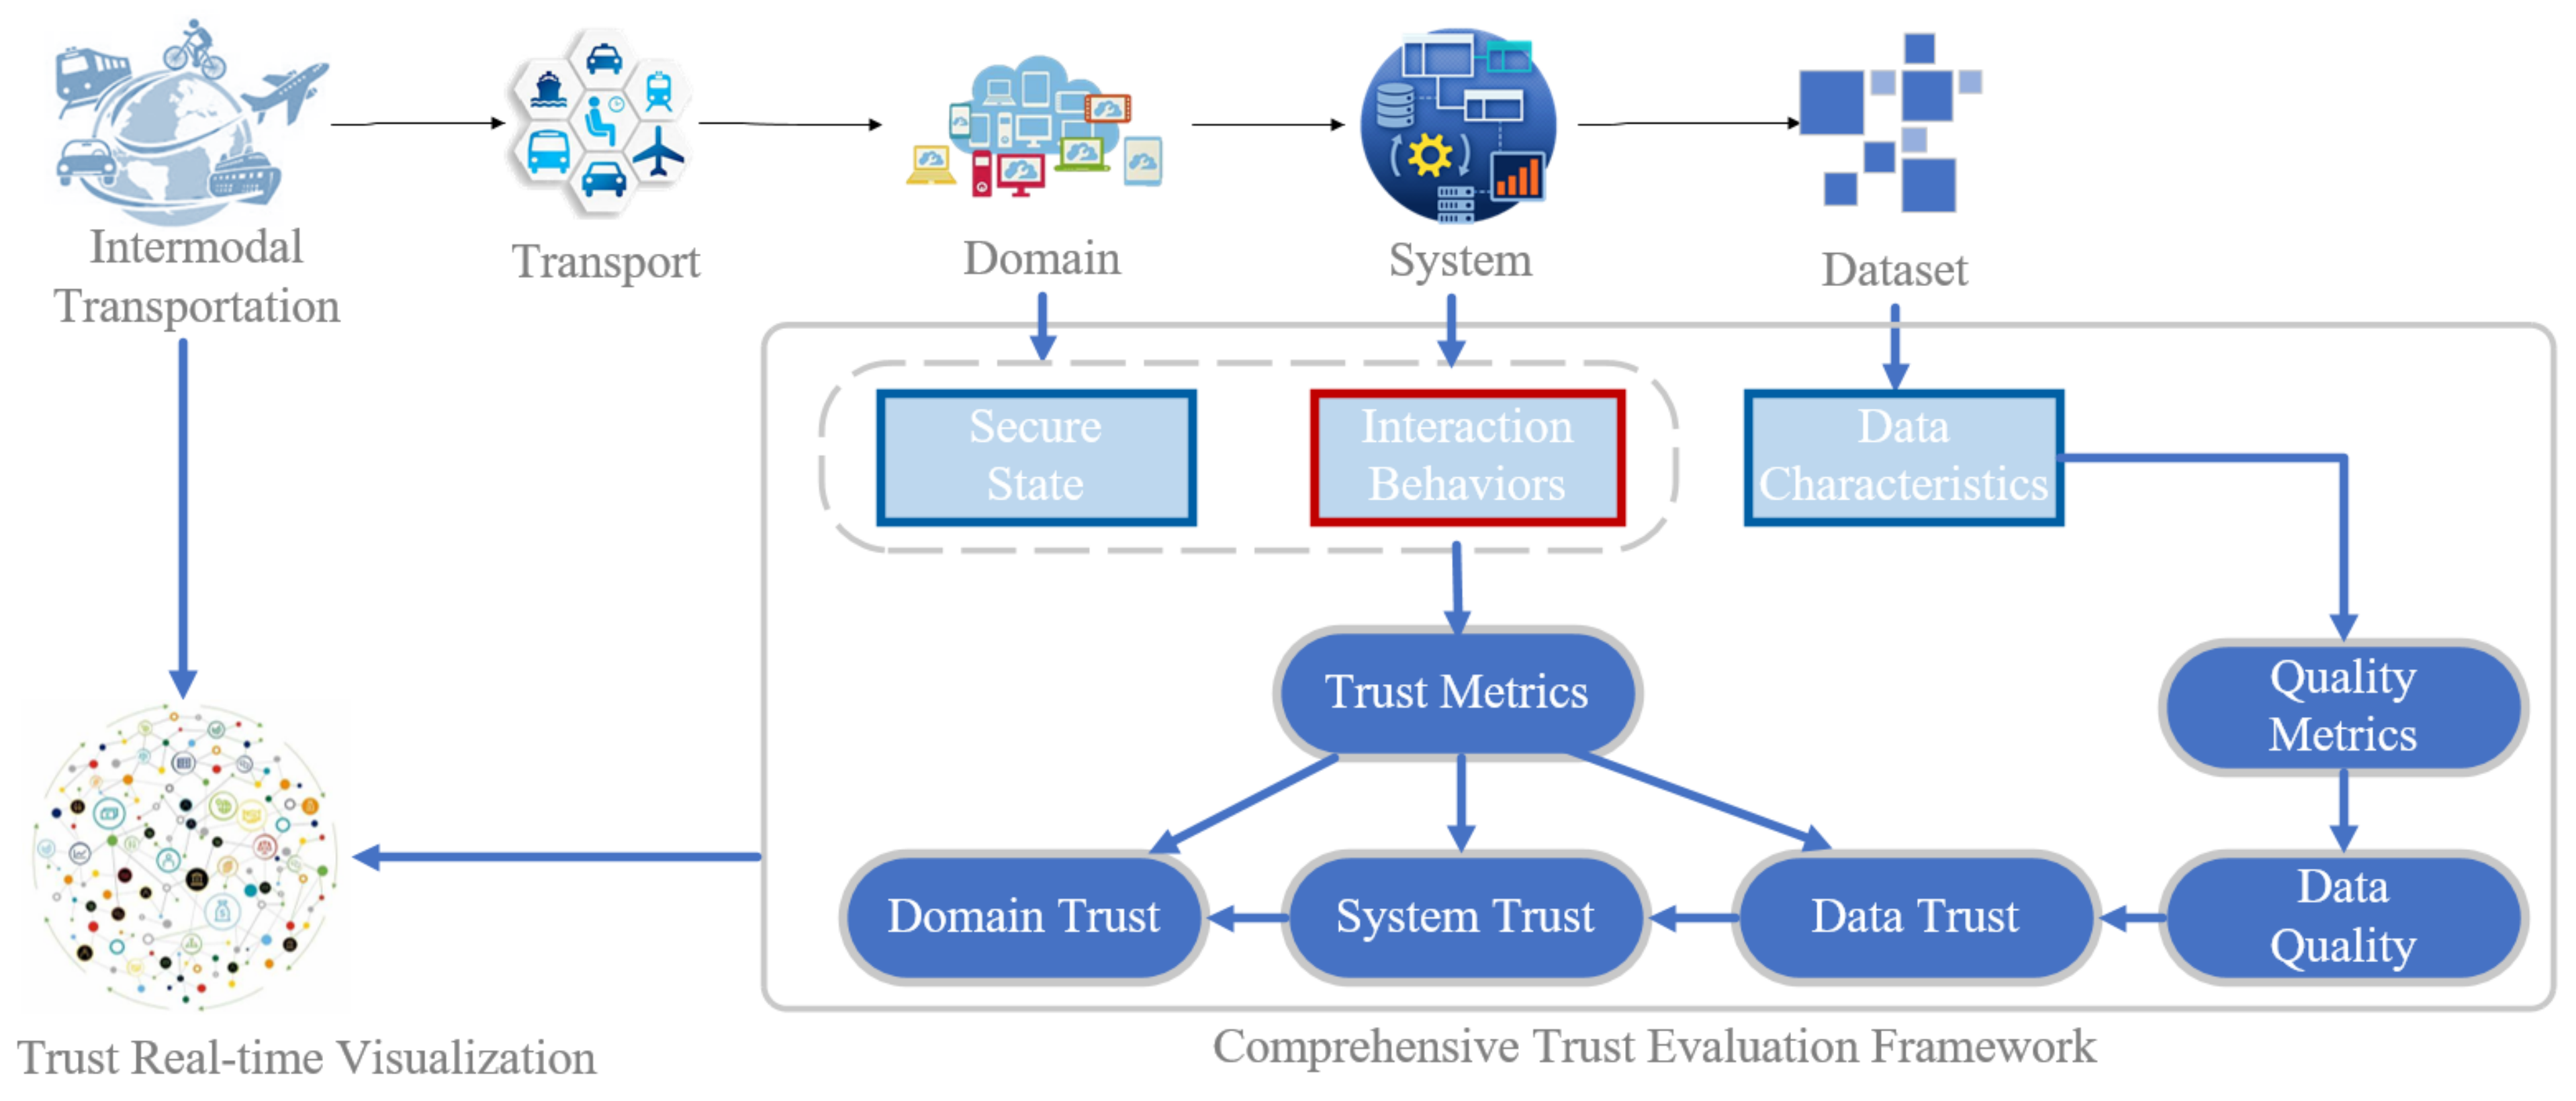
Therefore, in this paper, we propose a comprehensive trust evaluation framework for data interaction entities in intermodal transportation, from the perspective of a data security supervisor. It takes trust as a metric to conduct a comprehensive security monitoring of integrated data, in order to effectively guard the normal operation and integrity of critical information infrastructure. Building upon this foundation, it enables an understanding of the data security posture at different levels, facilitates the exchange of data flow information in the network environments, assesses data security compliance from a regulatory standpoint, and evaluates data security risk trends from a holistic perspective. Furthermore, the framework is designed to be implemented on the data integrated service platform and the performance of data transmission will not be affected.
The structure of the paper is as follows:
Section 2 analyzes the characteristics of data to share between different transportation modes and proposes the hierarchical evaluation framework based on global security needs.
Section 3 raises a model based on three dimensions of time, space and content, to assess the quality of transportation data on different aspects.
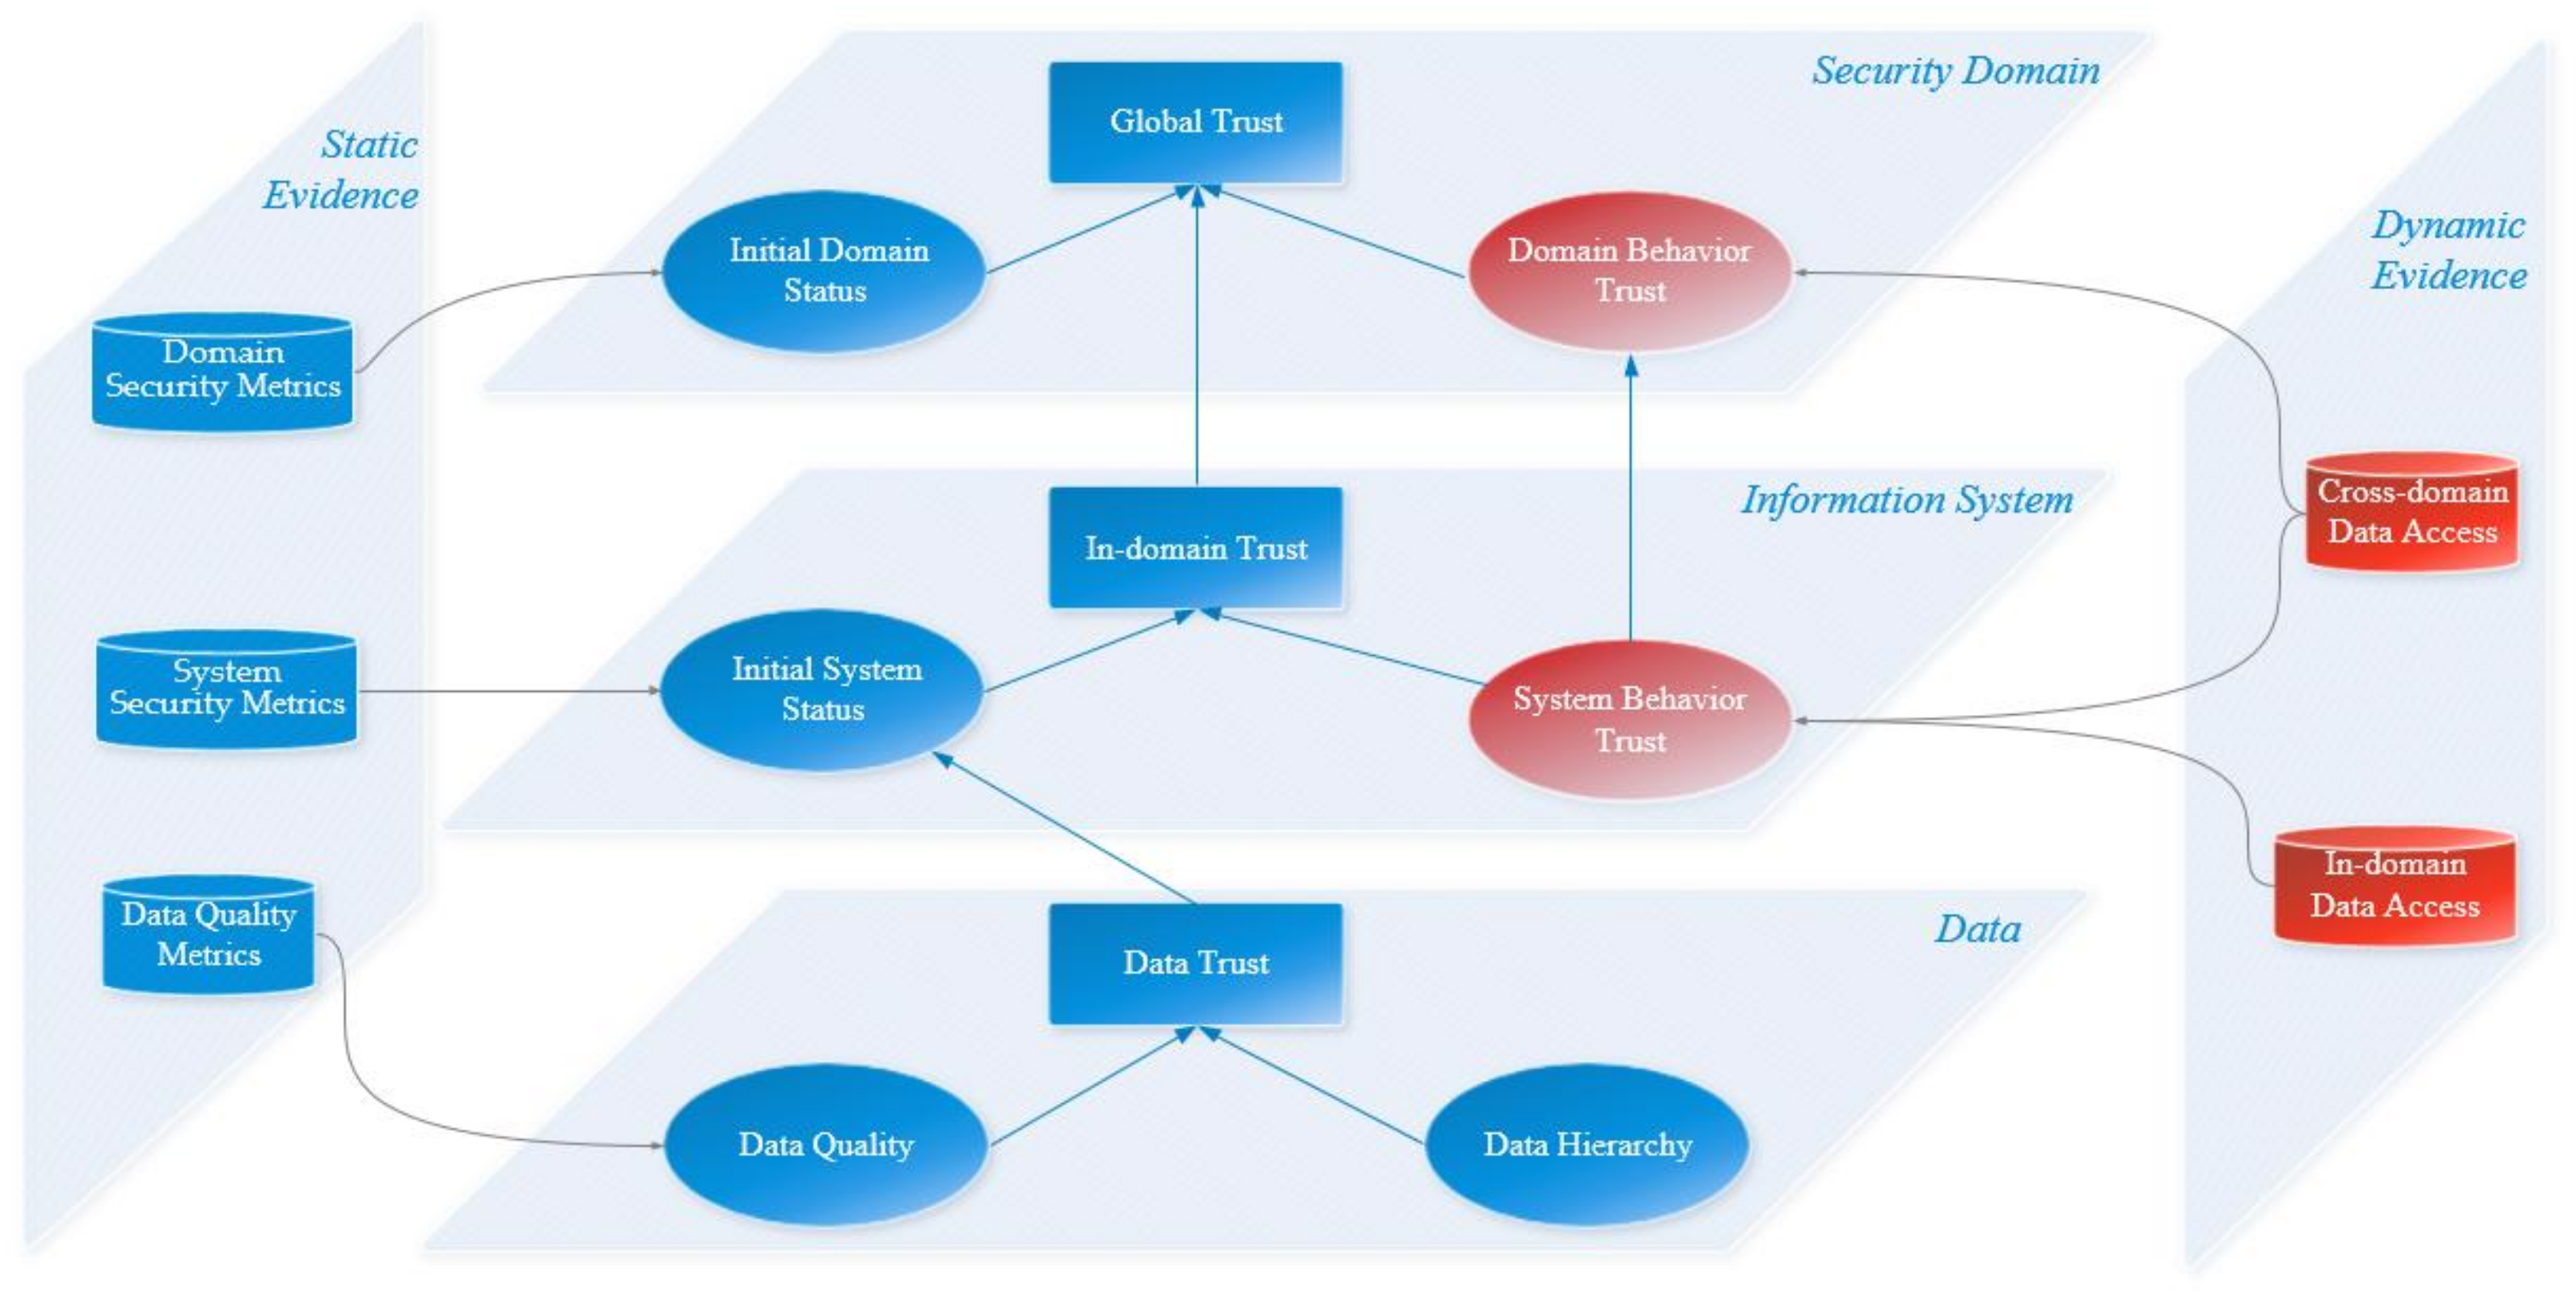
Section 4 introduces a three-layer trust evaluation structure, considering both inherent attributes and historical interaction behaviors. Moreover, to dynamically display the entity performance in the process of cross-mode data interaction, a visualization based on a temporal knowledge graph is adopted in
Section 5.
Section 6 demonstrates the feasibility and practicality of the framework through practical examples of a passenger services scenario. Finally, in the last section, a conclusion summarizes the entire paper.
3. Quality Assessment for Collaborative Interaction of Transportation Data
Based on the exchange requirement and characteristics of transportation big data, this section selects appropriate dimensions for data quality assessment and specific metrics. Then, the corresponding evaluation models and detailed processes are defined. Here, the assessment method is a comprehensive assessment approach, including both a qualitative assessment and a quantitative assessment [
7].
3.1. Metrics for Intermodal Transportation Data Quality Measurement
Since transportation big data exhibits distinct spatiotemporal characteristics, the temporal and spatial properties are as important as inherent content. Accordingly, we employ a three-dimensional structure, i.e., “Time + Space + Content”, to evaluate the quality of transportation information resources, where the dimension of data quality refers to a characteristic or attribute of dataset that can be measured and improved. In fact, quality dimensions provide a way to measure and manage the quality of data products and information resources. Quality indicators for data product quality belong to these quality dimensions and represent a more detailed evaluation form of quality dimensions. Therefore, a two-layer assessment system is proposed with ten indicators from three dimensions, as stated in
Table 1.
The time dimension contains three indicators: time coverage, timeliness, and stability. The space dimension contains two indicators: space coverage and spatial consistency. The content dimension contains five indicators: consistency, accuracy, integrity, validity, and traceability. The specific meanings of these ten indicators are defined in
Table 1.
3.2. Comprehensive Data Quality Assessment Model for intermodal Transportation
With the evaluation indicators above, an evaluation system is proposed for intermodal transportation data interaction. The system consists of time quality, space quality and content quality. In specific application, these three parts can be used separately or jointly, according to demand of practical scenario. In addition, each quality value is limited to (0, 1), so as to ensure the generality of the model. For a dataset P, we assume that P has N data objects, i.e., , and the objects make up an LN-layer spatial structure; K refers to the number of total timestamps of P, indicating time range; the attribute set of P is A = {A1, A2, …, AM}, and M is the number of attributes.
3.2.1. Time Quality Evaluation
The model for time quality
is as follows:
where
wt1 ~
wt3 represent weights, limited by
wt1 +
wt2 +
wt3 = 1, and the values can be determined by actual requirements or the importance of evaluation indicators.
PTCOV,
PTTL, and
PTSTA represent the evaluation results of time coverage, timeliness, and traceability, respectively.
- (a)
Time Coverage PTCOV
If data object
pi is the lack of content at a certain time point, the time integrity of the data object is affected. Assuming the mapping function
F(
x|
C) represents whether the data object exists under certain conditions, we have:
Thus, the time coverage evaluation
PTCOV of dataset
P, is as follows:
The value range of PTCOV is (0, 1), where a value closer to 1 indicates a better time coverage of the data product, and vice versa.
- (b)
Timeliness
Timeliness reflects whether the generation of the data is timely, and it can be represented by the difference between the time of data generation and the current time. Assuming the current time is used as the reference time, denoted as
t, the timeliness evaluation model
PTTL is as follows:
where
tP represents the creation or acquisition time of data
P. For the ease of calculation,
tP and
t can be converted into integers. For example, the time point
t0 can be uniformly converted to the time interval from 1 January 1970, 0:00:00 in milliseconds. The value range of
PTTL is (0, 1), where a value closer to 1 indicates better timeliness of the dataset, and vice versa.
- (c)
Stability
Stability measures the volatility and discreteness of data. The dataset is divided into equal data slices based on the time range, and it is categorized into
N classes according to object characteristics. Calculate each expectation
μi and standard deviation
σi of the newly added data within each class and obtain coefficient of variation
C·Vi for each class. The overall dataset stability is defined as the average of the coefficients of variation for each class:
The range of
STA is (0, ∞), generally applicable when the average value is greater than 0. The smaller
STA is, the smaller the data fluctuation and the lower the degree of dispersion, indicating higher stability. To limit the range of
PVSTA to [0, 1], select the tanh function for mapping. Therefore, the stability evaluation model
PVSTA is:
3.2.2. Space Quality Evaluation
The evaluation model for space quality is as follows:
where
ws1 and
ws2 represent weights, and
ws1 +
ws2 = 1. The values of weights are determined by the application requirement.
PSCOV and
PSCON represent the evaluation results of spatial coverage and spatial consistency, respectively.
- (a)
Spatial Coverage
Spatial coverage reflects whether data objects in the data product are missing or redundant. The spatial coverage evaluation model
PSCOV is as follows:
where the function
count(
P) refers to the amount of data objects in the dataset. If the value of
PSCOV is 1, it indicates that there are no missing or redundant data objects. The closer
PSCOV is to 1, the fewer missing or redundant data objects there are, and vice versa.
- (b)
Spatial Consistency
Since the way of obtaining data and the data standards both vary considerably among different transportation departments and organizations, the form and content of spatial data often have significant differences in geometric aspects. Therefore, in addition to spatial coverage, it is also necessary to check spatial consistency for traffic data.
Spatial consistency includes spatial location consistency, spatial objectives consistency, and spatial relationship consistency [
6]. Spatial location consistency refers to the degree of matching in coordinate representation. Spatial objectives consistency refers to the equivalence of object existence, number of digits, shape, size, and spatial details. Spatial relationship consistency refers to topological equivalence and directional equivalence. Among these types of consistency, the relationship consistency is the most important content, with topological relationships dominating.
Assuming
oik and
ojl represent the
kth data object in the
ith layer and the
lth data object in the
jth layer,
ηs(
oik,
ojl) is the spatial consistency check function between data objects
oik and
ojl. If the topological relationship between objects
oik and
ojl is consistent with reality,
η(
oik,
ojl) is 1; otherwise, it is 0. The spatial consistency evaluation model
PSCON is defined as follows:
where
tfij represents the number of neighborhood object for
oik and
ojl with topological relation, in the
ith and
jth layer.
3.2.3. Content Quality Evaluation
The evaluation model for content quality is as follows:
- (a)
Attribute Coverage Rate
If the attributes of data objects in the data product are missing, it will reduce the usability of the data product. The attribute coverage rate evaluation model
PVCOV is as follows:
where
is to check the existence of the
ith data object at the
jth attribute. The
value closer to 1 indicates a better time coverage of the data product, and vice versa.
- (b)
Accuracy
Accuracy reflects whether data objects accurately and truthfully describe the application scenario. We suppose the attribute set
A = {
A1,
A2, …,
AM} has reference value standard sets
R = {
R1,
R2, …,
RM} in this case. Let
be the accuracy judgment function. If the value of object
oi at attribute
Ak satisfies the reference value standard
Rk, then
is 1; otherwise, it is 0. The accuracy evaluation model
PVACC is as follows:
where the range of
PVACC is [0, 1]. When
PVACC is 0, the accuracy of data objects is low; and vice versa.
- (c)
Effectiveness
Effectiveness can be assessed by customized rules for specific application scenarios, where each rule can be related to one or more conditions. For example, when accessibility is the metric, we should inspect the physical conditions and interfaces for users to access data. The effectiveness evaluation model
PVEFF is as follows:
where
UN represents the number of ineffective data objects.
- (d)
Consistency
Consistency is used to determine whether the values between different attributes of the same data object are correct and complete. Let
Ak and
Al be two attributes with consistency relations, and
μv(⋅) be the consistency judgment function. If the value of object
oi at attributes
Ak and
Al satisfies the consistency relation, then
is 1; otherwise, it is 0. The consistency evaluation model
PVCON is as follows:
where the function
Cc(
M) counts the number of consistent attribute pairs in set
A.
- (e)
Traceability
The traceability evaluation is primarily qualitative [
11]. It can be designed to score items that require traceability, and then check whether various traceable elements in the data are provided. If provided by the provider, the corresponding part of score is obtained; otherwise, the score for that item is 0. Finally, the obtained scores are added together to obtain the final evaluation result.
3.3. Assessment Process
Since transportation data covers all aspects of the transportation industry, the evaluation indicators, weights, and results threshold in the transportation data assessment model should be decided by the specific business requirement. In practical applications, after determining the need for data quality assessment, the evaluation of transportation data quality can be divided into the following steps:
- (a)
Identify the evaluation dataset: select either the entire data content or a typical data field set as the evaluation object based on business needs.
- (b)
Select evaluation indicators: determine the indicators or factors that need to be assessed. The choice of evaluation dimensions can be comprehensive, or to select individual dimensions based on business needs.
- (c)
Determine evaluation weights: determine the factors influencing weight allocation, such as data importance, business requirements, expert opinions, etc., and select suitable weighting methods. Common methods for determining weights include the Analytic Hierarchy Process, Delphi method, statistical analysis method, and expert scoring method, etc., which should be chosen according to the content of data evaluation [
12]. Continuously improve weight allocation based on feedback and actual results during the evaluation process to ensure the accuracy and effectiveness of the evaluation system.
- (d)
Validate and Adjust: Verify whether the chosen indictors and calculated weights align with reality and make adjustments and optimizations as needed. Relevant data and stakeholders’ opinions should be gathered to provide a basis for validation.
- (e)
Summarize: record the evaluation results of each dataset, calculate the score of the evaluation object based on the weights and scores of each dataset, and determine whether the data is compliant based on the threshold.
5. Data Interactive Visualization Method Based on Temporal Knowledge Graphs
Through graph visualization, suitable data display layouts and interactive methods can be designed according to the need of an intermodal transportation business. It helps information resource managers to perceive global data resources and understand cross-domain interactions. Therefore, a method based on a temporal knowledge graph is raised, and it helps to present massive and complex data interaction relationships intuitively and reasonably. In further research, it will lay the foundation of discovering malicious entities and tracing data flows promptly [
15,
16].
In this section, the Data Interaction Temporal Knowledge Graph (DITKG) is constructed for transportation cooperation. We first make the definition of DITKG, then introduce the methods for constructing the graph, and finally visualize the DITKG using the Neo4j graph database.
5.1. Formal Definition of DITKG
Knowledge graphs have evolved from the development of graph data technologies. In contrast to traditional tabular storage methods, the knowledge graph data model is more suitable for machines to understand data correlations, aligning with human cognition and memory of the real world. As data volumes grow and business complexities increase, traditional forms of charts and metrics may not satisfy the need for business staff to understand the relationships behind the results. Furthermore, time information is significant to represent the variation trend of domain trustworthiness between two security domains, and situations where the global trustworthiness of a system sharply declines due to continuous malicious behavior, etc. Furthermore, it can provide vital support in the analysis of trustworthiness, predicting cross-domain malicious access, and thus protecting the security of data interactions. Therefore, we proposed a visualization approach based on temporal knowledge graph.
The data interaction temporal knowledge graph is a heterogeneous graph that describes interaction relationships between entities, where access requests are represented by directed edges with timestamps. Each fact in the temporal knowledge graph can be represented by a temporal quadruple (es, r, eo, t), where es is the head entity, r is the relationship between the head entity and the tail entity, eo is the tail entity, and t represents the timestamp of the occurrence. This quadruple overall describes the interaction relationship r occurring between the subject entity es and the object entity eo at time t. In addition, the set of all content in the DITKG is defined as G = (E, R, T), where es, eo ∈ E represents the entity set, r ∈ R represents the relationship set, and t ∈ T represents the timestamp set.
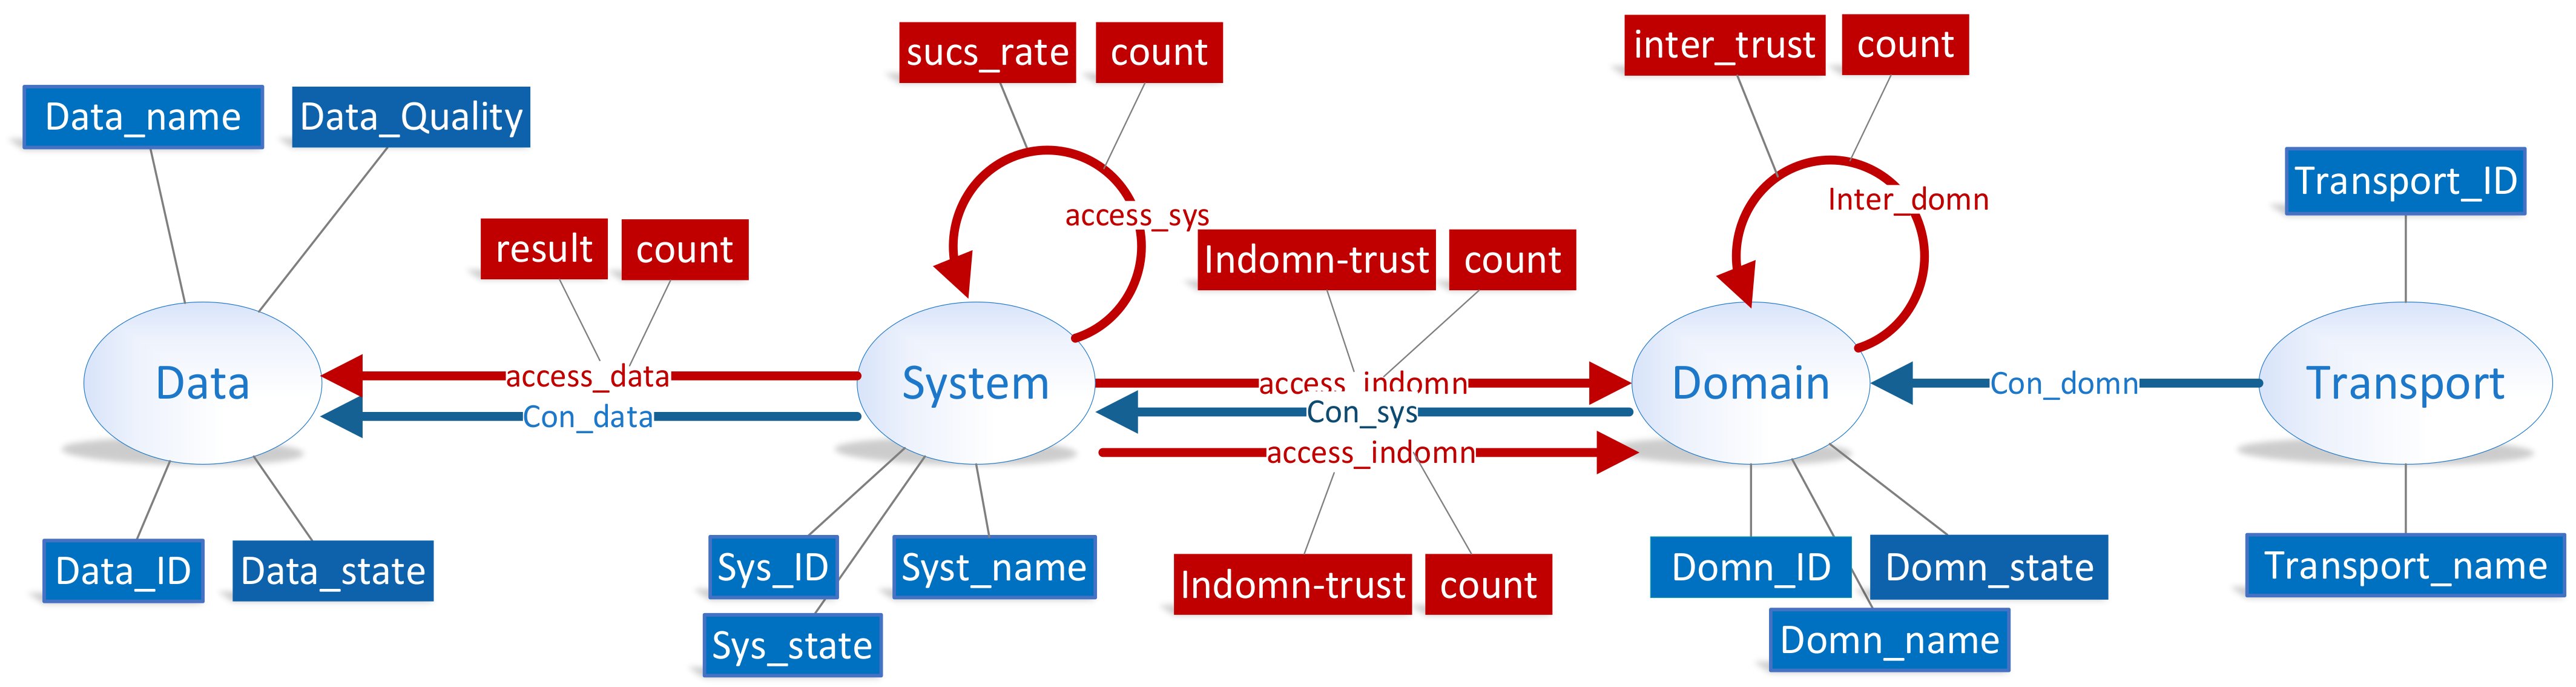
5.2. Schema of Temporal Data Knowledge Graph
The formal definition of the temporal knowledge graph lays the foundation for constructing the graph. The detailed construction involves ontologies, relationships, and attributes of the DITKG.
Since the constructed knowledge graph in this paper is time-varying, there are both time-sensitive and time-insensitive attributes. For example, attributes such as in-domain trust and access count are time-sensitive, closely linked to time, and their values may change at different moments. On the other hand, attributes like data ID and the partition of security domains are time-insensitive; they do not change with time and have fixed values. As shown in
Figure 3, dynamic attributes are all related to the interaction behaviors, which are presented as relationships in DITKG. Therefore, attributes of ontologies are time-sensitive while that of relationships are time-insensitive.
- A.
Entity and Attribute Definitions
According to the trust assessment framework, ontologies in this graph include data sets, information systems, security domains and transport mode. Ontologies with their attribute as defined in
Table 5, which describes the static attributes corresponding to each ontology.
- B.
Relationship and Attribute Definitions
Relationships in the DITKG consist of two types: memberships and interactions. Memberships are static without time-varying attributes, referring to the relation “is an element of”. Memberships exist between a system and dataset, a system and a security domain, a security and a transport mode. Interactions describe the access request between subject entity and object entity, and they are the most significant part in DITKG with time-sensitive properties. From the perspective of accessing entity types, interactions are defined between System and Data, System and System, System and Domain, Domain and Domain. To reflect the changes in trust value adequately, interactions between System and Domain are divided into System and Domain to which it belongs, and System and other Domain, corresponding to the in-domain trust and global trust, respectively.
In the process of generating the temporal quadruple knowledge graph, there are two ways to represent time information [
13]. One is as a new relationship connecting the subject entity and the object entity, and the other is as an attribute of the relationship itself. In this paper, the treatment of time-sensitive attributes is consistent with the approach used in relation extraction, considering this type of data as four-tuples with time labels [
17].
Table 6 describes the relationships and corresponding associated attributes.
In summary, the constructed pattern layer is illustrated in
Figure 4. As shown, static properties and relationships are represented in blue, while dynamic ones are in red.
5.3. Construction and Visualization of Temporal Knowledge Graph
Graph visualization involves transforming the originally obtained relational database into a graph database schema based on the schema illustration. Compared to common knowledge graph, the DITKG extends triples into temporal quadruples (es, r, eo, t) to take dynamic temporal information into account, where t provides additional temporal information about when the event, i.e., an access request occurred.
We use the Neo4j graph database to draw the temporal knowledge graph of data interactions. As a graph database, Neo4j stores knowledge in a network form of ontology structure, unlike traditional relational databases that use tabular forms [
18]. It visualizes relationships between entities and is one of the most commonly used databases for knowledge graphs. The triple knowledge of Neo4j is usually stored in the “node-edge-node” format, while temporal quadruples need to be stored in DITKG. Therefore, we added the timestamp as an attribute of the relationship in Neo4j when storing. For example, the quadruple (‘AFC’, ‘access_data’, ‘Railway Ticket Reservation Data’, ‘2023/10/19/13/0/0’) would be stored as an ‘access_data’ relationship with the time attribute ‘2023/10/19/13/0/0’. Finally, to improve the intelligibility of the graph, we stipulate that the ontology of the graph is displayed as its own name attribute by default, the static relationships are displayed as types, while the dynamic relationships are displayed as the trust attribute.
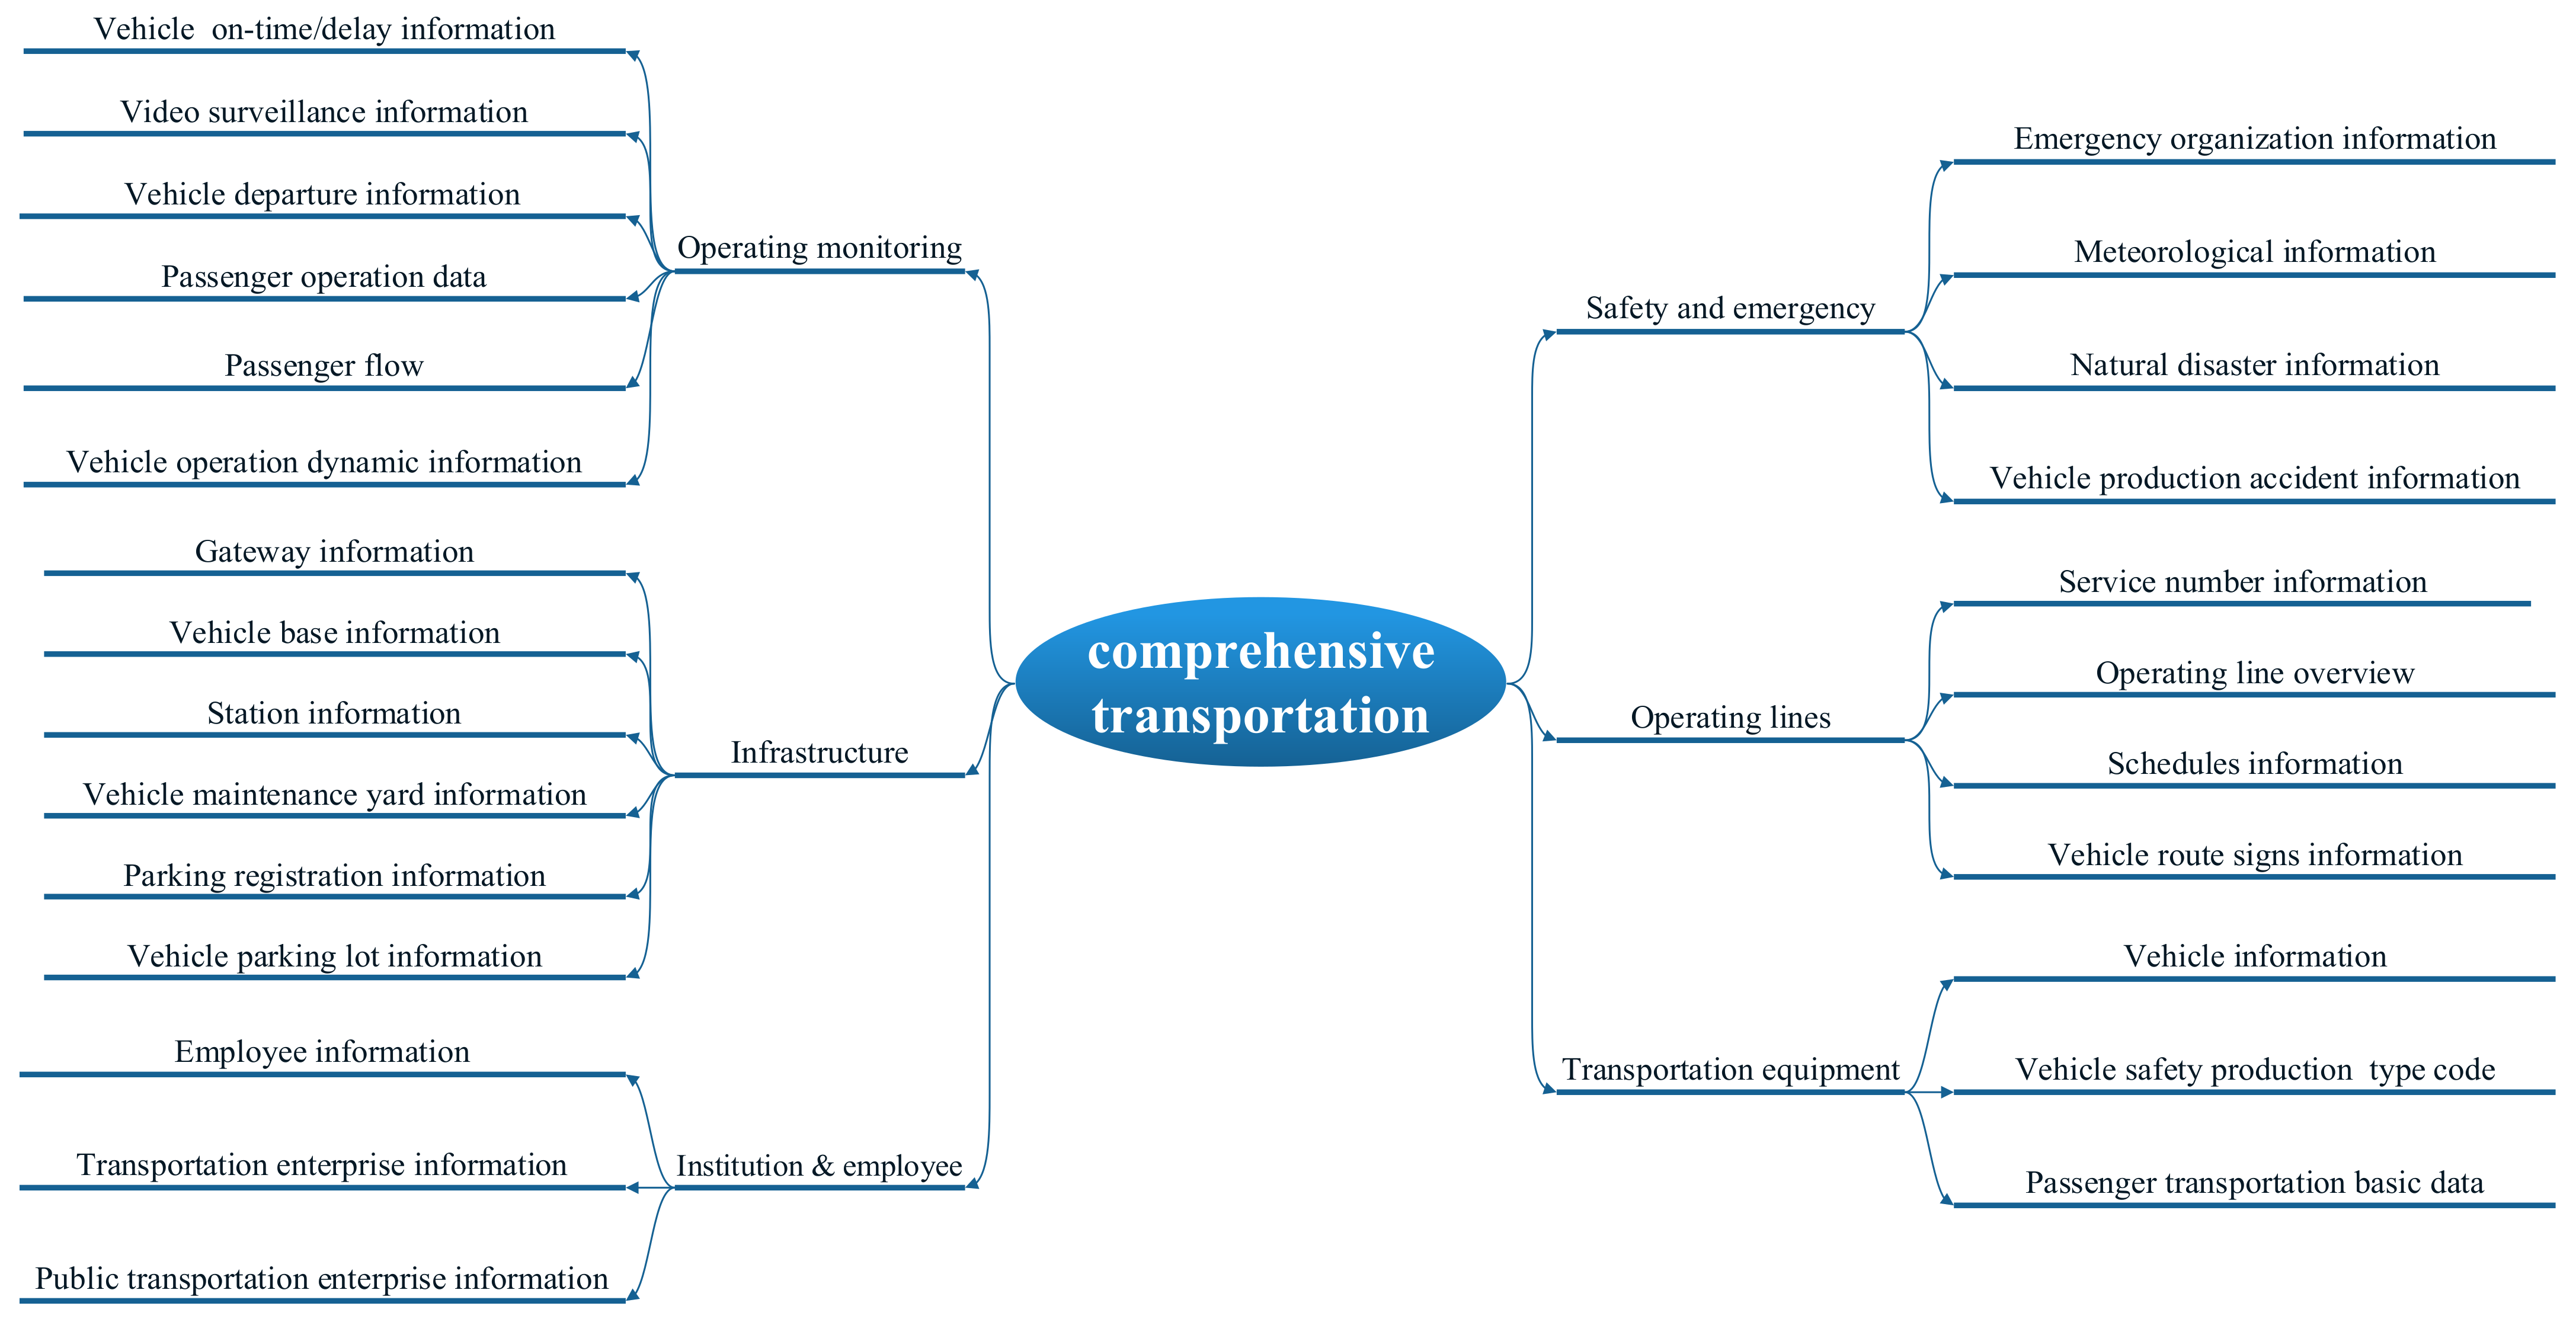
6. Application and Analysis
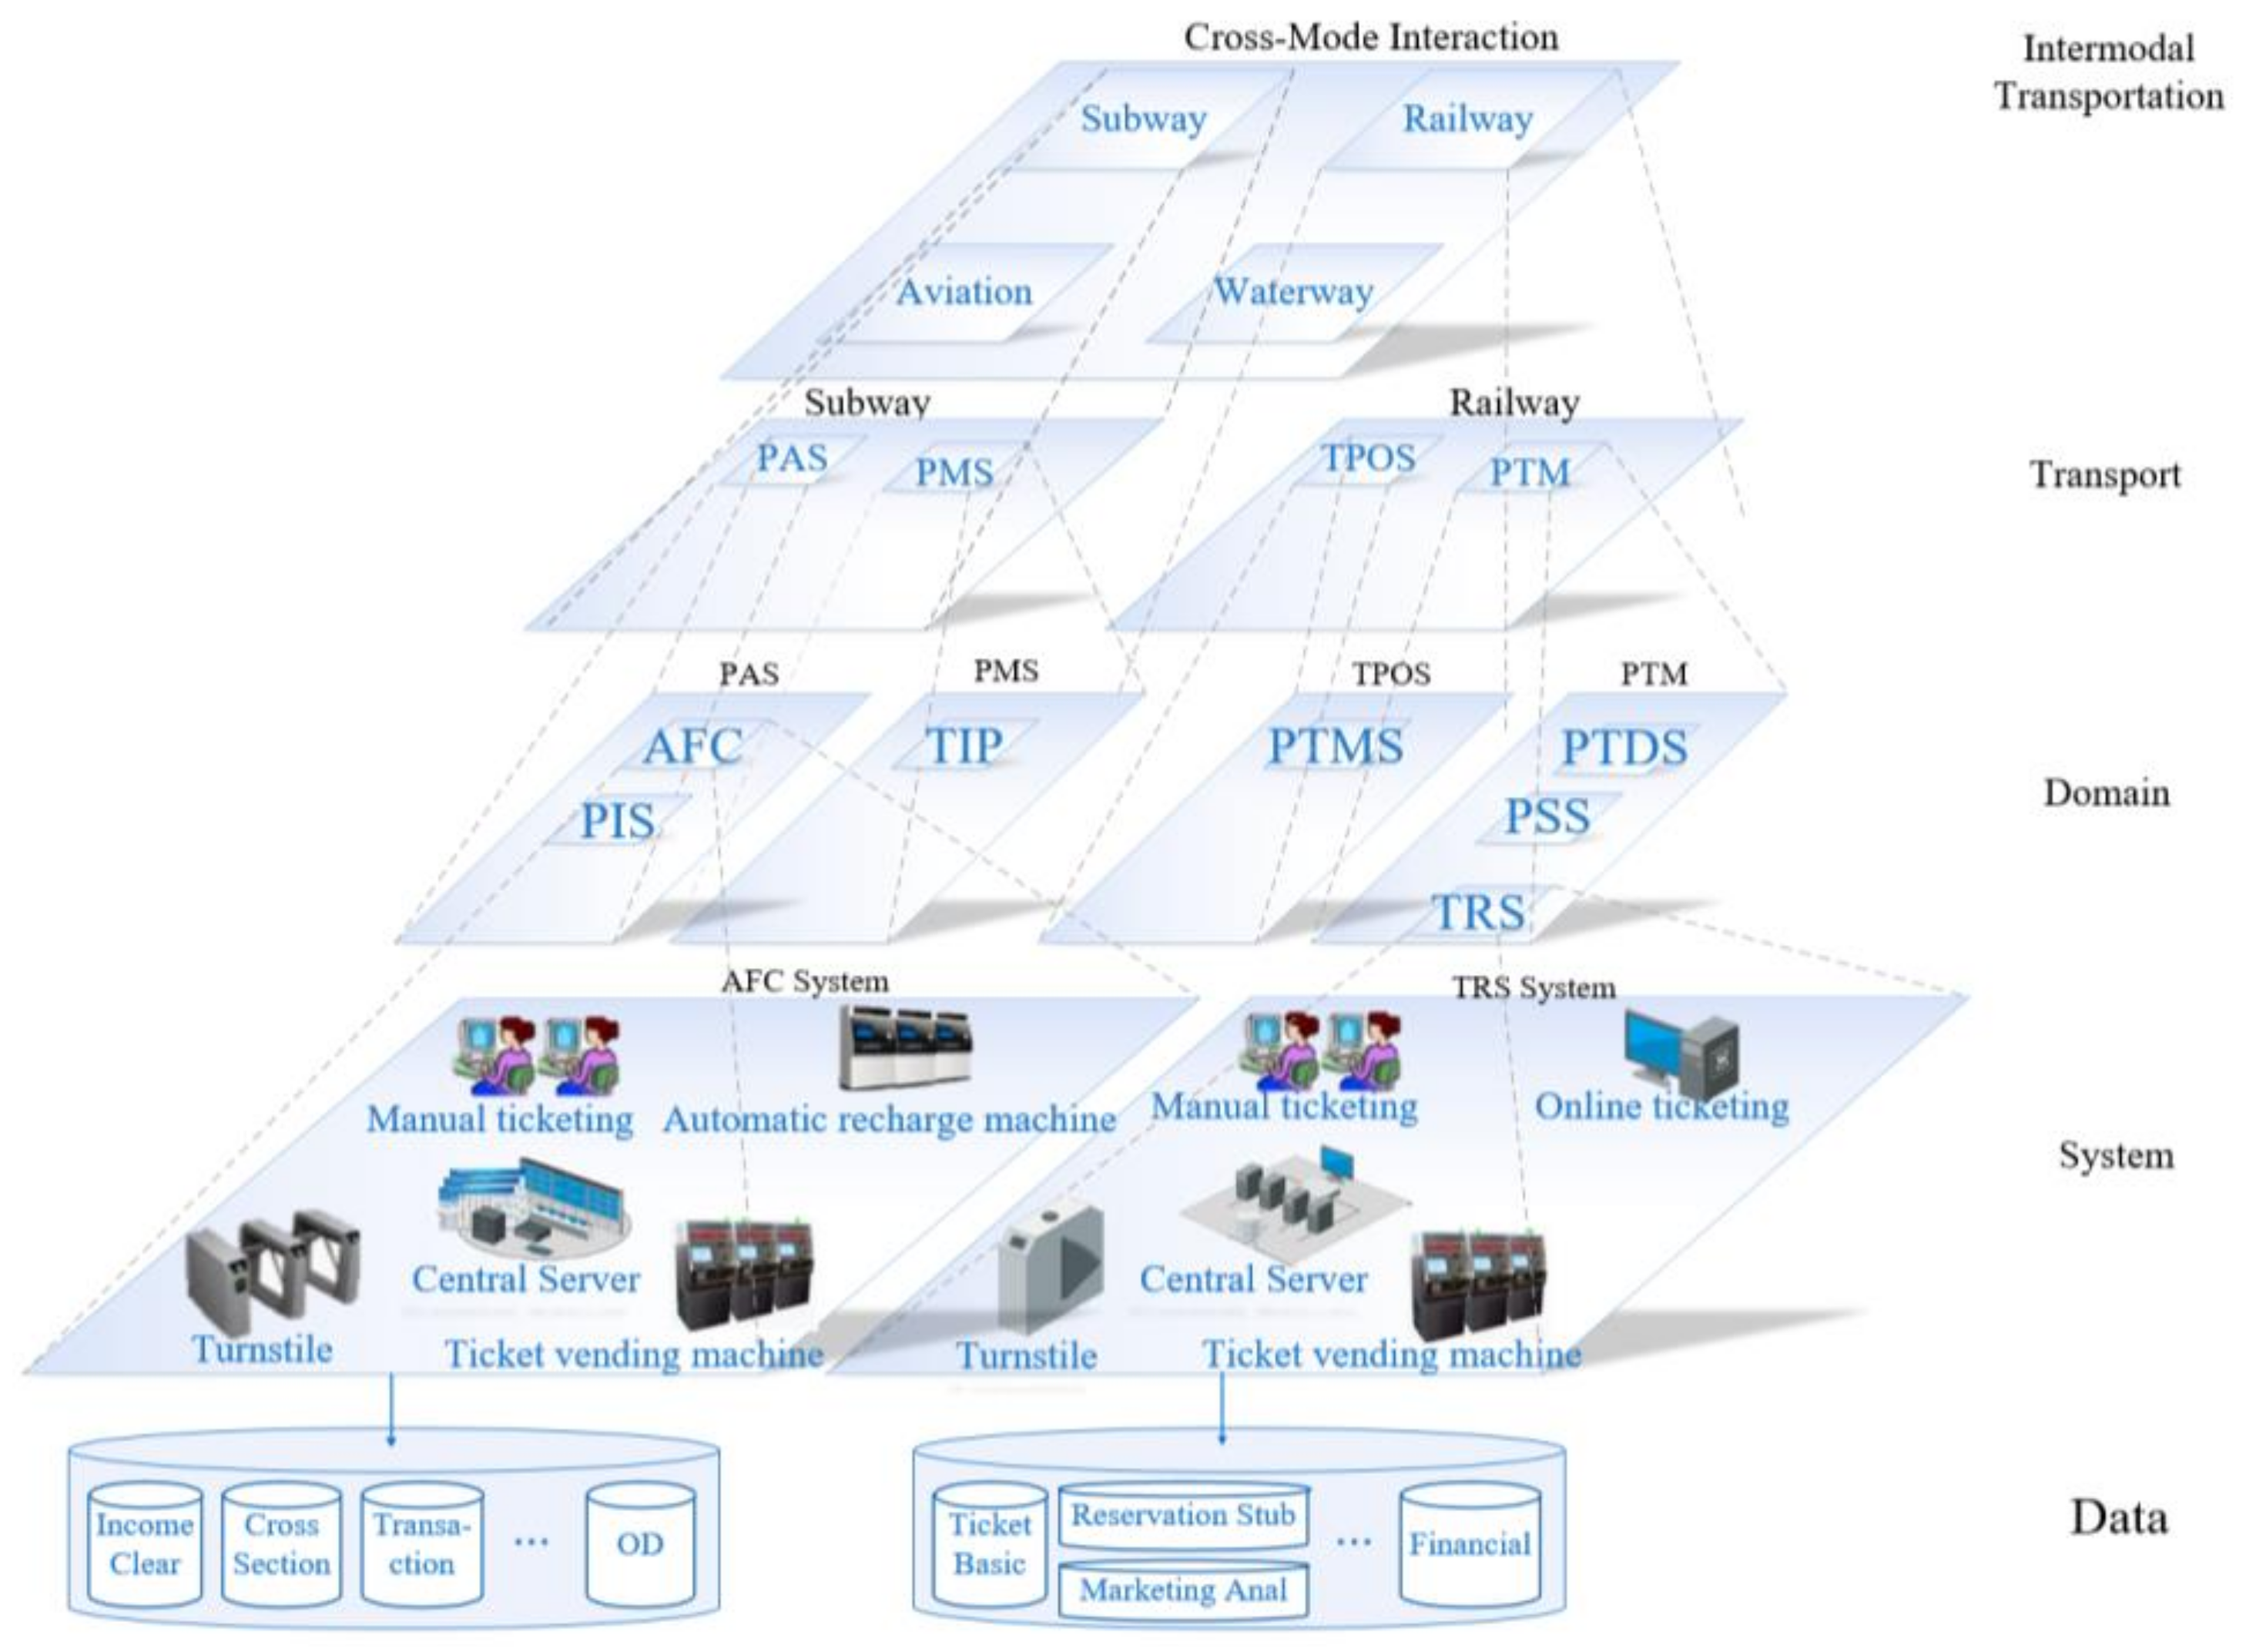
This section verifies the comprehensive trust assessment framework for information resource exchange in intermodal transportation. Based on the scenario of intermodal passenger transport between subway and mainline railway, we first calculate the quality of relevant datasets, to check whether it can meet the demand of the cross-mode standard. And then, the trust of entities is compared in different situations. Finally, the dynamic changes caused by data interaction is visualized by DITKG.
For intermodal passenger transport, the demand of information exchanging mainly focuses on one-ticket booking [
19], intelligent passenger guide, and better transfer support at junction station [
20]. Some of related entities in subway and mainline railway are shown in
Figure 5. In the subway system [
21], the production management system (PMS) and production auxiliary systems (PAS) are regarded as the domain of subway operation business [
22]. PAS has two significant information systems, i.e., passenger information system (PIS) and auto fare collection (AFC) system. The PIS system utilizes operational information that would be open to the public, through displays at stations, onboard broadcasting and displays, mobile applications, and online websites. The ticketing internet platform (TIP) is to update ticket availability, prices, and seat selection information to purchase tickets. AFC collects data from turnstiles and ticket selling equipment, and aggregates them to a central server, including passenger flow for income clearing, origin–destination passenger flow, cross section passenger flow, and ticket transaction data [
23]. In railway system [
24], the information systems associated with passenger service are the ticket reservation system (TRS), passenger transport marketing decision-support system (PTDS), passenger service systems (PSS), and passenger transport management system (PTMS). The first three of these belong to the business domain of passenger transport marketing (PTM), and the last one belongs to the transportation production organization (TPO) domain [
25].
6.1. Compliance of Data Quality
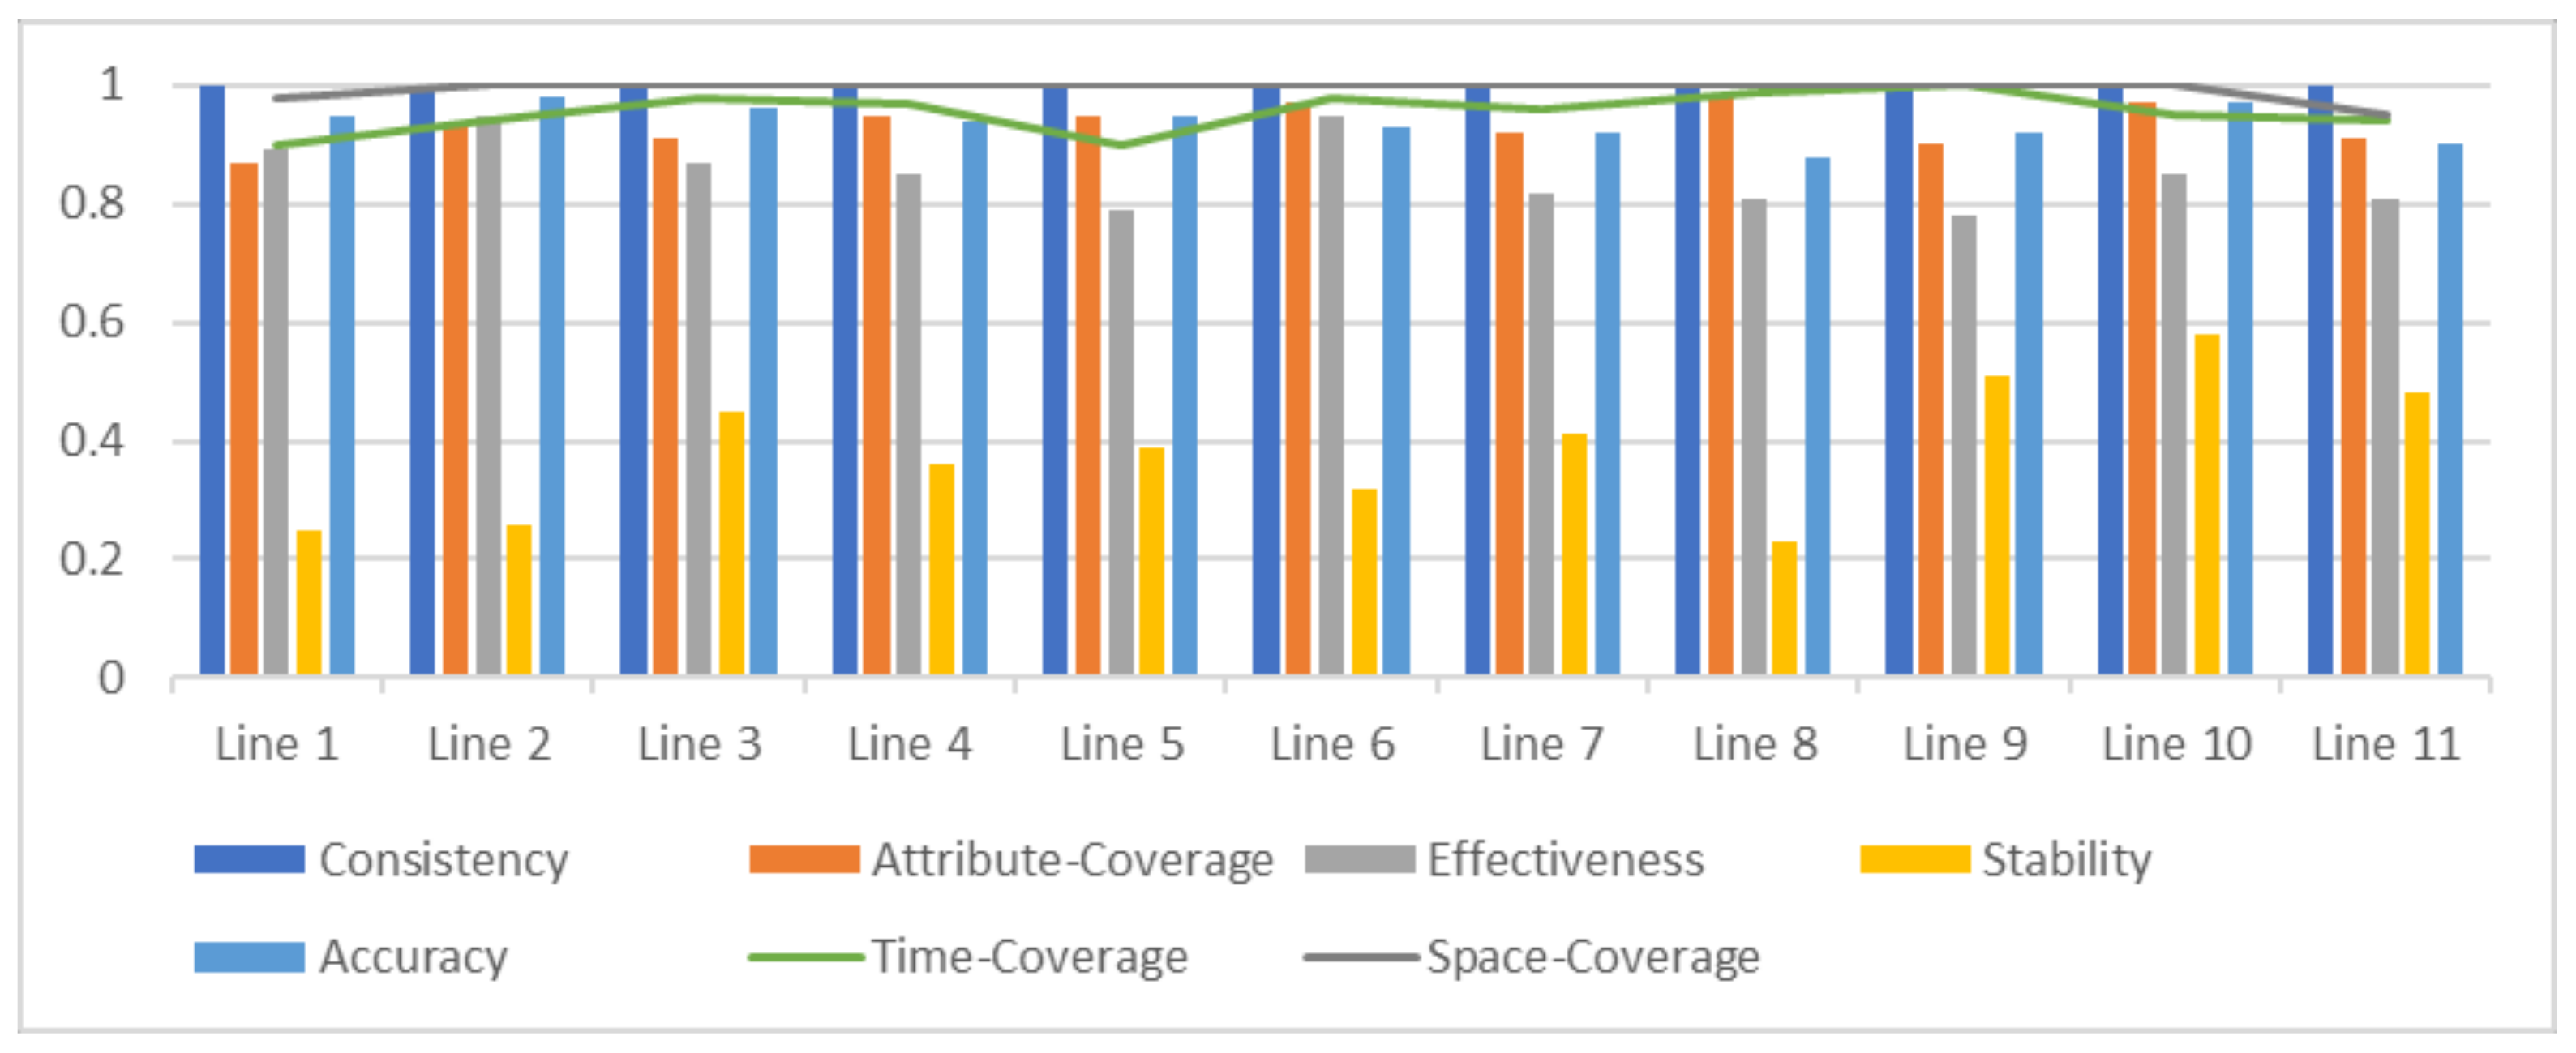
Taking a two-day ticket transaction dataset as an example, we conduct a quality assessment of the data and use 0.75 as the threshold to check the compliance of the dataset. This dataset is adopted from AFC system of subway transport in city A, where there are a total of 11 subway lines in the city. In this case, the dataset is divided based on the line numbers where the passenger alighted, so that we can compare the data quality between different operating lines.
Firstly, the data feature analysis of subway ticket transaction data is conducted. Due to the fixedness of operating lines and stations, the spatial consistency is always 1. Also, because the data within the subway system is traceable from collection to aggregation, its traceability is considered as 1. The acquisition frequency of ticket transaction data is daily, and the dataset meets the requirements, hence its timeliness is 1. Therefore, the dataset’s quality is primarily examined from metrics such as spatial integrity, temporal integrity, attribute completeness, validity, accuracy, stability, and consistency. The result is shown in
Figure 6.
As in
Figure 6, it can be observed that the stability of data from various subway lines is generally at a low level, where the time slice for stability evaluation is set to 1 h. This is determined by the traffic patterns in urban transportation, and it varies dramatically from hour to hour. Assuming weights of quality metrics in
Section 3.2 are determined by expert scoring method to be
,
, the data quality assessment values for each line can be obtained. Line 10 has the highest value at 0.798, while Line 1 has the lowest value at 0.7432. The data of Line 1 are below the threshold of 0.75, indicating a need for improvement before sharing to other transport modes. The rest of the lines meet the standards.
6.2. Trust Evaluation
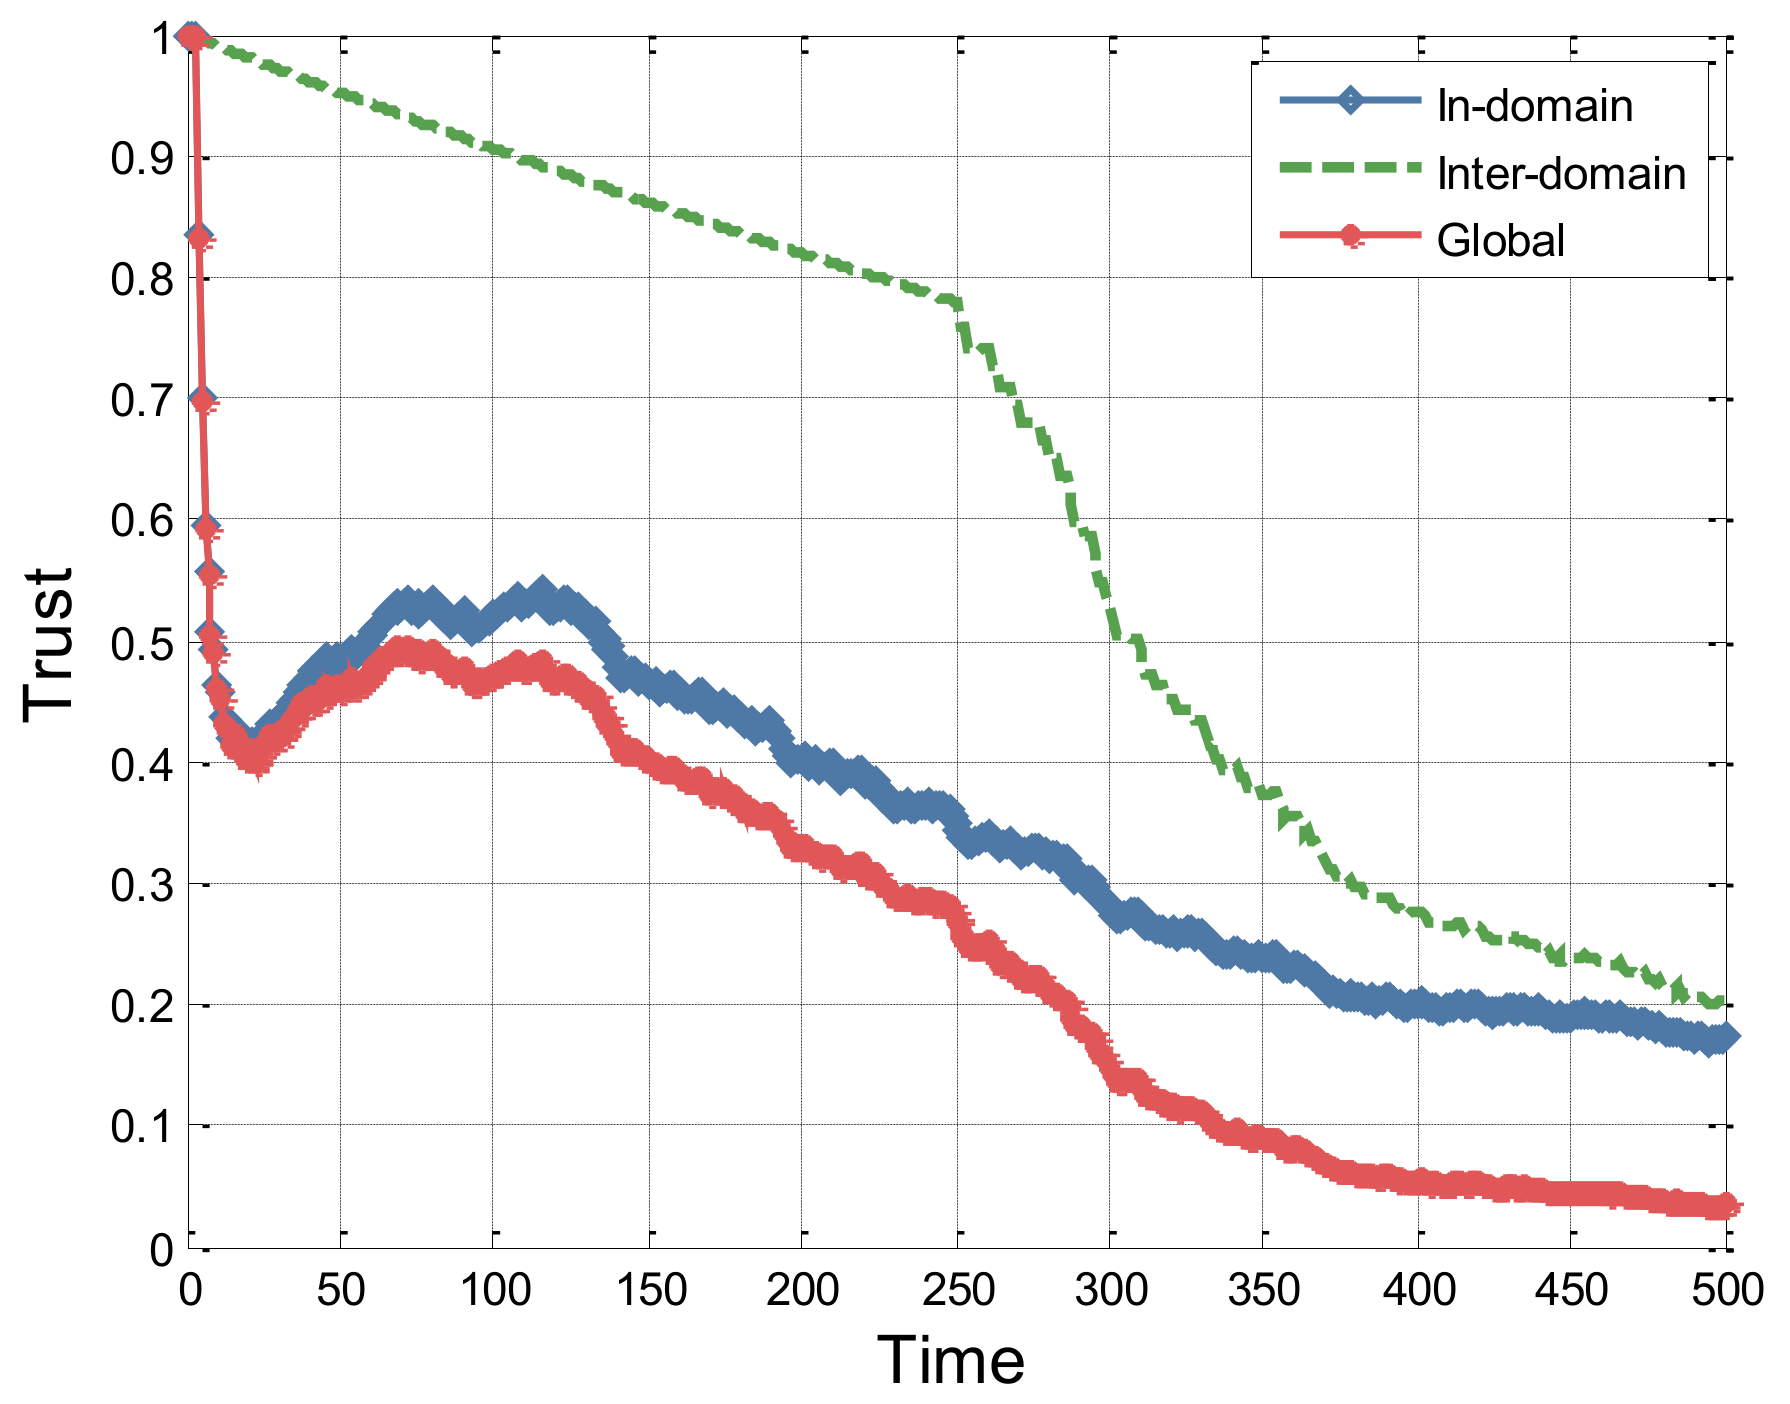
In this experiment, we assume that the initial in-domain trust is set to 1 for all systems, and the initial inter-domain trust is also set to 1. The reward coefficient as = 1, the in-domain punishment coefficient bs = 1.5, the inter-domain punishment coefficient cs = 2; α = β = 1; temporal factor λ = 0.999, and penalty δ = 0.98. The highest frequency of access requests is once per second.
6.2.1. Trust of a Subject System to Multiple Object
We assume that in the PAS domain, only AFC can raise cross-domain access request. The AFC system initiates access requests to the PIS server for the first 250 s, with 150 successes and 100 failures. From 251 to 500 s, access requests are made to the TRS in PTM domain. The changes in the in-domain trust and global trust of AFC system, as well as inter-domain trust between PAS and PTM over time, are shown in
Figure 7.
Figure 7 illustrates the trust value curve of the AFC system under random success and failure conditions. The experimental results show that the entity’s trust value increases with the count of successful accesses and decreases with the count of failures. Additionally, under the influence of the penalty factor, the overall trend of the curve is downward. In the first 250 s, because there are no inter-domain access requests, the inter-domain trust decays over time due to the temporal factor. Therefore, the difference between the in-domain trust value of the AFC system and the global trust is relatively small. However, in the subsequent 250 s, as cross-domain interactions occur, the inter-domain trust fluctuates greatly, resulting in a gradual widening of the gap between the in-domain trust value and the global trust value.
Figure 8 shows the change in DITKG over time, where the relation “access_data” and trust-related relationships are in orange and red, respectively. For the ease of observation, only relationships in connection with the last interaction happened at the specific moment is visible. For example, AFC accesses the terminal data of PIS at
t = 100 s and
t = 200 s, so the graphs in (a) and (b) have the same structure with different transient attributes. In this scenario, graphs in (c) and (b) are completely unlike.
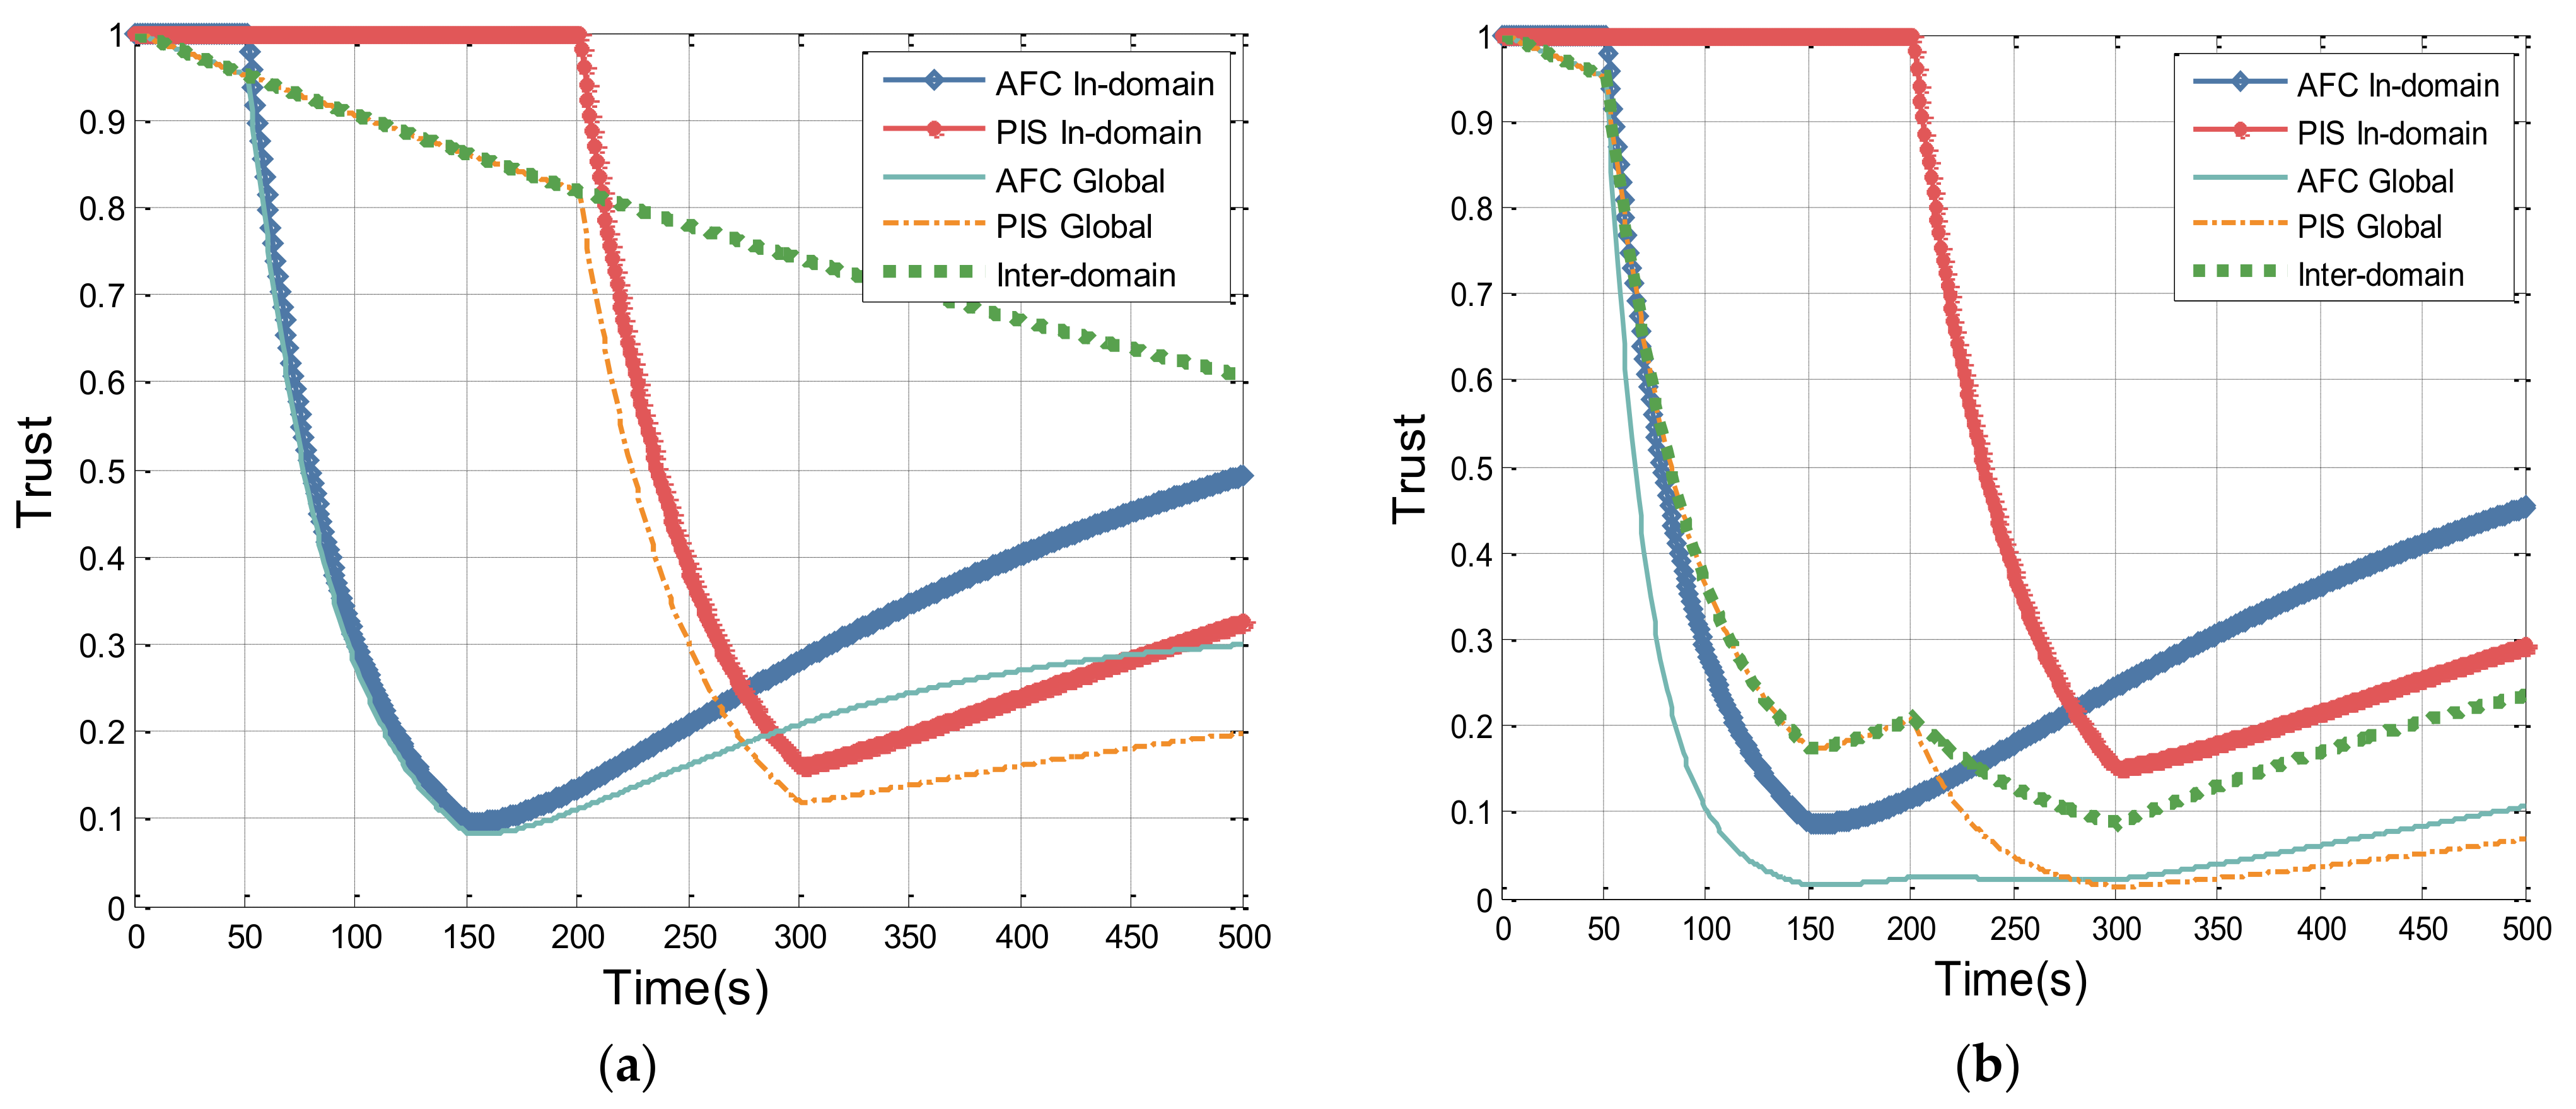
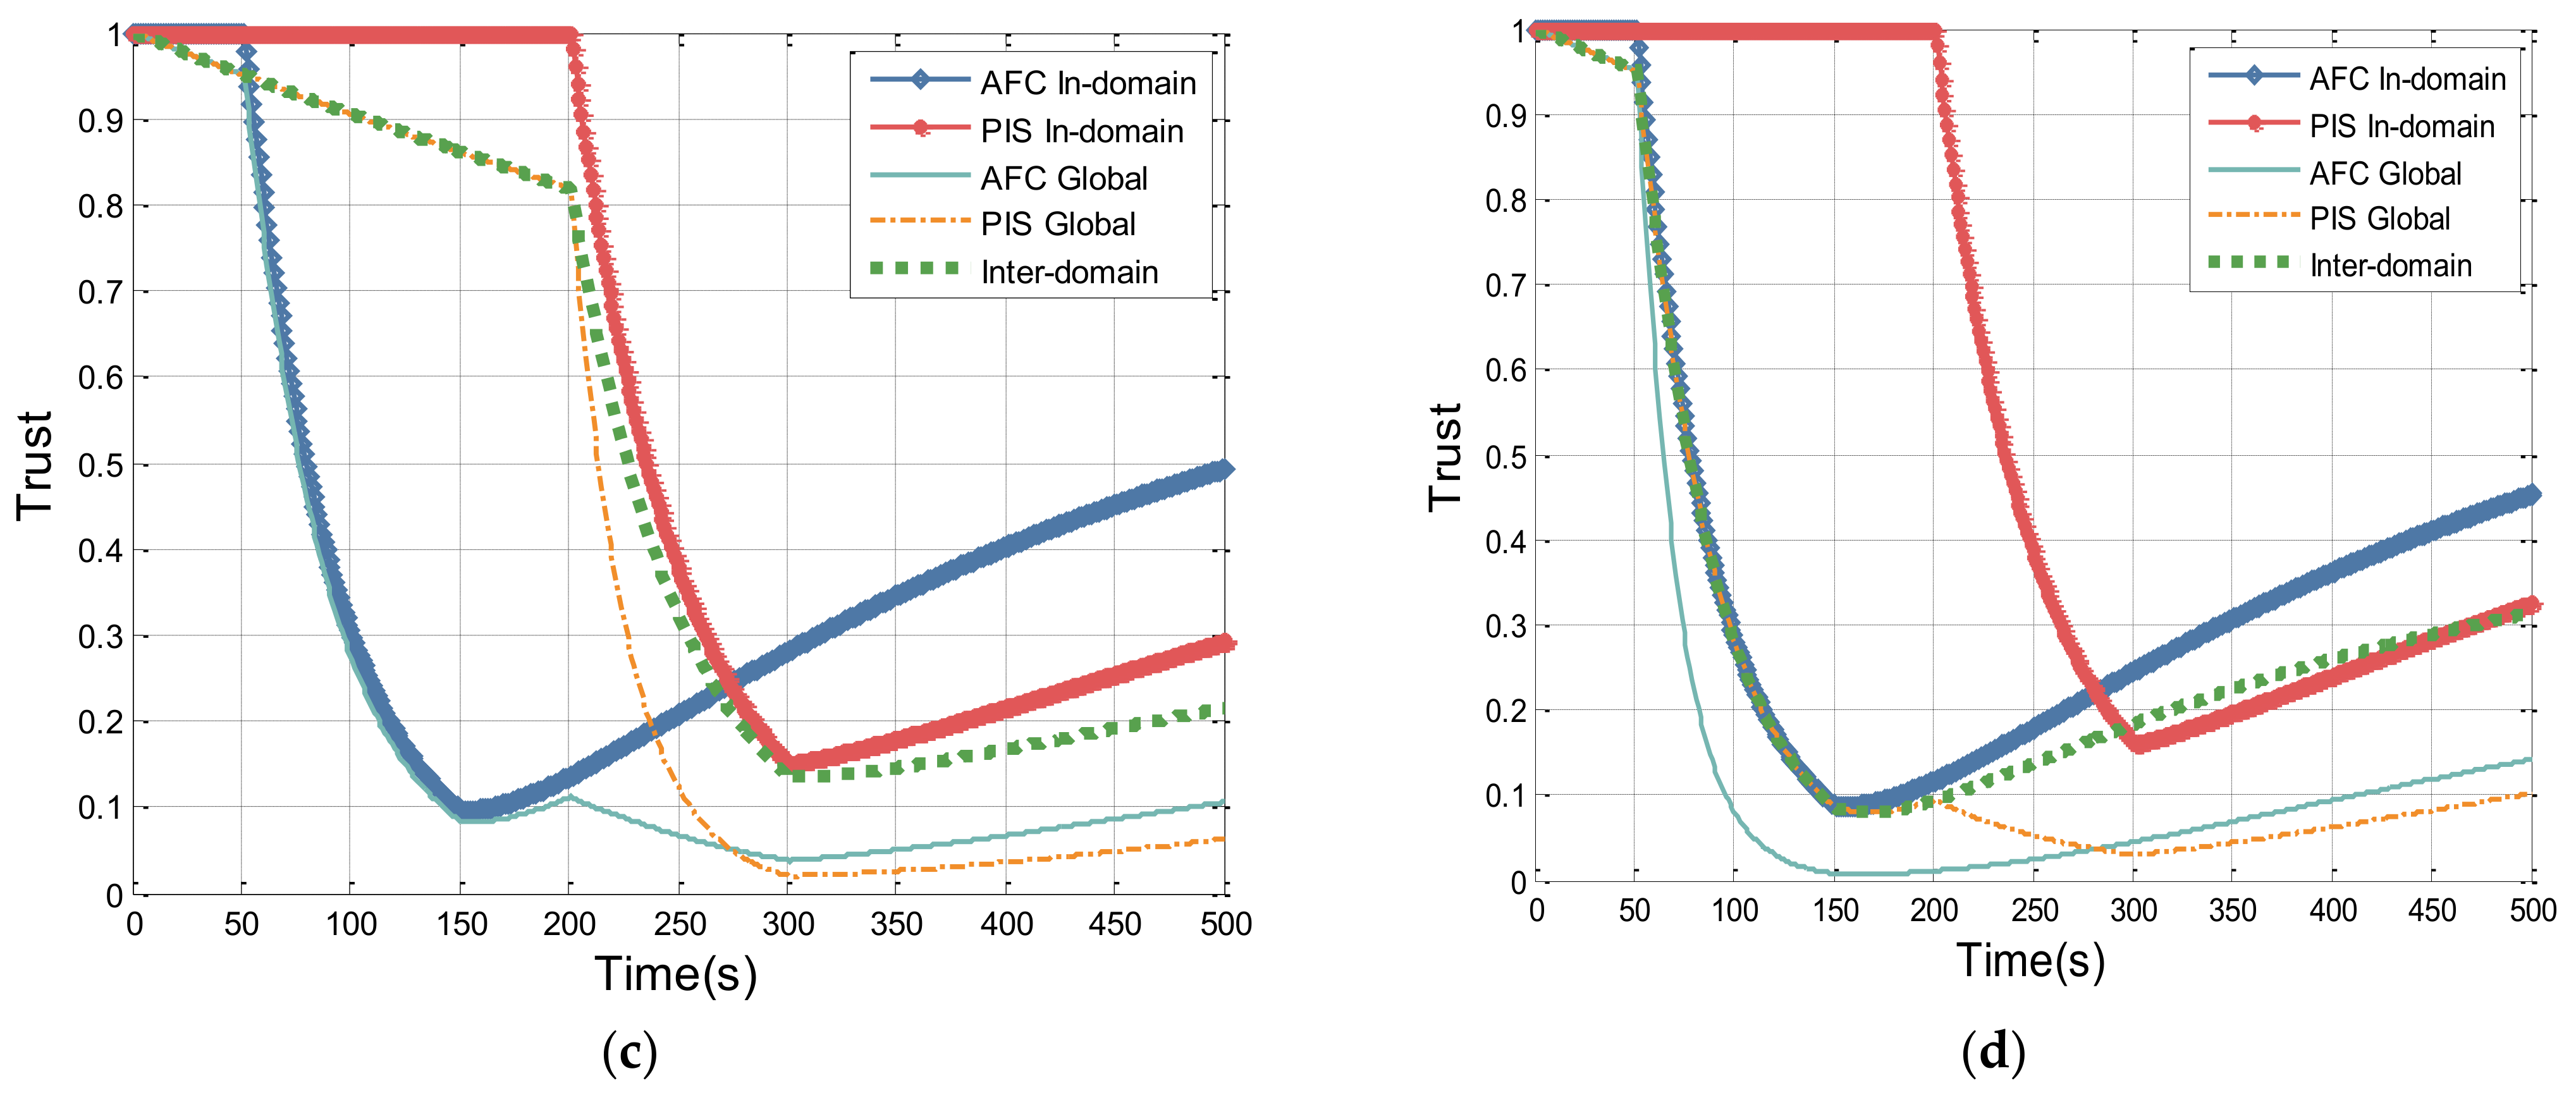
6.2.2. Mutual Effect of Multiple In-Domain Systems
To facilitate observation, the history records of access failures and successes are artificially controlled in this case. The AFC system and the PIS system both launch service access requests 500 times to a fixed object, and they may access each other or turn to the TRS in PTM domain. The AFC system fails in request 51 to 150, while the PIS system fails in 201 to 300, and other accesses are successful. The in-domain trust and global trust of both systems are shown in
Figure 9, as well as inter-domain trust from PAS to PTM.
Figure 9 illustrates the trust value changes in cases where access objects are different. Firstly, let us examine the case where no cross-domain accesses occur, as shown in (a). As the inter-domain trust value only decays over time, the only influence factor is the access result sequence. Observing the in-domain trust curves of AFC and PIS in (a), it can be seen that the lowest point of the AFC curve is lower than that of the PIS curve. This is because the records of access failures of the AFC system are relatively distant from the current moment compared to PIS, resulting in a higher proportion of access failures relative to the total number of accesses at the specific time. Additionally, at 500 s, the trust of AFC is higher than that of PIS, as the impact of access history records on the trust value of an entity increases with proximity to the current time point.
Furthermore, considering the cases where cross-domain interactions happen, when we compare the results in (d) and (c), the fluctuation trend of the inter-domain trust curve synchronizes only with the in-domain trust value of a single system, indicating it is only related to the system conducting inter-domain accesses. As shown in (b), the fluctuation trend of inter-domain trust value lies between the two in-domain trust curves, indicating its change is correlated with both systems. Therefore, different entities within the same security domain may mutually influence each other through the global trust.
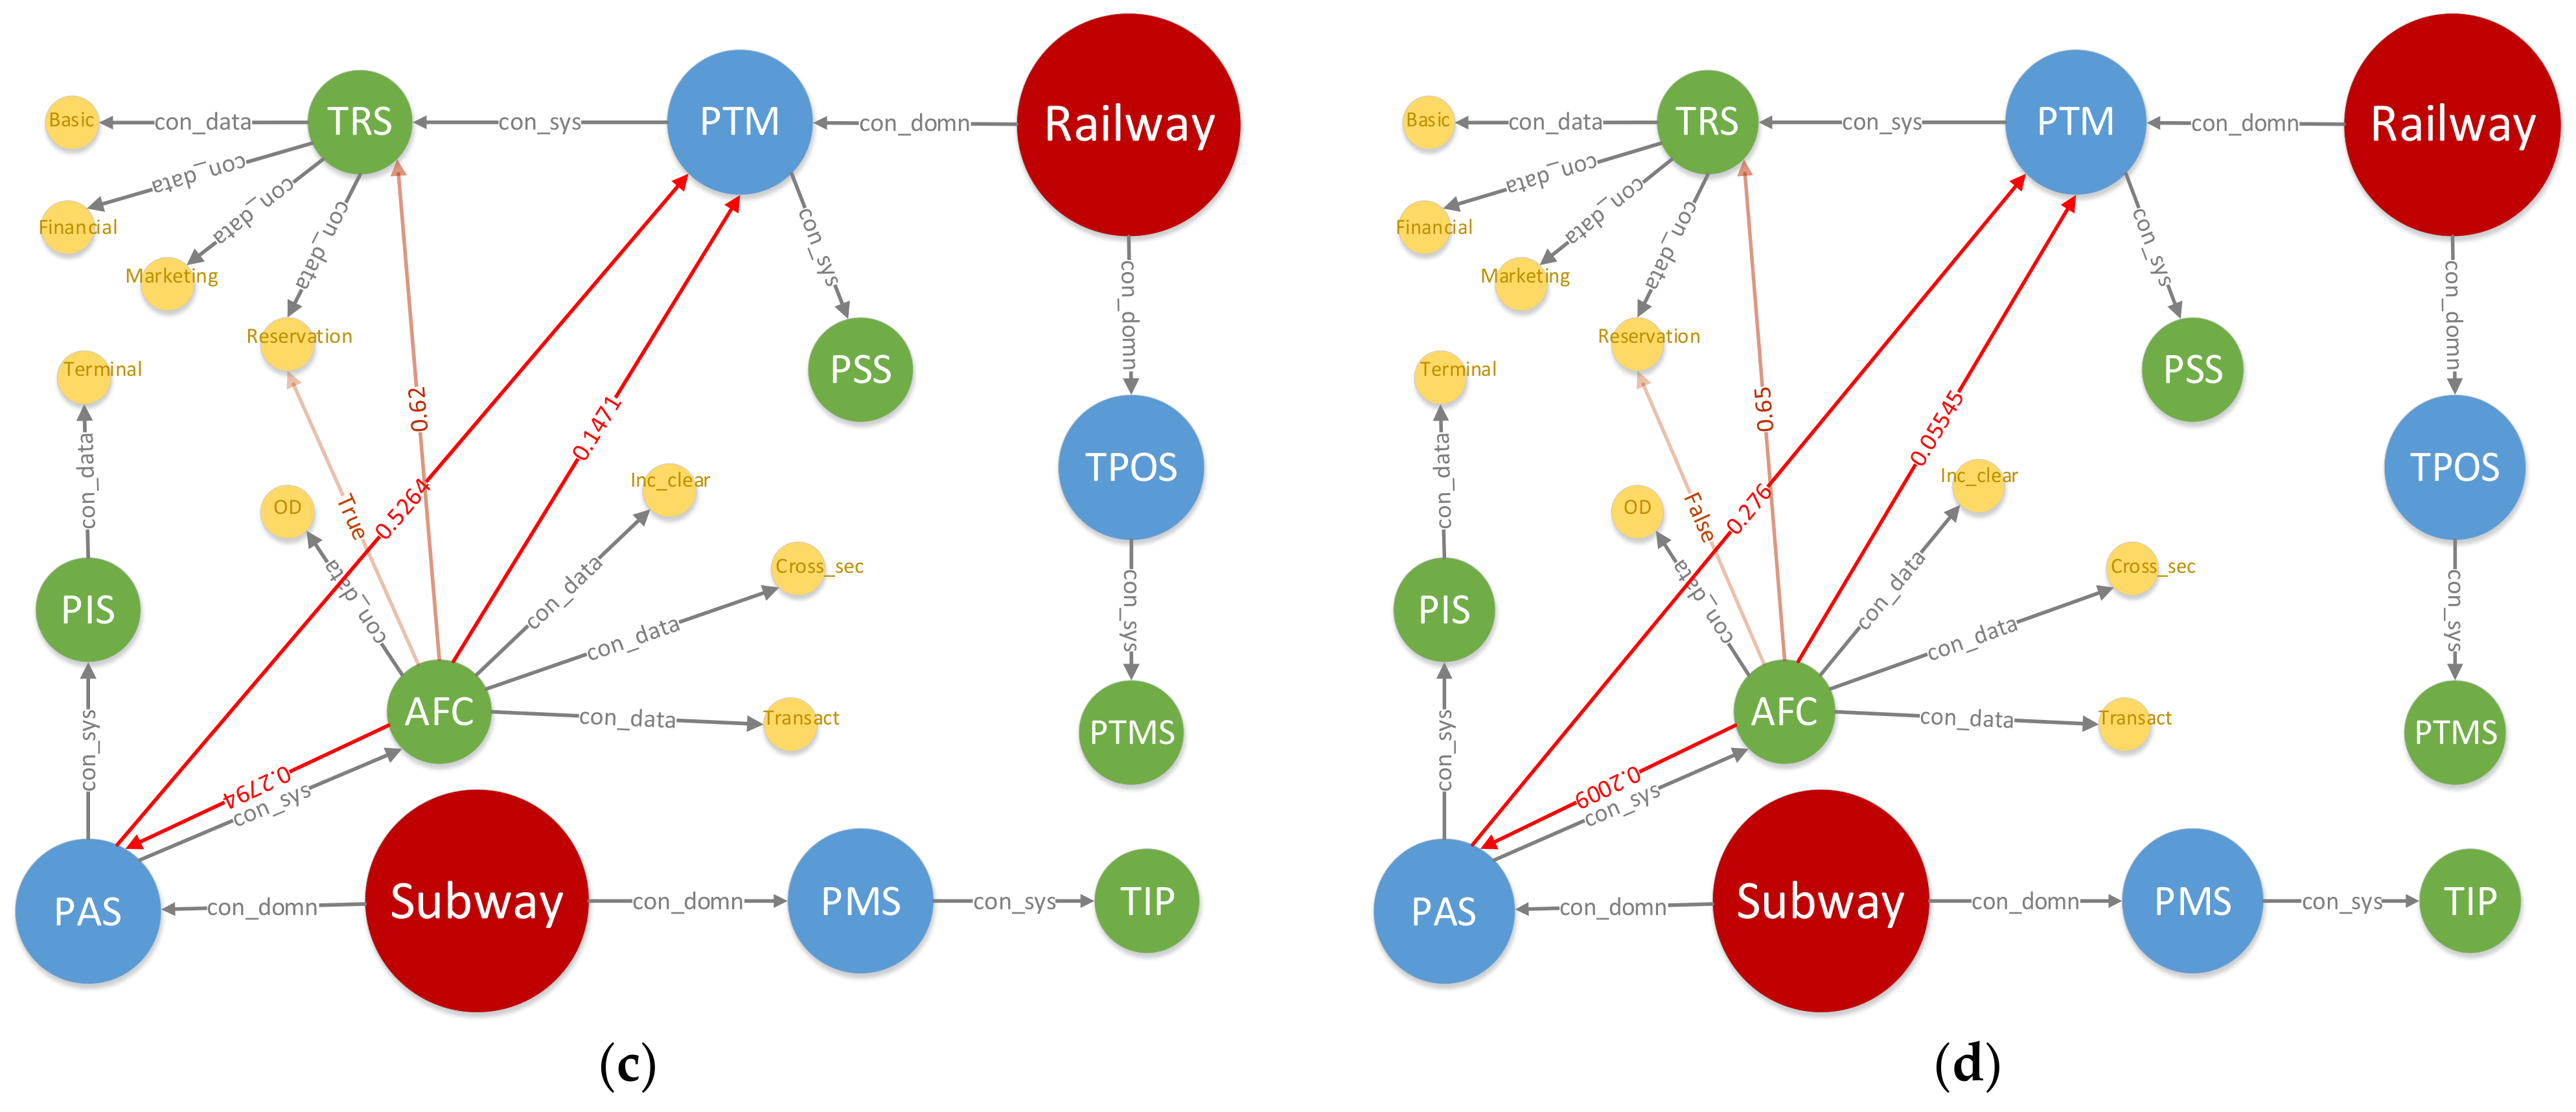
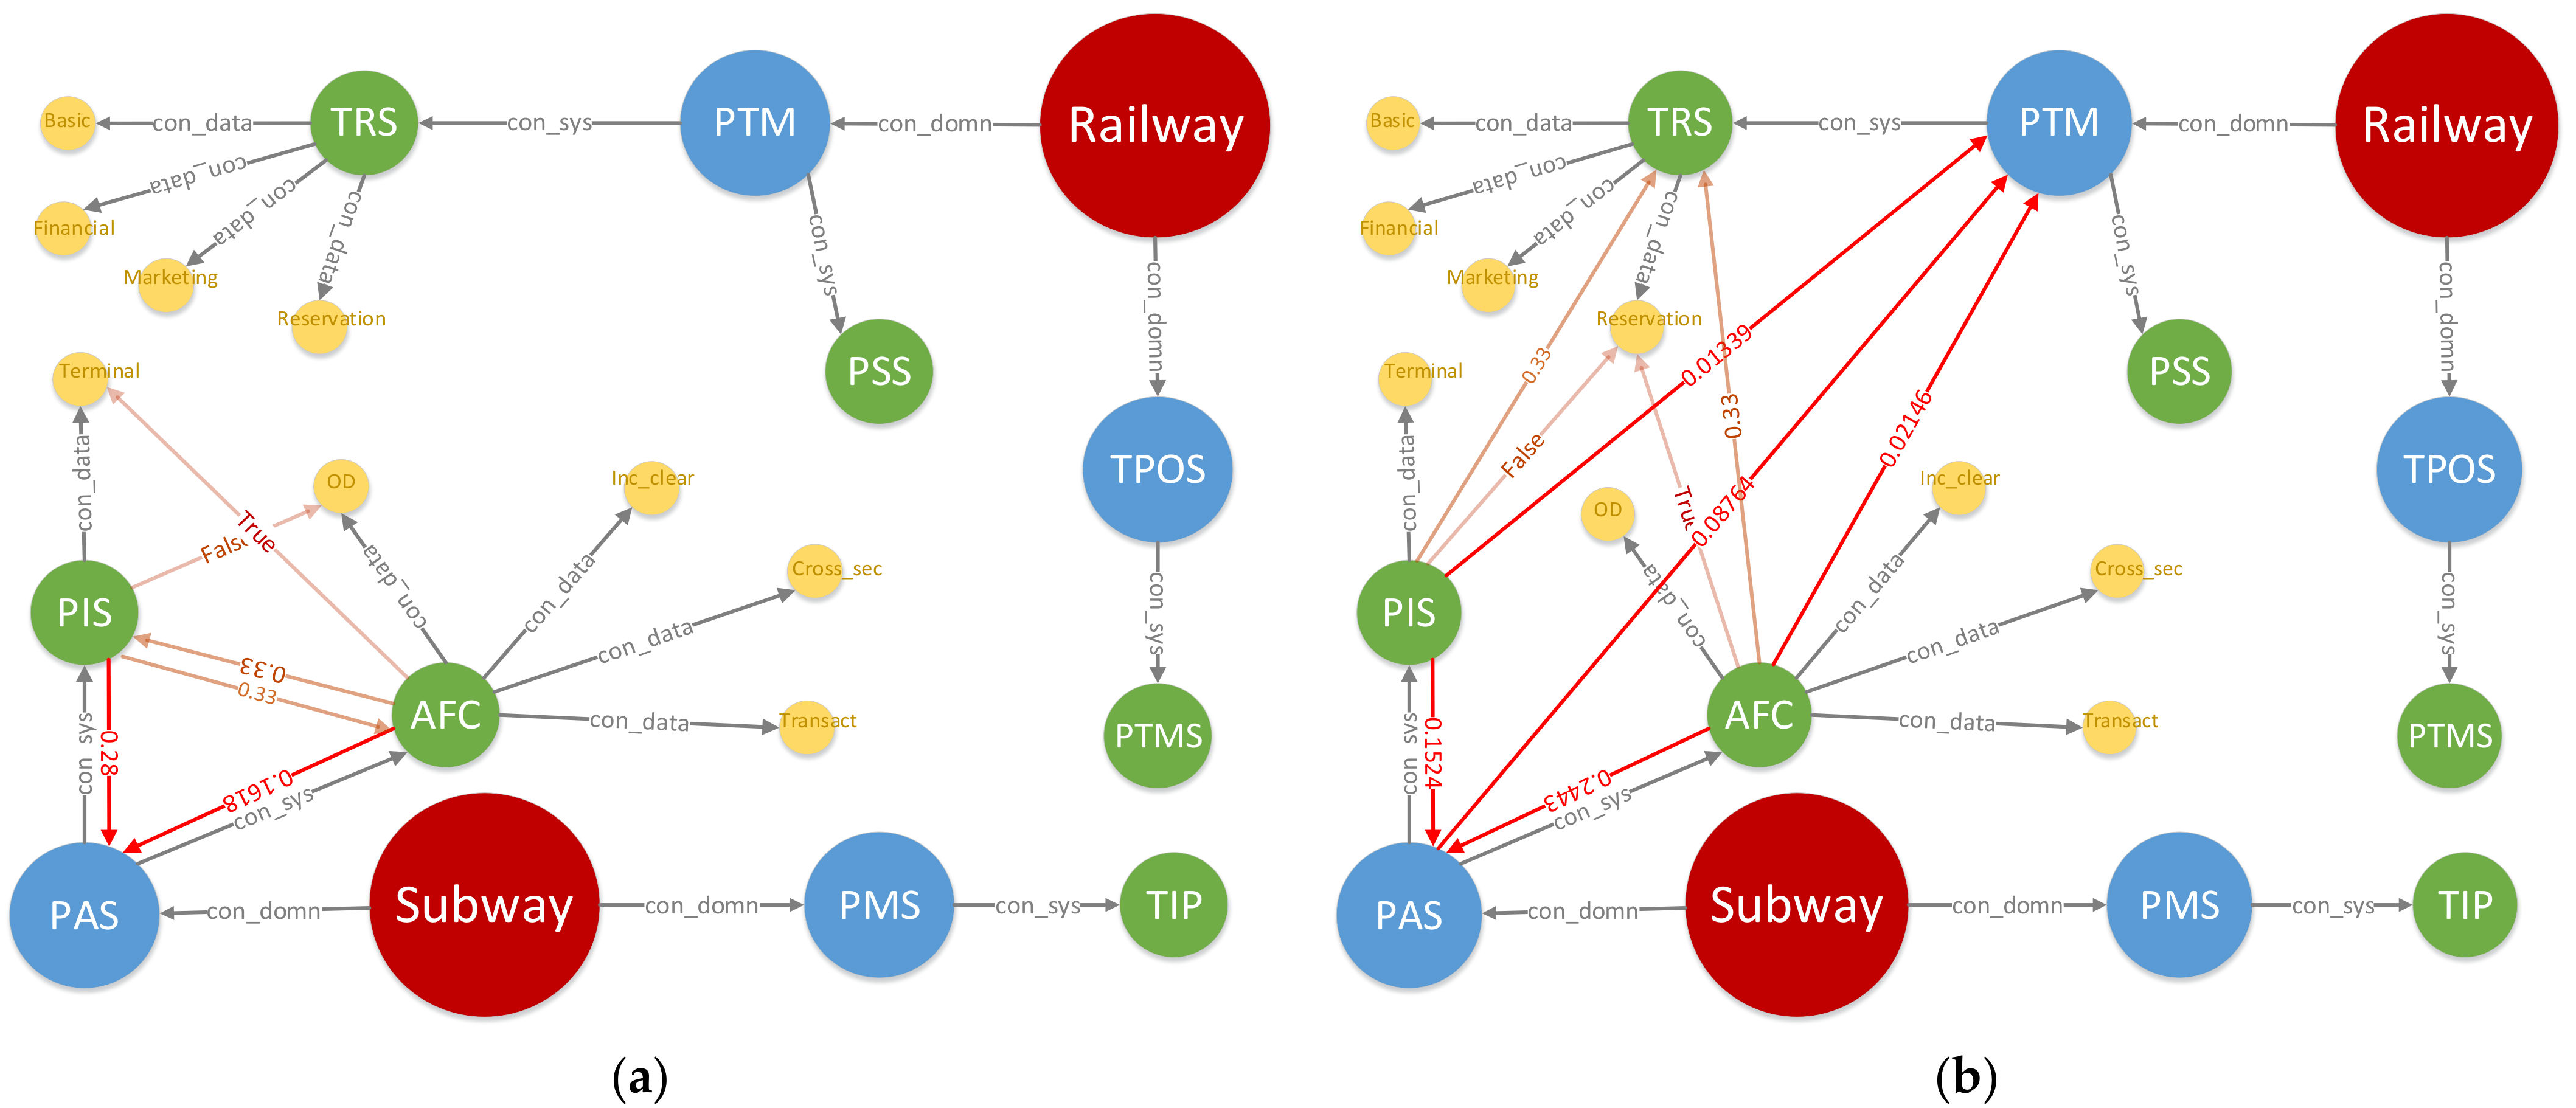
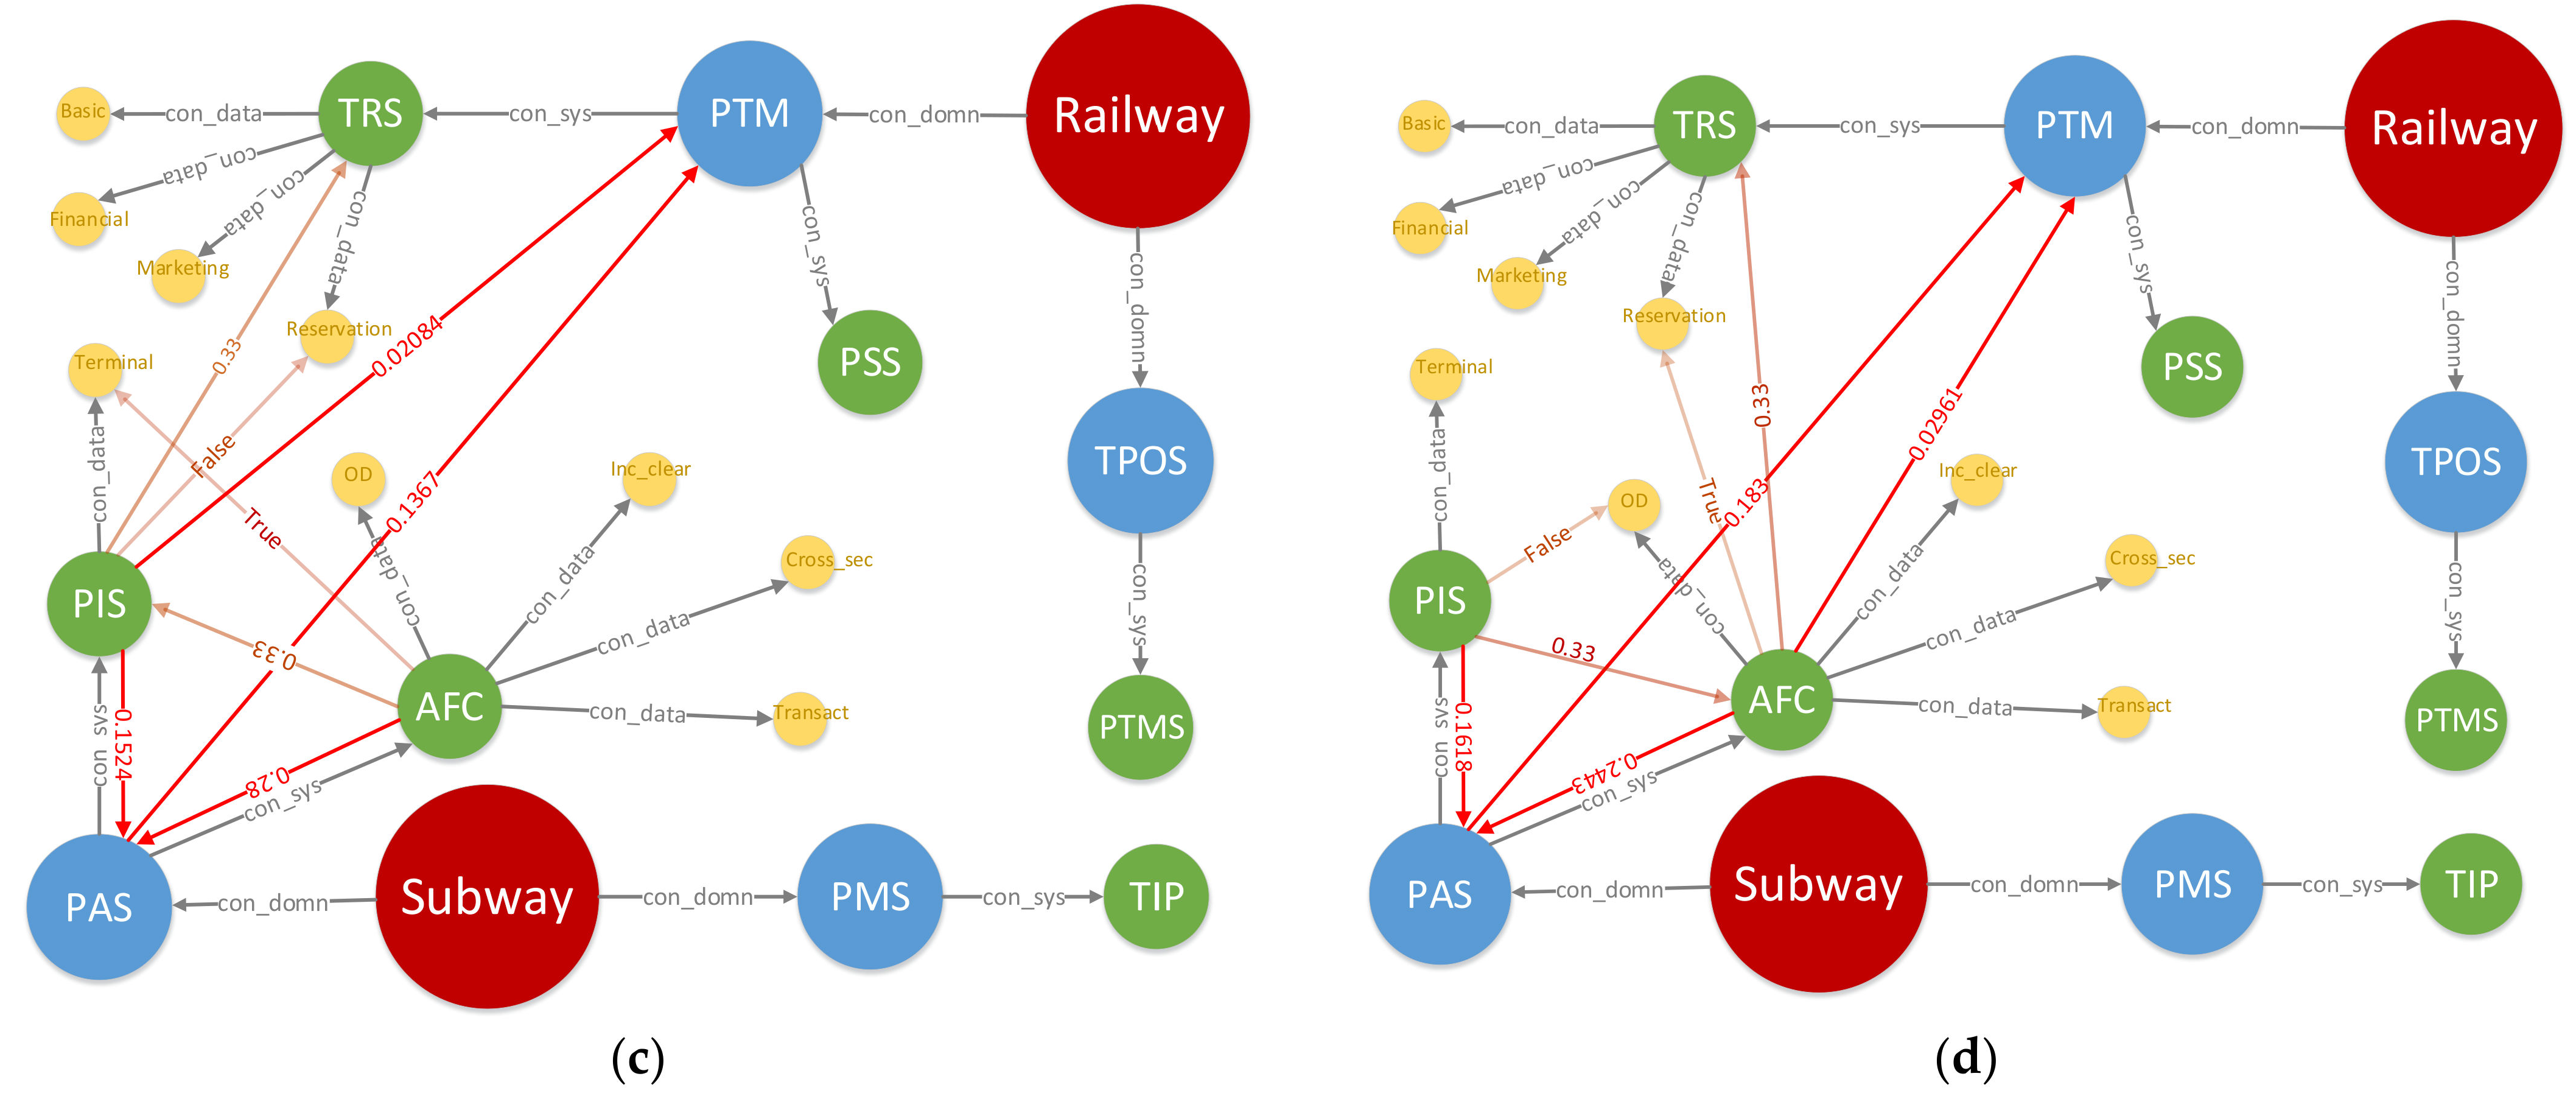
Figure 10 shows the change in DITKG in different scenarios at
t = 500 s. Due to the diversity in access objects, the four graphs are totally different in both structure and transient attribute value. Taking (b) as an example, both AFC and PIS request inter-domain accesses, thus it provides the most information about the state of the whole network. Therefore, DITKG is an effective way to reflect the time-varying characteristics of global network state of intermodal transportation.
7. Conclusions and Future Work
This paper focused on the comprehensive trustworthiness between different entities, aiming to break down the data silos and protect the interaction during the operation of intermodal transportation. According to the challenging demand of security and granularity, the hierarchical framework is put forward to evaluate the trust value of different types of the entities in the whole network, where data quality is regarded as a significant part of data trust. Furthermore, a DITKG based on a temporal knowledge graph is discussed as a visualization method of cross-domain interaction. By proving experimentation, the framework can satisfy the demand of data sharing in intermodal transportation. Next, we will validate the data exchange process with real data through the construction of a prototype system. Compared with related work, the results in
Table 7 show that this Comprehensive trust assessment framework has advantage in data quality evaluation, hierarchical structure, dynamic updating and visualization. Therefore, the comprehensive trust assessment framework can better meet the data supervision demand of intermodal transportation.
As for future work, there are two aspects in sight. In the short-term, we intend to delve into network security methods and explore how to integrate appropriate secure communication strategies into our framework. This can not only enhance the security of our framework but also improve efficiency; thus, our research can better meet the needs of practical applications while ensuring data security. For our long-term plan, we will take a broader view of the intermodal transport and carry out multidisciplinary research topics, such as urban planning, environmental considerations, human behavior and larger socio-economic issues.


