Article

Error Analysis of Common Power Meter Installation Faults on Three-Phase Networks

by
Gennady Senderovych
1,
Polina Scherbakova
2 and
Alexander Abramovitz
3,*
1
Department of Automation and Cybersecurity of Power Systems, National Technical University, 61000 Kharkiv, Ukraine
2
Faculty of Electrical Engineering, Holon Institute of Technology, 52 Golomb St., Holon 5810201, Israel
3
School of Physical Electronics, Faculty of Engineering, Tel-Aviv University, Ramat-Gan 69978, Israel
*
Author to whom correspondence should be addressed.
Electronics 2024, 13(8), 1501; https://doi.org/10.3390/electronics13081501
Submission received: 29 February 2024 / Revised: 5 April 2024 / Accepted: 9 April 2024 / Published: 15 April 2024

Abstract

:
The article is concerned with the operation of electric power quality meters and analyzers when incorrectly installed on a three-phase electrical network. An analytical study of the meter’s errors under the conditions of faulty installation was carried out. All possible types of installation errors are considered according to the proposed classification, as well as possible combinations of a pair of installation faults simultaneously. Classification of installation faults is also proposed. Matrix expressions are derived that allow modeling of any type of installation faults to quantify power and symmetry measurement errors. The proposed method allows to obtain quantitative signs that can identify a specific installation fault. The results of this study can help the development of an algorithm for the automatic detection of installation faults and their correction. The analytical results were confirmed by simulation studies on a three-phase network model in the MATLAB/SIMULINK environment. Experimental results, obtained from a commercial power quality analyzer operated under controlled laboratory conditions, are also reported.

1. Introduction

Inefficiencies in power systems may have many causes and are always a matter of concern for utilities. A common case of inefficiency is the commercial loss inflicted by improper installation of power metering equipment.
A faulty installation of a power meter, either malicious [1] or unintentional [2], entails an invalid data acquisition, inaccurate assessment of consumed energy, and, as a result, erroneous customer billing. Furthermore, the assessment of the customer’s compliance with the power quality (PQ) standards is also in error [3]. Consequently, the customers cannot be held liable for PQ violations. Moreover, the faulty installation can also render useless the recently developed methods for determining the location of sources of harmonic distortion [4].
According to the existing regulations and standards [5,6,7], as well as the manufacturer’s recommendations, various power meters have to be periodically inspected and recalibrated. But since such service is performed quite rarely, possibly once in about 10 years, the faulty installed meter may run for years before it gets checked. During this time, the installation fault can significantly skew the meter’s reading and so inflict substantial economic losses to either the customer or the utilities [8].
Experimental studies [9] evaluated the impact of certain installation faults on the readings of a power metering device. According to their findings, the estimated billing loss was in the millions of dollars. Meter installation faults may have the direst consequences and, thus, call for a proper solution.
Electricity theft is another acute issue that utilities face regularly. Fraud mechanisms such as unauthorized tapping into electricity lines, bypassing the smart meter, or implanting different kinds of chips inside a smart meter to slow down its readings were identified in [10], which also proposed the application of a neural network to identify theft. However, no attention was given to the possibility of an intentionally incorrect meter installation. Reliable data acquisition is paramount to the correct operation of the equipment and fair billing [11]. Thus, the importance of the proper connection of the device terminals [12].
Utilities’ Technical Losses (TL) and Non-Technical Losses (NTL) are frequently discussed in the literature. Because of the high proportion of electricity thefts in the total amount of NTL, [13] suggested identifying violators using Power Line Communication (PLC). In [14], a Hamming code-based algorithm was developed to detect and fend off attacks on a smart meter. A procedure that may be used to detect pilferers in a low-voltage network equipped with an Advanced Metering Infrastructure (AMI) with a check meter was suggested by [15]. The development of an adapted ammeter for fraud detection in low-voltage installations was also proposed in [16]. Analysis of the currently existing methods of finding theft was further discussed in [17].
The sooner a fault or a fraud is detected the lesser the damages. Hence, fault detection immediately upon the installation of the meter is strongly desired. However, the utilities face a serious challenge in identifying the problem meter [18]. Inspecting the installed meter, assessing its particular fault conditions [19], and taking the correct measures to rectify it is the prerogative of a highly trained professional. Such may not always be present on the location and has to be assigned to the task later. This requires additional time and resources.
The development of remotely operating software systems capable of detecting faulty meter phasing can become an alternative to manual inspection of meter installation. Such programs can identify the wrong phase connection based on the analysis of the network. A spectral clustering approach for validating and correcting customer electrical phase labels in existing utility models using the voltage time series produced by AMI equipment was proposed by [20]. Whereas [21] suggests an algorithm aimed at detecting and correcting connectivity errors in the GIS representation of the distribution network topology. Sensitivity analysis of distribution system state estimation (DSSE) for phase mislabeling of single-phase service transformers was produced in [22]. It is advisable, though, to apply these methods as a backup option, relying primarily on an automatic self-check run by the metering device upon its installation and setup.
Several affordable power meters that can provide both energy metering and power quality analysis functions [23,24,25,26] were developed and are readily available on the market. However, currently, some of the available power meters and PQ analyzers can only provide a graphical output of the current and voltage ratios, while many others do not include such features at all. There is no automatic polarity assessment so the operator has to track the direction of the power flow on the indicator, analyze the situation, and verify the meter’s installation [23]. There is also no capacity for treating a combination of faults.
This article aims to develop a mathematical basis for creating a formalized algorithm for the automatic detection of an installation fault occurrence and the type of the fault. The article discusses the impact of the installation faults on power metering equipment on three-phase electrical networks. The paper suggests a classification of meter installation faults. Then, an analytical study of several commonly found practice fault types, as well as their combined effect, is conducted to assess the errors in measured power and symmetry. The proposed method produces quantitative indications that imply interconnection (installation) faults. The proposed fault analysis method relies on well-known concepts of theoretical electrical engineering and is distinguished by a general theoretical approach. To the knowledge of the authors, a similar approach was not yet reported in the literature. Neither one can find technical propositions that allow for automatic verification meter’s phasing and polarity with grounded neutral line.
The article proposes a classification of installation faults upon initial meter installation. Then, an analytical study of all types of connection errors is carried out according to the proposed classification.
To carry out the analysis, the article derives matrix expressions that allow modeling any type of installation faults to assess the errors in power and symmetry measurements. The mathematical model used is quite simple, which made it possible to consider also all possible combinations of two types of installation faults.
The proposed method makes it possible to obtain quantitative features that determine specific installation errors. The list of signs for single and paired errors is summarized in Tables 1 and 2.
The proposed theory was first verified by simulation in the MATLAB/SIMULINK environment. Then, a hardware test bed was constructed that allowed the acquisition of experimental data under controlled laboratory conditions to further support the proposed theoretical derivations. The results are also reported.
It is worth noting that the proposed method is oriented toward practical implementation. Prospective smart metering devices can be programmed to take advantage of the proposed theory and apply it for a self-check of the correctness of the installation.
This article is organized as follows. Section 2 defines meter installation faults and suggests their classification. Next, a mathematical model is developed for analytical studies of the meter’s errors under fault conditions. In Section 3, the model is applied to derive power and symmetry errors of a meter under specific fault conditions. Section 4 presents the simulation results to verify the obtained analytical results. Experimental results are given in Section 5. Finally, the summary and conclusions of the paper are stated.

2. Preliminary Considerations

Consider a three-phase electric meter installed on a three-phase four-wire network, which is often used to supply consumers and which is also the most obvious case for the illustration and definition of various installation faults.
The correct installation setup of a power meter on a three-phase four-wire network is shown in Figure 1. Here A, B, C are the terminals of the three-phase source, while V A ; V B ; V C represent the phase voltage probes of the power meter and I A ; I B ; I C represent the phase current probes of the power meter. The three-phase load is connected to the a, b, c, and neutral terminals.
The network determines the true three-phase reference frame, whereas the power meter operates (calculates) respective to its internal reference frame. Correct measurement results can only be obtained when these two reference frames coincide as shown in Figure 1.
In practice, an installation fault may occur due to a mismatched connection of the measuring transformers or, in their absence, the phase conductors at the input terminals of the metering device.
As a result of the installation fault, two related but different three-phase reference frames come into effect. The discrepancy between the voltage and current readings in the real and meter reference systems is the cause of a measuring error, henceforth, defined as the meter’s installation error.
Several possible faults and their combinations are possible. In the following, the faults are systematized considering their effect on the metering device and its readings.
The presence of two interconnected three-phase systems of vectors (voltages and currents) at the input terminals allows for a large set of possible errors and their combinations. In the following, the errors are classified according to their influence on the meter’s reading.
The installation faults can be classified into the following categories:
(1)
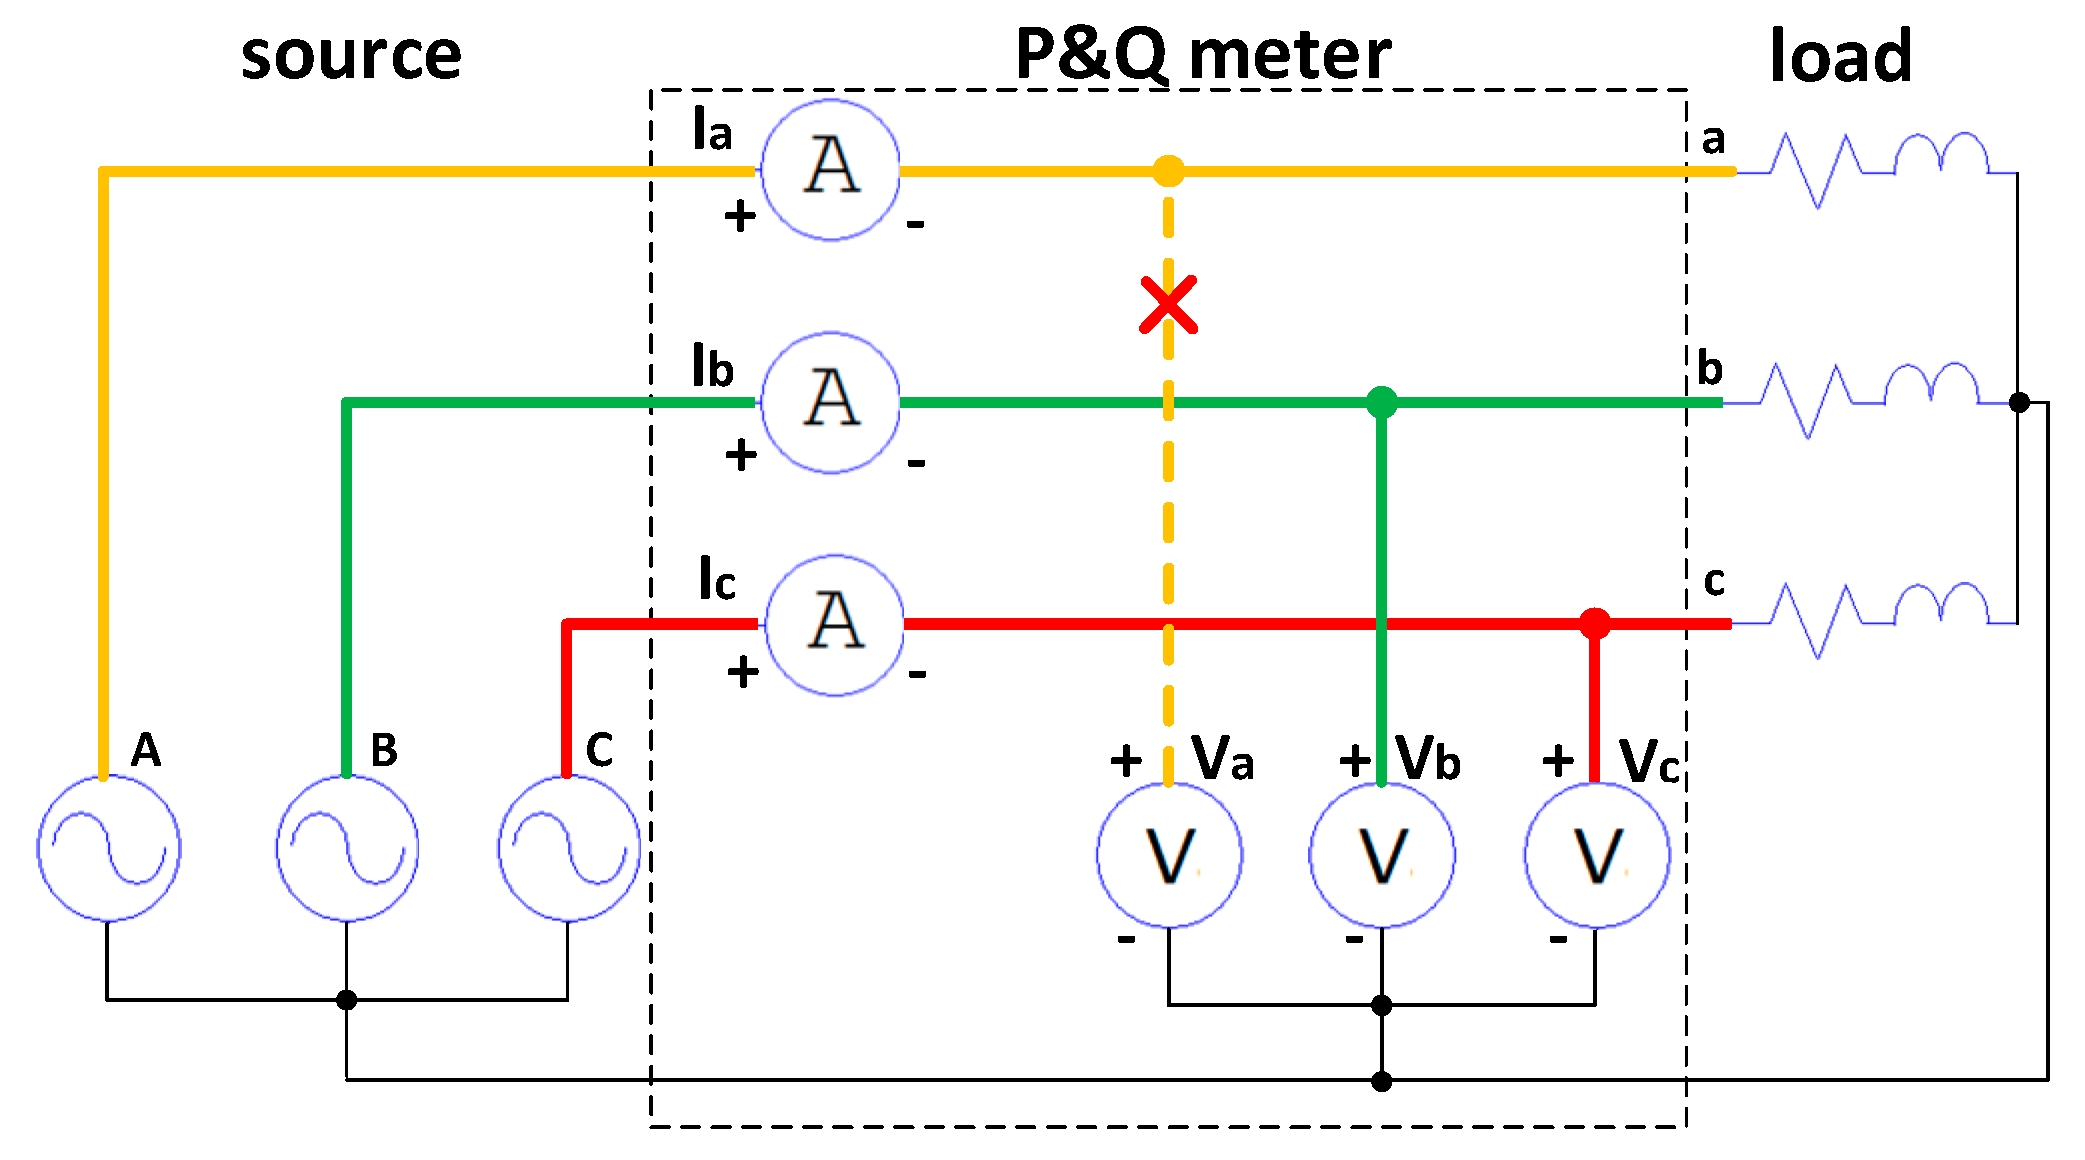
Discontinuity Faults (DF) appear in the absence of voltage or current signals at the meter’s input terminals (either one or two phases).
(2)
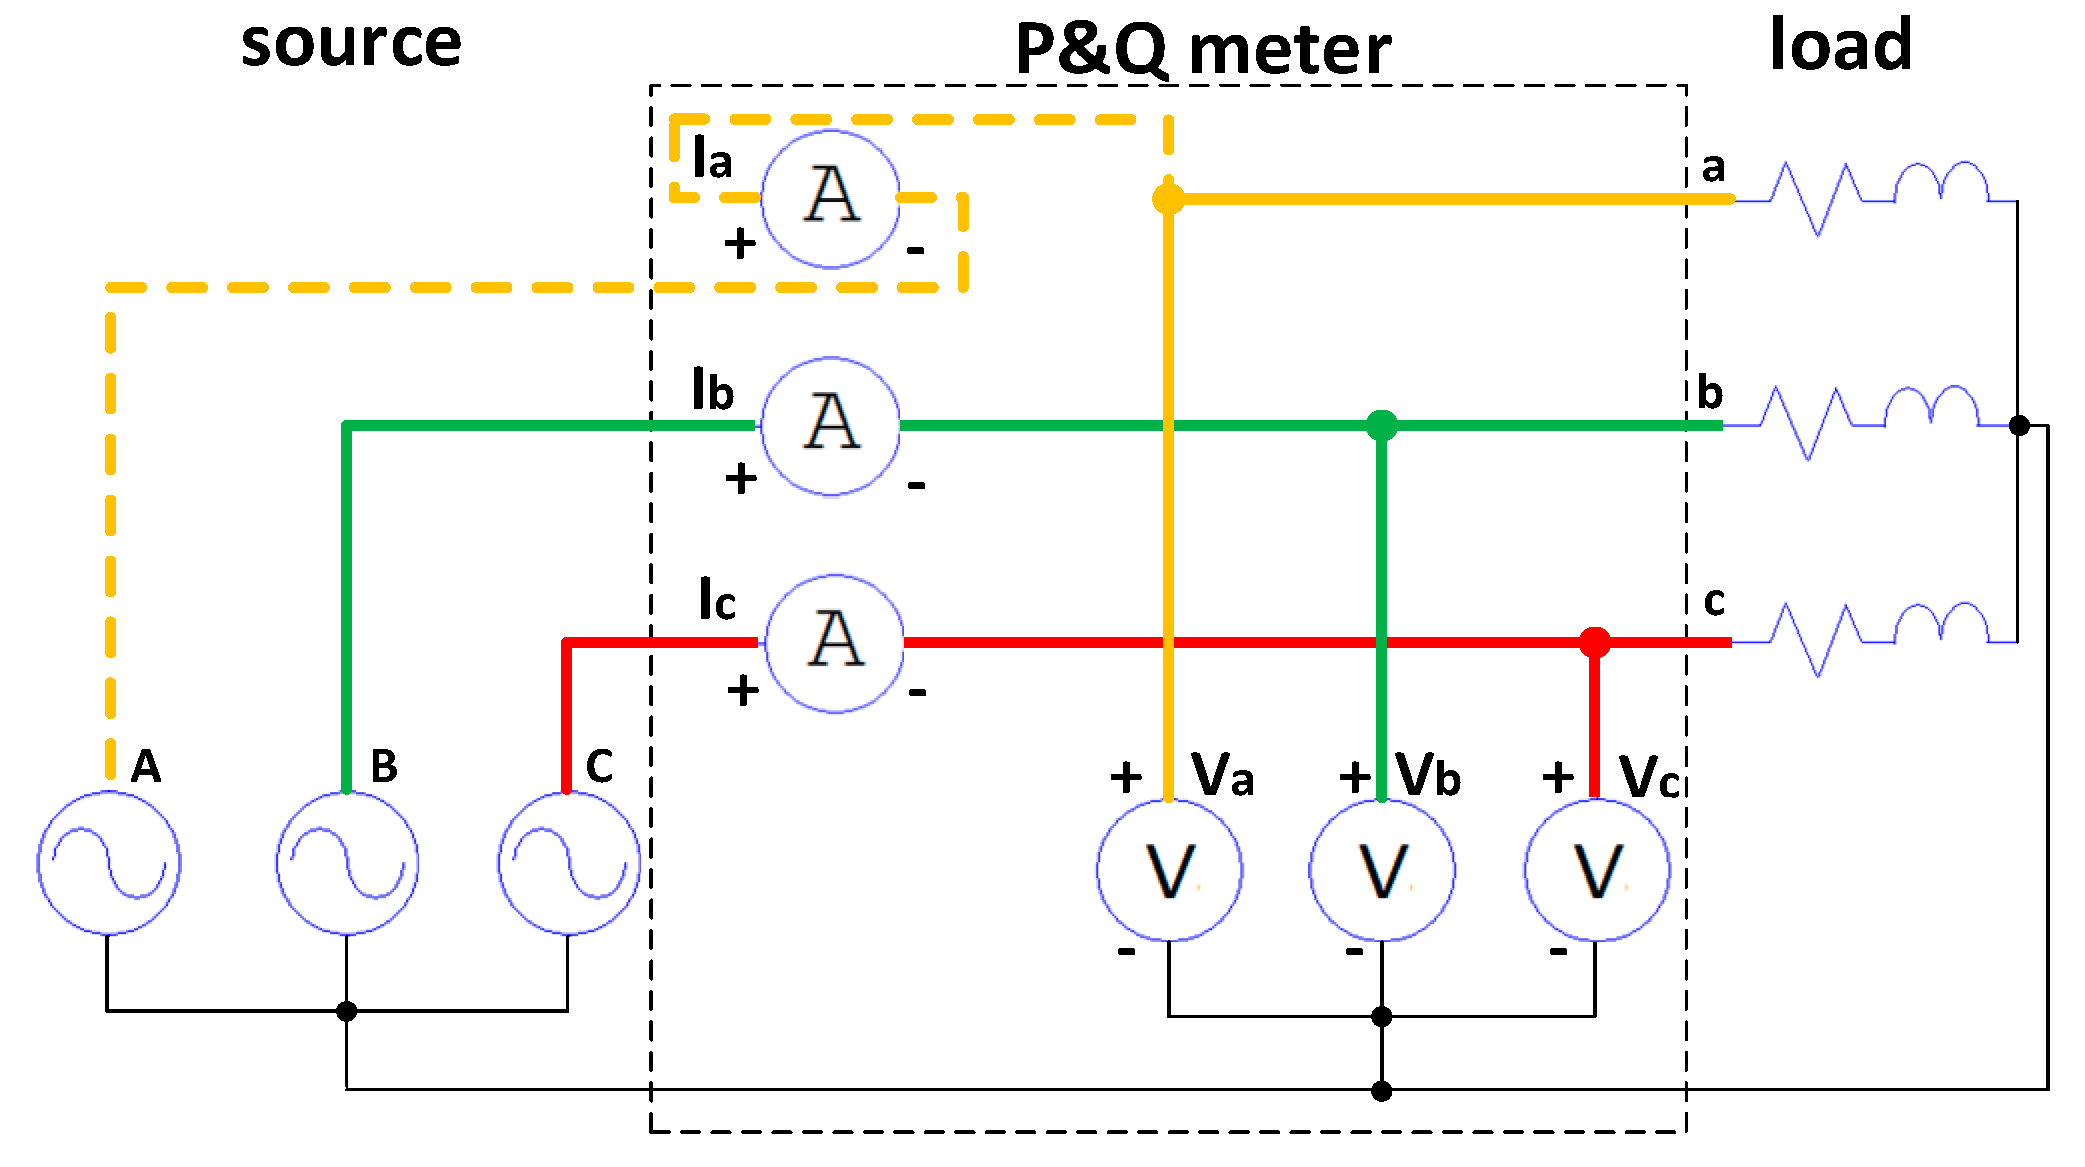
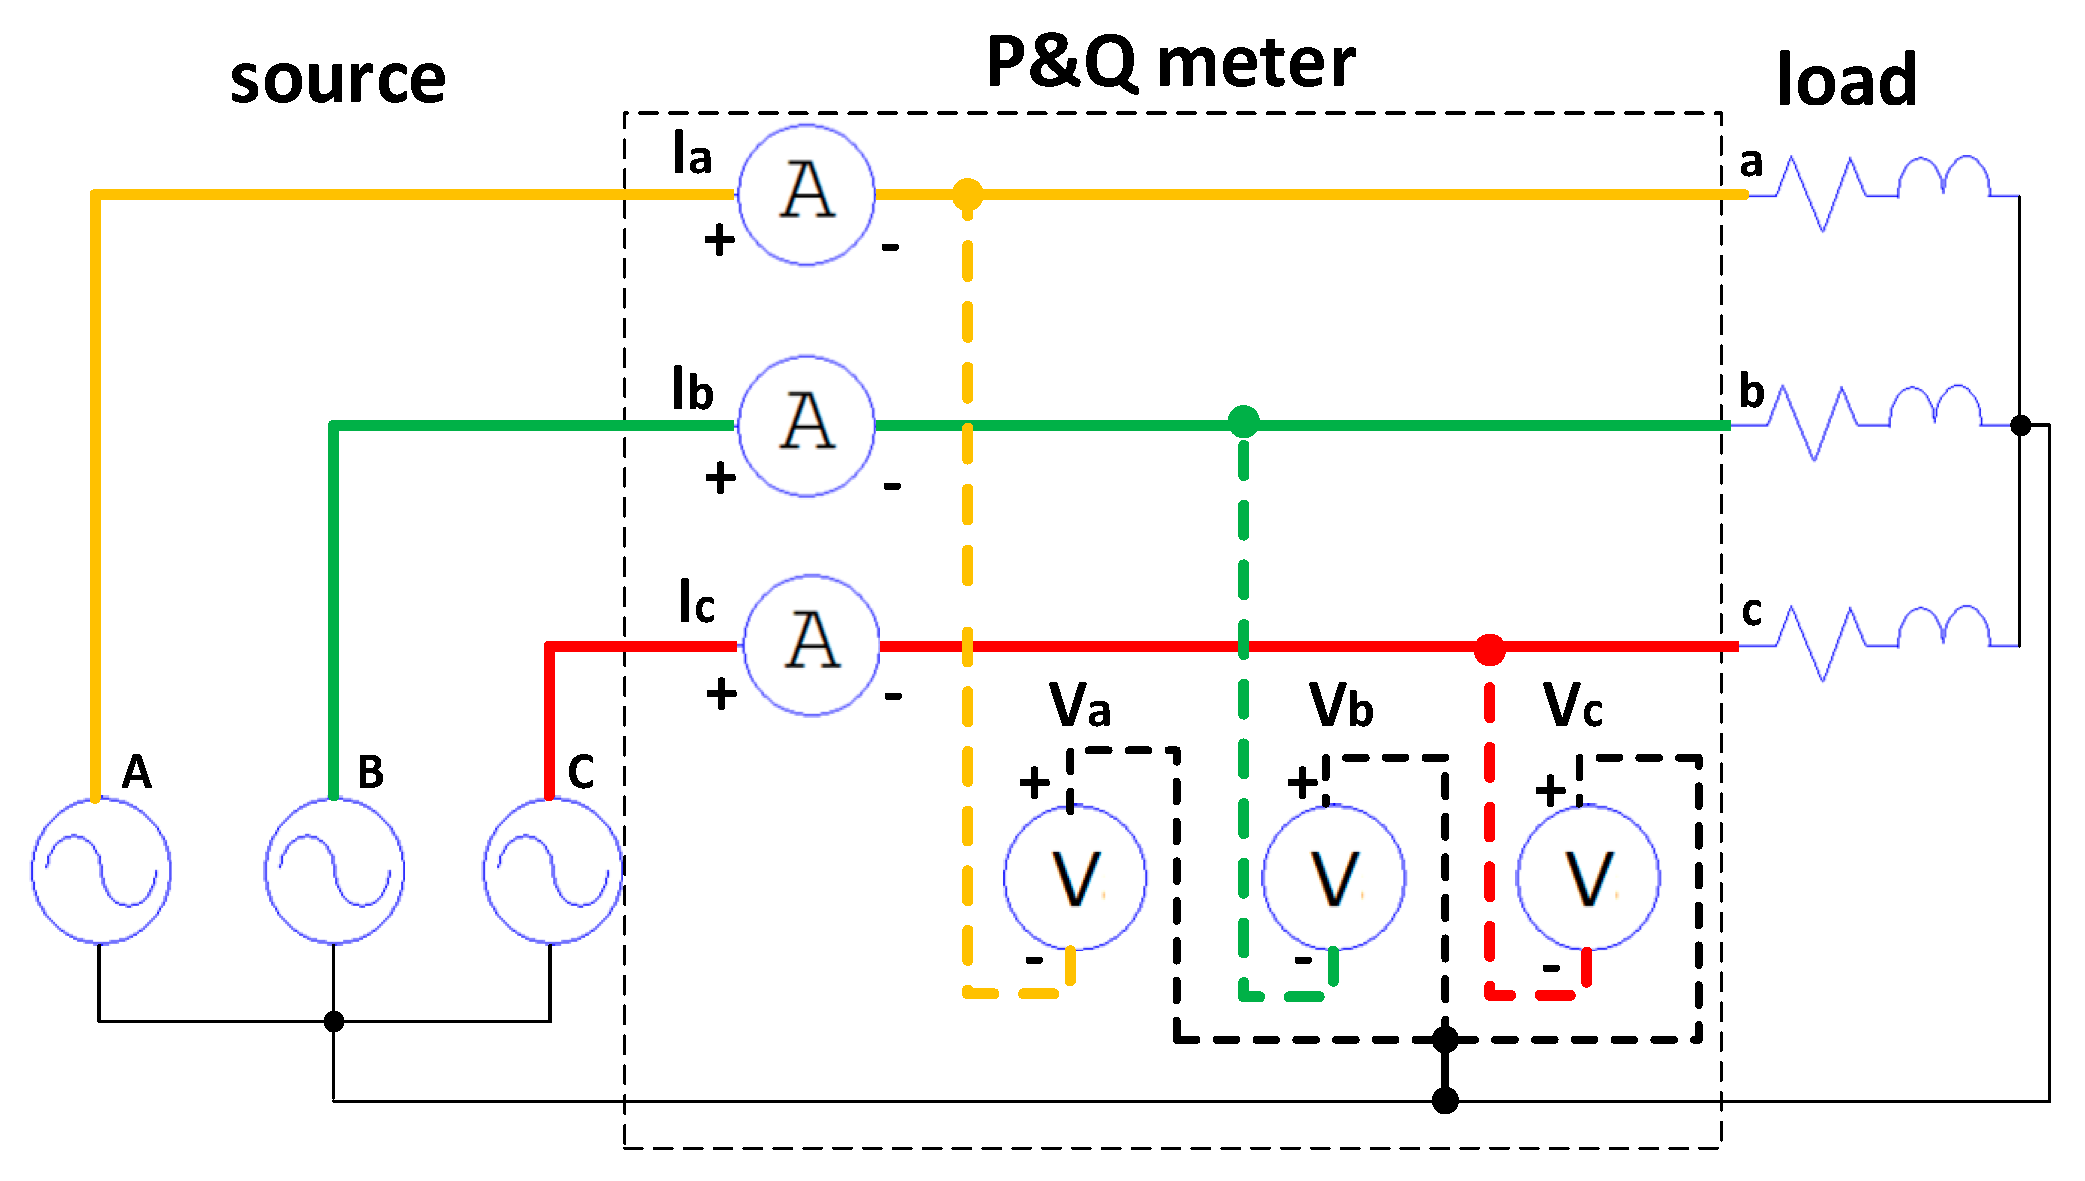
Polarity Faults (PF) appear in case the signal polarity (voltage or current) at the meter’s input terminals is reversed with respect to that of the network.
(3)
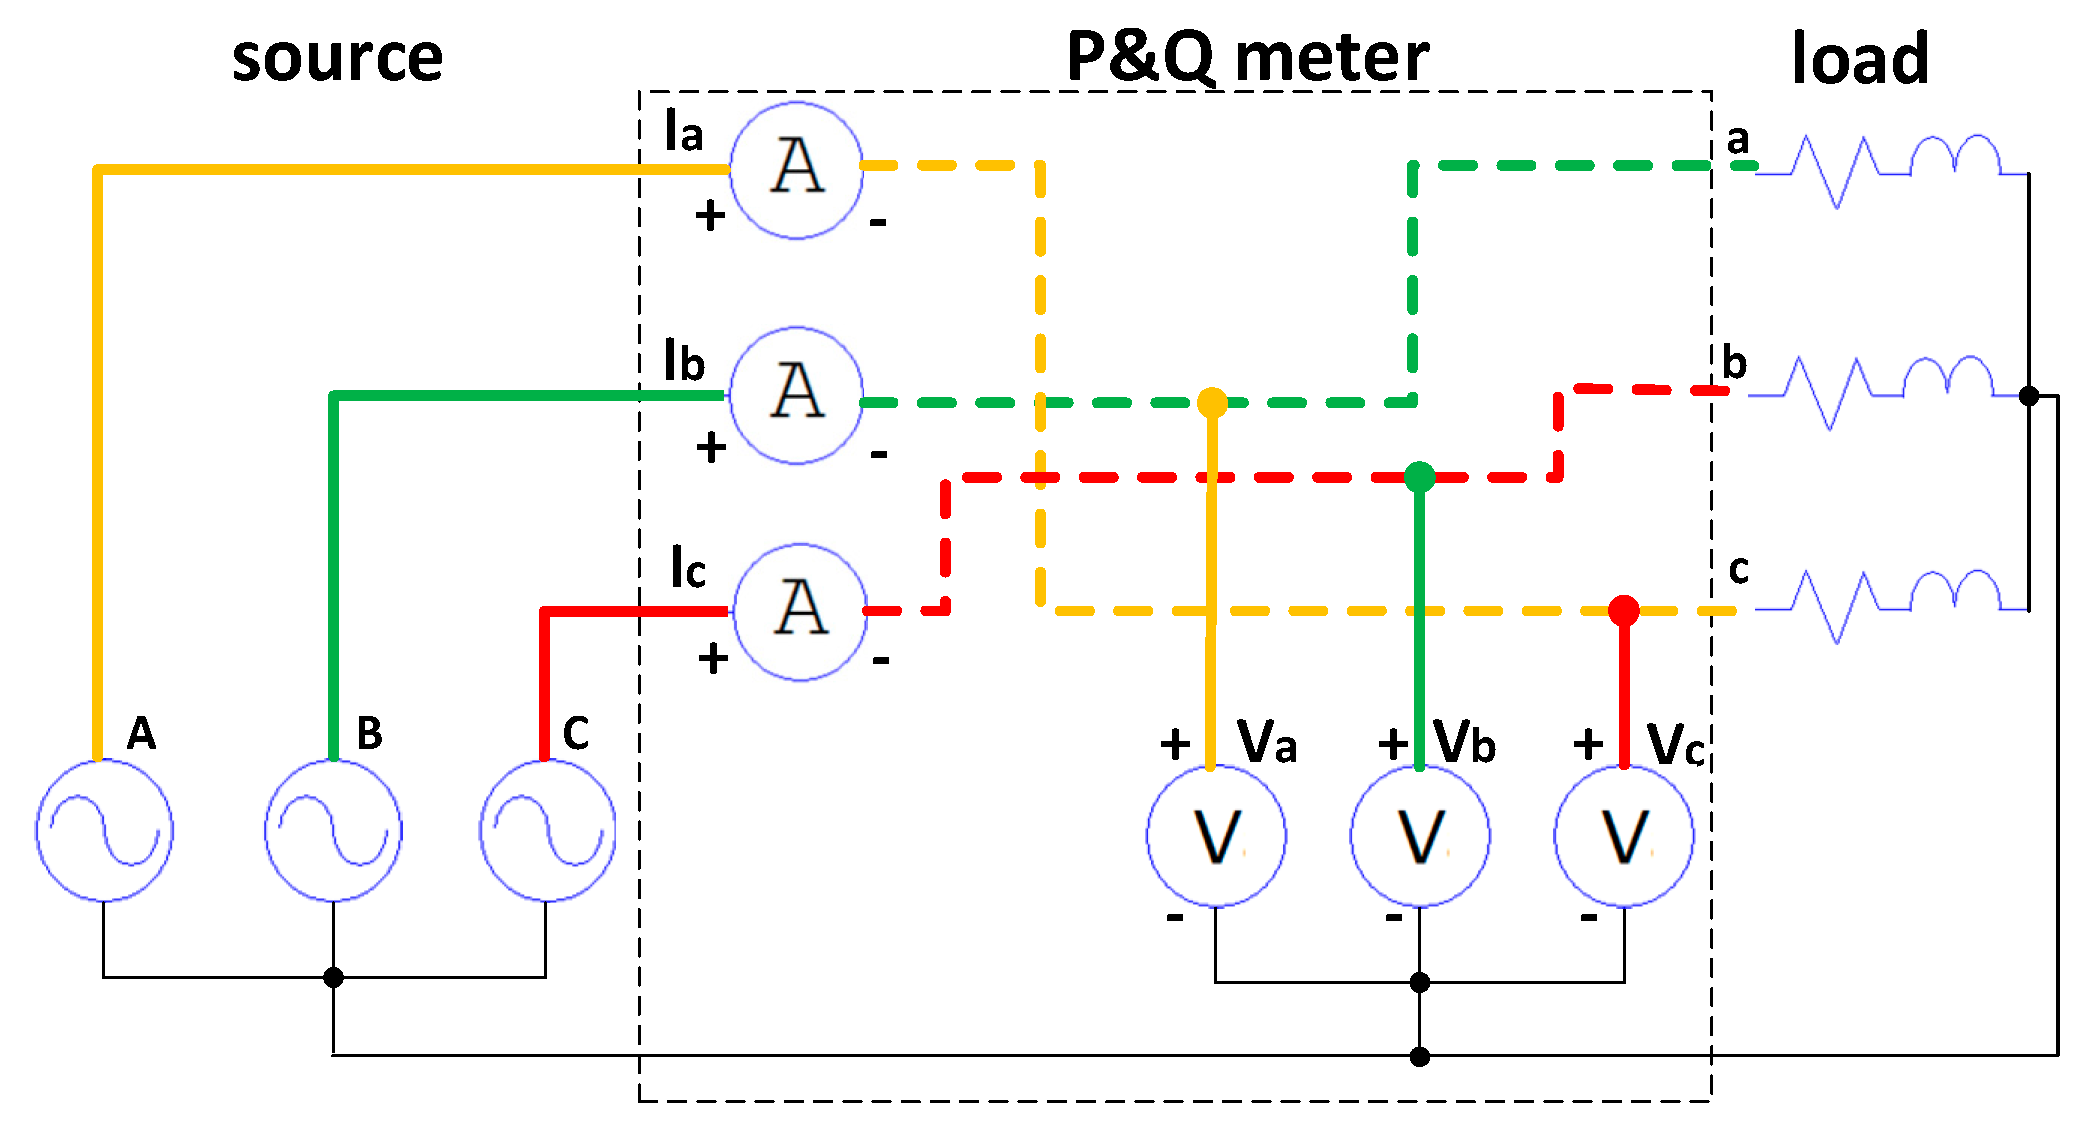
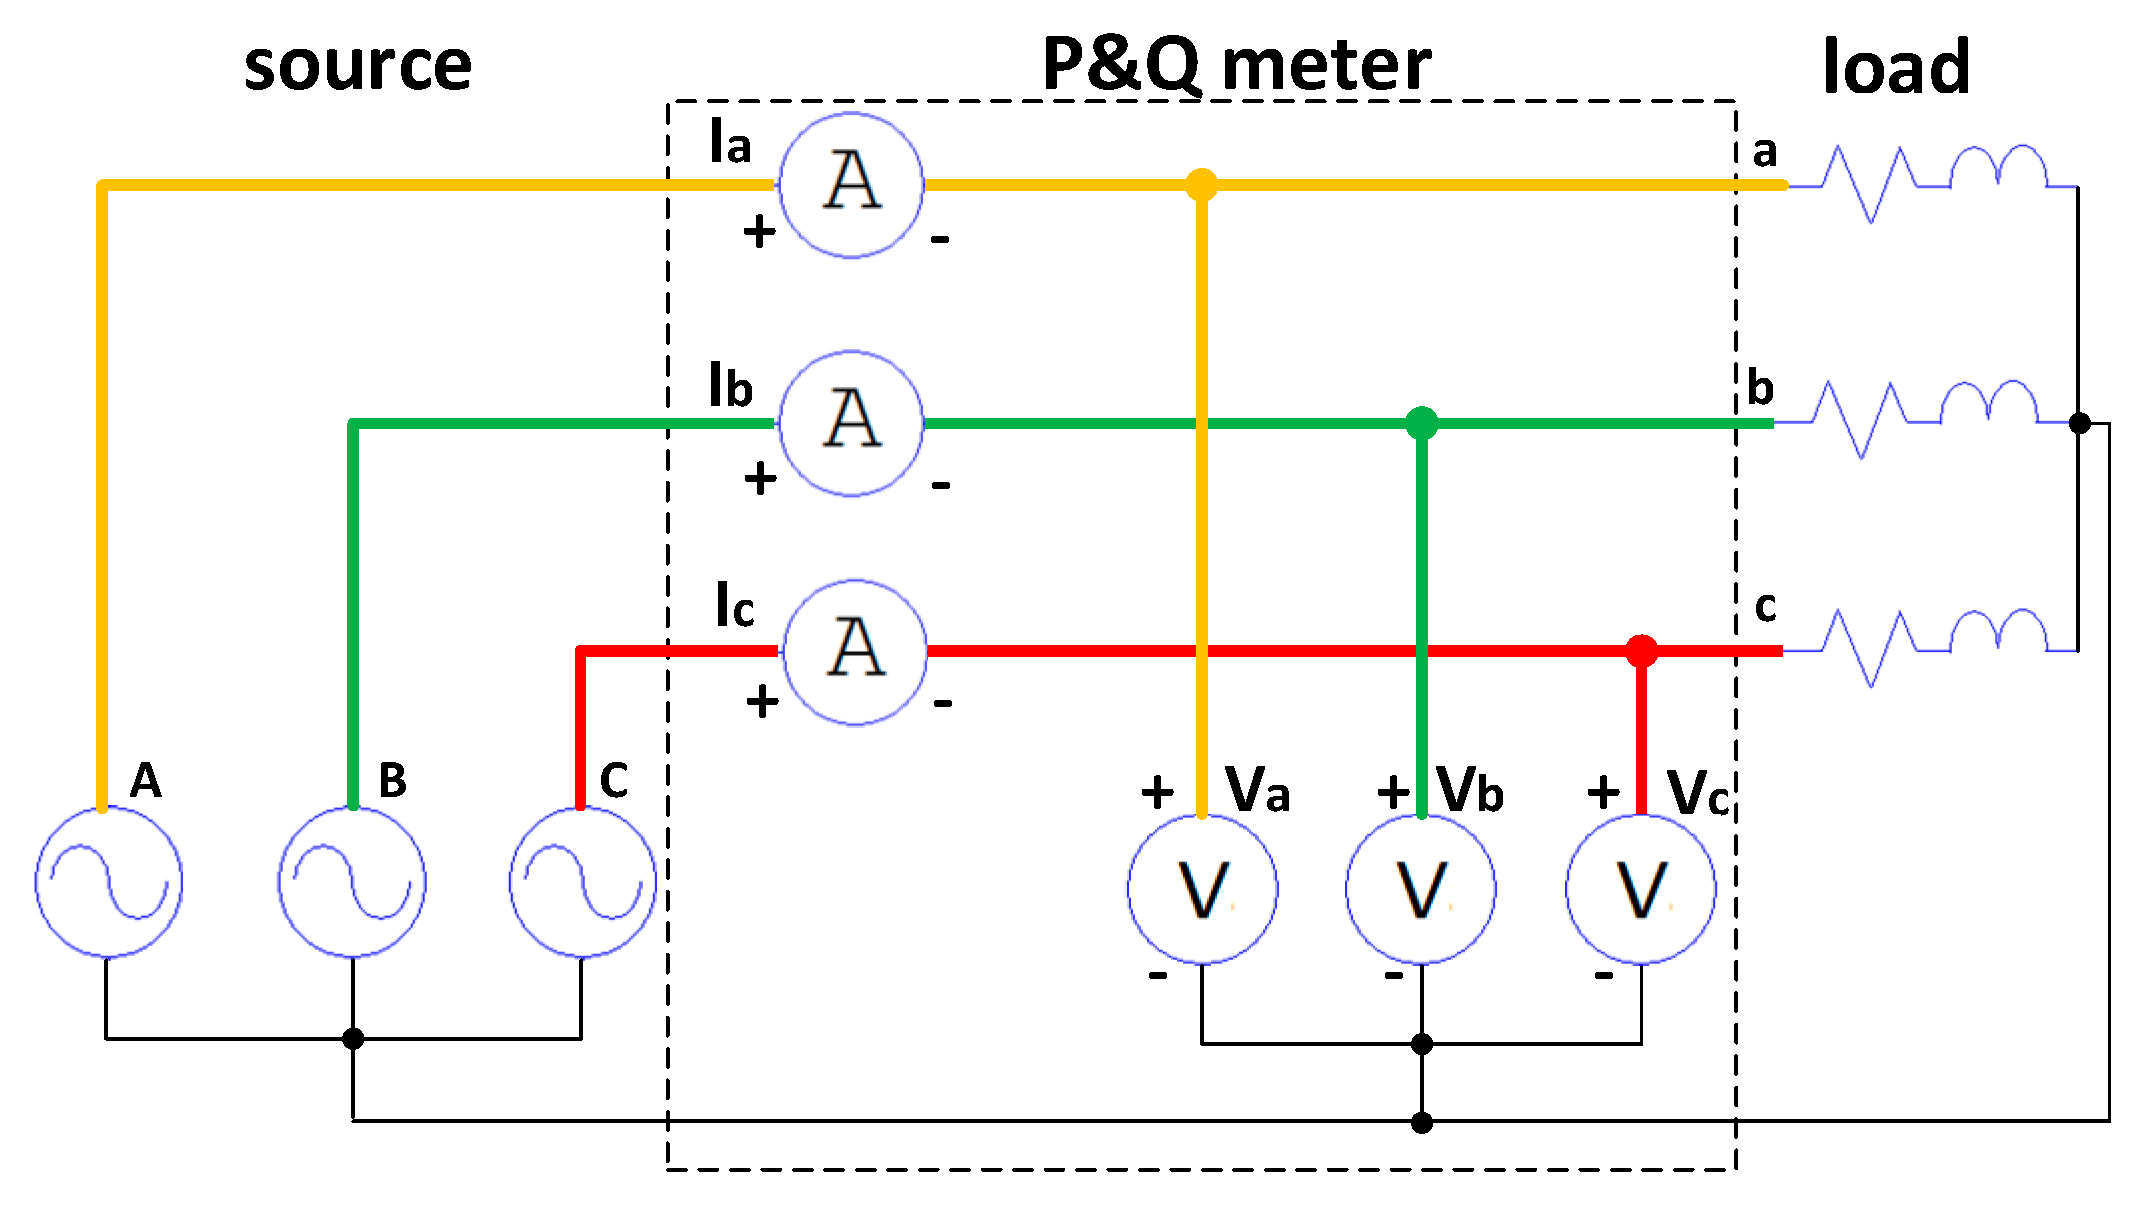
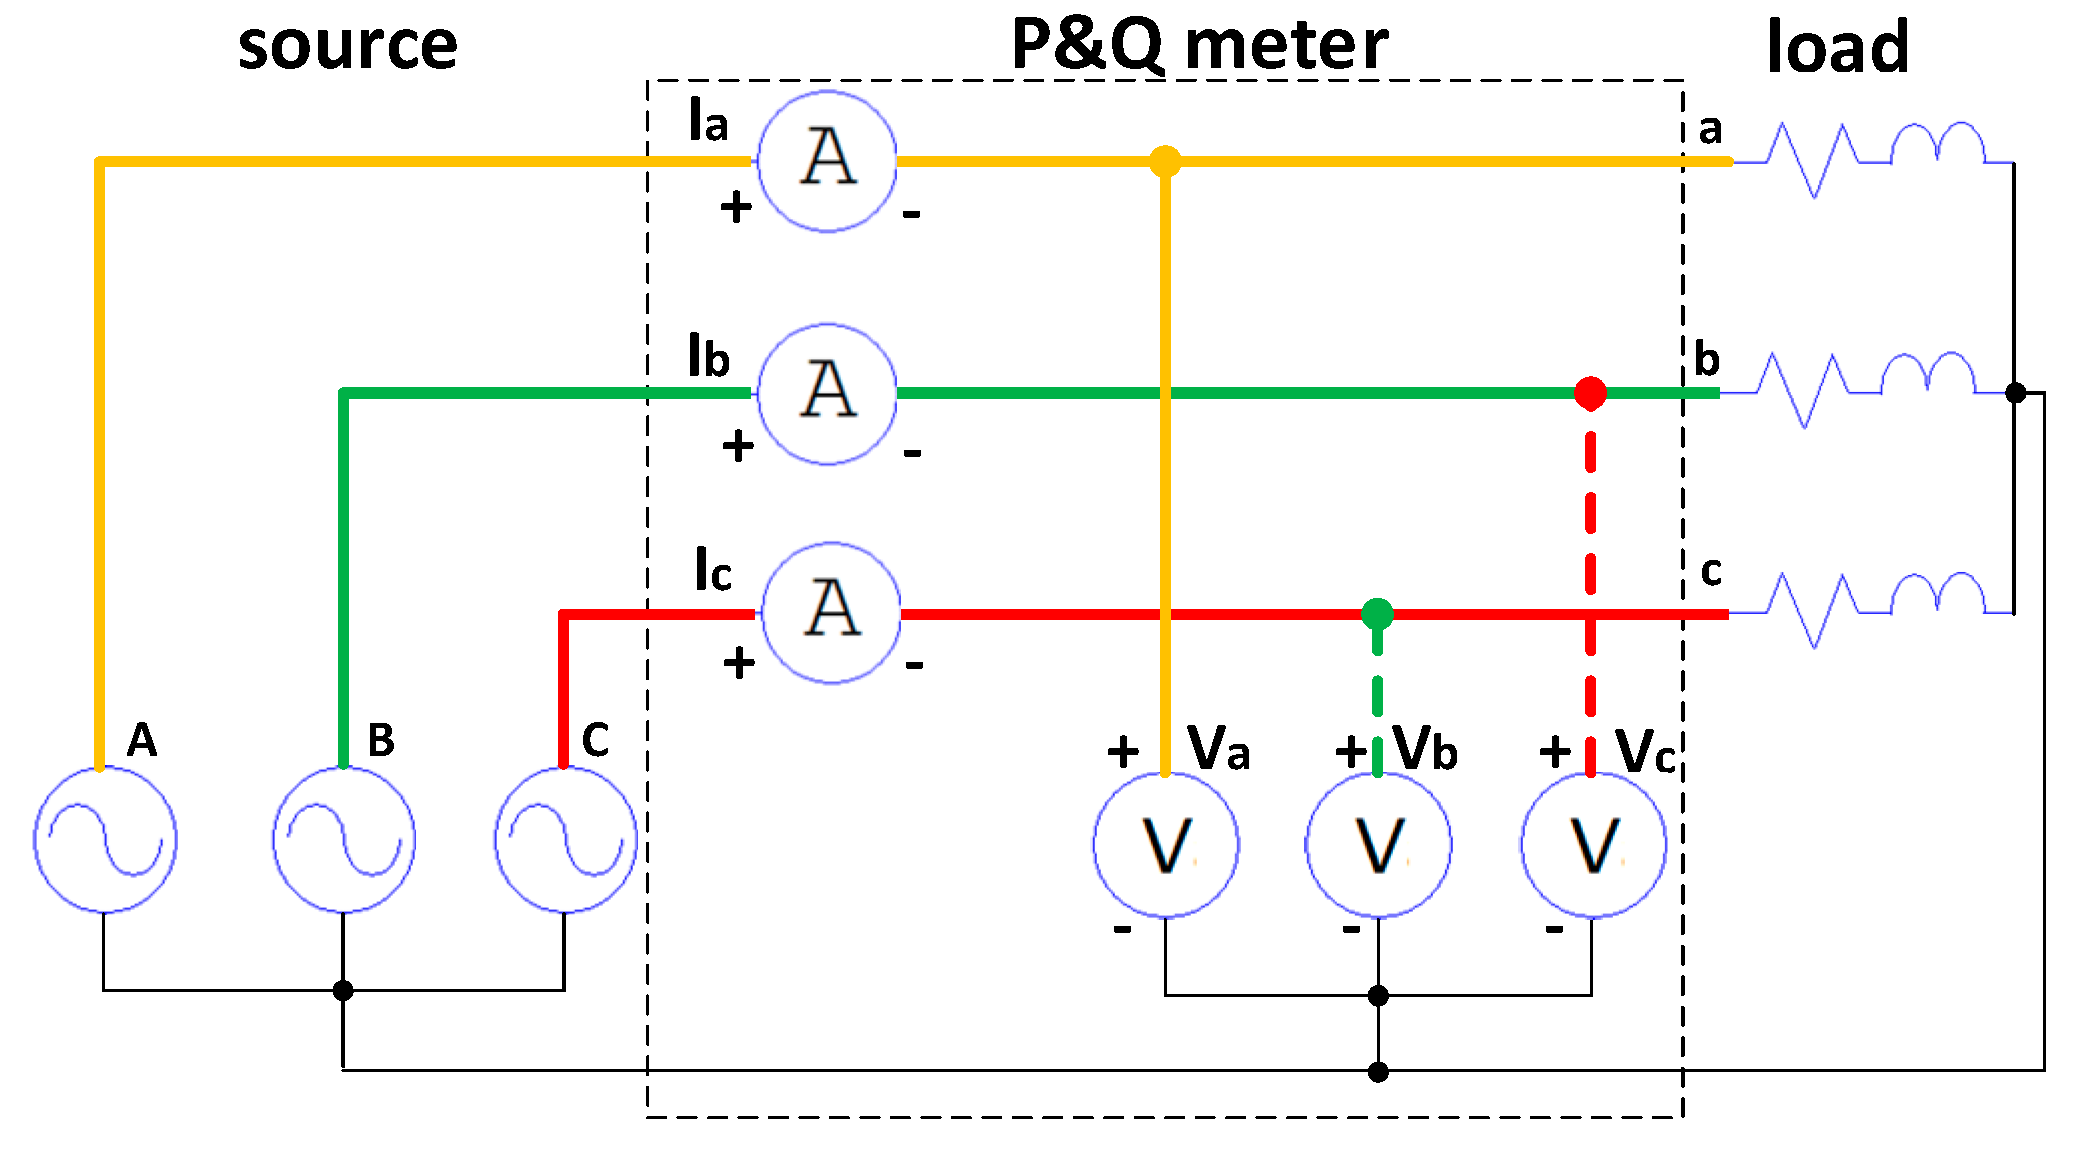
Phase Vector Sequence Faults (VSF) appear when any two wires at the meter’s input terminals are swapped. As a result, the normal phase sequence order of A-B-C is reversed to A-C-B.
(4)
Mismatch Faults (MF) of currents and voltages is a discrepancy in the connection of phases A, B, and C, or the polarity of the voltages or currents.
Three-phase meters and power quality analyzers usually have three independent channels, one per phase. During the monitoring period, T, such a device calculates the consumed active energy, WP, and the reactive energy, WQ, as the sum of the per-phase values:
W P = t = 0 t = T P t d t ,
W Q = t = 0 t = T Q t d t ,
Here, P(t) and Q(t) are the active and reactive powers measured in the three-phase network, respectively. The measurement error is defined as the deviation of the meter’s reading from the true value. In a three-phase network, the complex power, S ¯ , can be expressed in the matrix notation:
S ¯ = V ¯ p h · I ¯ p h * = V ¯ A V ¯ B V ¯ C · I ¯ A * I ¯ p * I ¯ C * ,
Here, V ¯ p h is the vector of the RMS phase voltages and I ¯ p h * is the vector of complex conjugates of the RMS phase currents.
Consider a perfectly balanced three-phase system. Here (2) can be rewritten as:
S ¯ = 1 a 2 a · 1 a a 2 · V p h I p h e j φ ,
where, V p h and I p h are the effective values of the phase voltage and current, respectively; the phase shift between the voltage and current, φ , is the power angle; and the phase rotation operator is defined as a = e j 2 π 3 = 0.5 + j 3 2 .
Define the normalized complex power as:
S ¯ n = S ¯ V p h I p h = 1 a 2 a · 1 a a 2 · e j φ = 3 e j φ ,
Under correct installation conditions, see Figure 1, the meter’s reading, i.e., the measured complex power, S ¯ , equals the complex power, S ¯ c , received by the consumer in practice. However, considering a possible installation fault, S ¯ may not always equal S ¯ c . Therefore, in the general case S ¯ and S ¯ c , related by a certain compliance factor (CF), is defined by:
K ¯ = S ¯   S c ¯ = S · e j φ + S c · e j φ = K · e j ,
In the case of a correct meter installation K = 1; however, in a general case, K ¯ is a complex number, in which magnitude, K, represents the absolute value of the error, whereas the angle ∆ is the phase error.
The complex power measured by the meter, S ¯ , can be expressed in terms of the consumed power, S c ¯ , and the compliance factor, K ¯ , as:
S ¯   = S c ¯ · K ¯ .
Hence, the measured active and the reactive power are, respectively:
P = K S c · c o s φ + ,
Q = K S c · s i n φ +
Equation (7) reveals that the magnitude of the compliance factor, K, equally affects the measured active and reactive powers, whereas the phase error, ∆ ≠ 0, has a non-linear and qualitatively different effect on both P and Q. Therefore, the installation fault results in an incorrect evaluation of the power quality indices and, in particular, affects the assessment of the power factor and voltage symmetry.
To assess the three-phase voltage symmetry, the system of voltage vectors can be translated from phase coordinates into coordinates of symmetric components. This can be conducted using the inverse Fortescue matrix. For a symmetric three-phase system, the translation is as follows:
V ¯ s = 1 3 1 a a 2 1 a 2 a 1 1 1 · 1 a 2 a · V p h = 1 3 1 + a 3 + a 3 1 + a + a 2 1 + a 2 + a · V p h = 1 0 0 · V p h
where V ¯ s = V ¯ 1 V ¯ 2 V ¯ 0 is a column vector of symmetric voltage components, and the normalized vector of symmetric voltage components is:
V ¯ s n = V ¯ s V p h = 1 3 1 a a 2 1 a 2 a 1 1 1 · 1 a 2 a = 1 3 1 + a 3 + a 3 1 + a + a 2 1 + a 2 + a = 1 0 0
The voltage imbalance coefficients are determined by the fundamental harmonic. Negative-sequence asymmetry factor, K 2 V , is the ratio of the negative-sequence voltage, V 2 , to the positive-sequence voltage, V 1 ; whereas zero-sequence asymmetry factor, K 0 V , is the ratio of the zero-sequence voltage, V0, to the positive-sequence voltage, V 1 , [15]:
K 2 V = V 2 V 1 100 % ,
K 0 V = V 0 V 1 100 % .
From (10), it follows that for a symmetric three-phase system K 2 V = K 0 V = 0 , whereas either K 2 V 0 or K 0 V 0 indicates an erroneous assessment of symmetry.

3. Analysis of Meter’s Installation Faults

Next, the measurement errors and imbalance coefficients are evaluated for various installation fault scenarios.

3.1. Discontinuity Faults

DF assumes a nil value for one or more of the six parameters: the phase voltages V A ; V B ; V C or the phase currents I A ; I B ; I C .
Suppose that the voltage of a particular phase is disconnected from the meter’s terminals, for instance, V A = 0 , as shown in Figure 2.
The measured normalized complex power (4) and the CF (6) become, respectively:
S ¯ n   = 0 a 2 a · 1 a a 2 · e j φ = 0 + a 3 + a 3 = 2 e j φ ,
K ¯ = S ¯   S c ¯   = 2 e j φ 3 e j φ = 2 3 .
Suppose that two-phase voltages are disconnected, for instance, V A = 0 and V B = 0 . In this case, the measured normalized complex power (4) and CF (6), become, respectively:
S ¯ n = 0 0 a · 1 a a 2 · e j φ = 0 + 0 + a 3 = e j φ ,
K ¯ = S ¯   S c ¯   = e j φ 3 e j φ = 1 3 .
Next, consider the effect of the voltage DF on the voltage symmetry measurement. In the case of the disconnected phase A, substituting the condition V A = 0 into (9) yields:
V ¯ s = 1 3 1 a a 2 1 a 2 a 1 1 1 · 0 a 2 a = 1 3 0 + a 3 + a 3 0 + a + a 2 0 + a 2 + a = 1 3 2 1 1 .
while the imbalance factors, see (10), are:
K 2 V = K 0 V = 1 2 100 % = 50 % .
When a voltage DF occurs at any two phases, say phases B and C, the symmetry assessment (9) and the voltage imbalance factors are, respectively:
V ¯ s = 1 3 1 a a 2 1 a 2 a 1 1 1 · 1 0 0 = 1 3 1 + 0 + 0 1 + 0 + 0 1 + 0 + 0 = 1 3 1 1 1 ,
K 2 V = K 0 V = 1 1 100 % = 100 % .
It can be shown that (11) is valid when any of the six parameters ( V A ; V B ; V C ; I A ; I B ; I C ) or any two parameters of the same phase ( V A , I A ); ( V B , I B ); ( V C , I C ) vanish (i.e., disconnected). In this case, the magnitude of the compliance factor is K = 2/3. Disconnecting any two opposite parameters is determined by (12) and yields K = 1/3. Note that in such cases, there is no phase error, ∆ = 0.
According to (14), disconnecting any phase voltage yields K 2 V = K 0 V = 50 % , and when any two of the phase voltages become disconnected, (16) suggests that K 2 V = K 0 V = 100 % . These results exceed by far the values of asymmetry factors in reverse and zero sequences permitted by the existing standards and recommendations ( K 2 V = K 0 V = 2 ÷ 3 % ) [27,28,29], which manifests a fraudulent activity.
The analysis results are summarized in Table 1. Here, the “x” sign indicates the presence of an error (either DF or PF). The column, which corresponds to “x”, indicates the presence of an error in the current or voltage circuits, as well as its location (at phase (A, B, or C)). Also, the row indicates one of the 4 considered error types (DF, PF, VSF, MF). In the case of VSF, the arrows indicate the reversed phases. The MF indicates the sequence of phase connections, whereas the wrong polarity is indicated by a “−” sign. Column “S” indicates the share of the power flow the meter is recording. The column “ K 2 V %/ K 0 V , %” shows the unbalance falsely detected by the metering device.

3.2. Polarity Faults

Suppose that the polarity of the current connection in phase A is violated as illustrated in Figure 3. In this case, (4) takes the following form:
S ¯ n = 1 a 2 a · 1 a a 2 · e j φ = e j φ .
Here, by (5), CF is a real number and equals K = 1 / 3 , see (12). Similar results can be obtained for each of the six parameters under the PF condition as summarized in Table 1.
The symmetry can be estimated by (9):
V ¯ s n = 1 3 1 a a 2 1 a 2 a 1 1 1 · 1 a 2 a = 1 3 1 2 2 .
Whereas the voltage imbalance factors can be found in (10) as K 2 V = K 0 V = 200 % . As mentioned, any phase voltage PF gives a similar result.

3.3. Sequence Faults

In the case of VSF, the normal phase order of A-B-C is reversed to A-C-B. This can be emulated by corresponding changes in the connections in the secondary circuits. Suppose that the phase voltages V ¯ B and V ¯ C at the meter’s terminals are swapped, see Figure 4.
Then (4) takes the form:
S ¯ n = 1 a a 2 · 1 a a 2 · e j φ = 0 .
The same result can be obtained from (4) when the current inputs I ¯ B and I ¯ C are swapped:
S ¯ n   = 1 a 2 a · 1 a 2 a · e j φ = 0 .
According to (6), both cases give K ¯ = 0 . It can be shown that swapping any pair of voltage or current inputs leads to the result K ¯ = 0 , see Table 1.
The changes in symmetry caused by the VSF of phase voltage vectors can be estimated by (9) interchanging the voltage inputs V ¯ B and V ¯ C :
V ¯ s = 1 3 1 a a 2 1 a 2 a 1 1 1 · 1 a a 2 = 1 3 1 + a 2 + a 1 + a 3 + a 3 1 + a + a 2 = 0 1 0 .
According to (10), the voltage imbalance factors are K 2 V = K 0 V = . Therefore, the VSF of voltages leads to incorrect readings for voltage symmetry: V ¯ 2 = 1 , V ¯ 1 = V ¯ 0 = 0 . It could be shown that the same result is valid for any pairs of phase voltages that are swapped.
However, the VSF of phase currents does not affect the assessment of voltage symmetry. For a symmetric system K 2 V = K 0 V = 0 , see Table 1.

3.4. Mismatch Faults

Discontinuity faults, polarity faults, and sequence faults are characterized by the incorrect acquisition of a parameter/s by the power meter. Whereas mismatch fault arises when there is no correspondence between the three-phase voltage and the three-phase current reference frames.
Assuming that the connection requirements within the voltage and the current reference frames are met, then the two reasons that can lead to a discrepancy are:
  • phase mismatch
  • polarity mismatch
We can also discuss the reverse sequence of phases A, B, and C in systems of current and voltage vectors, but this phenomenon was categorized above as VSF and has already been considered.
Suppose that the meter’s voltage terminals are provided with the normal voltage phase sequence A, B, C, however, the current inputs are provided with a mismatched current phase sequence B, C, A, see Figure 5. Then, according to (4), the measured normalized complex power is:
S ¯ n = 1 a 2 a · a a 2 1 · e j φ = 3 a e j φ = 3 e j φ + 2 π 3 ,
Whereas in the case the current phase sequence is C, A, B, the resulting normalized complex power is:
S ¯ n = 1 a 2 a · a 2 1 a · e j φ = 3 a 2 e j φ = 3 e j φ 2 π 3 .
The per-unit complex power in case of polarity mismatch between the voltage and current systems, see Figure 6, can be represented by introducing a negative sign to (4) as follows:
S ¯ n = 1 a 2 a · 1 a a 2 · e j φ = 3 e j φ = 3 e j φ + π .
Under any mismatch fault, the CF equals unity, K = 1, so the apparent power is measured correctly. However, the measured active power, P, and the measured reactive power, Q, are both in error, since the angle between the vectors of voltages and currents is impaired by the phase error, 0 , see Table 1.
Yet, symmetry measurements are not affected by the mismatch faults.

3.5. Combination of Voltage and Current Installation Faults

In the following, the combination of all the mentioned installation faults is analyzed by applying the same approach as above. Considering the type of the installation fault the calculation of the normalized complex power, S ¯ n , is carried out according to (4) and the compliance factor by (6). The calculation results are summarized in Table 2. Note that, a faulty connection at the meter’s current input terminals will not affect the measurement of voltage symmetry. Thus, only power measurement errors were considered.

3.5.1. Combination of Voltage Disconnection Fault and Current Connection Fault

Such a fault assumes a single disconnected voltage phase and one of the mentioned current faults.
  • In combination with disconnected current fault. For a three-phase three-element measurement, (4) yields the same results as in Section 3.1. Here, K = 2 / 3 for the same phases, see (11), whereas K = 1/3 for different phases, see (12), and the phase error is nil, = 0 .
  • In combination with the current polarity fault. The current polarity fault in the same phase where the voltage is disconnected is superseded by the fact that the voltage is disconnected, see Section 3.1, hence, by (11), K = 2 / 3 . A current polarity fault on another phase (that does not coincide with the phase of the disconnected voltage) leads to a zero-power reading that results in K = 0 and = 0 in all cases.
  • In combination with the phase currents sequence fault. Here, for all possible combinations, K = 1 / 3 . Phase fault is dependent on combinations of disconnected phase voltages and incorrect phase current sequence. In case of voltage outages in a phase other than phases with incorrect sequence, = π . In the event of a voltage cut-off in a phase coinciding with one of the phases with an incorrect sequence— = ± π / 3 . Consider the obtained results in more detail using the example of an interleaving error of I ¯ A and I ¯ B with V ¯ A disconnected. By (4), the apparent power for this case is:
    S ¯   = 0 a 2 a · a 1 a 2 · e j φ = e j φ π 3 ,
    which according to (6) yields K = 1 / 3 , and = π / 3 .
Assuming a unity monitoring period, T = 1, the meter’s readings during the measurement are the following, see (7):
W P = P · 1 = c o s φ π 3 = 1 2 c o s φ + 3 2 s i n φ ,
W Q = Q · 1 = s i n φ π 3 = 1 2 s i n φ 3 2 c o s φ .

3.5.2. Combined Phase Voltage Sequence and Current Connection Faults

Consider the combination of errors in the phase rotation of two voltages (AB, BC, or AC) with various errors in the current connection.
  • In combination with current disconnection faults. For all possible combinations, K = 1 / 3 . In case of current disconnection, the phase error for phases with the correct sequence is = π , whereas in case of current disconnection in a phase with incorrect sequence, = ± π / 3 .
  • In combination with polarity errors of the current connection. For all possible combinations, K = 2 / 3 . Phase error in case of current disconnection in phases with the correct sequence is = π , whereas in case of current interruption in a phase with incorrect sequence, = ± π / 3 .
  • In combination with current vectors sequence fault. For all possible combinations, K = 1 . When the sequence errors occur in the same phases of currents and voltages coincide, the phase error is = 0 , whereas in cases of mismatch, the phase error is = ± 2 π / 3 .
  • Combination current and voltage mismatch faults result in zero values S = P = Q = 0 , K = 0 .

3.5.3. Combination of Mismatch Faults Caused by Incorrect Connection of Voltage Measuring Circuits with Current Connection Faults

  • In combination with the current disconnection fault.
For all possible combinations, K = 2 / 3 . Mismatch faults caused by the polarity of the connection result in a phase error of = π , and a phase mismatch of = ± 2 π / 3 .
2.
In combination with connection polarity errors.
For all possible combinations, K = 1 / 3 . Mismatch errors caused by the polarity of the connection result in a phase error of = π , and a phase mismatch of = ± 2 π / 3 .
3.
In combination with a sequence of phase vectors of current faults.
Result in zero values: S = P = Q = 0 , K = 0 .
4.
Combination with mismatch errors caused by incorrect connection of the current measuring circuits.
For all possible combinations, K = 1 .
The phase error depends on the combinations of faults in the voltage and current measuring circuits.
Zero-phase error, = 0 , can be observed when the same faults occur in both voltage and current phases since under such conditions the measurement system is reverted to its original correct state. This is observed for the connection polarity mismatch with V A , V B , V C and I A , I B , I C . The same pattern is typical for the same phase mismatch when alternating: V B , V C , V A and I B , I C , I A ; and, similarly, for V C , V A , V B and I C , I A , I B sequence.
While for opposite phase mismatch ( V B , V C , V A and I C , I A , I B ; V C , V A , V B and I B , I C , I A ), the phase error is = ± 2 π / 3 .
In cases where the connection polarity mismatch is combined with a phase mismatch, the S ¯ vector reverses direction. Here, the phase error becomes = π ± 2 π / 3 = ± π / 3 .

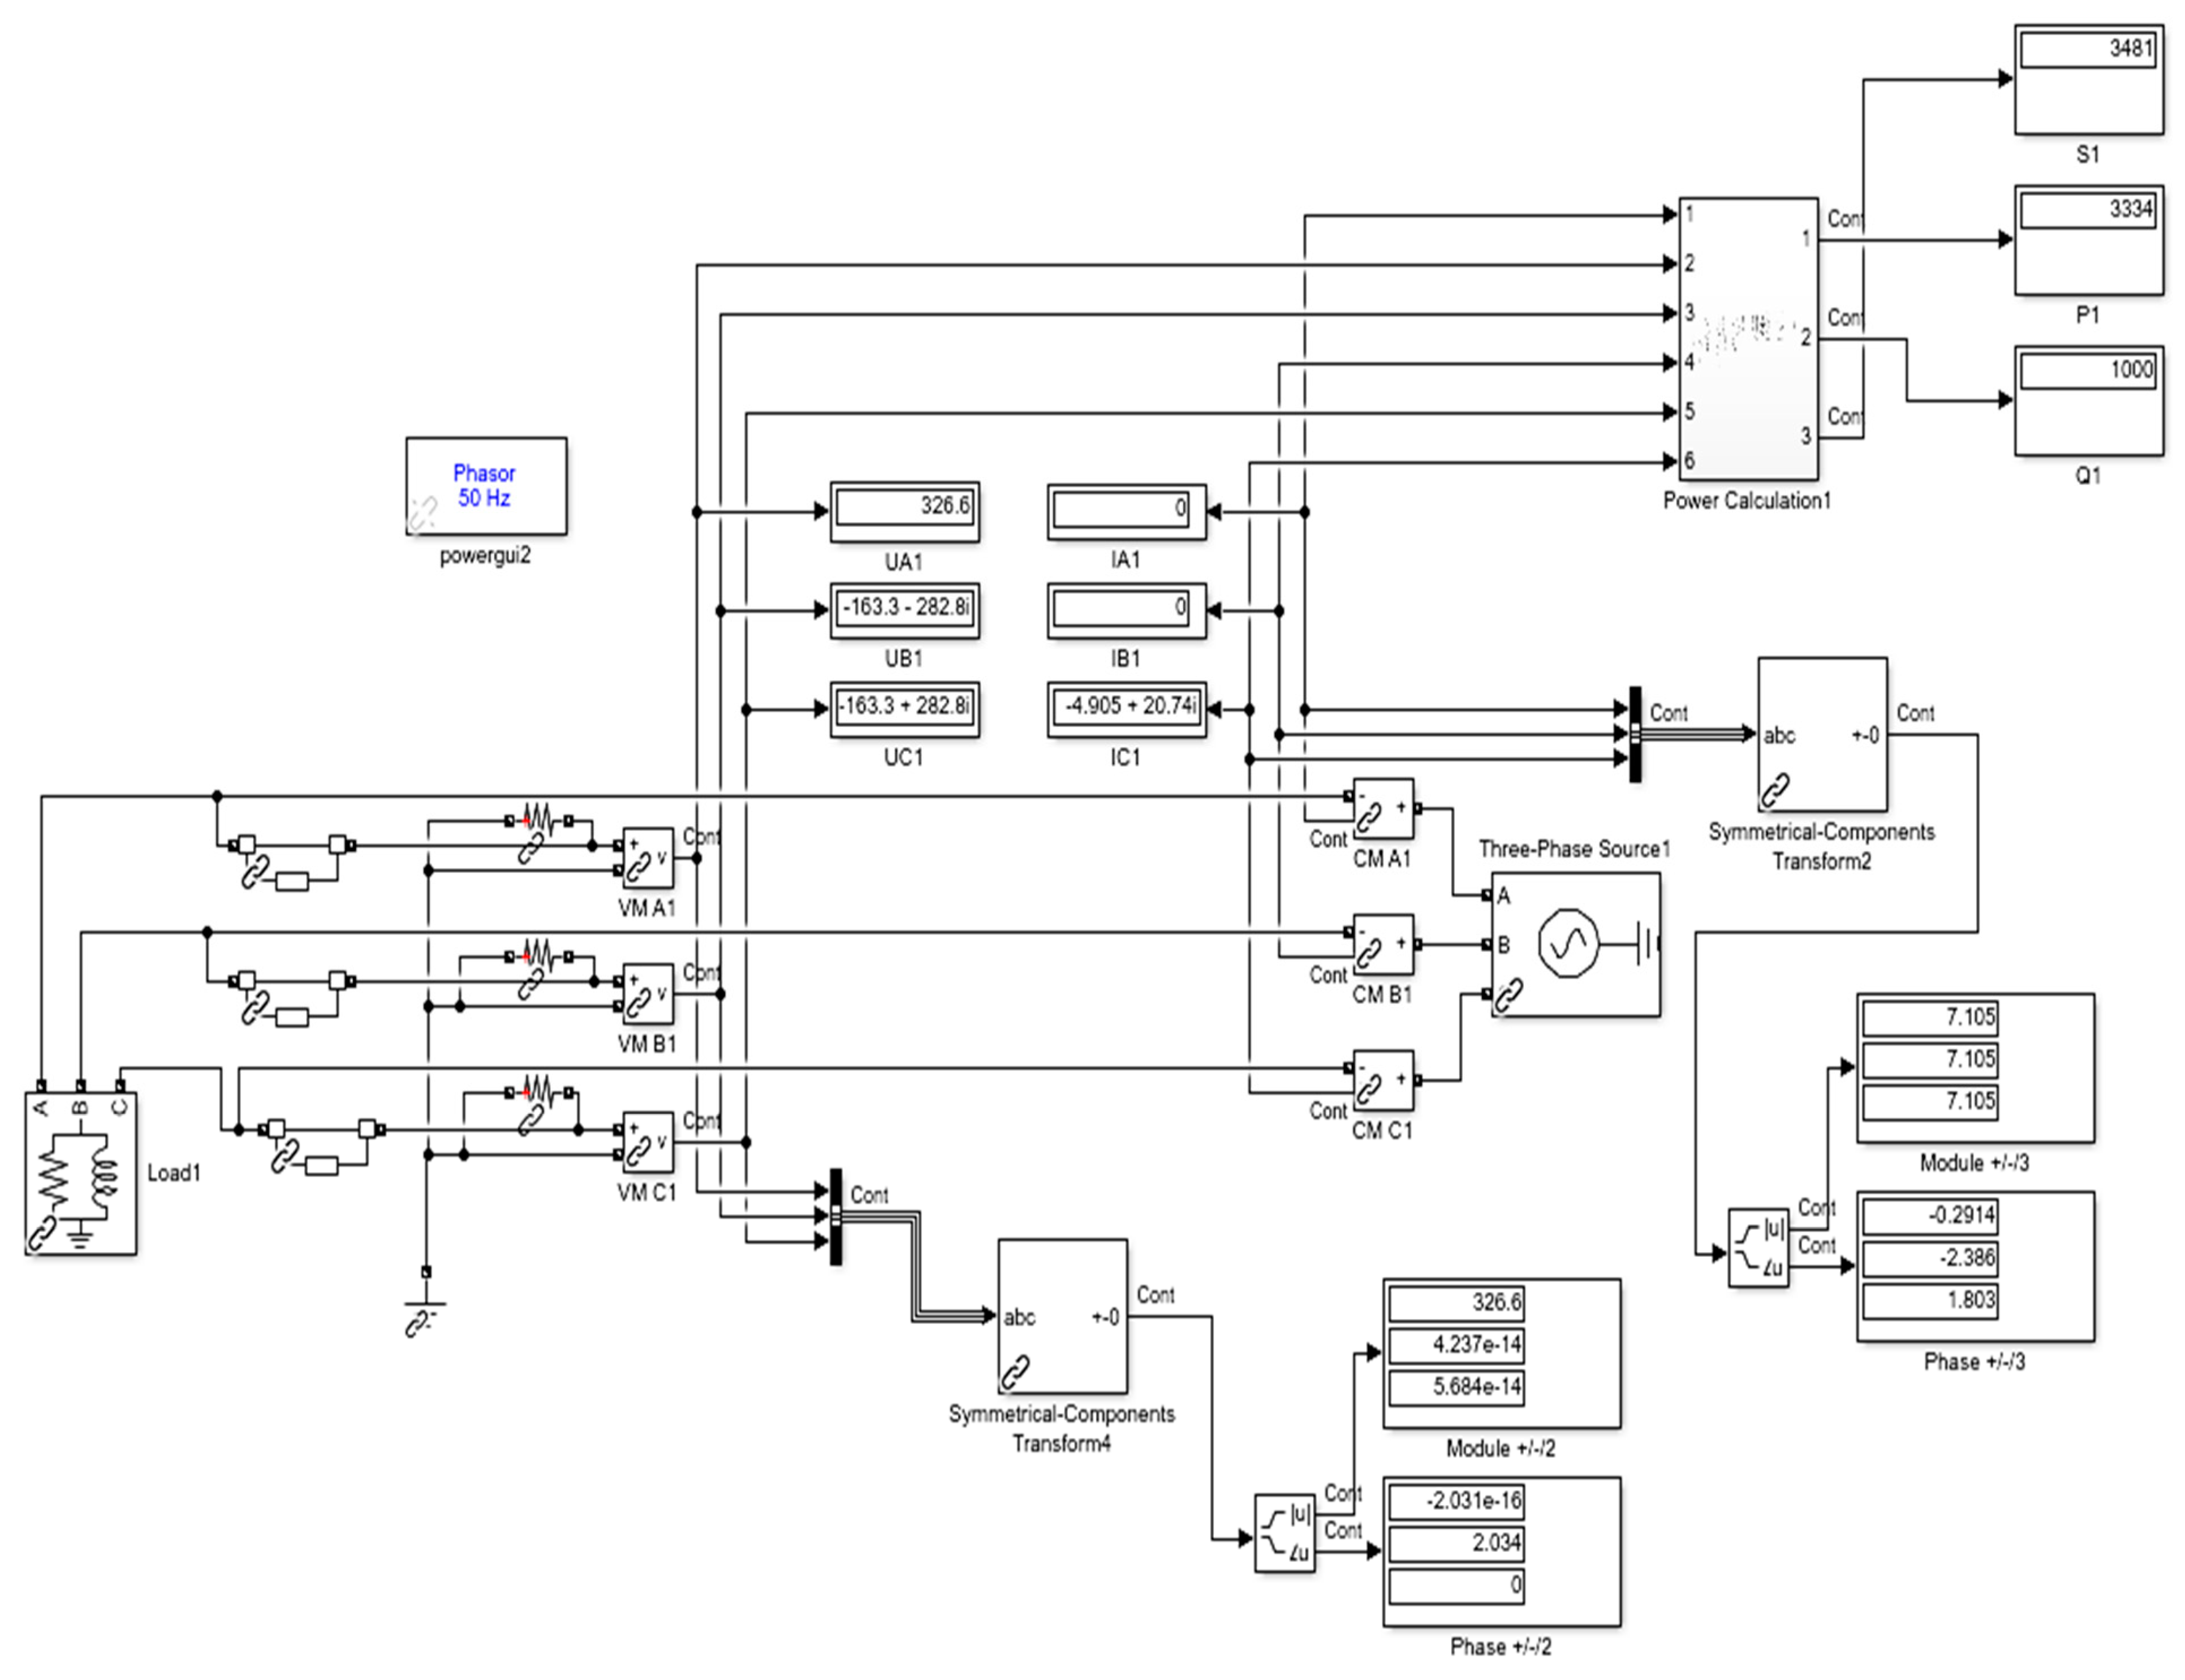
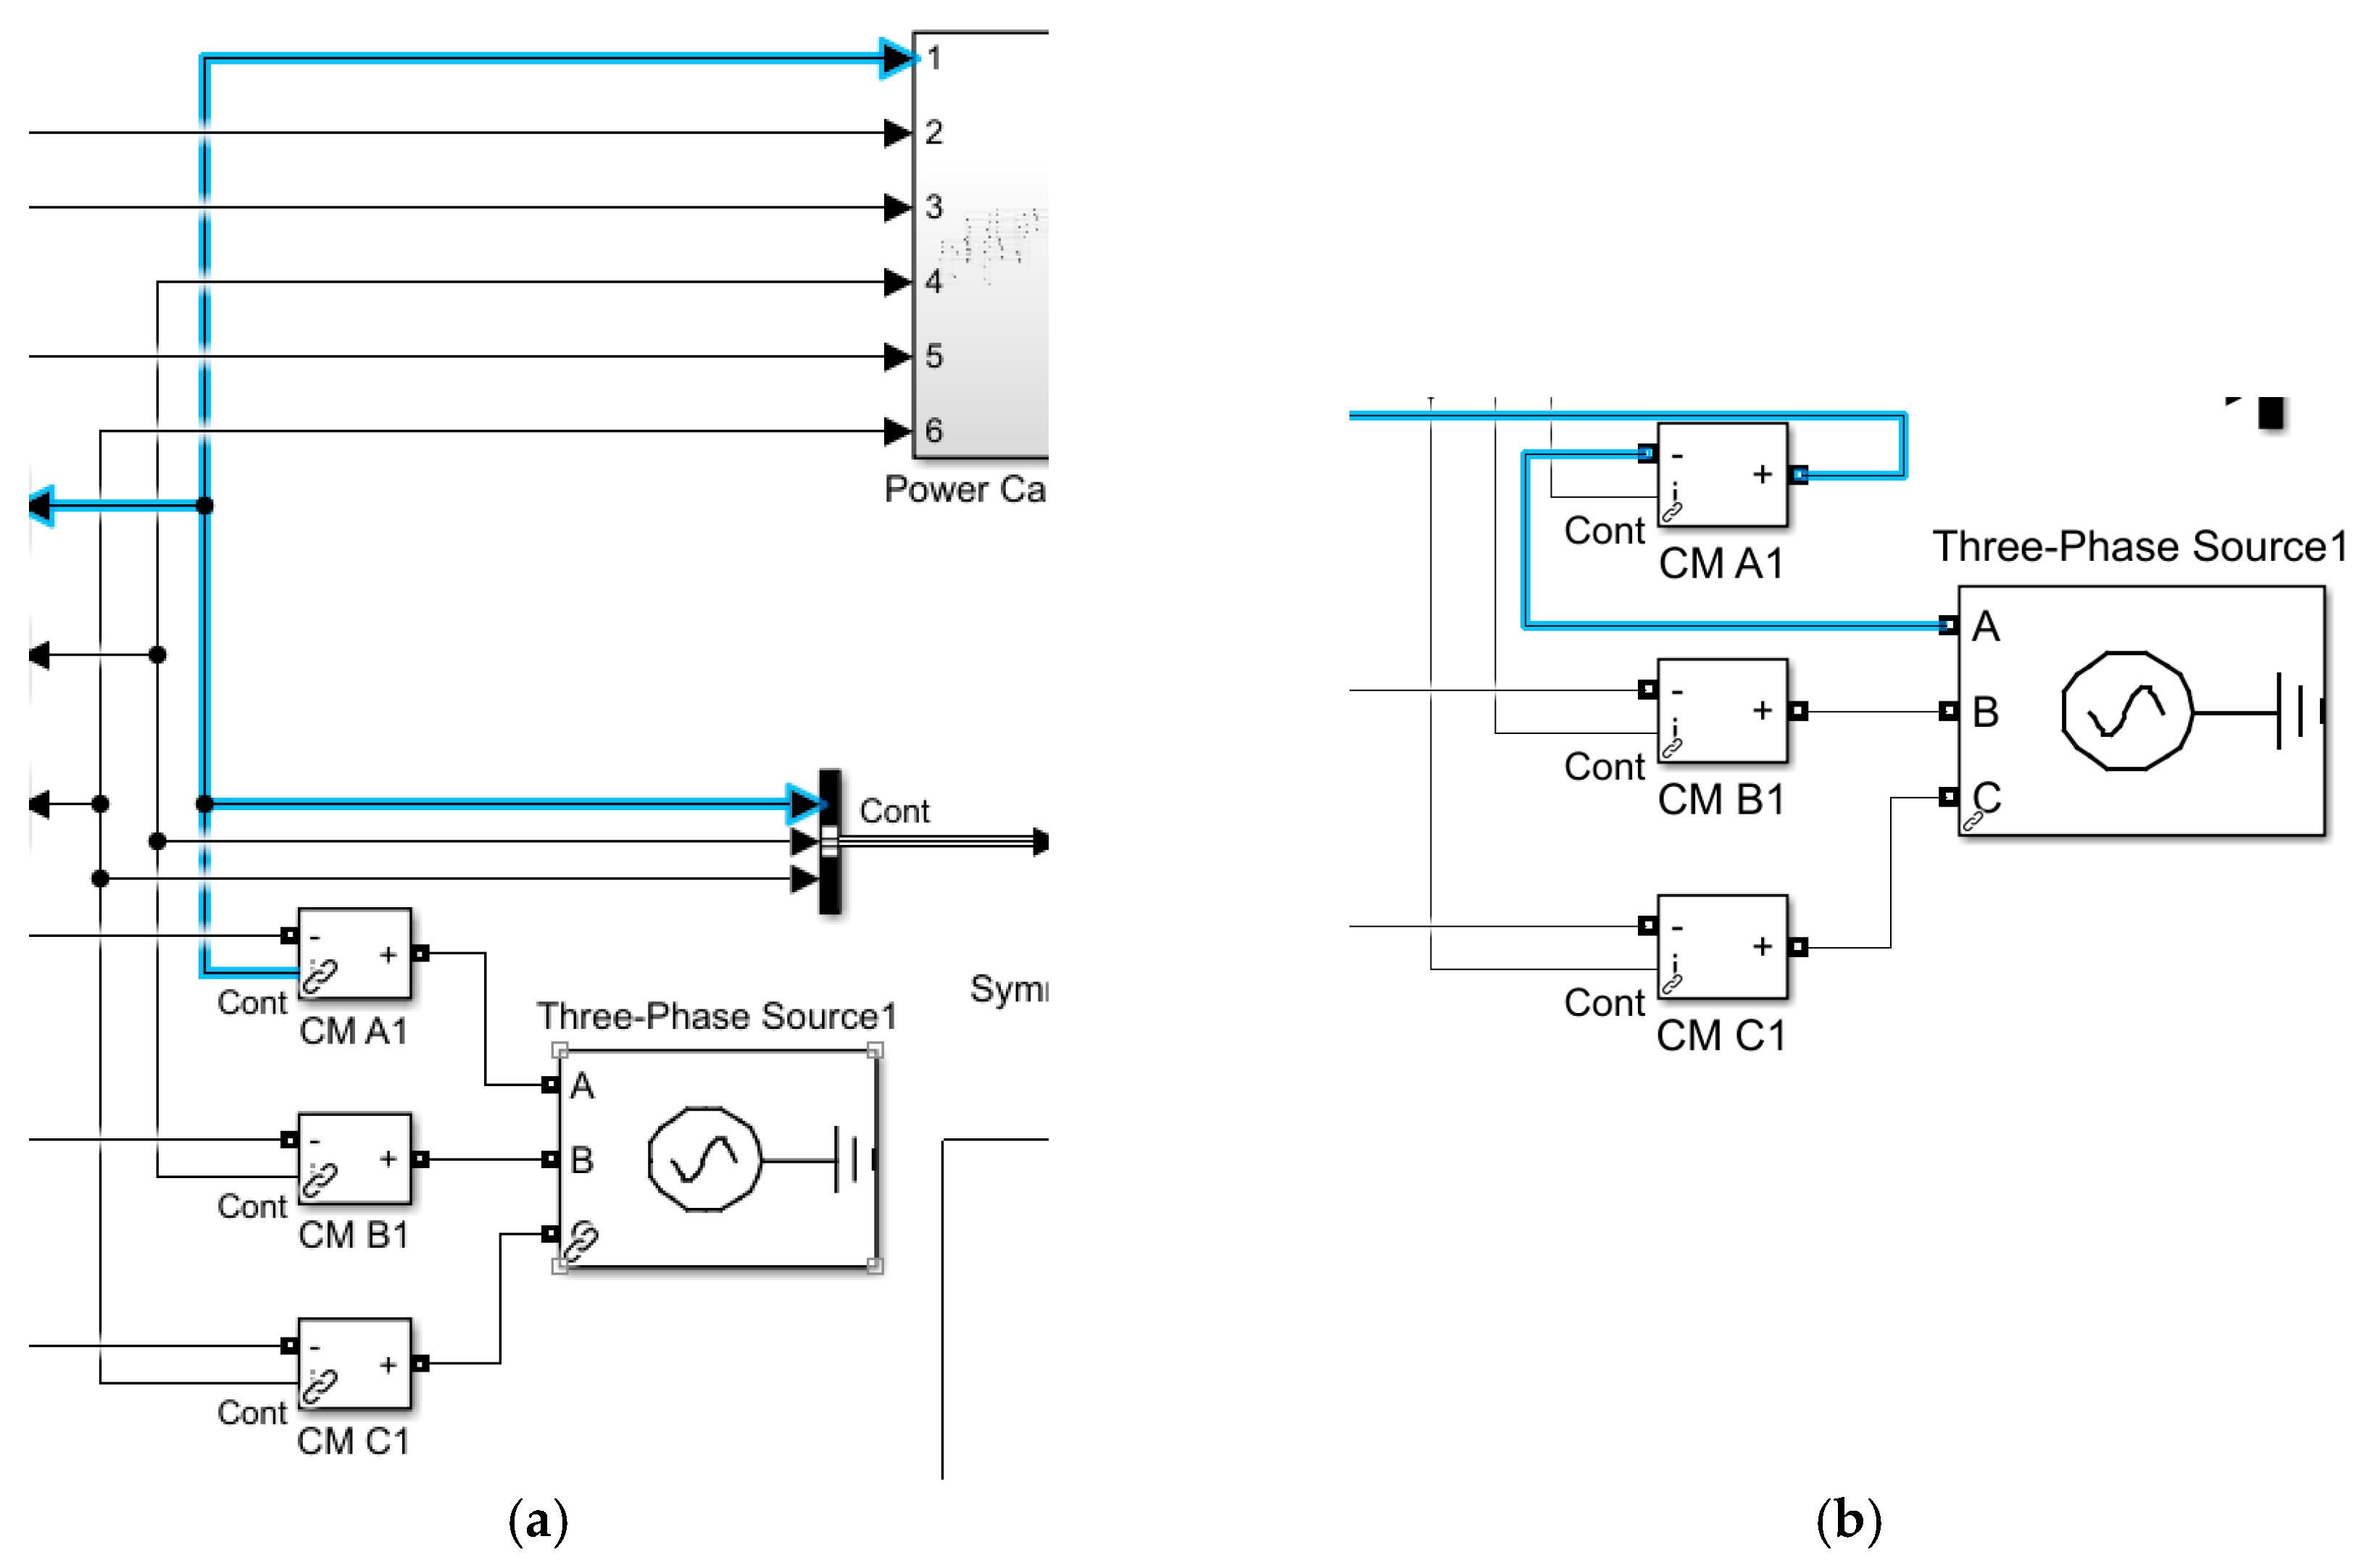
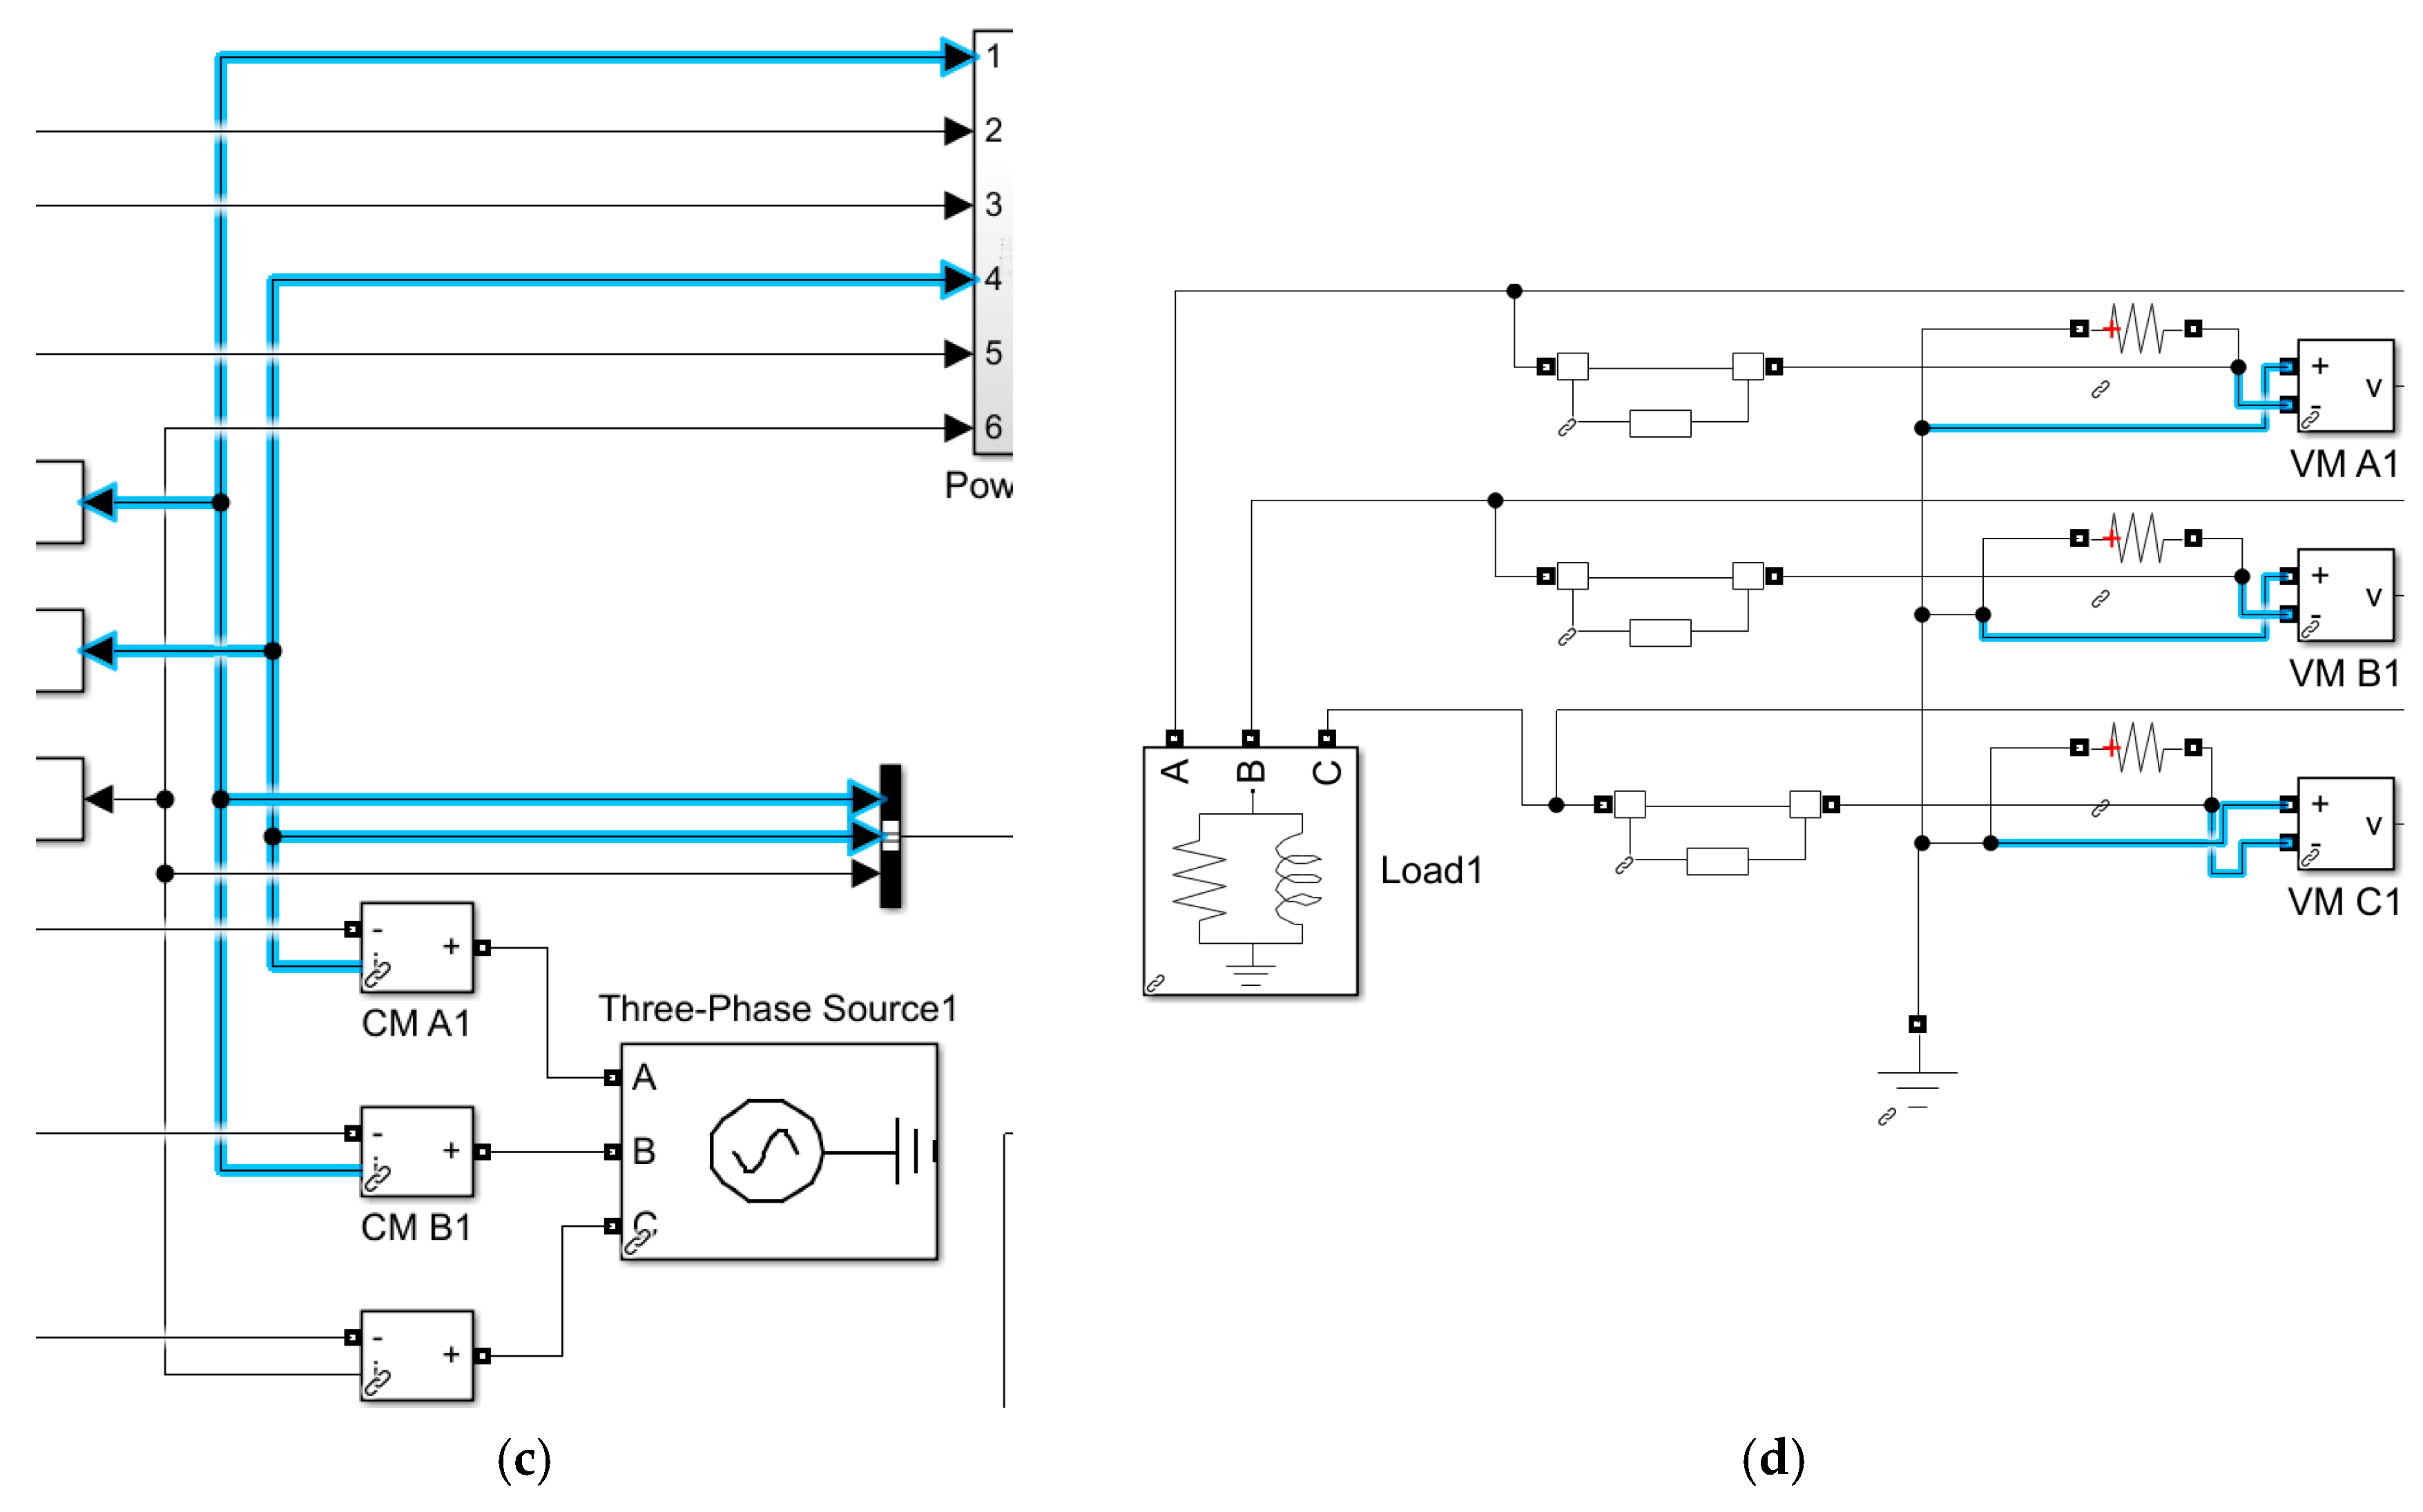
4. Simulation Results

To confirm the theoretical analysis, the MATLAB/SIMULINK R2020a model of a three-phase network was constructed as shown in Figure 7.
The model incorporates a three-phase balanced voltage source; a three-phase symmetrical load; ammeters and watt-meters; a power calculation unit; a block for the calculation of symmetric voltage components; and a block for the calculation of symmetric current components.
The model was reconfigured multiple times to accommodate the various fault scenarios described in Section 2. Some of the possible variants are shown in Figure 8. Figure 8a considers the power failure of phase A in the current network (the blue line will be disconnected). Figure 8b shows the polarity reversal in phase A of the current network. The case of the swapped current circuits A and B is shown in Figure 8c. In the voltage network, the polarity of all phases is reversed, while the polarity of the current remains correct, see Figure 8d.
The combined faults, described in Section 3.5, were also simulated. The simulation results are presented in Table 3. Here, the first (highlighted) row indicates the consumed complex power (SABC) and the imbalance factors of the network ( K 2 V % , K 0 V % ) recorded during the correct meter setup, (i.e., with no installation fault of any kind). The rows below show the value of these indices calculated according to the meter’s reading and depending on the installation fault type. The empty cells imply the technical impossibility of experimenting.
The simulation results support the theoretical predictions.

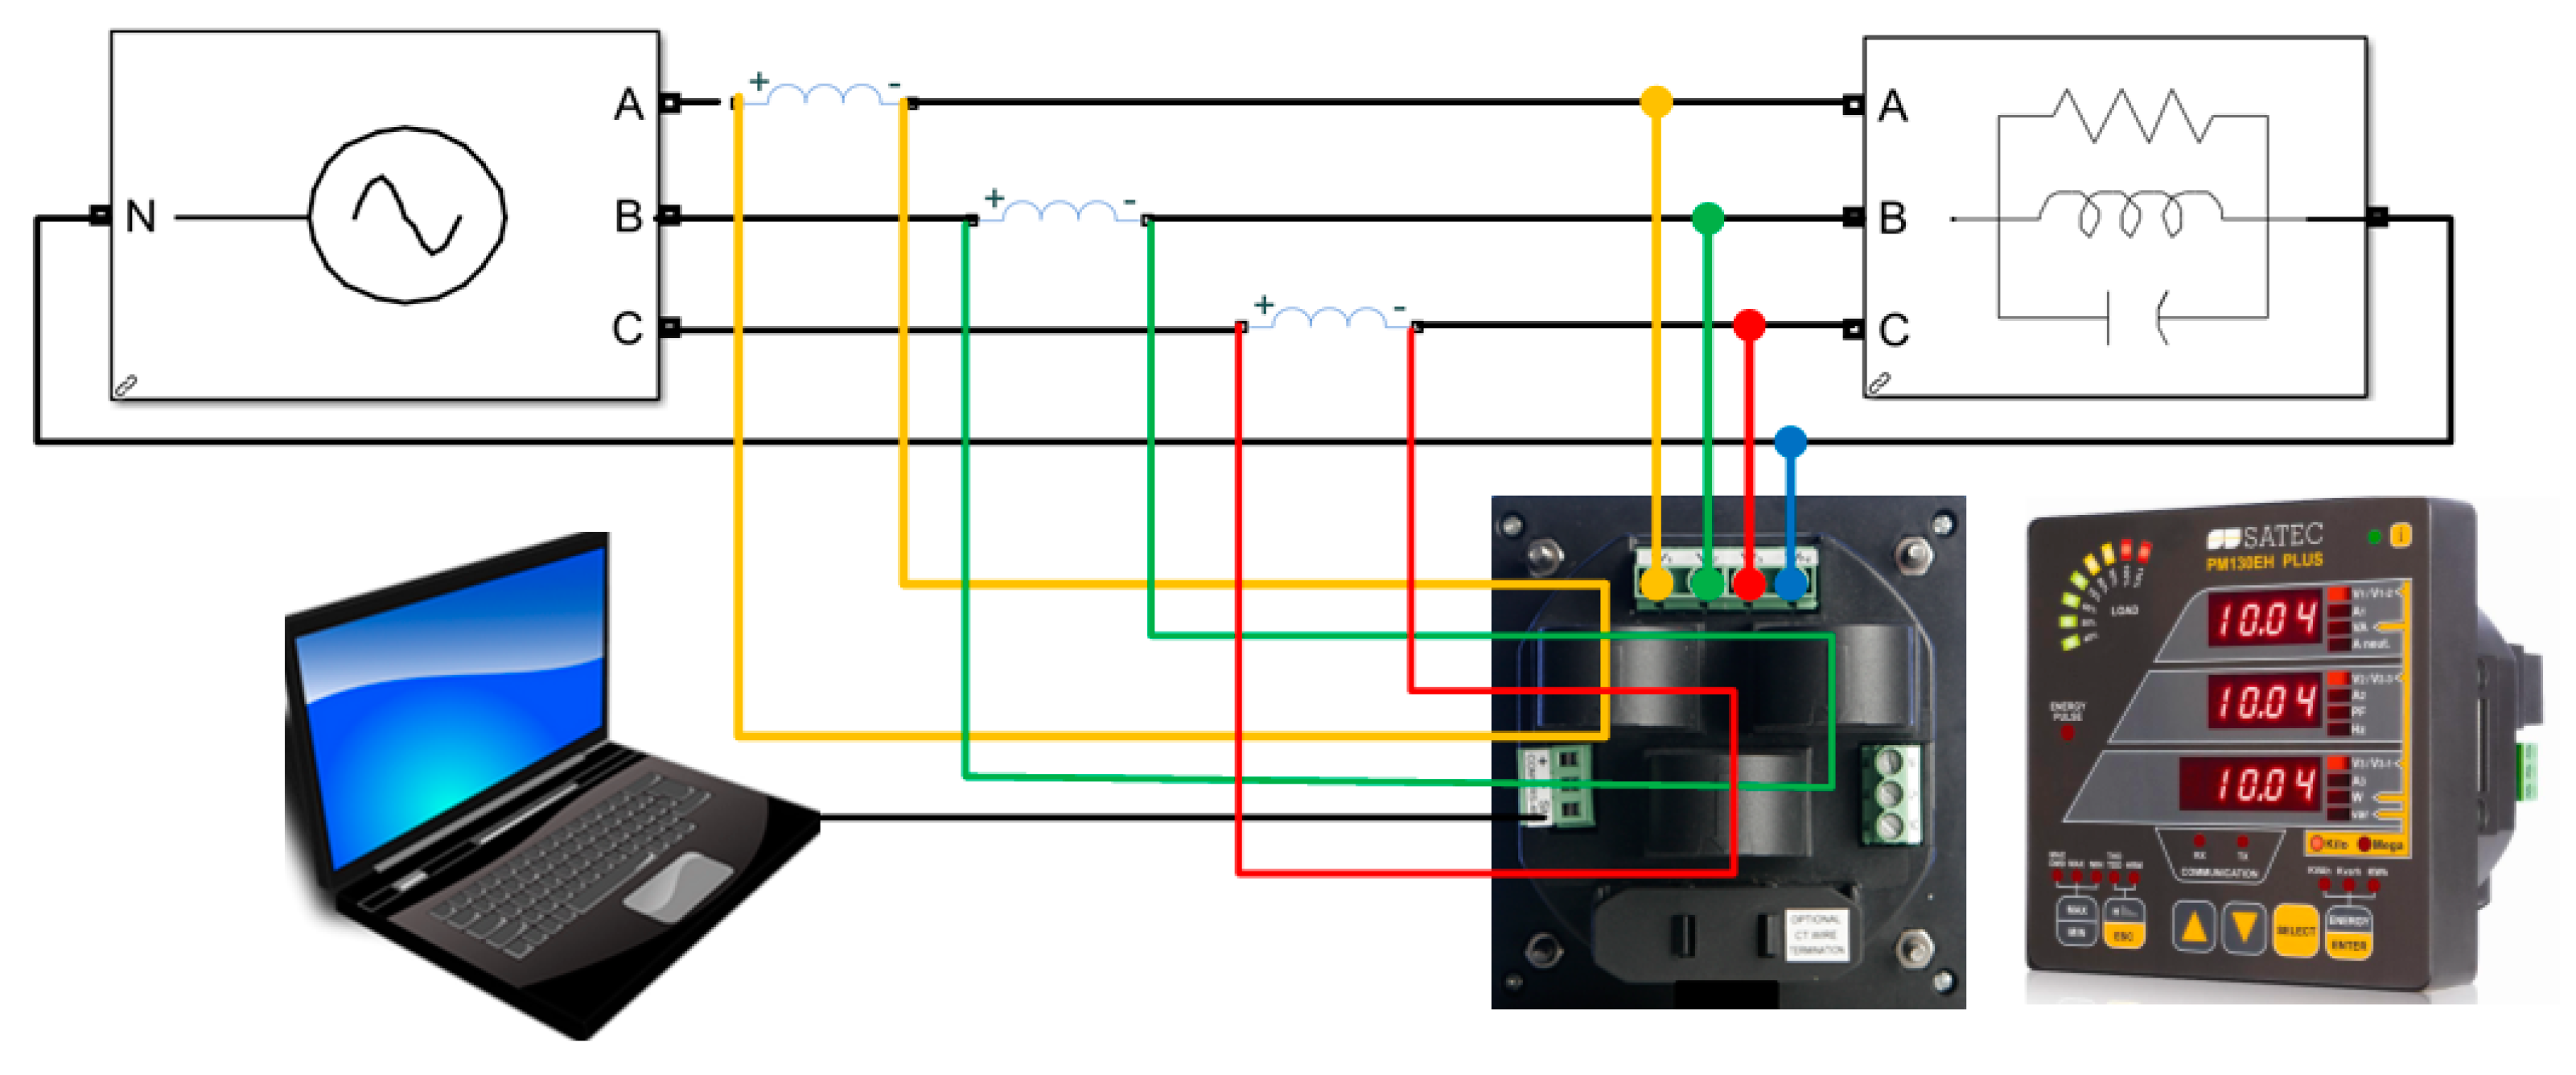
5. Experimental Results

In addition to the simulation results, experimental work was performed to provide a comparison and further confirm the theoretical predictions.
The experimental setup was comprised, see Figure 9, of a three-phase symmetric voltage source; three-phase symmetrical load; power quality analyzer SATEC PM130 PLUS [10]; and a laptop running the PAS V1.4.10 software.
The experiment allows tracking the response of the measuring device to possible installation faults using the PAS V1.4.10 program developed for the SATEC devices.
Comparison of the columns containing the power readings obtained by simulation, by experiment (SABC, K( )), and by theoretical predictions (the values of K( )), reveals a good match. The deviation in the experimental data is mainly due to the lack of ideal symmetry in the three-phase source and, to a much lesser extent, due to the measurement error. Similar conclusions can be drawn when comparing the voltage asymmetry coefficients ( K 2 V , %/ K 0 V , %).
The results of the hardware experiments stand in good agreement with the theoretical predictions and the simulation results, see Table 3.
When operated under the fault conditions, neither the meter nor the PAS V1.4.10 program issued any warning signals. To analyze the correctness of the installation, the developer assumes the use of a phasor diagram of currents and voltages displayed by the PAS V1.4.10 program. Such an approach is a common practice in today’s smart meter market. Furthermore, in case the inspected power meter has limited display capabilities, the inspection task is further aggravated and requires additional equipment. Also, as already mentioned, the correct assessment of the fault conditions is the prerogative of a highly trained professional and is subject to human error.

6. Future Work

The analysis approach offered in this paper is based on the classical three-phase networks theory and is general and can also be extended to networks with an isolated neutral, which will be given elsewhere.
The cases considered in this paper are idealized assuming a sinusoidal excitation in a symmetric system. In modern power grids, however, there are simultaneous disturbances in the quality of electricity. For such states, voltage and current signals are distorted and non-stationary [30,31]. In such a case, a DFT analysis is performed first and then only the fundamental components are taken into account. Questions about how the DFT analysis affects the result considering the risk of the “spectrum leakage” phenomenon [32] are left for future work.
Another question is the effect of the common mode currents generated by the inverters employed by distributed generation systems [33] on power flow measurement. This issue will also be treated elsewhere.

7. Conclusions

This article presents a theoretical study of errors in the reading of electric power meters on a three-phase electrical network under installation fault conditions.
In this paper, a classification of installation faults of three-phase power meters is proposed and a mathematical model with quantitative indices is developed that can be applied to analyze errors in power and symmetry readings for various types of installation faults. The model was then used to identify typical patterns that manifest the occurrence of a specific type of fault. Analysis of all possible installation faults, as well as all possible combinations when combining two types of connection faults, was performed. The proposed method was shown to provide quantitative features inherent to each specific connection fault. The proposed theory can help identify at which phase of the metering device an incorrect phasing or polarity inversion occurred.
The results of this study were summarized and tabulated. Theoretical expectations were confirmed by MATLAB/SIMULINK simulation, as well as hardware experiments. Simulation and experiment results stand in good agreement with the theoretical predictions.
It should be noted that the predicted amplitude and phase errors due to meter installation faults are much higher than the maximum permissible deviations of power quality indices. This allows to neglect the effects of harmonic distortion in either current or voltage and consider the practical electrical network as a quasi-symmetrical system. When encountering transient processes on the network, a working meter prototype should be programmed to dismiss such events and consider only the steady-state conditions.
The analysis has shown that meter installation faults lead to significant measurement errors and, thus, may inflict significant economic damages on customers or utilities. Application of the proposed theory allows for the identification of installation fault conditions. The results of this study can be applied to develop an algorithm for automatic detection and identification of installation faults. Based on the proposed theory, an appropriate software package can be developed and embedded into a prospective smart metering device that would run an automatic self-check. Prospective smart meters with such features would be able to detect inadvertent or intentional installation faults, issue a warning signal, suggest taking the appropriate measures to rectify the problem, or maybe even take the necessary correction steps autonomously. Such a smart meter can facilitate fair customer billing and help prevent electricity theft. Thus, significant economic damages to the customers and utilities can be spared. Hence a prospective smart meter with such features may have an advantage in the marketplace.

Author Contributions

Conceptualization, G.S. and P.S.; methodology, G.S.; software, P.S.; validation, P.S.; formal analysis, G.S.; investigation, P.S.; resources, A.A.; data curation, P.S.; writing—original draft preparation, A.A.; writing—review and editing, A.A.; visualization, P.S. and A.A.; supervision, A.A.; project administration, A.A.; funding acquisition, A.A. All authors have read and agreed to the published version of the manuscript.

Funding

This research received no external funding.

Data Availability Statement

Data are contained within the article.

Conflicts of Interest

The authors declare no conflicts of interest. The funders had no role in the design of the study; in the collection, analyses, or interpretation of data; in the writing of the manuscript; or in the decision to publish the results.

Nomenclature

V A ;   V B ;   V C the phase voltage reading of the power meter
I A ;   I B ;   I C the phase current reading of the power meter
a the rotation operator
Pthe active power
Qthe reactive power
WPthe active energy
WQthe reactive energy
S ¯ the measured complex power
S ¯ c the complex power received by the consumer
S ¯ n the normalized complex power
K ¯ the compliance factor (CF)
Kthe absolute value of CF
is the phase of CF
V0the zero-sequence voltage
V 1 the positive-sequence voltage
V 2 the negative-sequence voltage
K 0 V zero-sequence asymmetry factor
K 2 V the negative-sequence asymmetry factor

References

  1. $96 Billion Is Lost Every Year to Electricity Theft. Available online: https://www.prnewswire.com/news-releases/96-billion-is-lost-every-year-to-electricity-theft-300453411.html (accessed on 8 April 2024).
  2. Gu, F. Analysis on Phase Shift Method of Stealing Electricity Meter Wiring. In Proceedings of the International Conference on Education, Management, Commerce and Society (EMCS 2015), Shenyang, China, 29–31 January 2015. [Google Scholar]
  3. Ebel, D.; Kurth, P. Financial losses of wrong meter installation—The importance of training. Smart Energy Int. 2008. [Google Scholar]
  4. Shcherbakova, P.; Senderovych, G.; Abramovitz, A. Revisiting the active power direction method. IET Gener. Transm. Distrib. 2021, 15, 1056–1069. [Google Scholar] [CrossRef]
  5. ANSI C12.20-2010; American National Standard for Electricity Meters-0.2 and 0.5 Accuracy Classes. ANSI: Washington, DC, USA, 2018.
  6. IEC 62053-22; Electricity Metering Equipment (ac)–Particular Requirements Part 22: Static Meters for Active Energy (Classes 0.2 S and 0.5 S). IEC: Geneva, Switzerland, 2003.
  7. IEEE Std 1889-2018; IEEE Guide for Evaluating and Testing the Electrical Performance of Energy Saving Devices. IEEE: Piscataway, NJ, USA, 2019; pp. 1–46. [CrossRef]
  8. Pazderin, A.V.; Egorov, A.O.; Eroshenko, S.A. The energy meters allocation in electric systems on the basis of observability theory. In Proceedings of the 2010 9th International Conference on Environment and Electrical Engineering, Prague, Czech Republic, 16–19 May 2010; pp. 167–170. [Google Scholar] [CrossRef]
  9. Baumeler, F.; Ebel, D. How to discover circuit errors in meter installations. In Proceedings of the Ninth International Conference on Metering and Tariffs for Energy Supply 1999 (Conf. Publ. No. 462), Birmingham, UK, 25–28 May 1999; pp. 234–238. [Google Scholar] [CrossRef]
  10. Ford, V.; Siraj, A.; Eberle, W. Smart grid energy fraud detection using artificial neural networks. In Proceedings of the 2014 IEEE Symposium on Computational Intelligence Applications in Smart Grid (CIASG), Orlando, FL, USA, 9–12 December 2014; pp. 1–6. [Google Scholar] [CrossRef]
  11. Wang, B.; Dong, X.; Pan, Z.; Bo, Z.; Yip, T. Bad Data Identification for Voltage Sag State Estimation in Distribution System with Wind Farm Connections. In Proceedings of the 2011 46th International Universities’ Power Engineering Conference (UPEC), Soest, Germany, 5–8 September 2011; pp. 1–5. [Google Scholar]
  12. Murawwi, E.A.; Mardiana, R.; Su, Q. Effect of terminal connections on VSFRA results of three-winding power tranVSFormers. In Proceedings of the 2011 2nd International Conference on Electric Power and Energy Conversion Systems (EPECS), Sharjah, United Arab Emirates, 15–17 November 2011; pp. 1–6. [Google Scholar] [CrossRef]
  13. Christopher, A.V.; Swaminathan, G.; Subramanian, M.; Thangaraj, P. Distribution line monitoring system for the detection of power theft using power line communication. In Proceedings of the 2014 IEEE Conference on Energy Conversion (CENCON), Johor Bahru, Malaysia, 13–15 October 2014; pp. 55–60. [Google Scholar] [CrossRef]
  14. Shah, A.L.; Mesbah, W.; Al-Awami, A.T. An Algorithm for Accurate Detection and Correction of Technical and Nontechnical Losses Using Smart Metering. IEEE Trans. Instrum. Meas. 2020, 69, 8809–8820. [Google Scholar] [CrossRef]
  15. Mendiola, J.E.; Pedrasa, M.A.A. Detection of Pilferage in an AMI-Enabled Low-Voltage Network Using Energy Reading Anomalies. In Proceedings of the 2019 International Conference on Smart Grid Synchronized Measurements and Analytics (SGSMA), College Station, TX, USA, 21–23 May 2019; pp. 1–6. [Google Scholar] [CrossRef]
  16. Henriques, H.; Barbero, A.; Ribeiro, R.; Fortes, M.; Zanco, W.; Xavier, O.; Amorim, R. Development of adapted ammeter for fraud detection in low-voltage installations. Measurement 2014, 56, 1–7. [Google Scholar] [CrossRef]
  17. Ahmad, T.; Chen, H.; Wang, J.; Guo, Y. Review of various modeling techniques for the detection of electricity theft in smart grid environment. Renew. Sustain. Energy Rev. 2018, 82, 2916–2933. [Google Scholar] [CrossRef]
  18. Himeur, Y.; Ghanem, K.; Alsalemi, A.; Bensaali, F.; Amira, A. Artificial intelligence based anomaly detection of energy consumption in buildings: A review, current trends and new perspectives. Appl. Energy 2021, 287, 1166. [Google Scholar] [CrossRef]
  19. Mesbah, W. Securing Smart Electricity Meters Against Customer Attacks. IEEE Trans. Smart Grid 2018, 9, 101–110. [Google Scholar] [CrossRef]
  20. Blakely, L.; Reno, M.J.; Feng, W.-C. Spectral Clustering for Customer Phase Identification Using AMI Voltage Timeseries, 2019. In Proceedings of the IEEE Power and Energy Conference at Illinois (PECI), Champaign, IL, USA, 28 February–1 March 2019; pp. 1–7. [Google Scholar] [CrossRef]
  21. Luan, W.; Peng, J.; Maras, M.; Lo, J.; Harapnuk, B. Smart Meter Data Analytics for Distribution Network Connectivity Verification. IEEE Trans. Smart Grid 2015, 6, 1964–1971. [Google Scholar] [CrossRef]
  22. Trevizan, R.D.; Reno, M.J. Distribution System State Estimation Sensitivity to Errors in Phase Connections. In Proceedings of the 2021 IEEE 48th Photovoltaic Specialists Conference (PVSC), Fort Lauderdale, FL, USA, 20–25 June 2021; pp. 1049–1056. [Google Scholar] [CrossRef]
  23. Power Quality Analyzers. Available online: https://www.satec-global.com/PowerQualityAnalyzers (accessed on 8 April 2024).
  24. Electrical Submetering Equipment for Building Management Systems (BMS). Available online: https://shop.dentinstruments.com/collections/building-submetering (accessed on 8 April 2024).
  25. Power Quality Analyzers and Meter. Available online: https://www.elspec-ltd.com/metering-protection/power-quality-analyzers (accessed on 8 April 2024).
  26. Power Logger User’s Manual, FLUKE 1736/1738. Available online: https://dam-assets.fluke.com/s3fs-public/173x____umeng0200_0.pdf?2JZuc3jb6JoHuQ163Haf5bzCdt1HSMvE (accessed on 8 April 2024).
  27. IEEE Std 1159-2019; IEEE Recommended Practice for Monitoring Electric Power Quality. IEEE Std: Piscataway, NJ, USA, 2009; pp. 1–98.
  28. EN 50160; Voltage Characteristics in Public Distribution Systems. UK. 2004. Available online: https://powerquality.blog/2021/07/22/standard-en-50160-voltage-characteristics-of-public-distribution-systems/ (accessed on 8 April 2024).
  29. ANSI C84.1; American National Standard for Electric Power Systems and Equipment. ANSI: Washington, DC, USA, 2020.
  30. Kuwałek, P.; Wiczyński, G. Dependence of Voltage Fluctuation Severity on Clipped Sinewave Distortion of Voltage. IEEE Trans. Instrum. Meas. 2021, 70, 2006008. [Google Scholar] [CrossRef]
  31. Wiczyński, G.; Kuwałek, P. Voltage Distortion Influence on Flicker Severity Measurement by AMI Energy Meters. IEEE Trans. Ind. Electron. 2022, 69, 10684–10693. [Google Scholar] [CrossRef]
  32. Szolik, I.; Kovac, K.; Smiesko, V. Influence of noncoherent sampling upon an error of power quality parameters measurement. Meas. Sci. Rev. 2005, 5, 35–38. [Google Scholar]
  33. Sun, J.; Sun, H.; Jiang, J. An improved modulation method for low common-mode current non-isolated series simultaneous power supply dual-input inverters for new energy generation applications. Electr. Eng. 2024. [Google Scholar] [CrossRef]
Figure 1. Correct installation of a power meter on the three-phase four-wire network.
Electronics 13 01501 g001
Figure 2. Voltage discontinuity fault on phase A (dashed).
Electronics 13 01501 g002
Figure 3. Current polarity fault on phase A (dashed).
Electronics 13 01501 g003
Figure 4. Voltage sequence fault on phases A and B.
Electronics 13 01501 g004
Figure 5. Voltage phase rotation—A, B, C; current phase rotation—B, C, A.
Electronics 13 01501 g005
Figure 6. Polarity mismatch between the voltage and current systems.
Electronics 13 01501 g006
Figure 7. MATLAB/SIMULINK model used to study meter installation faults.
Electronics 13 01501 g007
Figure 8. MATLAB/SIMULINK, examples of installation faults: (a) phase A shutdown; (b) phase A reversal; (c) the reversal of phases A and B; (d) voltage polarity in opposition to current polarity.
Electronics 13 01501 g008aElectronics 13 01501 g008b
Figure 9. Schematic diagram of the laboratory experimental setup.
Electronics 13 01501 g009
Table 1. Predicted power meter readings under common installation fault conditions.
Fault TypeV CircuitsI CircuitsS K 2 V , %
K 0 V , %
ABCABCK
Discontinuity Faults (DF)x

x


x
2/3050
x

x


x
2/300
x

x


x
x

x


x
2/3050
x
x
x

x

x
x
1/30100
x
x
x

x

x
x
1/300
x
x


x
x


x
x


x

x
x


x

x

x
1/3050
Polarity Faults
(PF)
x

x


x


1/30200
x

x


x
1/300
Vector
Sequence Faults
(VSF)
B
C
A

C

A
B
0-
B
C
A

C

A
B
0-0
Mismatch Faults
(MF)
U A
U A
U A
U B
U B
U B
U C
U C
U C
I A
I B
I C
I B
I C
I A
I C
I A
I B
1 π
2 π /3
−2 π /3
0
Table 2. Predicted magnitude, K, and phase, ∆, of the compliance coefficient, K ¯ , under combined fault conditions.
Fault Type on I Input1. DF2. PF3. VSF4. MF (ABCV)
Fault Type on V Input ABCABCABBCCA-(ABC)BCACAB
K K K K K K K K K K K K
1. DFA2/301/301/302/300-0-1/3 π 3 1/3 π 1/3 π 3 2/3 π 2/3 2 π 3 2/3 2 π 3
B1/302/301/300-2/300-1/3 π 3 1/3 π 3 1/3 π 2/3 π 2/3 2 π 3 2/3 2 π 3
C1/301/302/300-0-2/301/3 π 1/3 π 3 1/3 π 3 2/3 π 2/3 2 π 3 2/3 2 π 3
2. PFA2/300-0-101/3 π 1/3 π 2/3 π 3 2/3 π 2/3 π 3 1/3 π 1/3 2 π 3 1/3 2 π 3
B0-2/300-1/3 π 101/3 π 2/3 π 3 2/3 π 3 2/3 π 1/3 π 1/3 2 π 3 1/3 2 π 3
C0-0-2/301/3 π 1/3 π 102/3 π 2/3 π 3 2/3 π 3 1/3 π 1/3 2 π 3 1/3 2 π 3
3. VSFAB1/3 π 3 1/3 π 3 1 / 3 π 2/3 π 3 2/3 π 3 2/3 π 101 2 π 3 1 2 π 3 0-0-0-
BC1/3 π 1/3 π 3 1/3 π 3 2/3 π 2/3 π 3 2/3 π 3 1 2 π 3 101 2 π 3 0-0-0-
CA1/3 π 3 1/3 π 1/3 π 3 2/3 π 3 2/3 π 2/3 π 3 1 2 π 3 1 2 π 3 100-0-0-
4. MF (ABCI)-(ABC)2/3 π 2/3 π 2/3 π 1/3 π 1/3 π 1/3 π 0-0-0-101 π 3 1 π 3
BCA2/3 2 π 3 2/3 2 π 3 2/3 2 π 3 1/3 2 π 3 1/3 2 π 3 1/3 2 π 3 0-0-0-1 π 3 101 2 π 3
CAB2/3 2 π 3 2/3 2 π 3 2/3 2 π 3 1/3 2 π 3 1/3 2 π 3 1/3 2 π 3 0-0-0-1 π 3 1 2 π 3 10
Table 3. Comparison of the simulated and experimental results.
Fault TypeMeter’s
V Input
Meter’s
I Input
ExperimentSimulation
P, Q K 2 V , % / K 0 V , %P, Q K 2 V , % / K 0 V , %
ABCABCABCSABC
K ( )
SABC
K ( )
1. DFno distortion0.423−0.1160.433−0.1120.43−0.1091.286 − j0.337
1(0)
0.8/1.310 + j3
1(0)
0/0
x 000.434−0.1120.428−0.1100.862 − j0.222
≈⅔ (0)
49.5/50.66.67 + j2
⅔ (0)
50/50
x 0.425−0.1160.433−0.113000.858 − j0.229
≈⅔ (0)
49.2/50.86.67 + j2
⅔ (0)
50/50
x 000.4280.1000.4290.1050.857 − j0.205
≈⅔ (0)
1.1/0.56.67 + j2
⅔ (0)
0/0
x 0.4330.100000.4280.1050.861 − j0.205
≈⅔ (0)
0.9/0.66.67 + j2
⅔ (0)
0/0
x x 0.4310.10500000.431 − j0.105
≈⅓ (0)
100/1003.34 + j1
⅓ (0)
100/100
xx 00000.4290.1060.429 − j0.106
≈⅓ (0)
0/03.34 + j1
⅓ (0)
0/0
x x 00000.3720.1060.372 + j0.106
≈⅓(0)
50.9/49.13.34 + j1
⅓ (0)
50/50
x −0.4230.1170.436−0.1150.432−0.109−0.445 − j0.107
≈⅓(0)
0.7/1.43.34 + j1
⅓ (0)
0/0
2. PF (I)x --------3.34 + j1
⅓ (0)
200/200
x x --------−3.34 − j1
⅓ (0)
200/200
B A −0.316−0.318−0.1150.4350.432−0.113−0.001 + j0.004
≈0(0)
0
3. VSF B A −0.1110.431−0.312−0.3160.435−0.113−0.012 + j0.002
≈0(0)
0/000/0
U A U B U C I A I B I C −0.4270.117−0.4380.115−0.4330.112−1.298 + j0.344
≈1(π)
0.7/1.1−10 − j3
1(π)
0/0
4. MF U A U B U C I B I C I A −0.318−0.314−0.313−0.322−0.314−0.316−0.945 − j0.952
≈1(⅔π)
0.7/0.9−7.62 + j7.23
1(⅔π)
0/0
U A U B U C I C I A I B −0.1090.429−0.1210.435−0.1190.428−0.349 + j1.292
≈1(−⅔π)
0.9/0.7−2.45 − j10.0
1(−⅔π)
0/0
U B U C U A I A I B I C −0.1140.427−0.1140.429−0.1210.428−0.349 + j1.284
≈1(−⅔π)
0.8/1−2.41-j10.16
1(−⅔π)
0/0
Disclaimer/Publisher’s Note: The statements, opinions and data contained in all publications are solely those of the individual author(s) and contributor(s) and not of MDPI and/or the editor(s). MDPI and/or the editor(s) disclaim responsibility for any injury to people or property resulting from any ideas, methods, instructions or products referred to in the content.

