Article

S3DK: An Open Source Toolkit for Prototyping Synchrophasor Applications

by
Maxime Baudette
1,*,†,
Luigi Vanfretti
2,† and
Shashank Tyagi
3
1
Lawrence Berkeley National Laboratory, 1 Cyclotron Road, Berkeley, CA 94720, USA
2
School of Electrical, Computer, and Systems Engineering, Rensselaer Polytechnic Institute, Troy, NY 12180, USA
3
EirGrid Group, Dublin D04 FW28, Ireland
*
Author to whom correspondence should be addressed.
These authors contributed equally to this work.
Electronics 2024, 13(8), 1513; https://doi.org/10.3390/electronics13081513
Submission received: 18 February 2024 / Revised: 10 April 2024 / Accepted: 12 April 2024 / Published: 16 April 2024
(This article belongs to the Special Issue Intelligent Control of Power Grid and Renewable Energy System)

Abstract

:
Synchrophasor data contain a trove of information on the power system and its dynamics. These measurements have a high potential to unlock our ability to cope with changing system conditions and challenges posed by distributed and intermittent energy sources. While Phasor Measurement Units (PMUs) have seen a large deployment in the grid, their applications are limited by the software platforms that are deployed in control centers to monitor the grid. In this paper, we present an open source toolkit that enables fast prototyping of PMU applications. The toolkit is akin to a software development kit (SDK) for synchrophasor applications, providing a number of functionalities that enable high-level PMU application development within the LabVIEW environment. This Smart-grid Synchrophasor SDK (S3DK) proposes a paradigm based on the concept of distributed applications, which allows development and deployment to be independent of the existing software stack deployed in control centers and to leverage PMU data at any level of a synchrophasor system hierarchy. This paper serves to introduce the S3DK, which is released as open source software to facilitate broader and fast prototyping of synchrophasor applications.

1. Introduction

The power grid is rapidly evolving with the addition of new technologies that relate to the many facets of the grid operation. One notable development is the broad deployment of measurement equipment, namely Phasor Measurement Units (PMUs). These units are characterized primarily by their ability to synchronously “measure” synchrophasors: a phasor representation of the three-phase system in the form of voltage and current (both magnitude and angle estimates). The deployment of the technology was originally motivated by a need for higher-fidelity measurements than those available from conventional supervisory control and data acquisition (SCADA) systems, with the goal of capturing evolving grid dynamics across wide geographical regions [1], an effort that gained impetus in the aftermath of the Northeast blackout of 2003 [2,3]. The time-synchronized and high-sample rate data were also as a means to facilitate more advanced computations to support situational awareness through wide-area monitoring [4] so as to accommodate the operation of the grid with thinner security margins [5]. This is becoming especially relevant for the changes that have happened in the grid in the past decades, such as the expansion of synchronously interconnected grids, and the influx of inverter-based intermittent generation (e.g., renewables such as wind [6,7] and solar photovoltaic systems [8]).
Prior to the deployment of synchrophasor systems, grid operators relied primarily on SCADA systems, often coupled with a state estimation algorithm, to monitor and operate the grid. These tools do not allow for advanced monitoring functionalities as the measurements are collected in an asynchronous process, and only provide RMS values (i.e., amplitude) of the measured quantities. Synchrophasors, on the other hand, provide much richer measurements that enable the use of signal processing methods to extract more information, and combine measurements from several locations for more complex computations such as those in [9,10,11,12].

1.1. Motivation

The deployment of this technology stimulated the interest of both grid operators and researchers to develop new algorithms and tools that harness these measurements into actionable information for grid operation. The development of such applications at early stages is fundamentally related to the ability of the research community to develop and prototype their ideas. In the case of the power engineering community, its members do not necessarily possess the skill set for advanced software development. This highlights the need for broadly available tools that abstract the complexity related to developing software and handling real-time measurements so that power engineering students and researchers can access a user-friendly development environment to prototype applications with minimal training effort.
Commercial tools that support synchrophasor measurements are based on the same integrated and centralized architecture as traditional SCADA systems [13,14,15,16]. Hence, the development of new functionalities can only happen in close cooperation with their respective vendors, primarily through procurement processes, incurring high integration costs (see, for example, the case of the Grid Stability Awareness System (GSAS) [16] which integrated stability monitoring functions into OpenPDC with a cost of USD 3 Million [17], and other comparable cases [18,19]). This is not an attractive alternative for fundamental research or prototyping purposes, which led to the development of various initiatives. There are a few notable contributions to the open-source synchrophasor applications community readily available [20], but the majority lack a user-friendly development environment for advanced algorithms and interactive user interfaces, hence requiring advanced software development skills, even for the implementation of early prototypes.
This motivated the development of a new SDK that focuses on the specific needs of the power engineering community by providing access to PMU measurements in a user-friendly development environment, enabling power engineers to develop and prototype custom PMU applications.

1.2. Previous Work and Contribution

The release of this SDK is the result of a several-years-long effort that started with the development of a data mediator for the IEEE C37.118.2 standard protocol [21] for synchrophasor network communications. This data mediator, the STRONg2rid library [22], was developed to expose real-time PMU measurements through an Application Programming Interface (API) that could be further integrated into other applications. In particular, the API was populated with methods dedicated to its integration with LabVIEW in preparation for the development of the S3DK.
In this paper, we present the Smart-grid Synchrophasor SDK (S3DK): an open source LabVIEW extension that enables the development of PMU applications. It provides the facilities to handle real-time PMU data, while the configuration is carried out through a Graphical User Interface (GUI), and allows to leverage LabVIEW and its numerous toolboxes for signal processing, data analysis, and graphical outputs. The source code and the compiled installation files were released as an open-source project to further facilitate its adoption by researchers. Finally, to show how the S3DK can be leveraged by members of the power engineering community, we also compiled a list of the prototype tools that were developed by the research team that developed the S3DK, as well as some prototype tools that were developed by Grid Controller of India Limited, a utility company in New Delhi, India, and other third parties.

1.3. Paper Organization

This paper is organized as follows: in Section 2, we cover synchrophasor systems and different paradigms for developing PMU applications Section 3 presents the S3DK and its main components and functionalities. In Section 4, we introduce the PMU application template that was integrated into the library package to fast-track the prototyping of applications and summarize several PMU application prototypes developed using the toolkit. In addition, prototypes of applications developed by a utility company are presented in Section 5 Finally, conclusions are drawn in Section 6.

2. Synchrophasor Systems and Applications

Through different grid modernization efforts, several grid operators have deployed PMUs in their system to build a new monitoring system based on synchrophasors [23]. These devices sample all three phases of the grid at a fixed high sampling rate to estimate a phasor representation of the phase voltages and currents at the fundamental frequency, thereby providing both magnitude and angle “measurements”). The phasor estimation is performed synchronously across all devices using a common time reference (e.g., GPS) that also provides the reference to compute phase angles, hence the name synchrophasor. This particularity allows us to use measurements from across the entire system and compute phase angle differences that are similar to those in power flow computations (i.e., line power flow equations).

2.1. Synchrophasor Systems

Traditional SCADA systems have a fully centralized architecture that is most often delivered by a single provider. The central server asynchronously collects all the measurements, presents them in a single interface and allows the operator to execute different monitoring and control actions. However, because the measurements in SCADA systems are polled asynchronously, they need to be assisted by a state estimator to create a “snapshot” of observed and non-observable physical quantities (e.g., voltages, powers) in the grid.
Synchrophasor systems differ from the SCADA architecture in multiple aspects. Most importantly, synchrophasor systems stream data from PMUs, and the data flows are organized in a hierarchical system structure based on standardized communication protocols, such as the IEEE C37.118. At the core of the system, the Phasor Data Concentrator (PDC), is the component that collects and redistributes PMU measurements implementing the communication protocol. PDCs are typically used to interface different actors of the grid, such as private plant owners, regional grid operators, and the central system operator (Independent System Operators (ISO), Transmission System Operators (TSO), etc.). Figure 1 presents a typical hierarchical structure of the measurement data collection system of synchrophasor systems.
PDCs support multiple outgoing connections, known as output streams, that allow the use of the measurements at the different levels where they are placed for various kinds of applications. There are two models for the application layer, i.e., where PMU applications are placed, that will be discussed in the following section.

2.2. Applications Development Frameworks

The development of synchrophasor networks quickly stimulated the interest in finding new PMU data applications [3]. While early development focused on data collection and archival aspects for postmortem analysis of system disturbance events [2], the focus has expanded to the development of real-time applications that help the decision making for grid operators [4], largely thanks to the advent of more processing power and higher throughput communication networks. This resulted in the development of different frameworks for developing synchrophasor applications that can either be part of the PDC platform [4,16,20], or less commonly, take the form of distributed application systems [24].

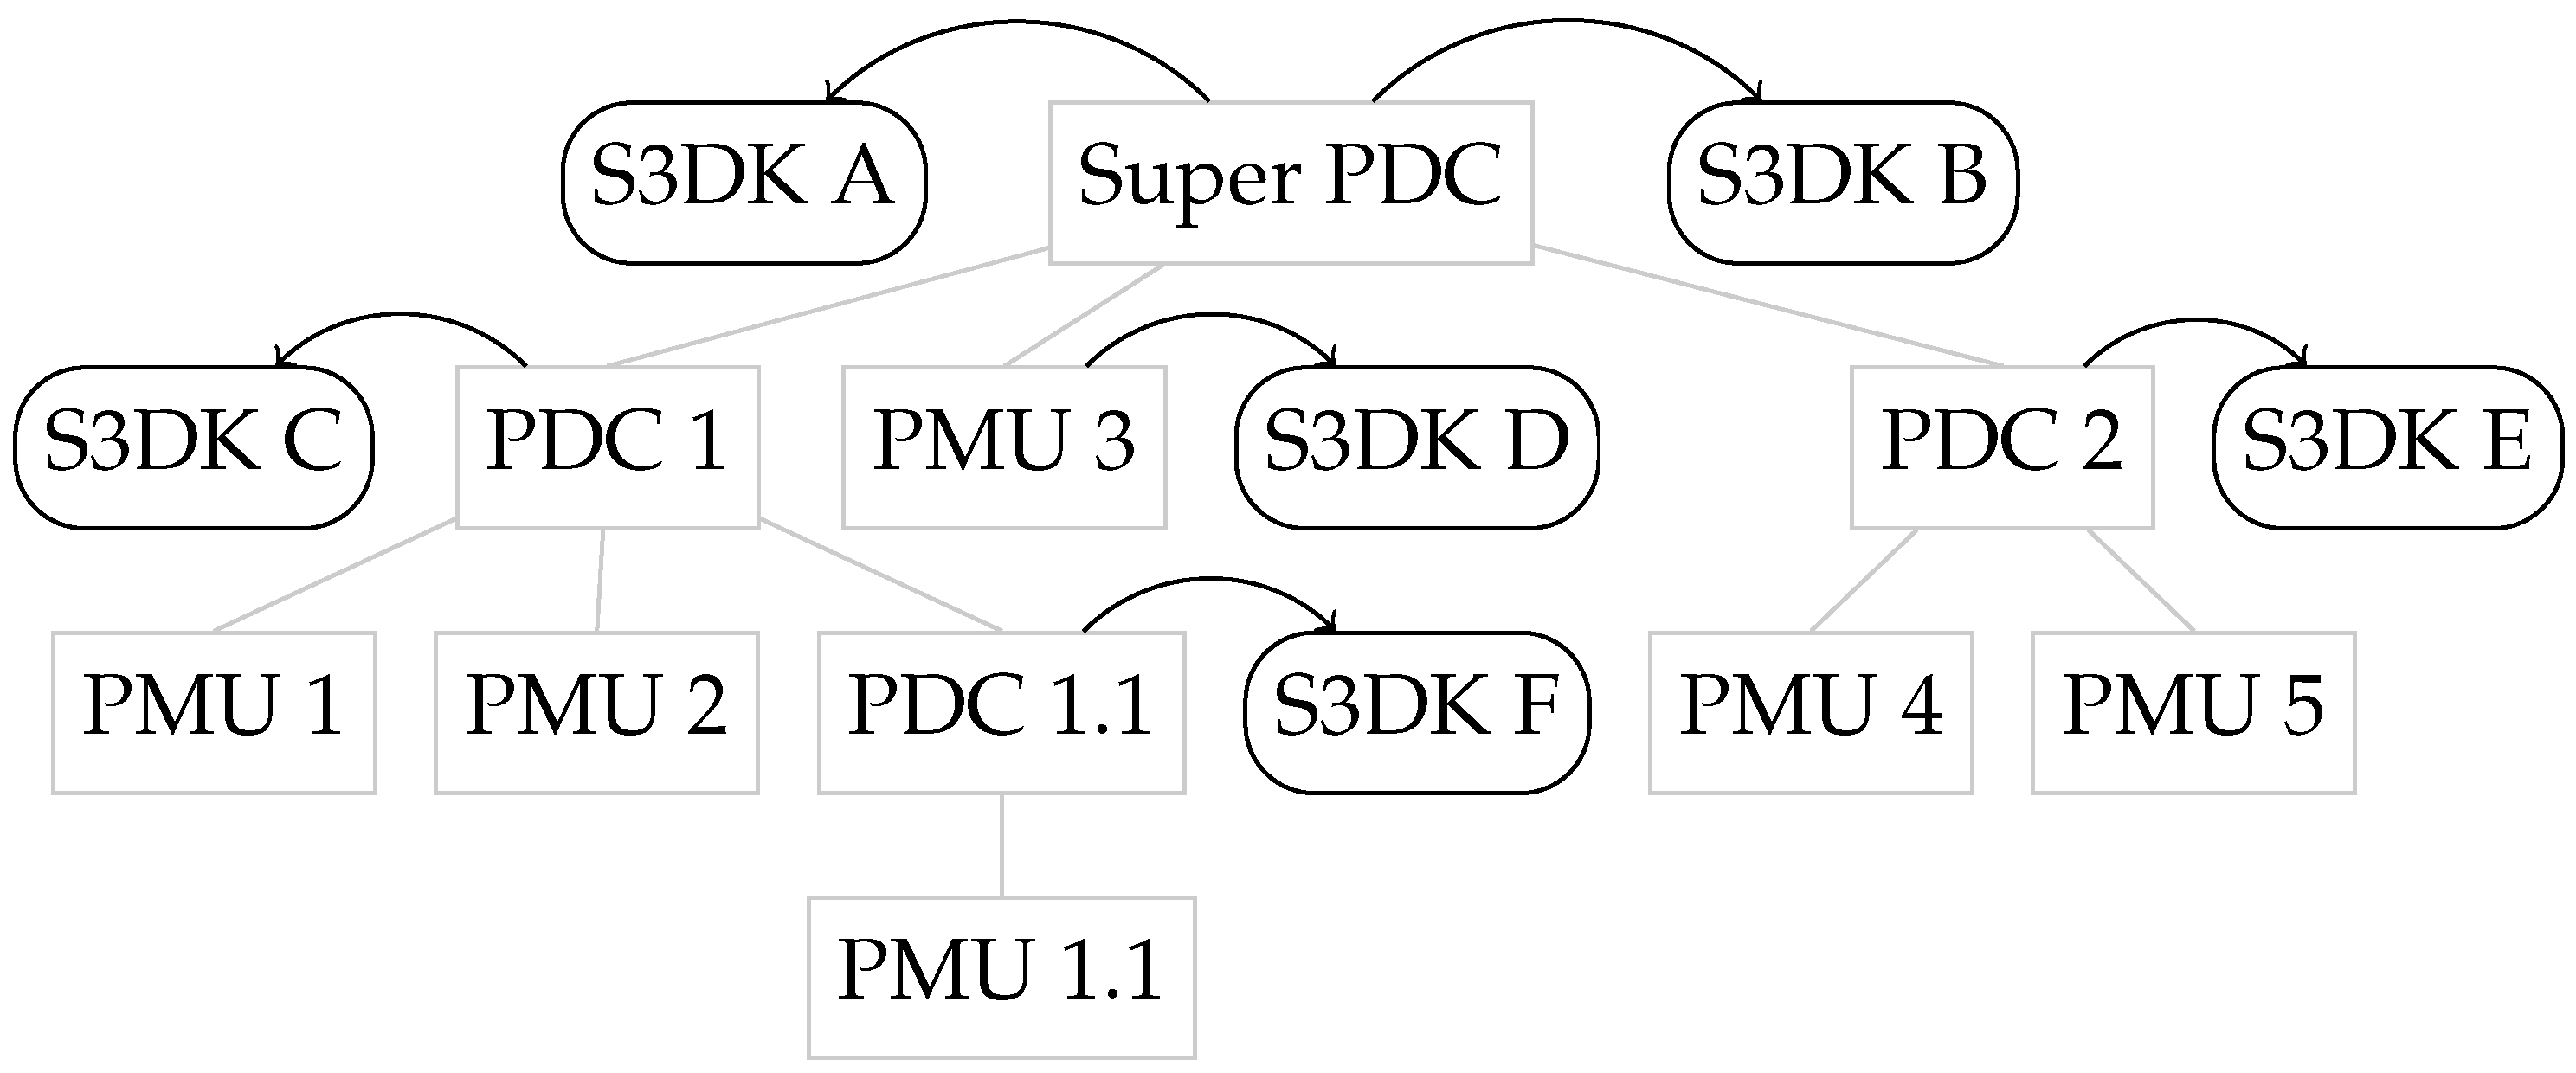
2.2.1. Centralized PDC-Based Application Development

The prevailing centralized architecture is based on applications built in the PDC component and resembles the infrastructure of existing Energy Management Services (EMS)/SCADA systems. In this model, the PDC functionalities are extended through built-in applications (e.g., plugins) that can take advantage of private Application Programming Interfaces (APIs) offered by the PDC platform [25]. This approach allows for a unique and consistent interface with the PDC that may allow faster and more granular access to the measurement data, but comes at the cost of limiting the applications’ scope to what the PDC framework can support (e.g., limited signal processing functions, etc.) without additional developments into the platforms with substantial costs [16,17,18,19].
For real-time application deployment, practically, this approach involves a single location for all computation requirements, co-located with the super PDC or PDC [16]. Thus, it has numerous implications for the development of applications by third-party contributors. While computation limitations of running concurrent applications on a single machine are no longer a source of concern, more difficulties can be expected for third parties to develop applications on often insufficiently documented platforms or those with a prohibitive cost to access. In particular, in an industrial setting, it is common in the power industry for ISOs/TSOs to rely solely on a few external vendors to develop and deploy their synchrophasor system, foregoing the possibility of broader third-party contributions and delaying the deployment of applications for real-world utilization.

2.2.2. Distributed Application Development and Deployment

The distributed application development approach differs from its centralized counterpart by relying on a real-time data mediator that consumes a PDC stream and delivers its content in a development environment. This also means that the application does not need to reside in a single location, and multiple instances of real-time data mediators can coexist and connect to any of the existing PMU/PDC system, as illustrated on Figure 2. The real-time data mediator is implemented to parse a standard communication protocol (e.g., IEEE C37.118) into native datatypes of the chosen development environment [22]. The standardized protocol ensures compatibility with any of the existing PMU/PDC systems.
This approach has many advantages for each party involved in the development and management of a synchrophasor system. From the system management perspective, it allows us to focus on the functionality of the synchrophasor system, and in particular the PDC, data collection, management and redistribution. For synchrophasor applications, it allows the deployment of a very modular infrastructure, which facilitates the deployment of more computational power, and new functionalities (i.e., new applications). This may also facilitate the creation of a very redundant system.
From the application development perspective, it allows the use of broadly available development environments that can feature very extensive computational and, in particular, signal processing capabilities. It also opens the development of new applications to any academics, researchers and software developers who no longer need to specialize in custom proprietary software environments. Finally, it facilitates the transition from a development/testing environment to a deployment in the field by allowing easily packaged applications.

2.2.3. Existing Frameworks

In this paper, we focus on open source frameworks that can be used for developing synchrophasor applications. There are a few notable contributions to the open-source community that are readily available, including the following:
  • RIAPS [24], a framework for developing distributed monitoring and control applications;
  • GridAPPS [26], a framework for developing Advanced Distribution Management Systems (ADMS) applications that combine both model simulations and measurements;
  • The OpenPDC project [27], an open-source PDC that can be extended with custom Adapters developed in C # to extend its functionalities and computations;
  • Synchro-Measurement Application Development Framework (SADF) [28], a framework to develop synchrophasor applications in MatLab.
RIAPS and GridAPPS offer a generic framework for grid applications that feature a communication facility. While these solutions do not explicitly support standardized synchrophasor streams [21], they provide tools that would allow such applications. OpenPDC offers a framework to develop applications on the centralized PDC-based model. While it offers the possibility to develop new applications using C # , this programming language is not broadly adopted in the power engineering scientific community and lacks toolboxes/libraries for advanced computations (e.g., signal processing, filtering, etc.). SADF offers a real-time data mediator for MatLab. This programming environment is widely distributed in the scientific community, most engineers and researchers are acquainted with it, and it offers a vast ecosystem of toolboxes for advanced computation. However, while SADF is open source software, it depends on MatLab that requires costly licenses that become prohibitive when using more than one of its toolboxes. Nevertheless, among these frameworks, SADF is the closest solution to the S3DK presented in this paper.

3. S3DK: Smart-Grid Synchrophasor SDK

The original concept of the Smart-grid Synchrophasor Software Development Kit was instigated to answer the needs of the research group led by the second author, to develop and test prototypes of various PMU applications. At the time (circa 2011), there was no readily available solution that allowed power system researchers, who often lack a comprehensive background in computer science and programming, to carry out any sort of rapid prototyping of synchrophasor applications. The academic community is more familiar with high-level programming languages that abstract much of the programming complexity, such as MatLab, and LabVIEW. In an attempt to make the application development the most accessible to the power system research community, it was decided to develop a software development kit (SDK) dedicated to synchrophasor applications. This vision was shared by Statnett SF, the Norwegian Transmission System Operator, who supported the development through different research projects [29].
The Smart-grid Synchrophasor SDK (S3DK) was developed for the LabVIEW programming language that provides an environment facilitating the development of computationally advanced applications with highly interactive graphical user interfaces (GUIs). While both MatLab and LabVIEW offer an environment with powerful toolboxes for advanced signal processing and computation functionalities, we selected the latter for its easy approach to designing GUIs. This is of particular importance for the target audience which is the power system academic community for fast prototyping of new ideas and concepts with minimal training. Furthermore, LabVIEW recently released a community edition of its development suite that is free to use for non-commercial use, expanding the target audience of the SDK to additional potential users in the power engineering community (since April 2020, National Instruments has released the LabVIEW Community Edition which is free of cost (for non-commercial use), which makes the use of S3DK a cost-free alternative for its potential users that lack a license for LabVIEW under certain conditions. For details see https://www.ni.com/en/support/documentation/supplemental/20/labview-community-edition-usage-details.html, accessed on 9 April 2024). Applications can also be compiled as standalone programs to be shared with external partners for easy deployment (see https://www.ni.com/en/support/documentation/supplemental/19/introduction-to-the-labview-application-builder.html, accessed on 9 April 2024).
S3DK has three main components (Figure 3) that are presented in the following sections. The main goal is to summarize the most important components, while a comprehensive description of all the components and methods included in S3DK is available online at https://alsetlab.github.io/S3DK/ (accessed on 9 April 2024).

3.1. Low-Level Communication
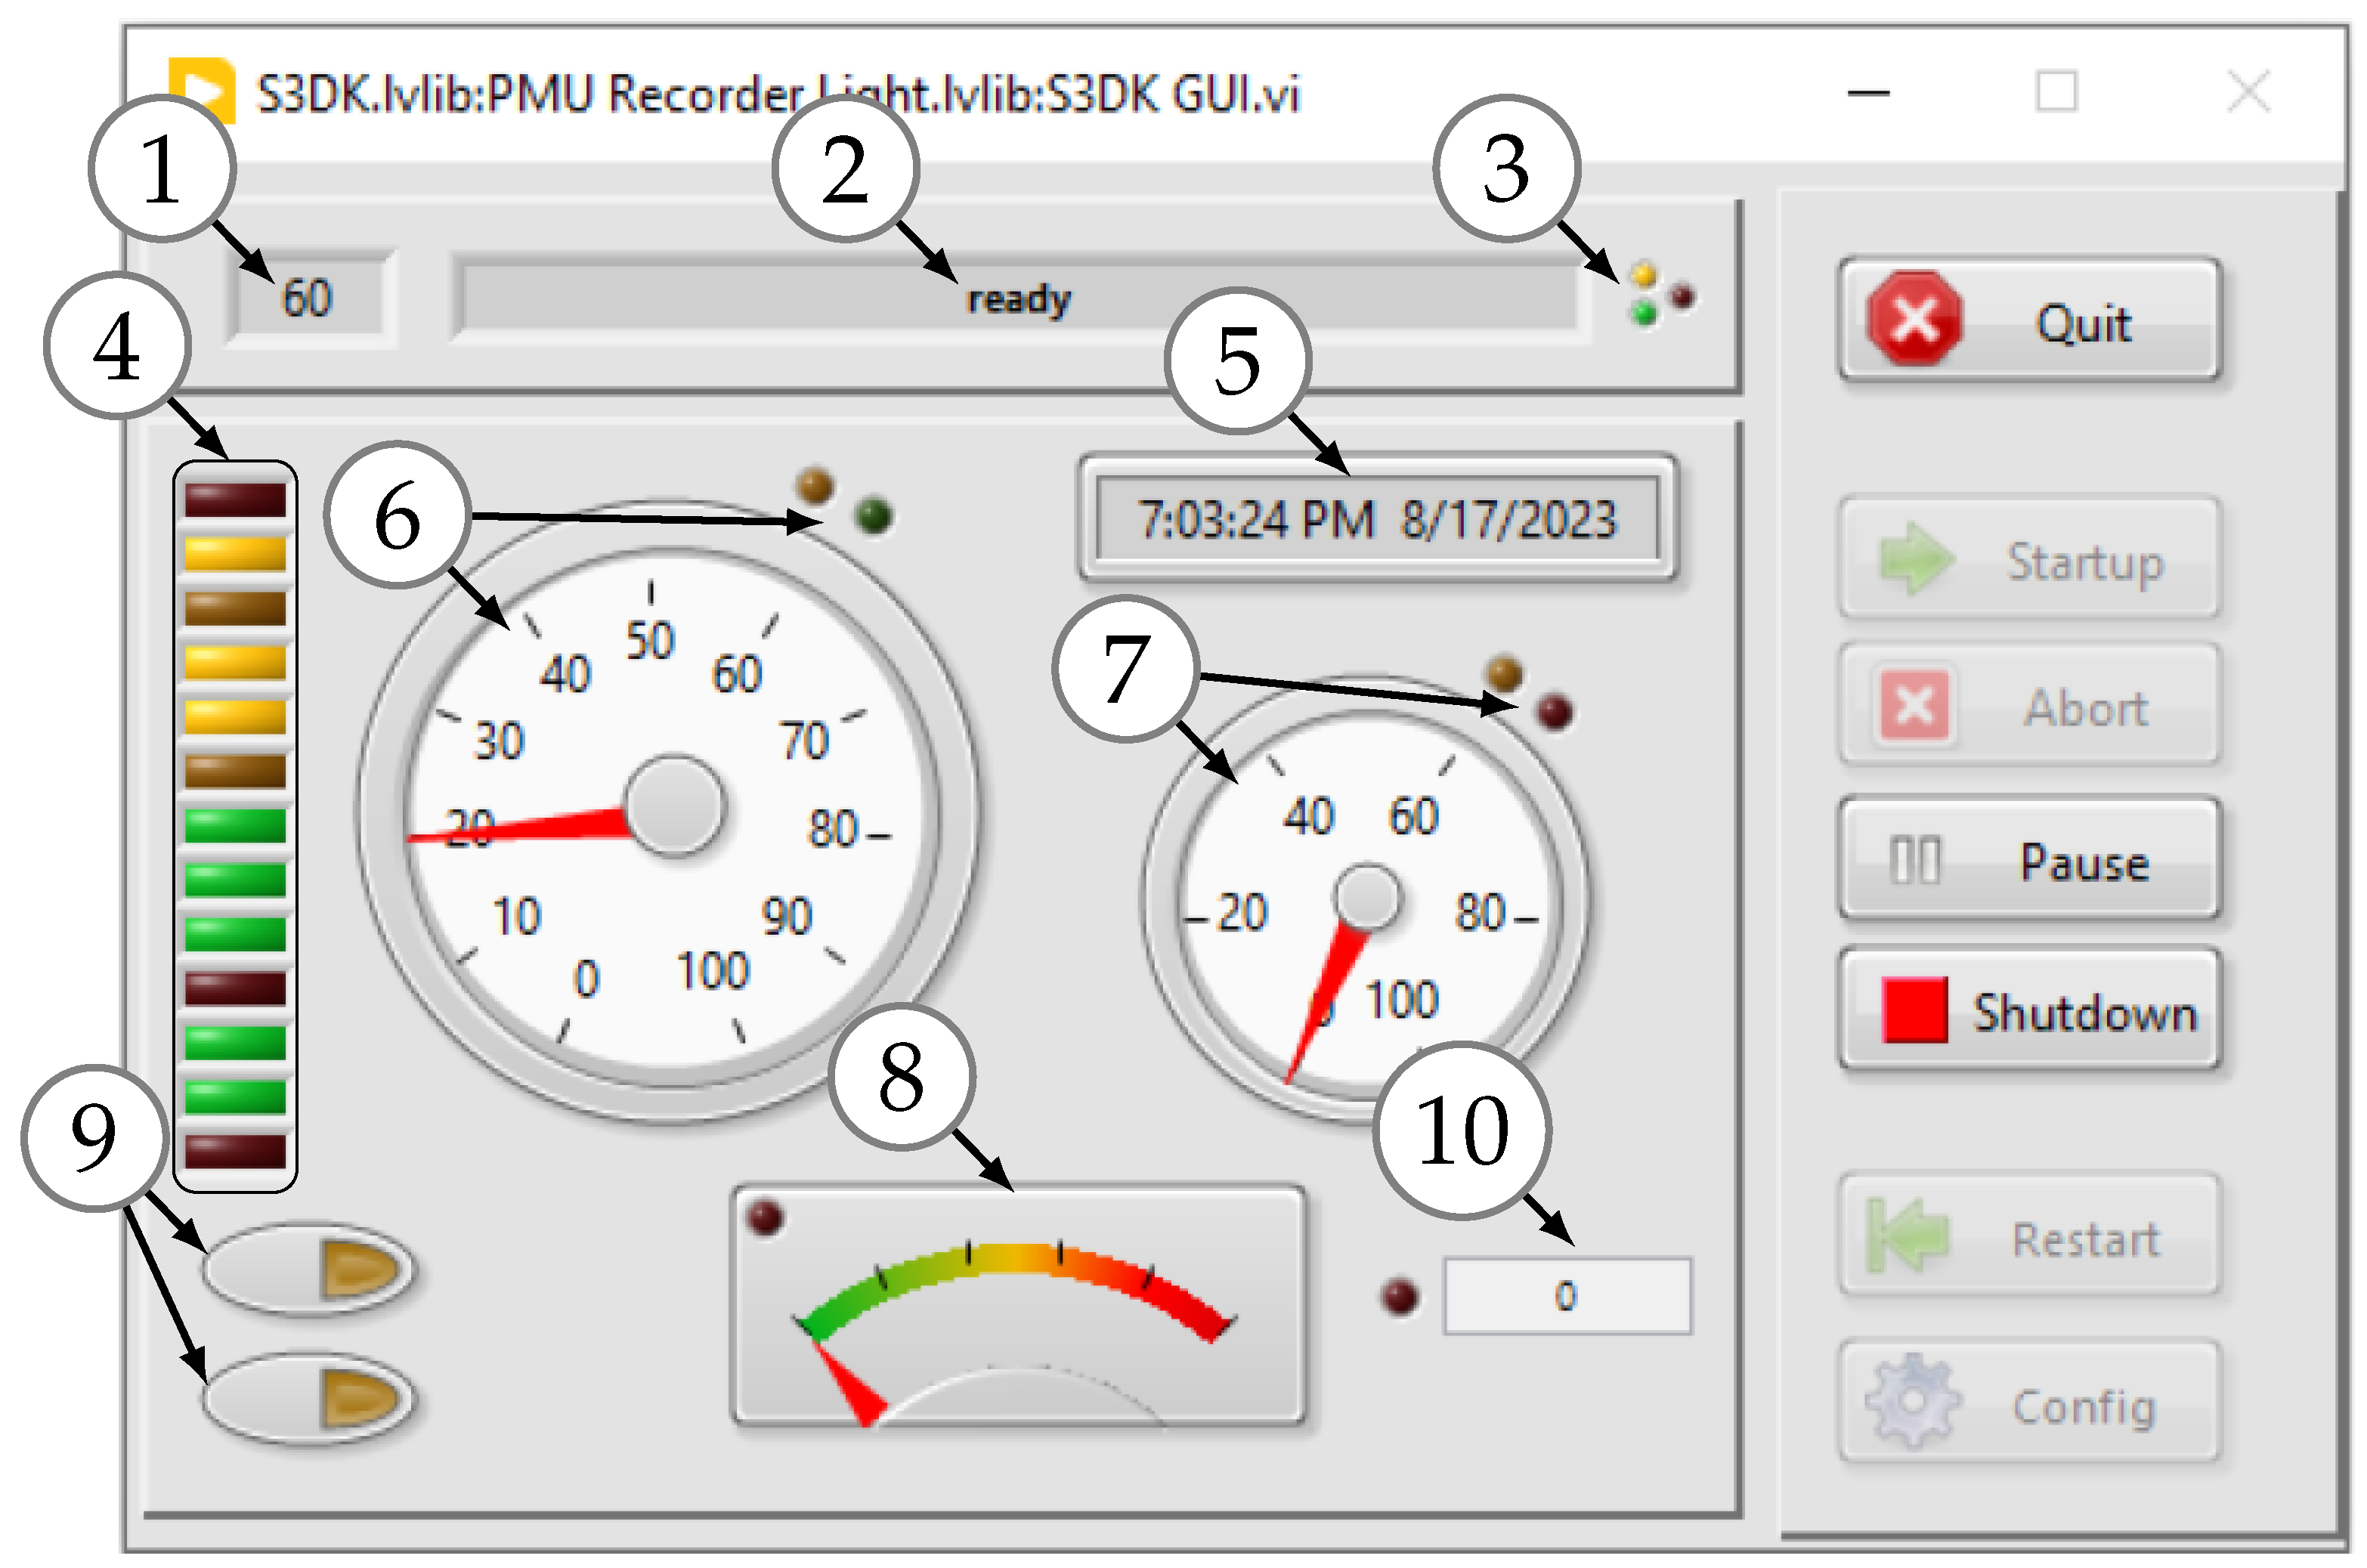
As described in Section 2.2.2, the decentralized paradigm relies on a real-time data mediator (RTDM) to receive a stream of measurements and to decode the communication protocol to deliver the data into a development environment. To this end, the S3DK leverages the STRONg2rid Library [22], an RTDM that handles low-level communication tasks and decodes IEEE C37.118.2 protocol, in addition to providing additional low-level functionalities. This library is comprised of a separate C + + module that is compiled into a Dynamic Link Library ( D L L ) and used by the other components of the SDK.
The STRONg2rid library implements all the functionalities of an IEEE C37.118.2 client to connect to a PMU/PDC stream(s) and to manage that connection. Furthermore, it was developed to be extended to manage parallel connections to multiple measurement streams synchronously and streaming functionalities to emulate a PDC. The library handles the communication and continuous polling of the measurement data, and an Application Programming Interface (API) is implemented to make the measurements accessible in a development environment. The API features a set of LabVIEW-specific methods as it was developed in conjunction with the rest of S3DK, but also features non specific methods and can easily be extended to be used in other environments.

3.2. Graphical UI

The main user-facing component of S3DK is a LabVIEW virtual instrument (VI) that implements the measurements data handling establishing a connection to a PDC stream and creating data buffers for further delivery in the development environment (i.e., LabVIEW). It has a GUI, depicted in Figure 4, that lets the user set up the PDC stream and configure some basic settings for the data handling such as batch size and various timeouts for late data and connection loss. The remainder of the interface is dedicated to managing the connection to the data stream, including some visualization of the activity level:
  • Data rate in samples per second;
  • Software state machine status;
  • General activity indicators;
  • Connection status indicators;
  • Timestamp of latest data frame received;
  • Data frame processing activity indicators;
  • Access buffer writing activity indicators;
  • Bad data rate indicator;
  • Buttons to open additional windows for channel selection and seeing raw data;
  • Bad data samples counter.
In the background, the VI orchestrates the communication with the STRONg2rid library through its API to connect to the PDC stream and collect the data in real time. It organizes the data received into a user-configurable access buffer that can store multiple hours of data, and a queue that allows real-time access to the latest unread data.
The VI can be used manually through its GUI, or can be integrated into an automated workflow through a remote facility that is accessible through a separate VI that lets the user trigger all the available user inputs pragmatically.

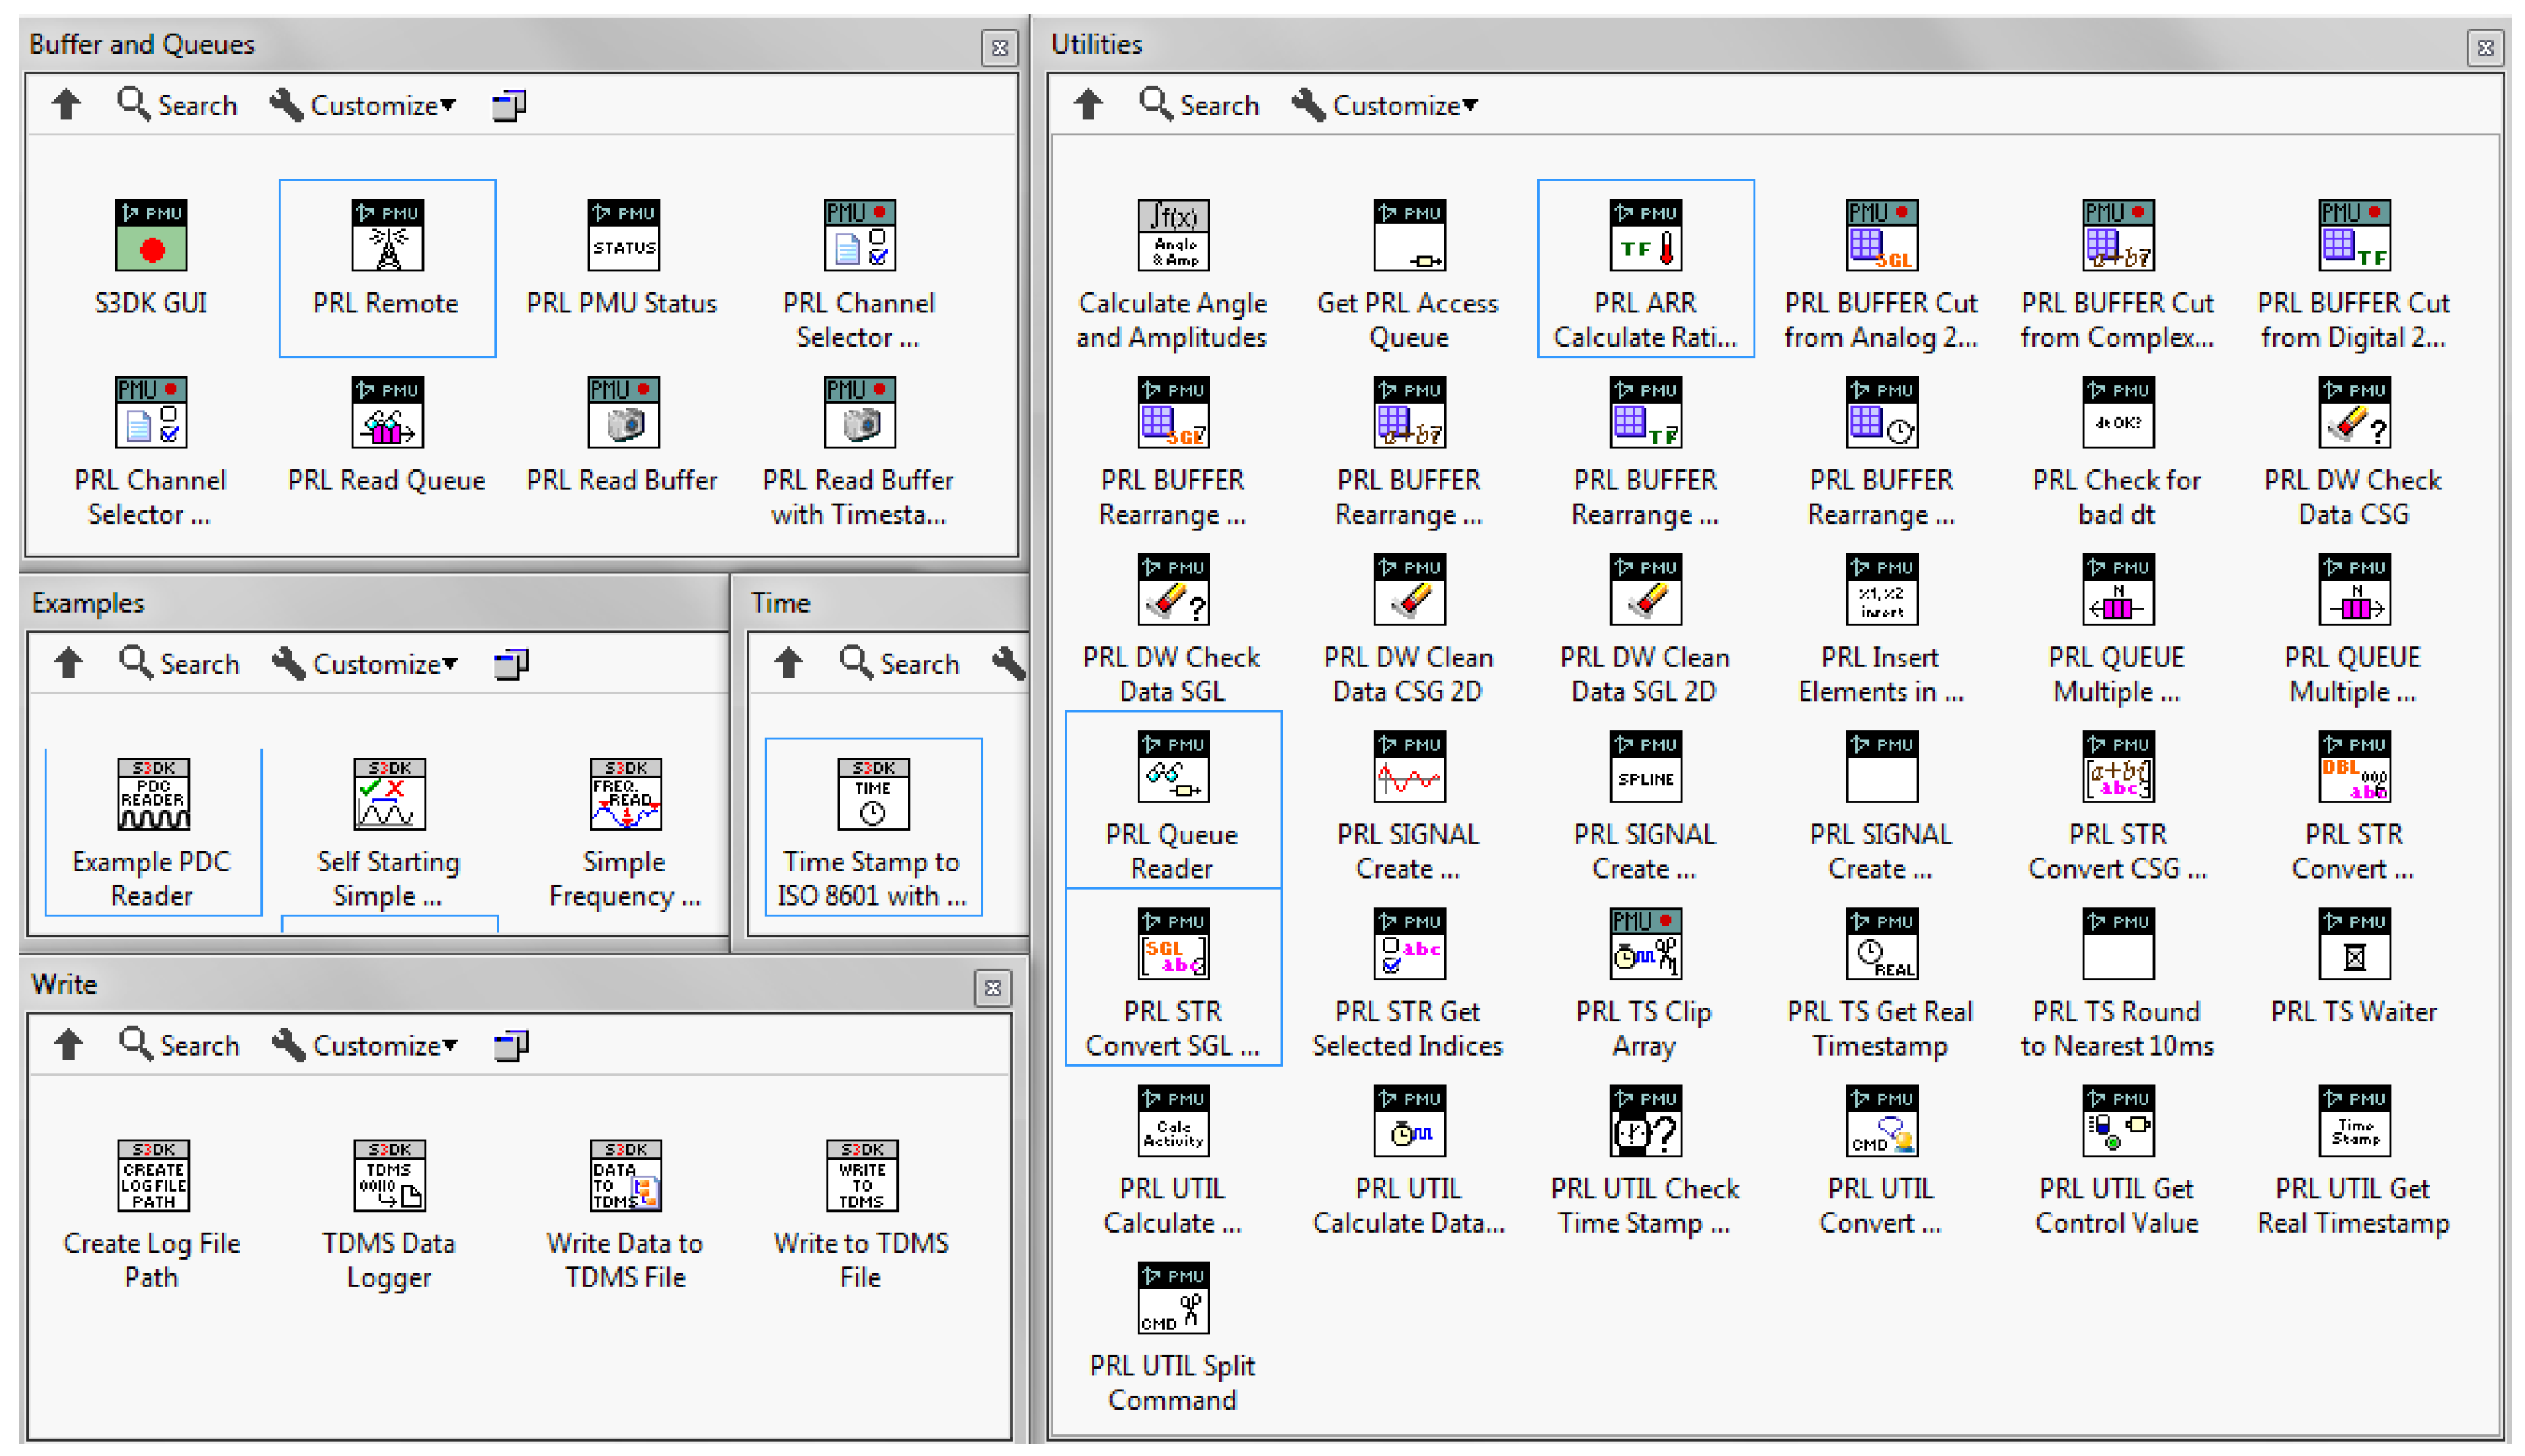
3.3. Palettes and Programming Functionalities

S3DK was developed to provide a real-time data mediator for developing PMU applications. It was developed to be integrated into the LabVIEW development environment as “palettes” (i.e., collections of VIs, akin to a MatLab toolbox or Python Library) organized into different sub-palettes by topic, shown in Figure 5. The core functionalities of S3DK are embodied by the graphical UI presented in the previous section, and a few other VIs that allow its remote control, and access to the access buffer and the queue for measurement delivery. These are grouped in the “Buffer and Queues” sub-palette.
A set of examples that demonstrate how to use the core functionalities from the “Buffer and Queues” sub-palette is available in the “Examples” sub-palette.
The development of these core functionalities required the development of several helper functions that were packaged into separate VIs. These include low-level VIs that integrate with the STRONg2rid library API, as well as a set of data manipulation VIs. The latter was deemed useful for other applications and integrated into the “Utilities” sub-palette.
The access buffer of the S3DK offers access to the measurements over a certain time horizon that is defined in the S3DK settings. The functionality relies on the LabVIEW TDMS file format to store the received measurements. The data logging was implemented in VIs, making the specific data structure used by S3DK available for the user in the “Write” sub-palette.
The “Time” sub-palette has a single VI converting the LabVIEW timestamp datatype into an ISO 8601-compliant string of characters.
Finally, the last sub-palette is dedicated to a few examples that demonstrate the use of the VIs to access the measurements and remote control GUI.

4. Templates and Research Applications
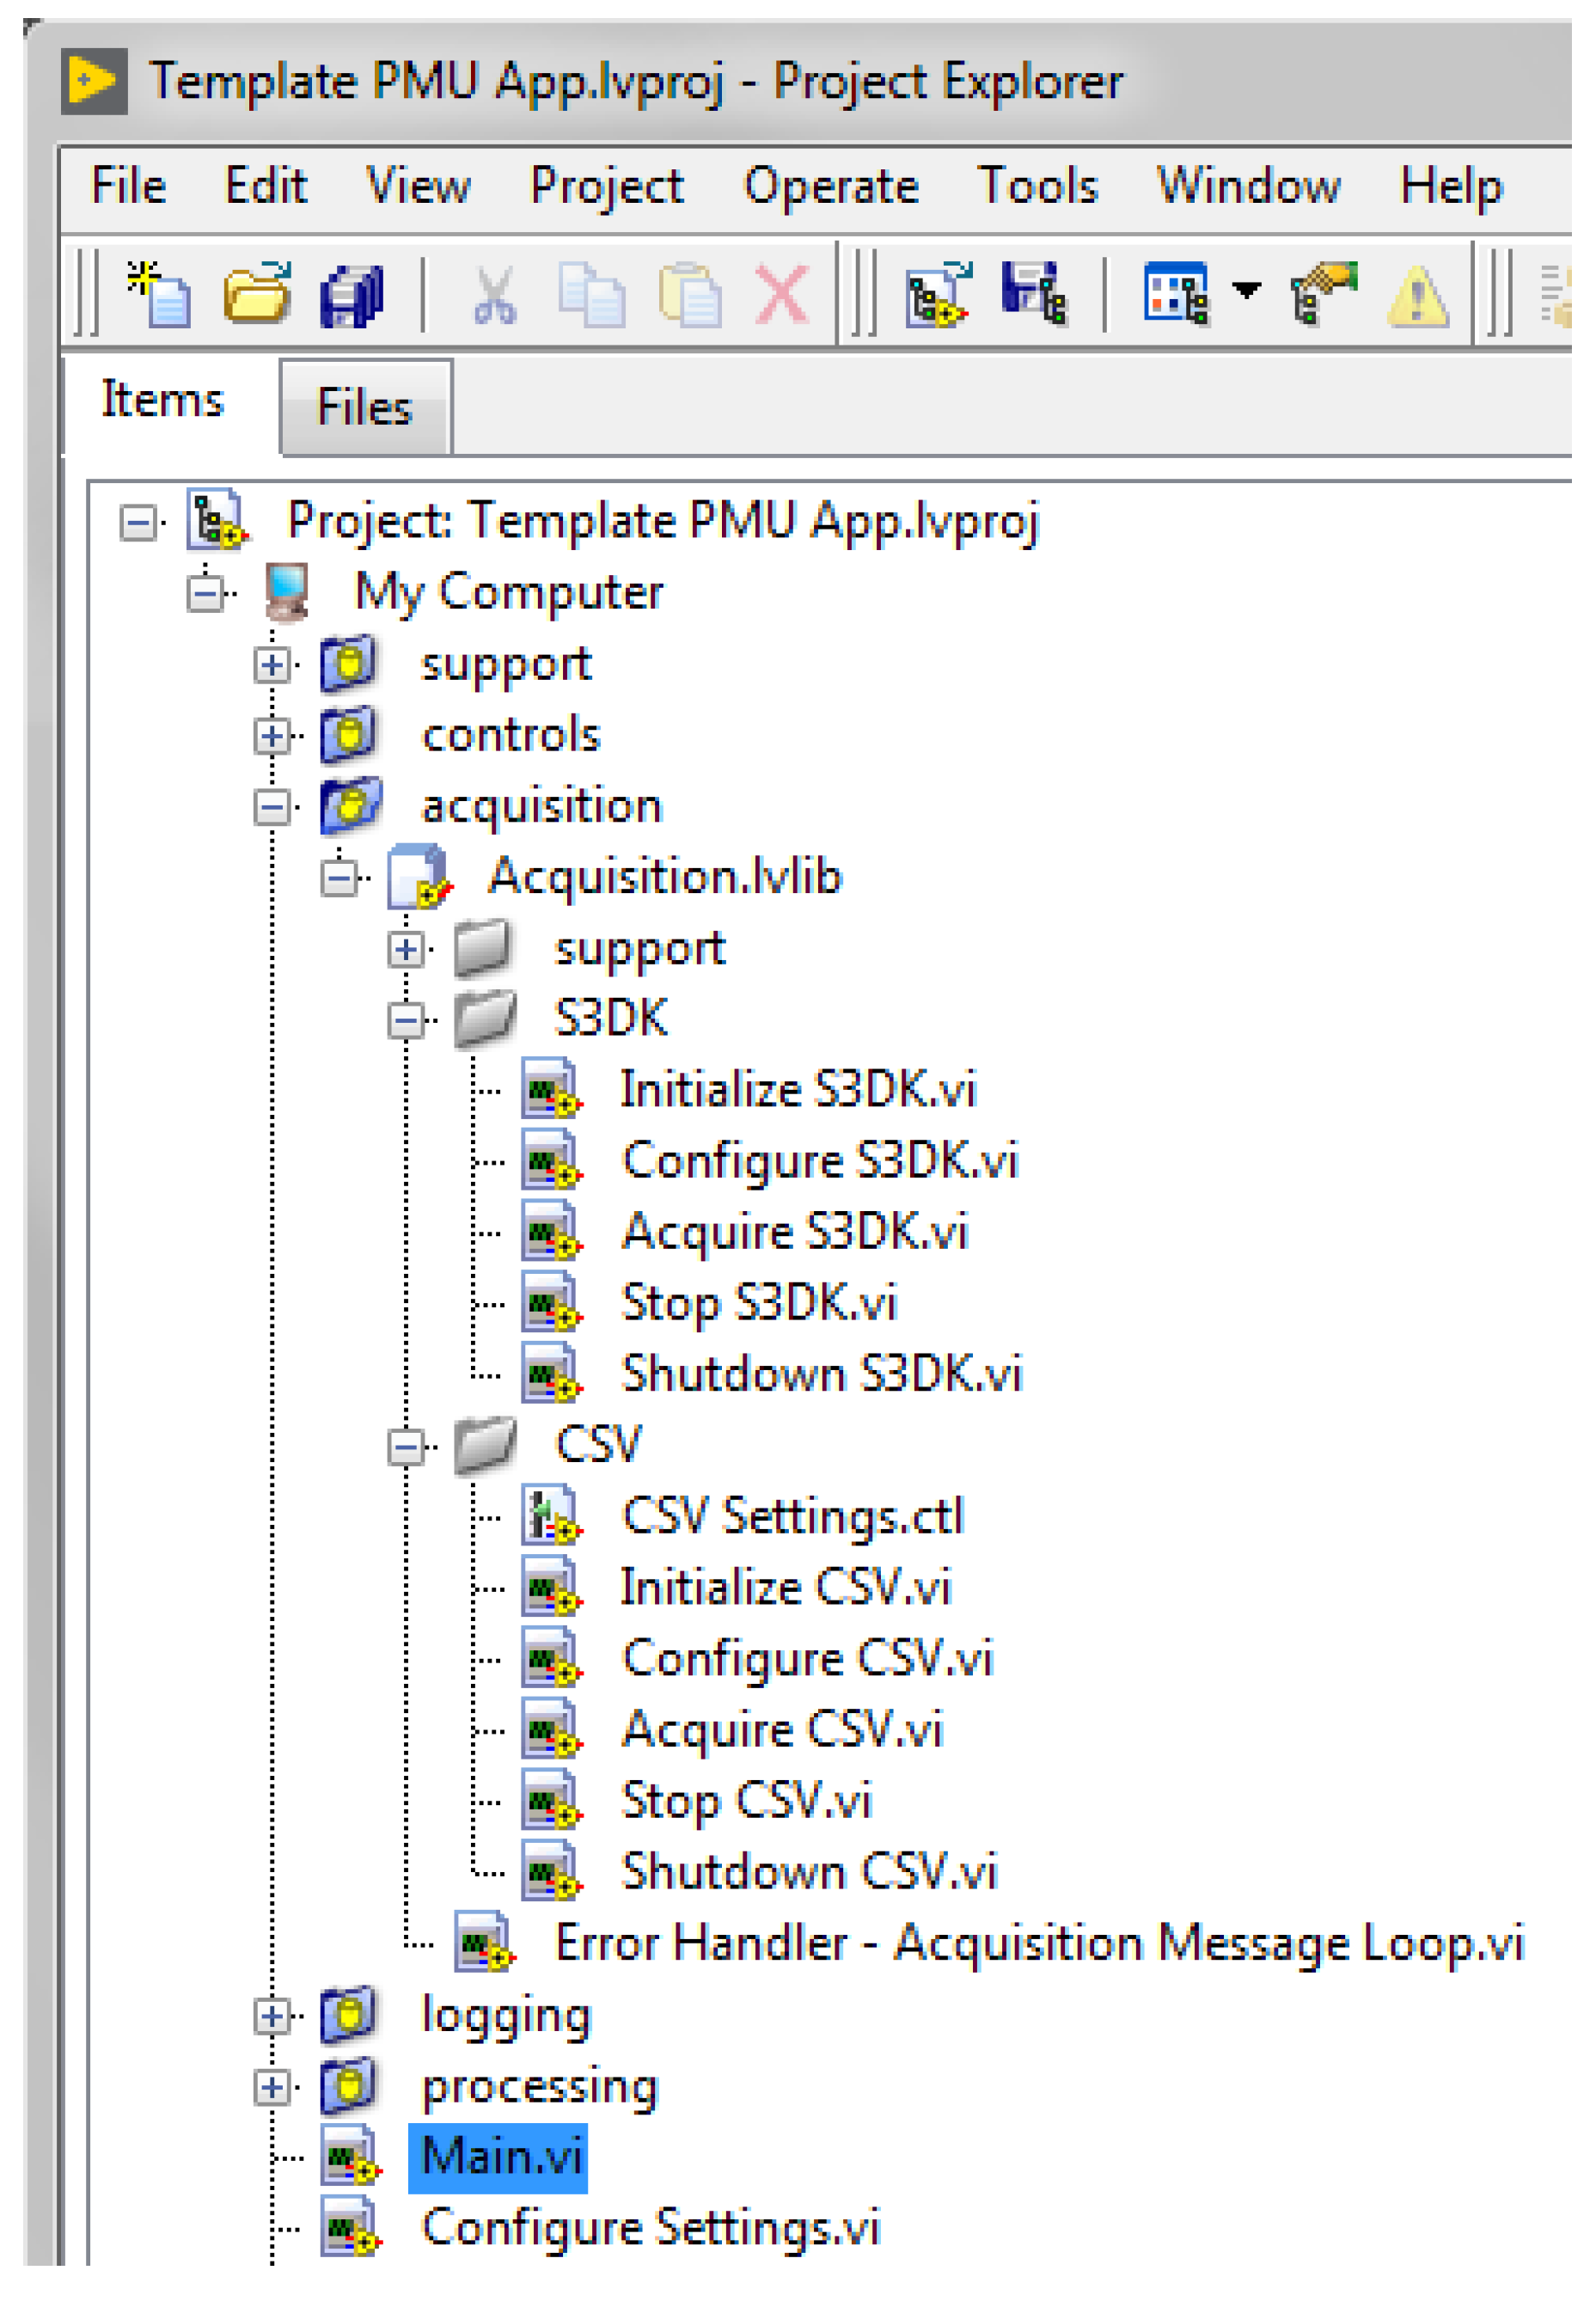
The development of S3DK was quickly followed by the development of multiple PMU applications within the second author’s research group. The access to real-time PMU measurements allowed us to test new concepts and ideas for grid monitoring and control applications. In this section, we present a few notable examples.

4.1. Templates

Templates were the first applications that were developed. A few examples are directly included with S3DK to demonstrate the use of the main blocks for simple applications and automation.
In order to further lower the entry barrier to developing and testing new ideas, we decided to develop a “Template PMU App” that provides the basis for developing generic PMU applications. This allows researchers to focus on the core algorithm to develop, rather than the data ingestion. The template is built upon LabVIEW’s own “Continuous Measurement and Logging” sample project that provides a framework for acquiring data, logging it and processing it. Thus, the template was prepared by integrating S3DK in the data acquisition loop, using its queue functionality to obtain the latest unread data.
In the original template, the logging and processing loops are independent tasks with the measurements being sent independently in each loop. In the PMU application template, the logging task was replaced by a dedicated buffer that can store a chosen number of PMU measurements. The motivation for creating an additional buffer bypassing the built-in buffer of S3DK arose from the speed of execution of the built-in version that uses storage into a local file to store the buffered measurements. This method allows us to store large amounts of data, but its access time was not suited to sub-second access due to the need to read the data from a file stored on disk. The buffer provided in the template relies on storing the measurement data in the memory, keeping its access time very short. Furthermore, an index functionality was integrated to allow tracking of which data has already been read by the processing loop(s), as well as some highly customizable data delivery methods (e.g., unread data, past X samples, etc.)
Another contribution of this template app was to integrate a file reader to replay measurements saved into a CSV file. It was integrated in the data acquisition loop where the user can switch between reading a file or acquiring real-time data from S3DK. The template automates the flushing of the data currently in the buffer to replace them with the newly selected data and automates the data reading to simulate a “real-time” replay of the recorded measurement data akin to a live stream.
The template PMU app is distributed as a LabVIEW project as shown in Figure 6.

4.2. Monitoring Applications

As the first users of the S3DK, the research team led by the second author (graduate students, research engineers, post-docs, etc.) implemented a series of prototype applications demonstrating the different usages of PMU measurements for monitoring the grid.
Inspired by traditional monitoring solutions from grid control centers traditionally using SCADA measurements, a dashboard including a map of the Nordic countries was developed to display real-time measurements of the system coming from PMUs that were deployed as part of the STRONg2rid project [29]. The dashboard was primarily designed to display the frequency measured at different location, with configurable alarms for values exceeding the normal range of operation, i.e., [49.95–50.05 Hz]. A remote panel was also implemented by taking advantage of LabVIEW’s built-in facilities for streaming data through a standard internet browser, as well as an iPad data dashboard.
Further developments focused on more advanced and more computationally intensive applications with the following applications:
  • Monitoring tool: a tool developed to detect power oscillations (e.g., inter-area, sub-synchronous, etc.). In particular, it was applied to a case of detection of wind farm oscillations in [7].
  • Mode estimation: a tool developed to harness ambient measurements for small-signal stability monitoring by estimating the grid’s modes of oscillation [30].
  • Kalman filter: a tool implementing a method for extracting steady-state information from synchrophasor measurement, as presented in [31].
  • Steady-state model synthesis: a tool that uses the Kalman filter and estimates a T-equivalent circuit between a number of PMUs, being validated in a real-world distribution network in Switzerland [32].
  • Voltage stability monitor: a tool that allows measuring the voltage stability of distribution networks, being able to recognize if the instability is due to the transmission or distribution network [33].
  • Feeder dynamic rating: an application that uses PMU data in combination with other sensor data to provide dynamic ratings of distribution feeders [34].

4.3. Control and Protection Applications

The early applications development focused on monitoring applications as these only require a single type of communication: a stream of measurements coming from the PDC that is handled by S3DK. As the research team developed the aforementioned applications and subsequently became more acquainted with S3DK and the LabVIEW development environment, control and protection applications were the logical next step.
Note that control and protection applications not only need to read measurements, but also need a way to send control signals out to the power system (or its digital twin in the case of a simulation environment). This secondary communication channel is not part of S3DK. However, the S3DK served to acquire and process the data before being sent into different control loops; see [35] for details.
Notable examples of control applications are those dedicated to supplementary damping controls, including damping via load modulation and system-based synchronous generator excitation [35], and a STATCOM-based wide-area stabilizer in [36]. In addition, it has been used in testing a wide-area control system used as a transient stability booster [35].
Meanwhile, sample protection applications include an islanding detection and isolation scheme, and a synchronization scheme presented in [37], an automated microgrid clustering scheme in [38], an auto-reclosing scheme for active distribution networks [39], and a PMU-data assisted over-current protection device for feeders with solid-state transformers [40].

5. Industry Applications

5.1. Applications Developed by Grid Controller of India Ltd.

Engineers from the Grid Controller of India Ltd’s Northern Regional Load Dispatch Centre (NRLDC) leveraged S3DK to develop a set of monitoring applications, each answering a specific problem that presented itself in the operation of the Indian power grid.

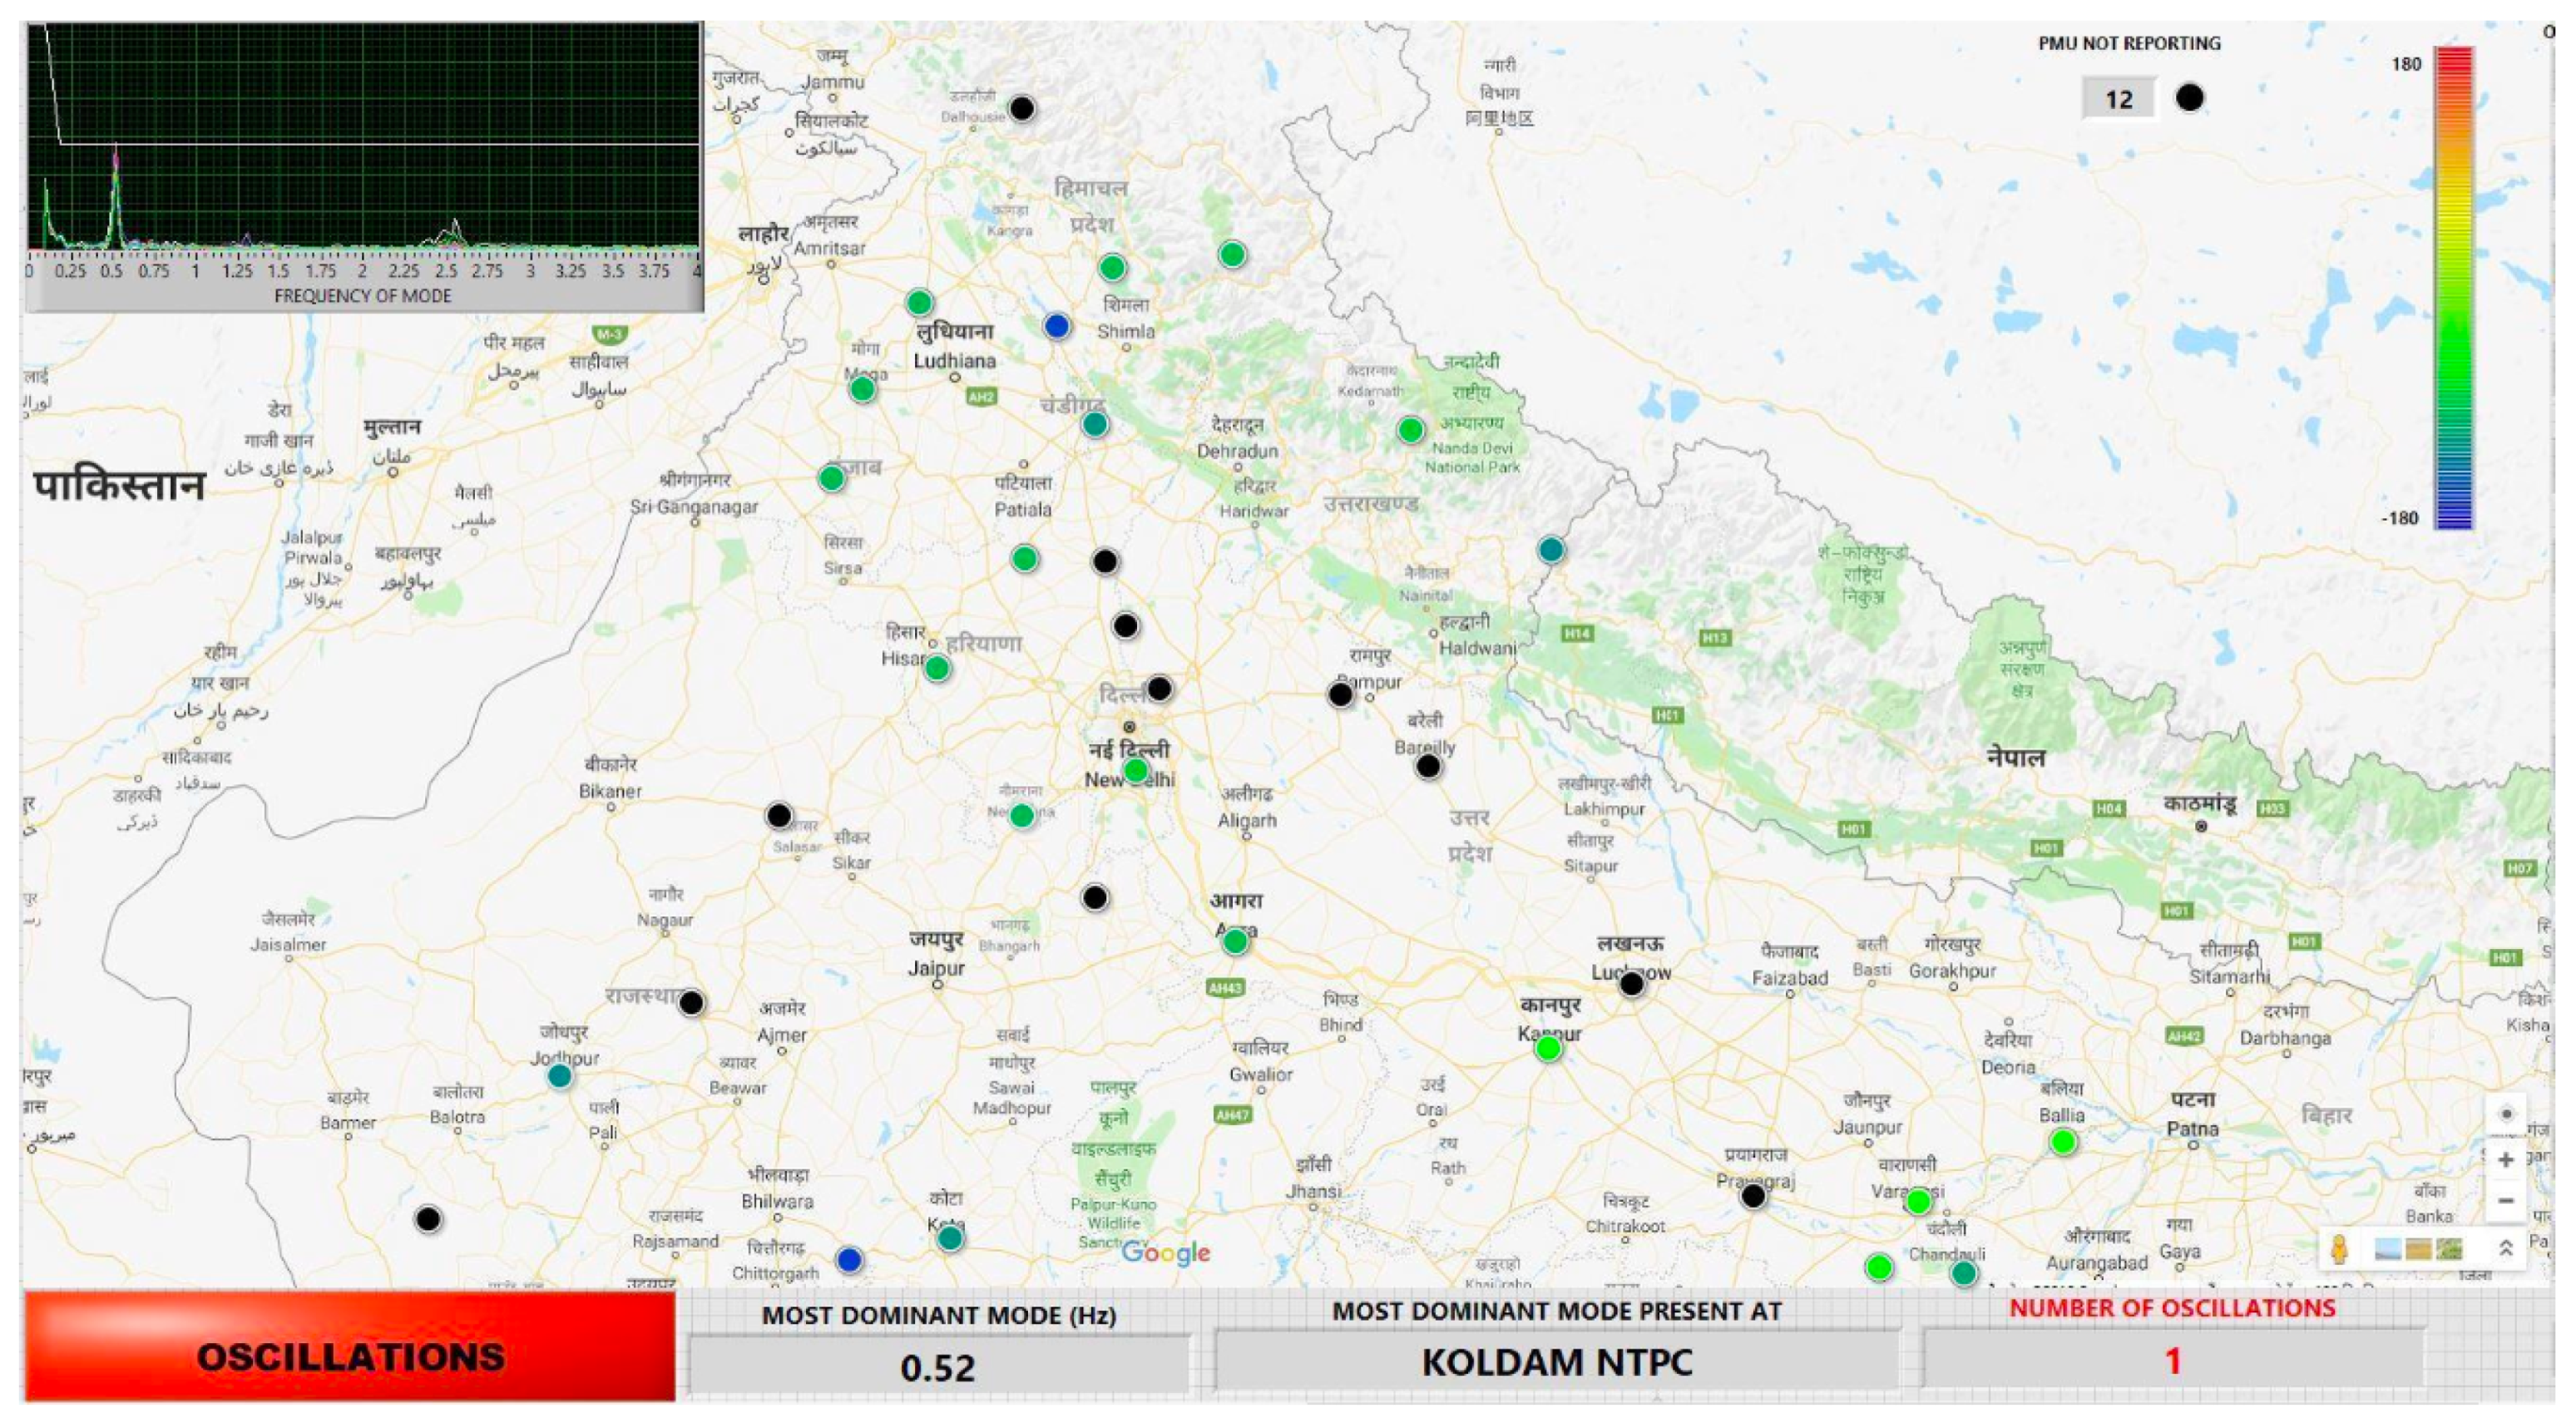
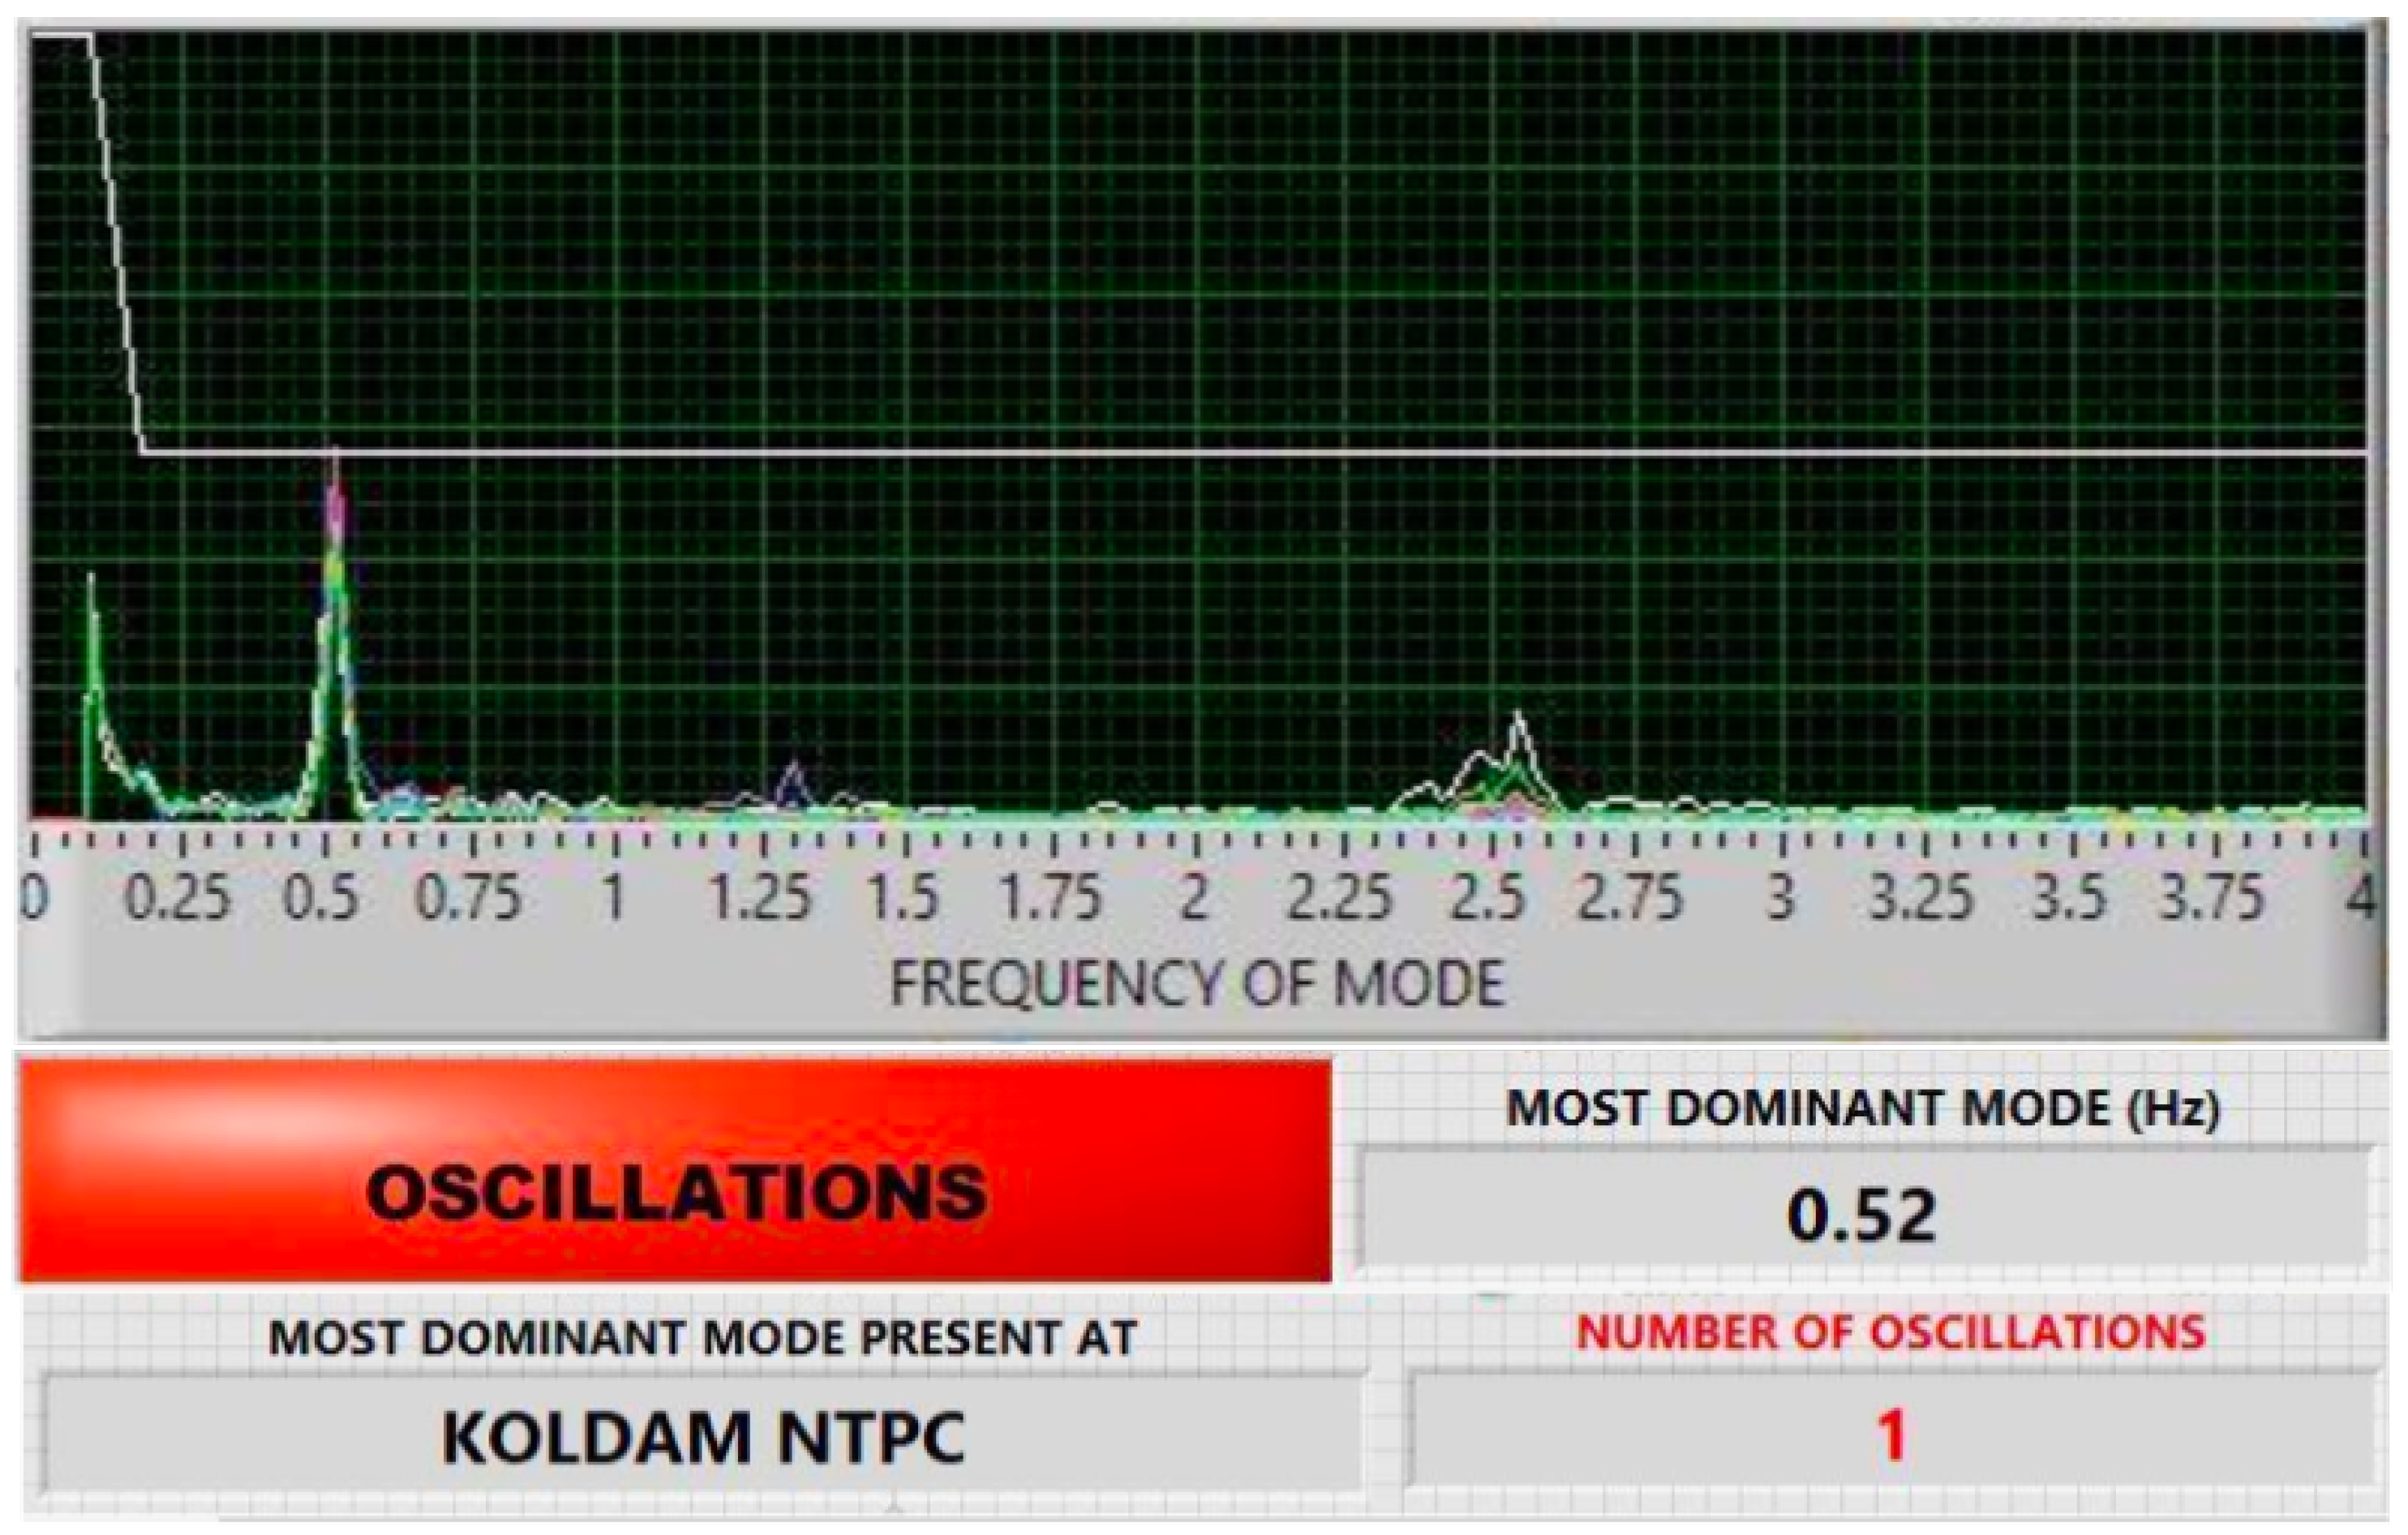
5.1.1. Oscillation Monitoring

The main development focused on an application to detect inter-area oscillations, as depicted in Figure 7. The application monitors oscillations happening in the frequency range [0.1–4] Hz, which covers inter-area modes and local modes. The main dashboard features an indicator that turns from green to red when oscillations are detected, with two accompanying displays showing the frequency of the dominant mode and the substation where the amplitude is detected to be the highest. The remainder of the GUI is dedicated to a map of the area being monitored by 35 PMUs in the north of India, with a dot indicating the position of each PMU. The dots are color-coded to represent the angle information from the detected mode of oscillation, giving visual cues as to which buses in the system are coherent during a low-frequency oscillation event.
Thanks to S3DK, three different methods for oscillation detection were evaluated: Fast Fourier Transform (FFT), Prony Analysis, and the Estimation of Signal Parameters by Rotational Invariance Technique (ESPRIT) [41]. Upon testing it was found that the Prony method was highly sensitive to noise, leading to many false positives, and while the other methods performed similarly, the FFT method was the most computationally efficient and retained as the main implementation. The frequency spectrum computed for each PMU is displayed on a detailed view of the application as depicted in Figure 8. More details on this application can be found in [42].

5.1.2. Other Applications

Additional applications were developed by the same engineering team in an attempt to assist in the configuration and calibration of various protection schemes in the grid. Differently from the previous section, these applications were developed as prototypes that are not yet in the production environment:
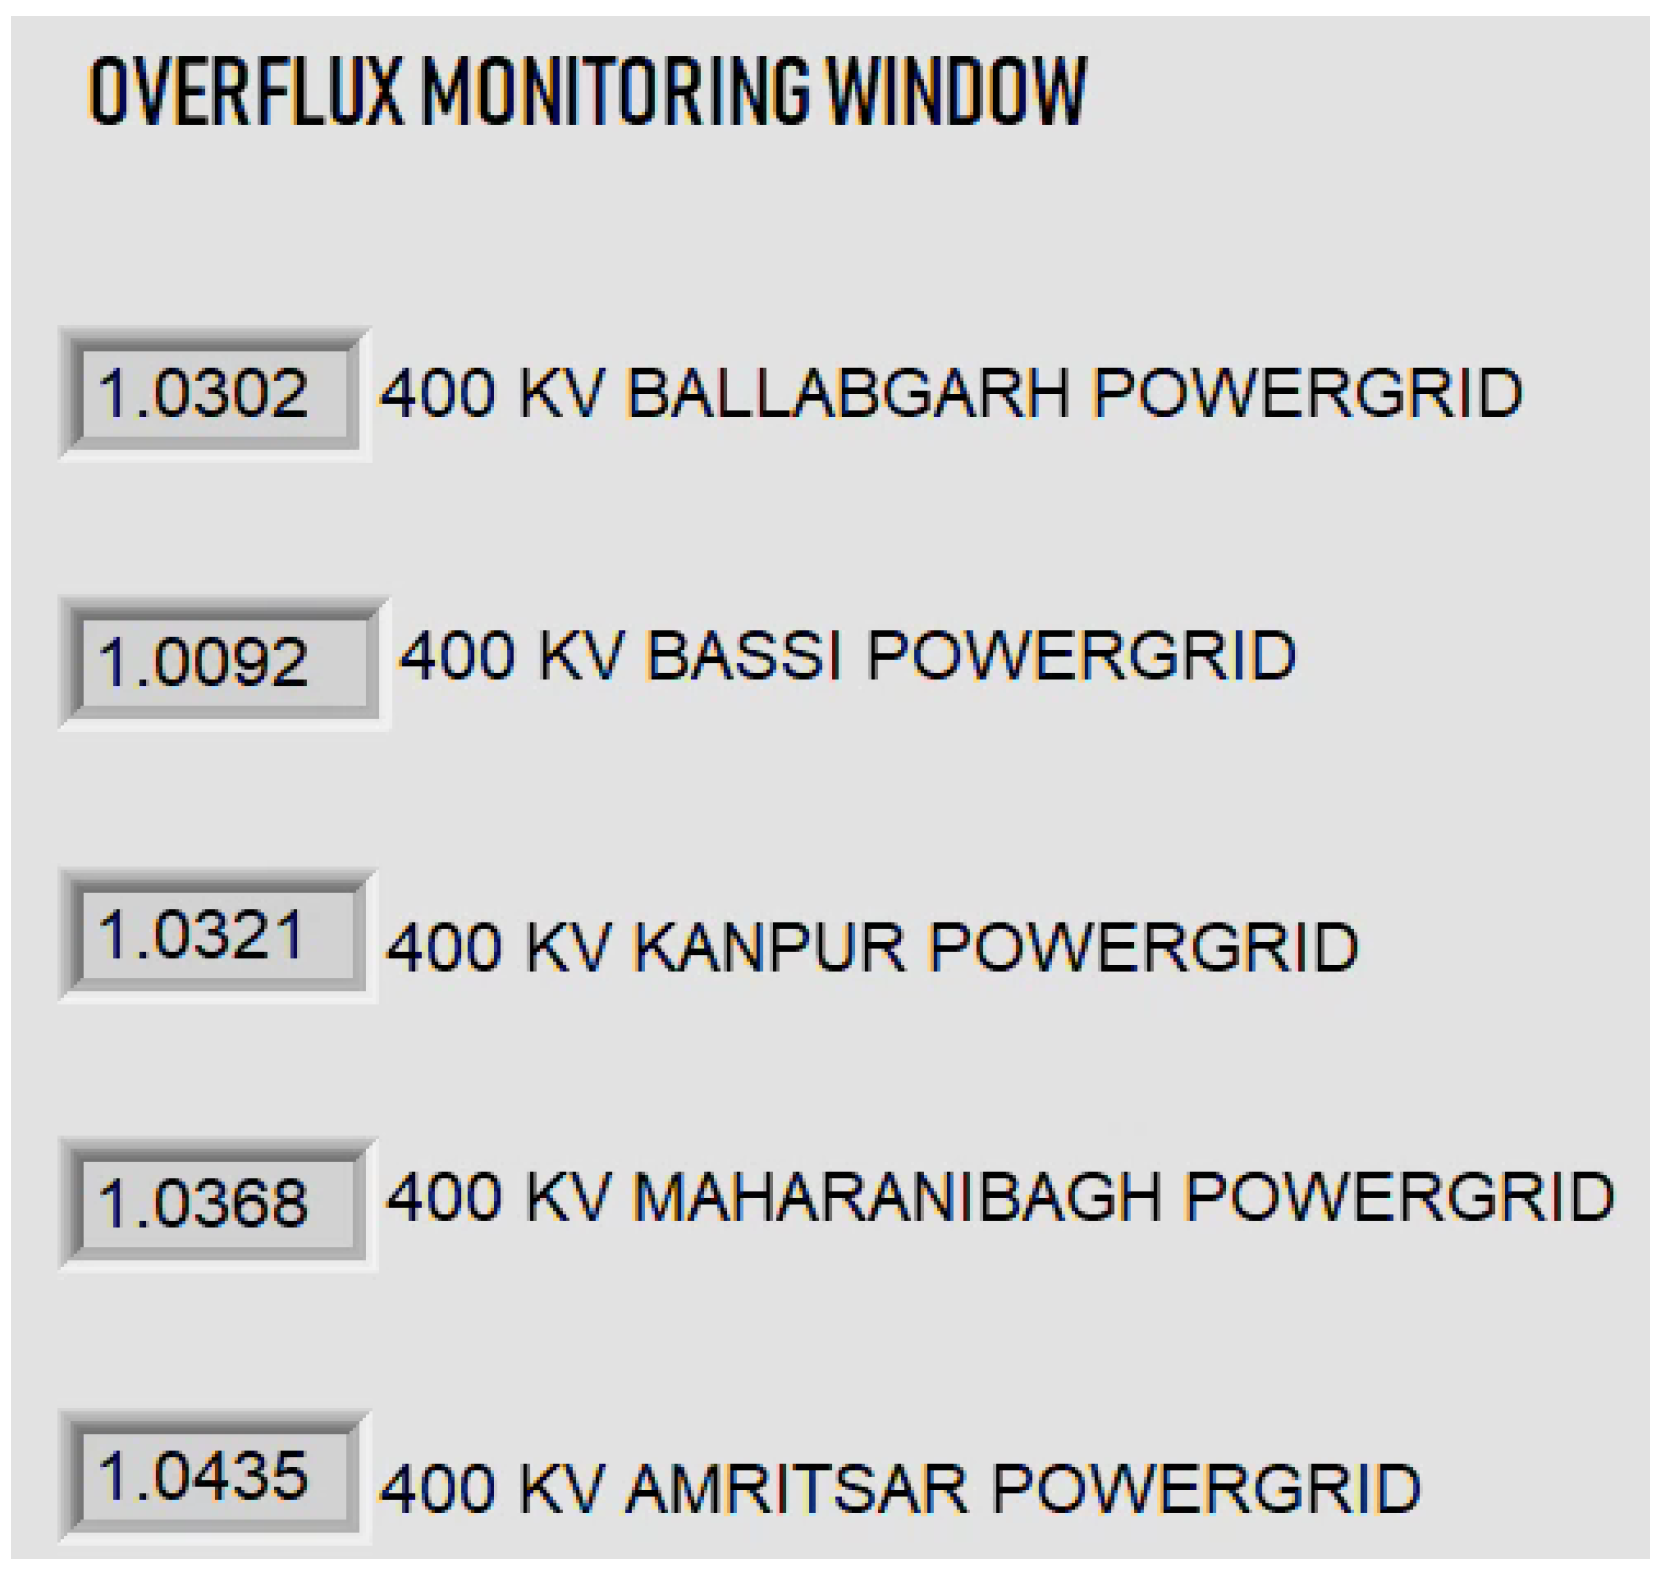
  • Overflux monitoring: the application displays the V/F value (as ratio of actual/nominal) of selected buses in real-time, as shown in Figure 9. An early warning alerts the operator when this ratio passes 1.10 (the overflux protection trips at 1.14).
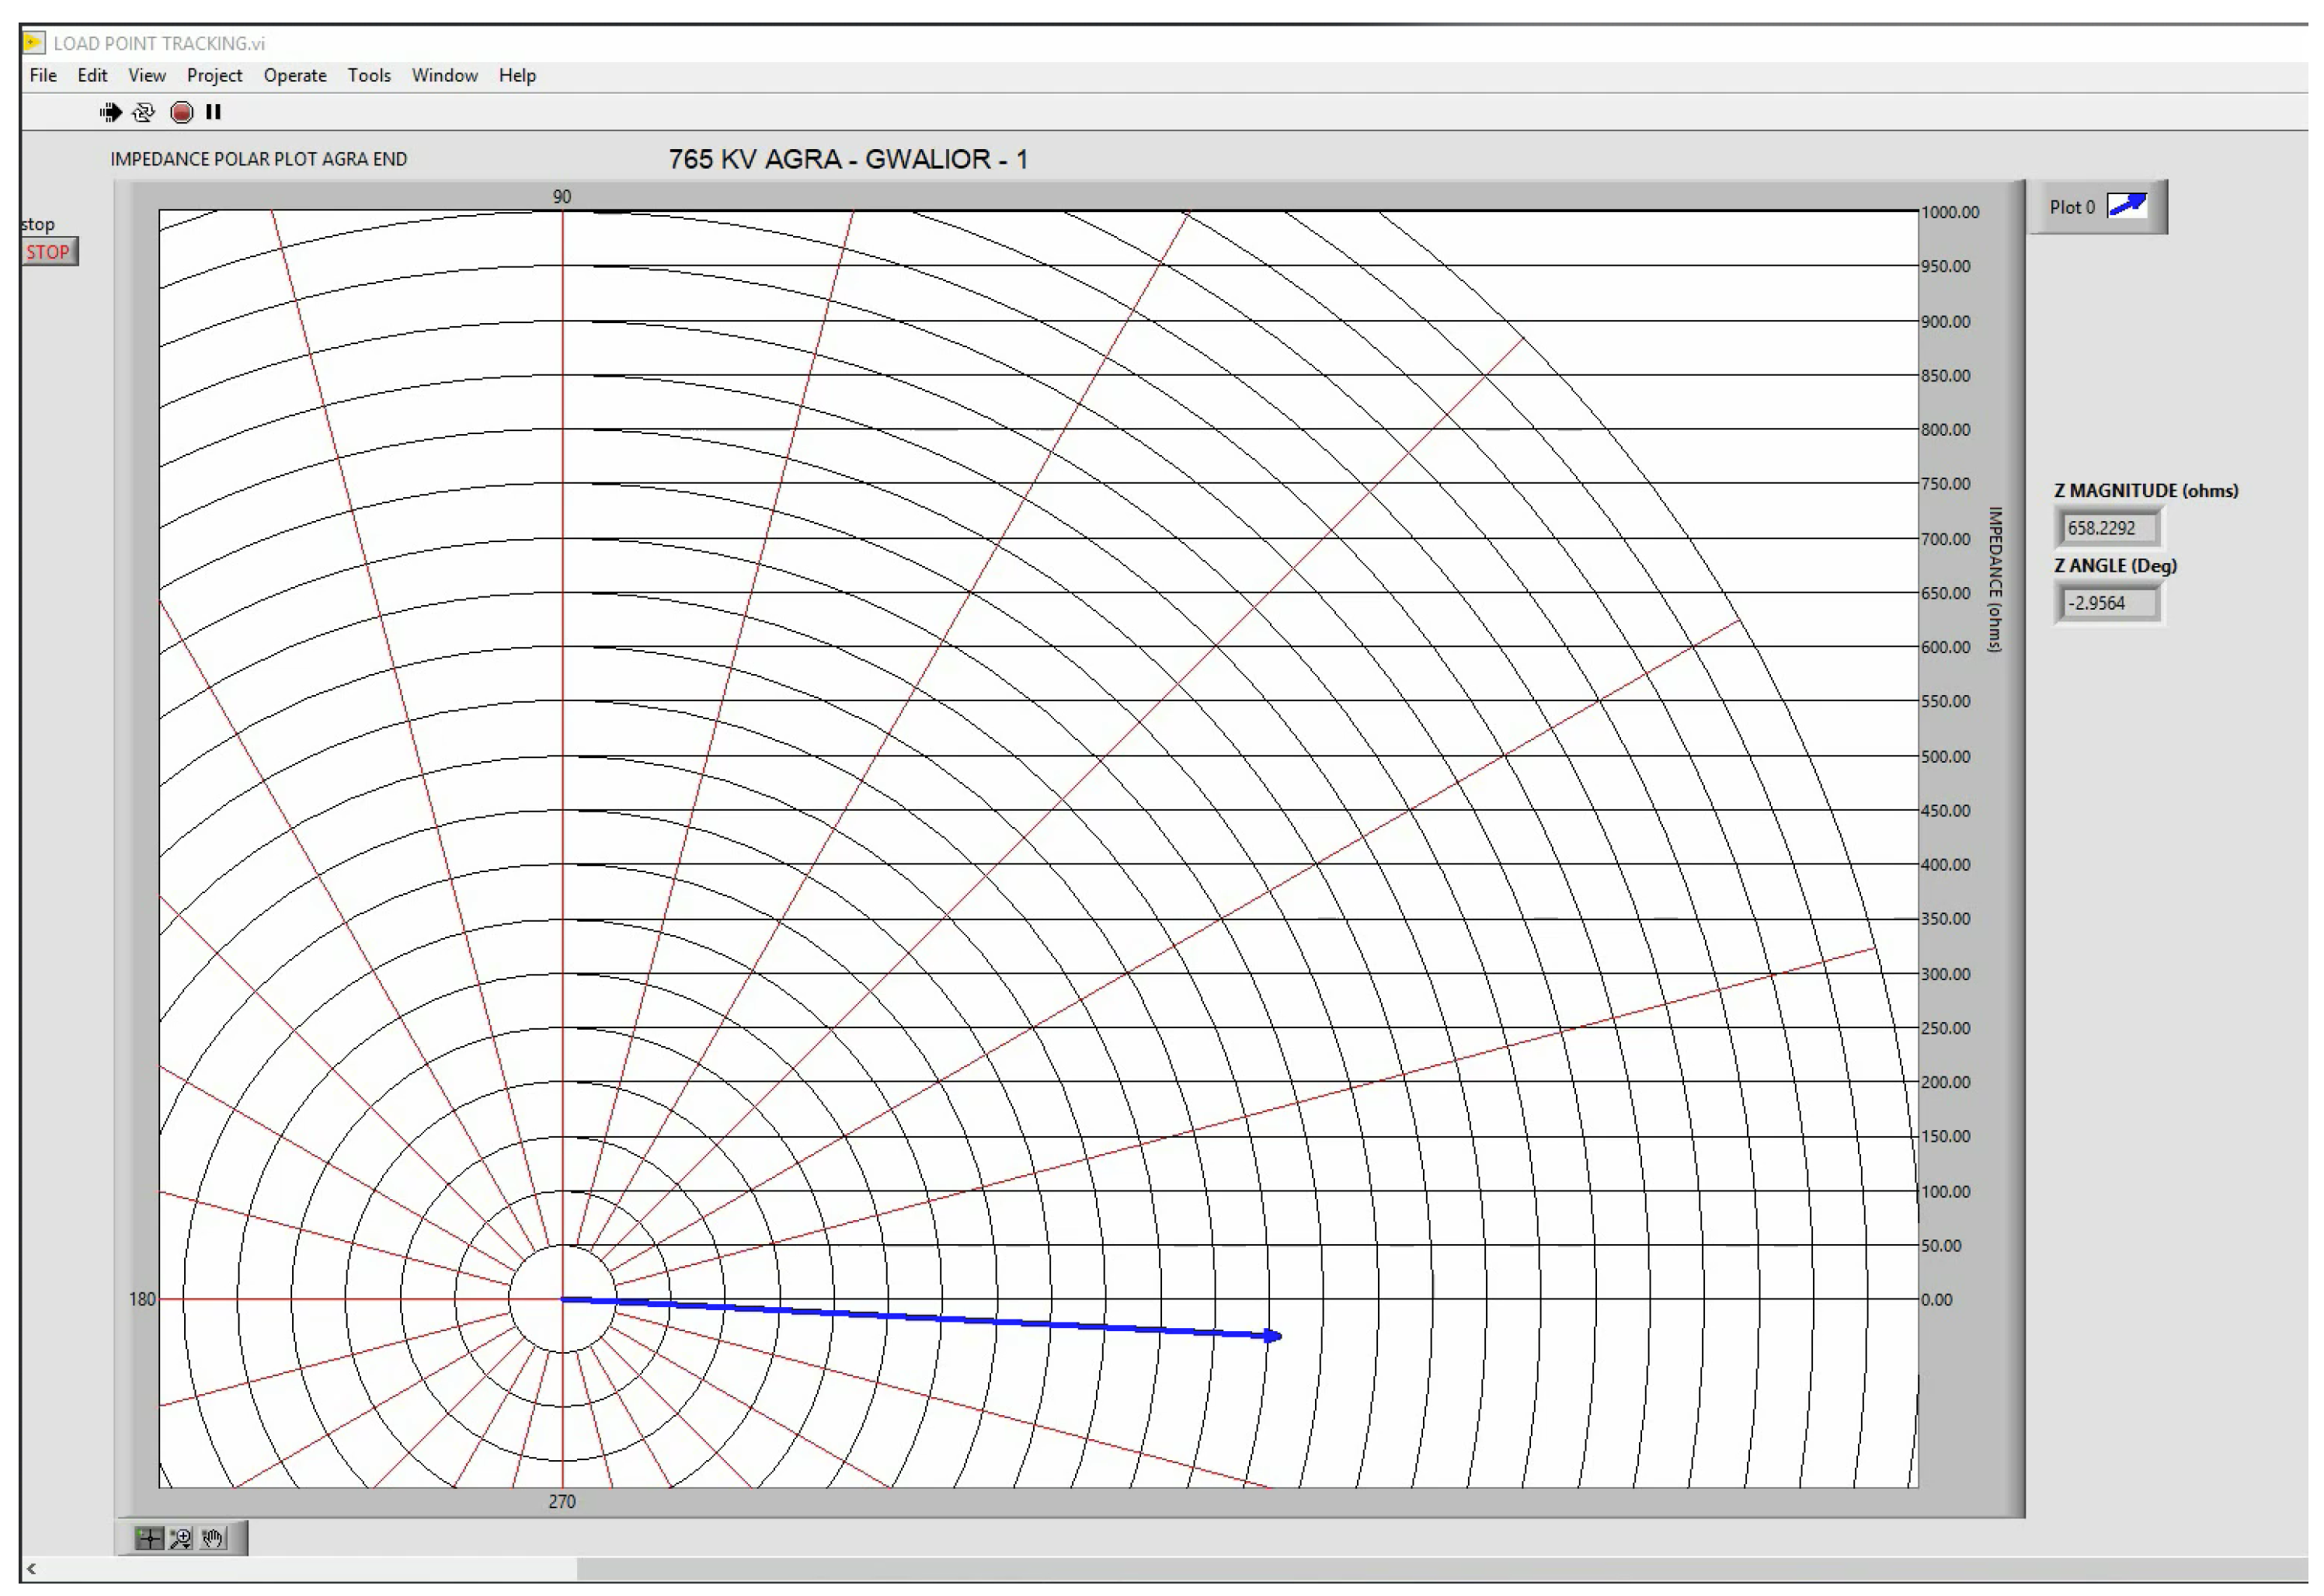
  • Load point tracking: this application can display the load point (measured impedance) of a selected transmission line end in real-time in a polar diagram as shown in Figure 10. This allows us to monitor whether the load point encroaches on the protection zone.
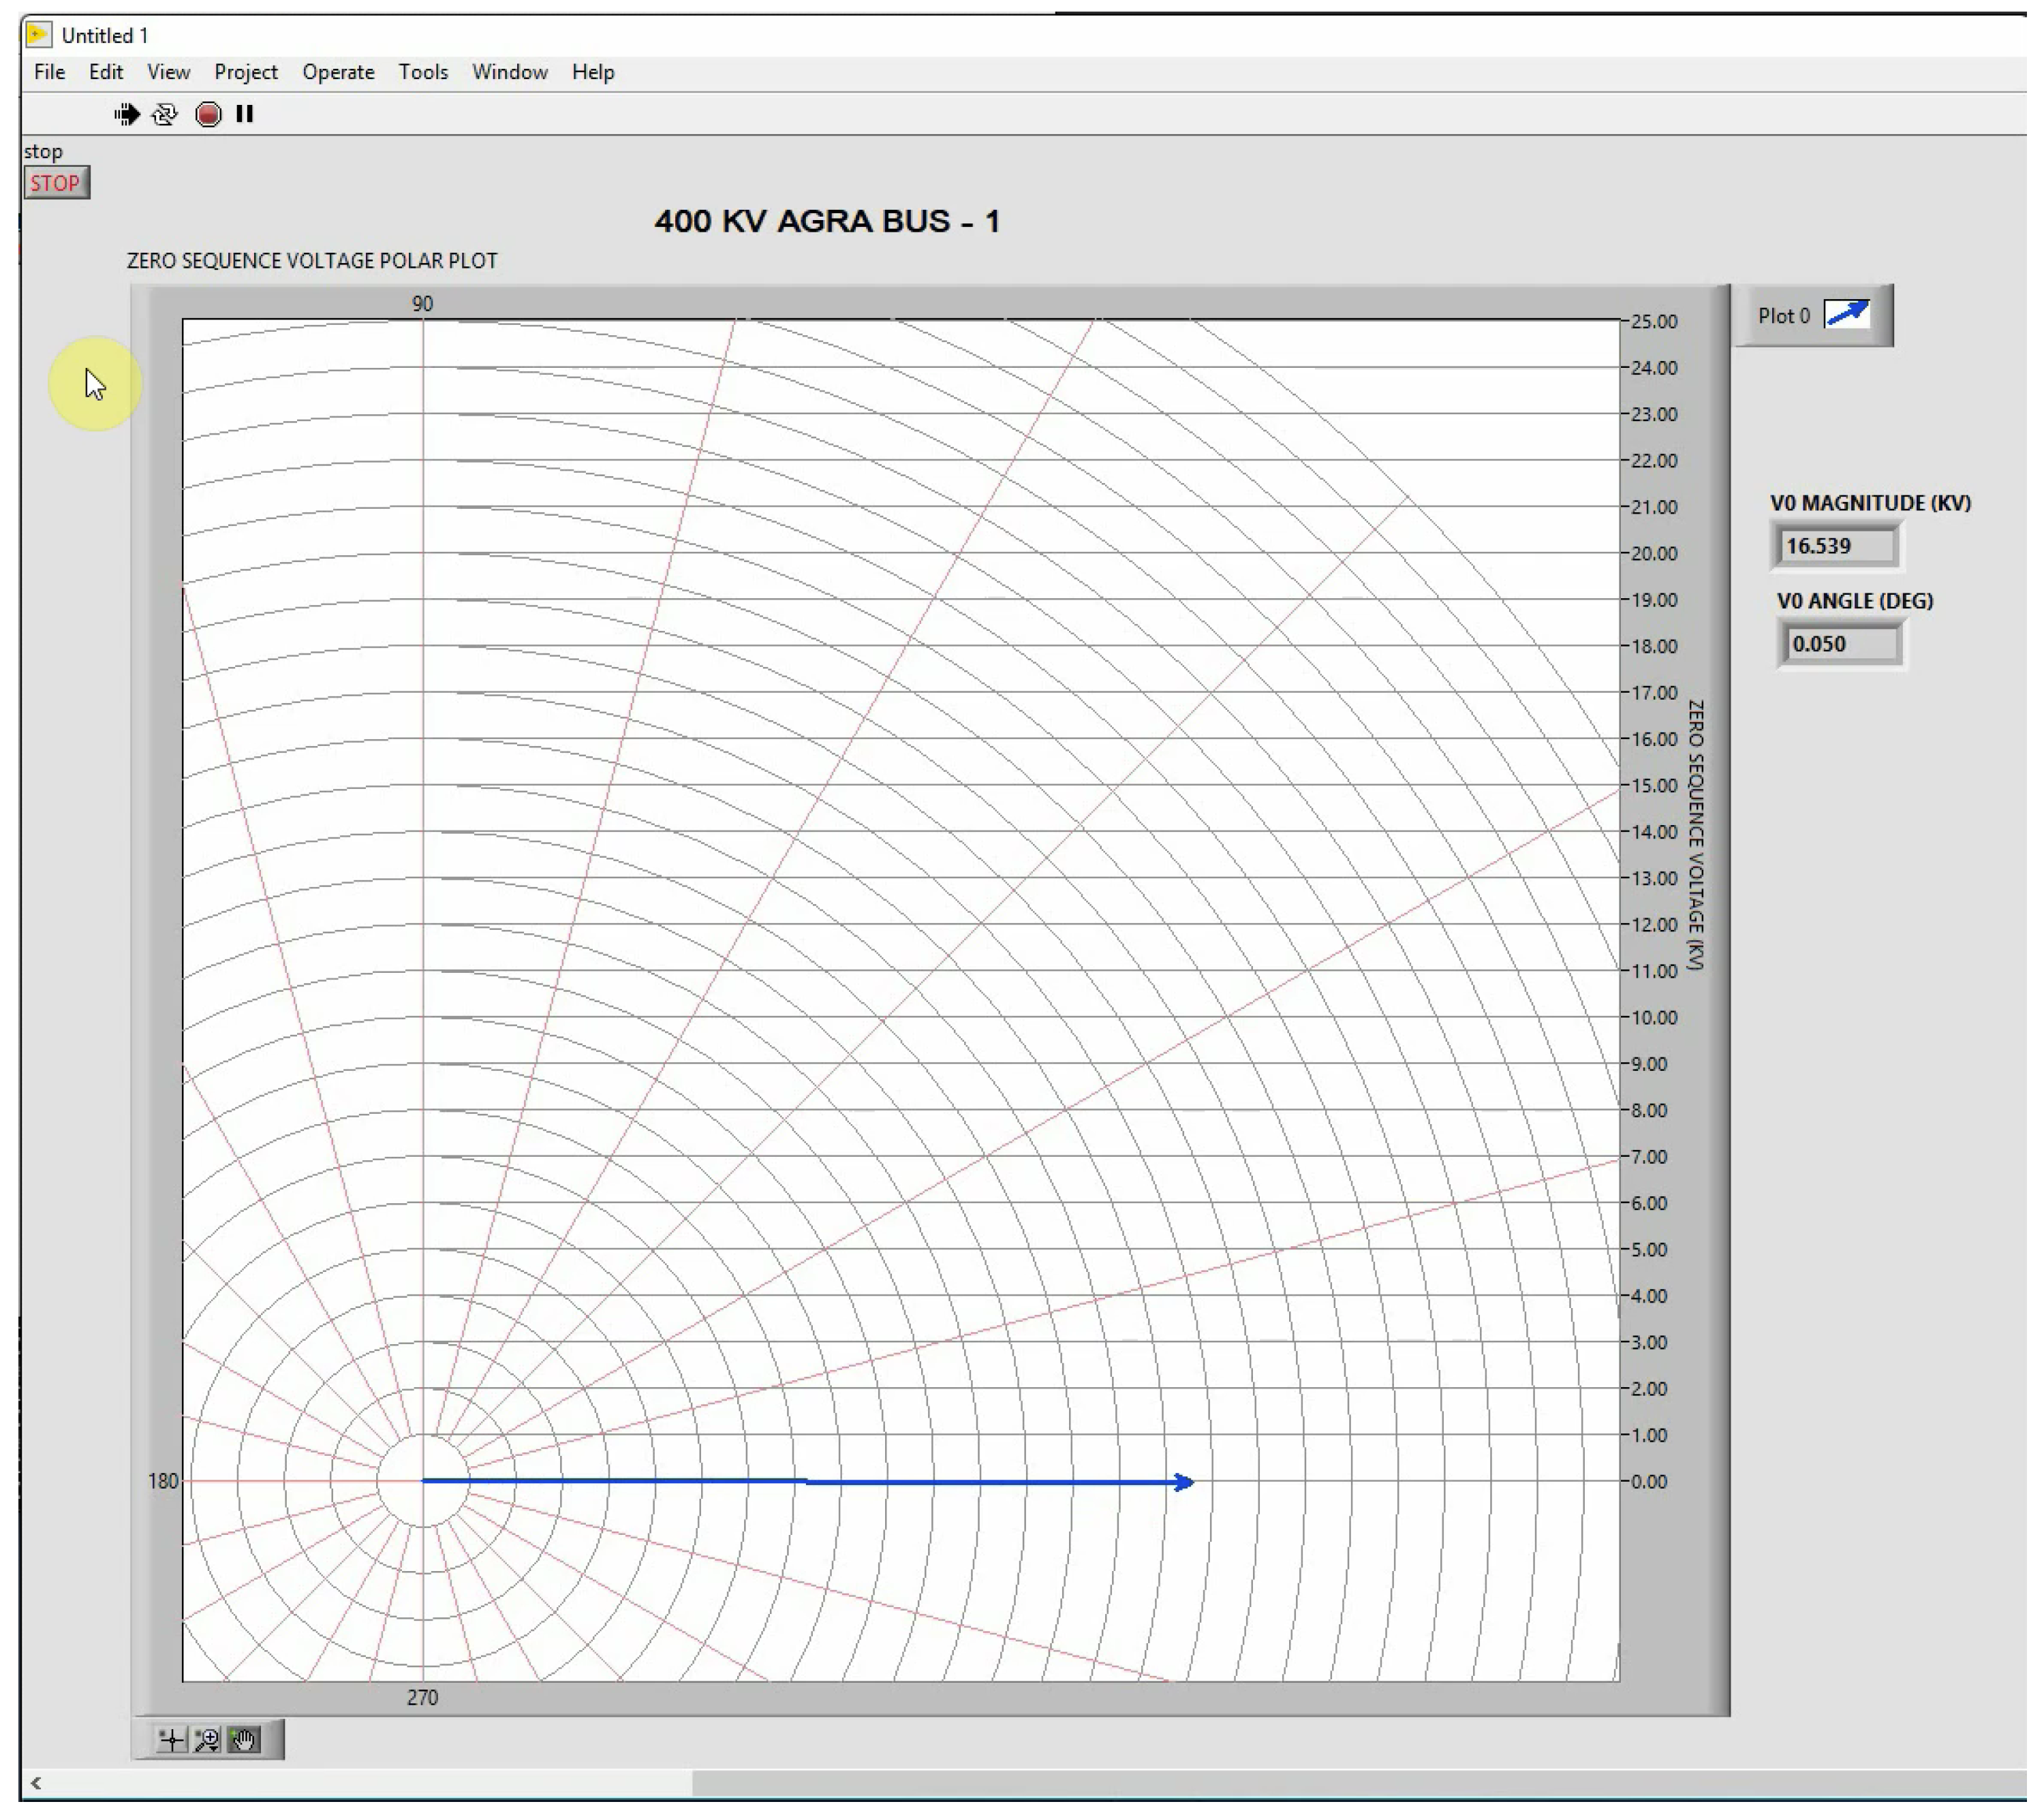
  • Zero sequence voltage: this application displays the zero sequence voltage of a selected bus on a polar plane as shown in Figure 11. It is helpful to monitor unbalances at the selected point of monitoring.

5.2. Other Industrial Applications

As described in [43], Statnett SF has used an early prototype of the S3DK for the development of several voltage stability and oscillation monitoring applications, while at the same time being particularly useful for the monitoring of high-voltage direct current (HVDC) lines. Even though these application prototypes have not been deployed for regular use of operators, the authors of [43] highlight that they have helped in shaping the tools that are being used in the control room.

6. Conclusions

The S3DK is a toolkit that was developed to facilitate the fast prototyping of synchrophasor applications. This paper aims to promote its release as an open source project and to summarize its virtues and uses, so that other researchers may exploit it for their own purposes. This paper also shows that the toolkit was instrumental in supporting the research activities having been used to develop a wide array of new applications covering monitoring, control and protection applications, which are documented in separate publications cited in this paper. Lastly, an engineering team from the Grid Controller of India Ltd., an Indian grid operator, selected S3DK to develop applications answering a set of problems faced in the control center to facilitate the operators’ work of operating the grid with minimal disturbances. It is important to note that these applications were developed independently from the developers of the S3DK, which shows the potential of S3DK in facilitating PMU prototyping in industry.

Author Contributions

Conceptualization, L.V.; Methodology, M.B. and L.V.; Software, M.B., L.V. and S.T.; Formal analysis, L.V.; Resources, L.V. and S.T.; Writing—original draft, M.B. and L.V.; Writing—review & editing, M.B., L.V. and S.T.; Visualization, M.B. and S.T.; Supervision, L.V.; Project administration, L.V. All authors have read and agreed to the published version of the manuscript.

Funding

This research was funded in part by Statnett SF, the Nordic Energy Agency through the STRONgrid project and Dominion Energy.

Data Availability Statement

The code of the S3DK, and its precompiled LabVIEW packages are openly available in Github at https://github.com/ALSETLab/S3DK (accessed on 9 April 2024).

Acknowledgments

The authors would like to thank the following individuals of Statnett SF, the Norwegian Transmission System Operator: Stig Løvlund, L. K. Vormedal, and the late Jan Ove Gjerde who supported the development of this software towards its open source release through different research projects. The authors would also like to recognize the contributions of Vemund H. Aarstrand of Enfo Energy AS, Oslo, Norway; Martin Sveningsson, Prevas AB, Stockholm, Sweden; and Jordan Grey, Rensselaer Polytechnic Institute, Troy, NY, USA.

Conflicts of Interest

Author Shashank Tyagi was employed by the company EirGrid Group. The remaining authors declare that the research was conducted in the absence of any commercial or financial relationships that could be construed as a potential conflict of interest.

References

  1. Mittelstadt, W.A.; Krause, P.E.; Wilson, R.E.; Overholt, P.N.; Sobajic, D.J.; Hauer, J.F.; Rizy, D.T. The DOE Wide Area Measurement System (WAMS) Project: Demonstration of Dynamic Information Technology for the Future Power System; Technical Report CONF-960434-1; USDOE Bonneville Power Administration: Portland, OR, USA, 1996. [Google Scholar]
  2. Hauer, J.; Bhatt, N.; Shah, K.; Kolluri, S. Performance of “WAMS East" in providing dynamic information for the North East blackout of August 14, 2003. In Proceedings of the IEEE Power Engineering Society General Meeting, Denver, CO, USA, 6–10 June 2004; Volume 2, pp. 1685–1690. [Google Scholar]
  3. Cai, J.; Huang, Z.; Hauer, J.; Martin, K. Current Status and Experience of WAMS Implementation in North America. In Proceedings of the 2005 IEEE/PES Transmission & Distribution Conference & Exposition: Asia and Pacific, Dalian, China, 15–18 August 2005; pp. 1–7. [Google Scholar]
  4. Hauer, J.F.; Trudnowski, D.J.; DeSteese, J.G. A Perspective on WAMS Analysis Tools for Tracking of Oscillatory Dynamics. In Proceedings of the 2007 IEEE Power Engineering Society General Meeting, Tampa, FL, USA, 24–28 June 2007; pp. 1–10. [Google Scholar]
  5. Usman, M.U.; Faruque, M.O. Applications of synchrophasor technologies in power systems. J. Mod. Power Syst. Clean Energy 2019, 7, 211–226. [Google Scholar] [CrossRef]
  6. Abo-Khalil, A.G. Impacts of Wind Farms on Power System Stability. In Modeling and Control Aspects of Wind Power Systems; Muyeen, S.M., Al-Durra, A., Hasanien, H.M., Eds.; IntechOpen: Rijeka, Yugoslavia, 2013; Chapter 7. [Google Scholar] [CrossRef]
  7. Vanfretti, L.; Baudette, M.; White, A.D. Chapter 31—Monitoring and Control of Renewable Energy Sources using Synchronized Phasor Measurements. In Renewable Energy Integration, 2nd ed.; Jones, L.E., Ed.; Academic Press: Boston, MA, USA, 2017; pp. 419–434. [Google Scholar]
  8. Saleem, M.; Saha, S.; Roy, T.K.; Ghosh, S.K. Assessment and management of frequency stability in low inertia renewable energy rich power grids. IET Gener. Transm. Distrib. 2024, 18, 1372–1390. [Google Scholar] [CrossRef]
  9. Pierrou, G.; Lai, H.; Hug, G.; Wang, X. A Decentralized Wide-Area Voltage Control Scheme for Coordinated Secondary Voltage Regulation Using PMUs. IEEE Trans. Power Syst. 2024, 1–13. [Google Scholar] [CrossRef]
  10. Priyadarshi, A.; Yadav, B. Bad data detection and multi-level classification of events in synchrophasor measurements using AXGBoost algorithm. Electr. Eng. 2023, 106, 1–15. [Google Scholar] [CrossRef]
  11. MansourLakouraj, M.; Gautam, M.; Livani, H.; Benidris, M. A multi-rate sampling PMU-based event classification in active distribution grids with spectral graph neural network. Electr. Power Syst. Res. 2022, 211, 108145. [Google Scholar] [CrossRef]
  12. Wang, C.; Qin, Z.; Hou, Y.; Yan, J. Multi-Area Dynamic State Estimation with PMU Measurements by an Equality Constrained Extended Kalman Filter. IEEE Trans. Smart Grid 2016, 9, 900–910. [Google Scholar] [CrossRef]
  13. Schweitzer Engineering Laboratories Inc. Synchrowave Operations. Available online: https://selinc.com/solutions/software/synchrowave-operations/ (accessed on 9 April 2024).
  14. Electric Power Group. Real-Time Dynamics Monitoring System (RTDMS). Available online: https://www.electricpowergroup.net/epg_products/rtdms/ (accessed on 9 April 2024).
  15. General Electric. Phasor Point. Available online: https://www.ge.com/digital/applications/transmission/wide-area-management-system-and-control-wams-wamc (accessed on 9 April 2024).
  16. Ma, J.; Venkatasubramanian, M.V.; Feuerborn, S.; Black, C.; Halpin, M.; Hsu, S.M. A Software Suite for Power System Stability Monitoring Based on Synchrophasor Measurements. In Power System Grid Operation Using Synchrophasor Technology; Nuthalapati, S.N., Ed.; Power Electronics and Power Systems; Springer International Publishing: Cham, Switzerland, 2019; pp. 449–476. [Google Scholar]
  17. Office of Electricity, Department of Energy. Project Grant DEOE0000700. Available online: https://www.highergov.com/grant/DEOE0000700/ (accessed on 9 April 2024).
  18. Rosso, A. Demonstration of a Novel Synchrophasor-Based Situational Awareness System: Wide Area Power System Visualization, On-Line Event Replay and Early Warning of Grid Problems; Technical Report; Electric Power Research Institute, Incorporated: Washington, DC, USA, 2012. [Google Scholar]
  19. Robertson, R. Open and Extensible Control & Analytics Platform for Synchrophasor Data; Technical Report DOE-GPA-0778-1; Grid Protection Alliance, Inc.: Chattanooga, TN, USA, 2018. [Google Scholar]
  20. Madani, V.; Giri, J.; Kosterev, D.; Novosel, D.; Brancaccio, D. Challenging Changing Landscapes: Implementing Synchrophasor Technology in Grid Operations in the WECC Region. IEEE Power Energy Mag. 2015, 13, 18–28. [Google Scholar] [CrossRef]
  21. C37.118.2-2011; IEEE Standard for Synchrophasor Data Transfer for Power Systems. (Revision IEEE Std C37.118-2005). IEEE: New York, NY, USA, 2011; pp. 1–53. [CrossRef]
  22. Baudette, M.; Firouzi, S.R.; Vanfretti, L. The STRONgrid library: A modular and extensible software library for IEEE C37.118.2 compliant synchrophasor data mediation. SoftwareX 2018, 7, 281–286. [Google Scholar] [CrossRef]
  23. Smart Grid System Report 2020; Technical Report; United States Department of Energy: Washington, DC, USA, 2022.
  24. Tu, H.; Du, Y.; Yu, H.; Dubey, A.; Lukic, S.; Karsai, G. Resilient Information Architecture Platform for the Smart Grid: A Novel Open-Source Platform for Microgrid Control. IEEE Trans. Ind. Electron. 2020, 67, 9393–9404. [Google Scholar] [CrossRef]
  25. Zuo, J.; Carroll, R.; Trachian, P.; Dong, J.; Affare, S.; Rogers, B.; Beard, L.; Liu, Y. Development of TVA SuperPDC. In Proceedings of the 2008 IEEE Power and Energy Society General Meeting—Conversion and Delivery of Electrical Energy in the 21st Century, Pittsburgh, PA, USA, 20–24 July 2008; pp. 1–8. [Google Scholar]
  26. Melton, R.B.; Schneider, K.P.; Lightner, E.; Mcdermott, T.E.; Sharma, P.; Zhang, Y.; Ding, F.; Vadari, S.; Podmore, R.; Dubey, A.; et al. Leveraging Standards to Create an Open Platform for the Development of Advanced Distribution Applications. IEEE Access 2018, 6, 37361–37370. [Google Scholar] [CrossRef]
  27. Grid Protection Alliance. OpenPDC. Available online: https://github.com/GridProtectionAlliance/openPDC (accessed on 9 April 2024).
  28. Naglic, M.; Popov, M.; Meijden, M.A.M.M.v.d.; Terzija, V. Synchro-Measurement Application Development Framework: An IEEE Standard C37.118.2-2011 Supported MATLAB Library. IEEE Trans. Instrum. Meas. 2018, 67, 1804–1814. [Google Scholar] [CrossRef]
  29. Almas, M.; Baudette, M.; Vanfretti, L.; Lovlund, S.; Gjerde, J. Synchrophasor network, laboratory and software applications developed in the STRONg2rid project. In Proceedings of the IEEE Power and Energy Society General Meeting, National Harbor, MD, USA, 27–31 July 2014; Volume 2014. [Google Scholar] [CrossRef]
  30. Peric, V.S.; Baudette, M.; Vanfretti, L.; Gjerde, J.O.; Lovlund, S. Implementation and testing of a real-time mode estimation algorithm using ambient PMU data. In Proceedings of the 2014 Clemson University Power Systems Conference, Clemson, SC, USA, 11–14 March 2014; pp. 1–5. [Google Scholar] [CrossRef]
  31. Mahmood, F.; Hooshyar, H.; Vanfretti, L. A method for extracting steady state components from Syncrophasor data using Kalman Filters. In Proceedings of the 2015 IEEE 15th International Conference on Environment and Electrical Engineering (EEEIC), Rome, Italy, 10–13 June 2015. [Google Scholar] [CrossRef]
  32. Mahmood, F.; Vanfretti, L.; Pignati, M.; Hooshyar, H.; Sossan, F.; Paolone, M. Experimental Validation of a Steady State Model Synthesis Method for a Three-Phase Unbalanced Active Distribution Network Feeder. IEEE Access 2018, 6, 4042–4053. [Google Scholar] [CrossRef]
  33. Bidadfar, A.; Hooshyar, H.; Monadi, M.; Vanfretti, L. Decoupled voltage stability assessment of distribution networks using synchrophasors. In Proceedings of the 2016 IEEE Power and Energy Society General Meeting (PESGM), Boston, MA, USA, 17–21 July 2016; pp. 1–5. [Google Scholar] [CrossRef]
  34. Singh, N.; Hooshyar, H.; Vanfretti, L. Feeder dynamic rating application for active distribution network using synchrophasors. Sustain. Energy Grids Netw. 2017, 10, 35–45. [Google Scholar] [CrossRef]
  35. Vanfretti, L.; Jónsdóttir, G.; Almas, M.; Rebello, E.; Firouzi, S.; Baudette, M. Audur—A platform for synchrophasor-based power system wide-area control system implementation. SoftwareX 2018, 7, 294–301. [Google Scholar] [CrossRef]
  36. Rebello, E.; Vanfretti, L.; Almas, M.S. Experimental Testing of a Real-Time Implementation of a PMU-Based Wide-Area Damping Control System. IEEE Access 2020, 8, 25800–25810. [Google Scholar] [CrossRef]
  37. Almas, M.; Vanfretti, L. A Hybrid Synchrophasor and GOOSE-Based Power System Synchronization Scheme. IEEE Access 2016, 4, 4659–4668. [Google Scholar] [CrossRef]
  38. Monadi, M.; Hooshyar, H.; Vanfretti, L.; Mahmood, F.; Candela, J.I.; Rodriguez, P. Measurement-Based Network Clustering for Active Distribution Systems. IEEE Trans. Smart Grid 2019, 10, 6714–6723. [Google Scholar] [CrossRef]
  39. Monadi, M.; Hooshyar, H.; Vanfretti, L. Design and real-time implementation of a PMU-based adaptive auto-reclosing scheme for distribution networks. Int. J. Electr. Power Energy Syst. 2019, 105, 37–45. [Google Scholar] [CrossRef]
  40. Hooshyar, H.; Baran, M.; Firouzi, S.; Vanfretti, L. PMU-assisted overcurrent protection for distribution feeders employing Solid State Transformers. Sustain. Energy Grids Netw. 2017, 10, 26–34. [Google Scholar] [CrossRef]
  41. Ray, P. Power system low frequency oscillation mode estimation using wide area measurement systems. Eng. Sci. Technol. Int. J. 2017, 20, 598–615. [Google Scholar] [CrossRef]
  42. Shashank, T.; Manoj, A.; Alok, K.; Banerjee, S.; Nallarasan, N. A tool to detect Low frequency power system oscillations in real time using PMU data. In Proceedings of the CIGRE Session 2022. CIGRE (International Council on Large Electric Systems), Paris, France, 28 August–2 September 2022. [Google Scholar]
  43. Karlsen, D.; Uhlen, K.; Vormedal, L. Introducing PMU-based Applicatons in the Control Room Setting. In Proceedings of the CIGRE Session 2018. CIGRE (International Council on Large Electric Systems), Paris, France, 26–31 August 2018. [Google Scholar]
Figure 1. Synchrophasor system architecture.
Electronics 13 01513 g001
Figure 2. Example of distributed application architecture in a synchrophasor system.
Electronics 13 01513 g002
Figure 3. S3DK architecture.
Electronics 13 01513 g003
Figure 4. S3DK main user interface.
Electronics 13 01513 g004
Figure 5. S3DK programming blocks arranged in palettes.
Electronics 13 01513 g005
Figure 6. Template PMU application project file explorer.
Electronics 13 01513 g006
Figure 7. Oscillation monitoring dashboard.
Electronics 13 01513 g007
Figure 8. Oscillation monitoring details window.
Electronics 13 01513 g008
Figure 9. Transmission line overflux monitoring application.
Electronics 13 01513 g009
Figure 10. Load point tracking application.
Electronics 13 01513 g010
Figure 11. Zero sequence monitoring application.
Electronics 13 01513 g011
Disclaimer/Publisher’s Note: The statements, opinions and data contained in all publications are solely those of the individual author(s) and contributor(s) and not of MDPI and/or the editor(s). MDPI and/or the editor(s) disclaim responsibility for any injury to people or property resulting from any ideas, methods, instructions or products referred to in the content.

