1. Introduction
Due to the rapid advancement in the information technology (IT) industry, embedded systems are being developed with high performance and specifications. They are being rapidly expanded and applied across various heterogeneous industries, experiencing widespread usage. Embedded systems are controlled based on embedded software, and the complexity of the software varies according to the specifications required. In recent years, there has been a trend towards increasing complexity of system software in industries such as automotive and healthcare, where high precision and high specifications are demanded. With the increasing complexity, issues regarding system protection and safety against software errors in embedded systems arise. Due to the difficulty in analyzing the causes of errors in system software, the recovery period of the system becomes prolonged, resulting in astronomical recovery and loss costs [
1,
2,
3]. Therefore, there is a need for technology that can rapidly detect and respond to system malfunctions caused by software errors. Additionally, alternatives and enhancements such as the prevention of information transmission errors and deactivation of control operations in the system are essential [
4].
An embedded system’s code-based malfunctions always occur during run-time. As a result, debugging at the software code level, excluding the system, is impossible to reproduce in operation, and modeling for static error verification of software is not easy. Furthermore, detecting run-time errors in software and hardware before operation is not easy, and the difficulty of reproduction leads to high verification costs. Therefore, it is essential to apply software directly to the system to verify the impact and phenomena of its operation.
Adding additional code for inspection and verification in the software will inevitably bring about changes in the functionality of the existing embedded software. Inserting additional code for verification within the main code leads to the creation of unnecessary code and an increase in the codebase. Since there is a possibility of introducing further issues due to the inserted code, the system relies on using the core code without modification and employs supplementary methods, such as side channels, from the outside to detect errors [
5,
6,
7,
8]. Detecting and addressing malfunctions caused by internal software errors in the system requires developing strategies and measures [
9,
10,
11].
This paper proposes a system for detecting system malfunctions caused by errors in embedded software in embedded systems that require high levels of safety and reliability. The proposed system utilizes an additional embedded system to monitor the real-time current/voltage-levels of a target embedded system (TES) that will be operational. By monitoring and comparing the current/voltage-levels, the system promptly detects malfunctions. A monitoring embedded system (MES) detects normal operation or malfunctions of the TES through state analysis. It controls the system to recover normally from malfunctions or, in preparation for the worst-case scenario of system destruction, stops the system operation. This system, by monitoring current/voltage externally during run-time without modifying internal code, can detect malfunctions safely without introducing additional malfunction factors into the system. Additionally, in the event of a malfunction in the current state, there are benefits such as alerting about malfunction detection and stabilizing the current through a proportional integral derivation (PID) control.
This paper is structured as follows:
Section 2 describes related research on software error analysis and correction methods related to the proposed system.
Section 3 introduces the configuration of the entire system and the current/voltage monitoring methods for software errors. Additionally,
Section 4 explains algorithms for comparing current/voltage patterns of the monitoring methods in
Section 3 to detect malfunctions and recover malfunctioning systems.
Section 5 presents the experimental results and analysis of monitoring, malfunction detection, and recovery of embedded systems in operation from a run-time perspective. Finally,
Section 6 concludes the paper.
2. Related Works
Embedded systems can employ a variety of software ranging from simple embedded software to more complex ones, depending on the specifications. Applied software may indeed be completely defect-free, but it can also harbor software errors arising from mistakes such as coding syntax errors or typos made by developers, as well as discrepancies between the software’s functionality and its requirements [
10,
12]. Simple coding errors can indeed lead to critical flaws in the system. Given the uncertainty regarding how coding errors may impact embedded systems, ongoing research on error verification in software aims to facilitate error correction and recovery [
13,
14].
To analyze and address safety issues related to system malfunctions, research is being conducted not only on software self-verification but also on applying separate error protection techniques to critical code and ensuring the development of secure software [
15,
16].
Run-time errors are challenging to detect at the software code level, involve inserting code for pre-error situation checks, and are difficult to reproduce run-time error scenarios. Due to the increasing demand for run-time error detection, methods such as injecting arbitrary software faults are also used to reproduce malfunctions in embedded systems caused by software errors.
Injected faults disrupt data control and flow, creating situations where information is lost, making it crucial to analyze the impact of errors on the system [
17,
18,
19].
Software verification, error detection, correction, and improvement are all essential processes. However, when it comes to responding to software errors, we cannot rely solely on software.
Recently, various industries have been applying methods to detect malfunctions. On the hardware side, methods to detect issues such as communication failures, sensor malfunctions, and device errors are being used. Additionally, techniques utilizing neural networks to predict and measure these issues are being implemented [
20]. Furthermore, methods such as analyzing power waveforms according to operational modes to detect malfunctions, and using machine learning to recover sensors that malfunction are also being researched to enhance the reliability of systems [
6,
21]. Furthermore, it is crucial to research prediction algorithms and systems for the maintenance of embedded systems, applying them to efficiently manage systems at low cost and low voltage [
22,
23]. Therefore, it is absolutely necessary to research technical countermeasures for error detection and recovery in the hardware aspect of embedded systems as a proposed system of
Figure 1 and complementary error countermeasures of the additional software and the hardware through continuous research [
24,
25].
Table 1 summarizes the related work on the error detection methods and strategies followed.
3. Proposed System Structure and Implementation
If the software code of the embedded system contains errors, it is expected that the embedded system will exhibit different patterns of current/voltage levels in its operational state due to the errors. To detect malfunctions in embedded systems caused by software errors, the MES monitors the current/voltage levels of the TES in real-time. The entire system for detecting malfunctions is composed of the following components as shown in
Figure 2: (1) the TES, which loads the operating software, (2) a power debugger (PD) used to measure the current/voltage-level of the TES operating state, and (3) the MES, which receives real-time current/voltage-level data from the PD and performs the data comparison, analysis, malfunction detection, and recovery, (4) The host machine performs continuous data logging via communication.
The MES compares the abnormal data pattern of malfunctions with the reference data pattern of normal operation to detect and identify malfunctions, then responds to recover the malfunctioning TES. Detecting errors in a system by directly coding specific conditions based on a developer’s various experiences and intuitions is extremely difficult. The error detection coding method devised by developers requires a significant amount of effort in analyzing and directly modifying conditions over an extended period whenever the normal pattern changes. The proposed system automatically creates an error condition with an initial dump of the current/voltage-level pattern data in the normal operating state without a developer’s direct description. By forcibly exposing the normal operation data of the system to error conditions, the normal or malfunction state is detected by monitoring the response pattern of the system or chip to errors and failure conditions. In case of any changes in the normal operation pattern, the system also has the advantage of being able to quickly reapply by extracting and automatically generating the pattern dump through a simple method, which can be applied in a short time. However, the one-time data dump serves a greater purpose for real-time comparison, focusing on efficient error detection and learning, rather than solely relying on error detection accuracy based on sequential data from normal operation. Furthermore, as mentioned earlier, to achieve efficient error detection, the environment is constructed by restricting it to systems with linear and regular current states, and then applying malfunction detection algorithms. Therefore, systems with non-linear and irregular current states are excluded from this paper, as they require further research to explore potential applications.
3.1. Extraction and Comparison of Normal/Malfunction Data
3.1.1. Extraction of Data
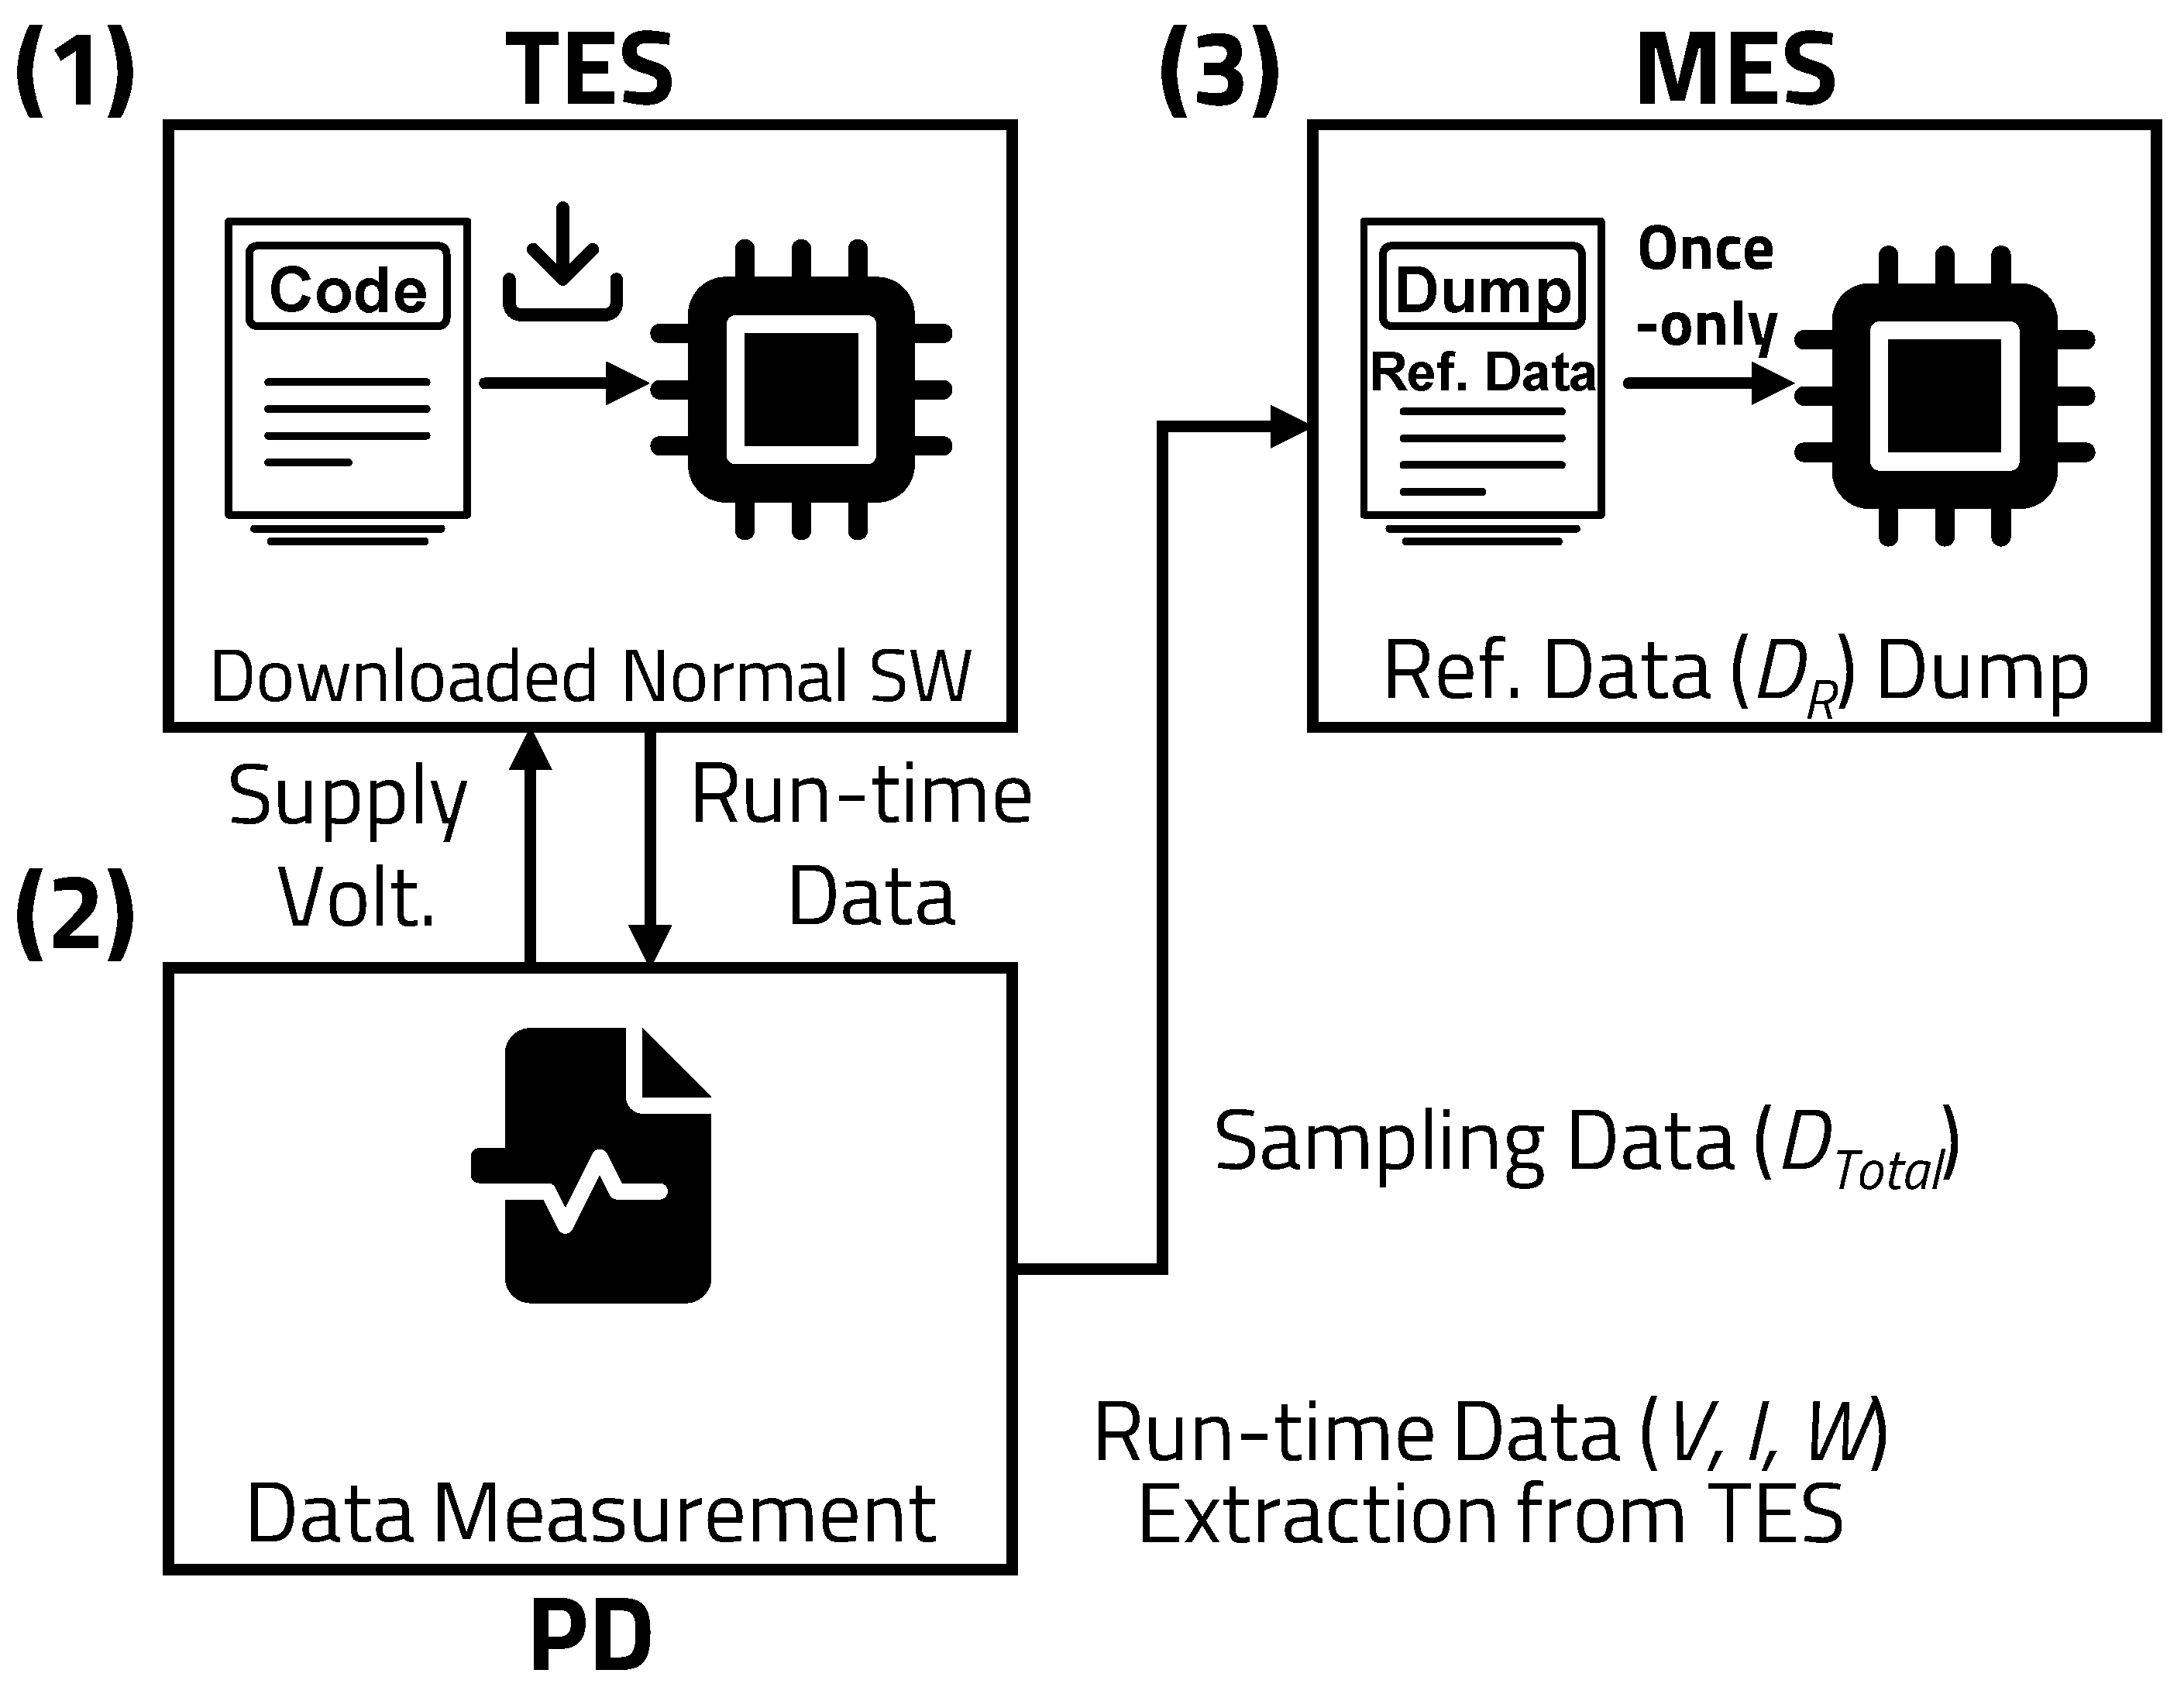
The proposed malfunction detection and pattern comparison system extracts data from the normal operation state to automatically generate reference current/voltage patterns. The generated pattern is then compared in real-time with the current/voltage levels to detect the system’s malfunctioning state. As shown in
Figure 3, the PD applies the operating voltage to the TES, which is downloaded with error-free software.
The PD measures and outputs in real-time the voltage, current, and power consumption applied to the TES. The data output (
) from the PD, sampled at intervals of 100 ms, is transmitted to the MES using the universal asynchronous receiver/transmitter (UART) communication. Upon receiving
, the MES stores the data in real-time. After 10 s, the MES simultaneously dumps a dataset (
), consisting of a set of 100 data (voltage [
], current [
], and power consumption [
]), to the microcontroller unit (MCU) as shown in
Table 2.
The TES and TES′ are physically identical systems. The TES, as shown in
Figure 4a, is a system where error-free software is downloaded and operates normally. TES′, as shown in
Figure 4b, is a system where software with errors is downloaded and operates erroneously. In reality, it is impossible to determine whether the actual system is the TES or TES′ based solely on the presence or absence of software errors. If the actual system is downloaded with software of integrity without errors, it will function properly like the TES. Conversely, if the downloaded software contains errors, the system will malfunction like the TES′.
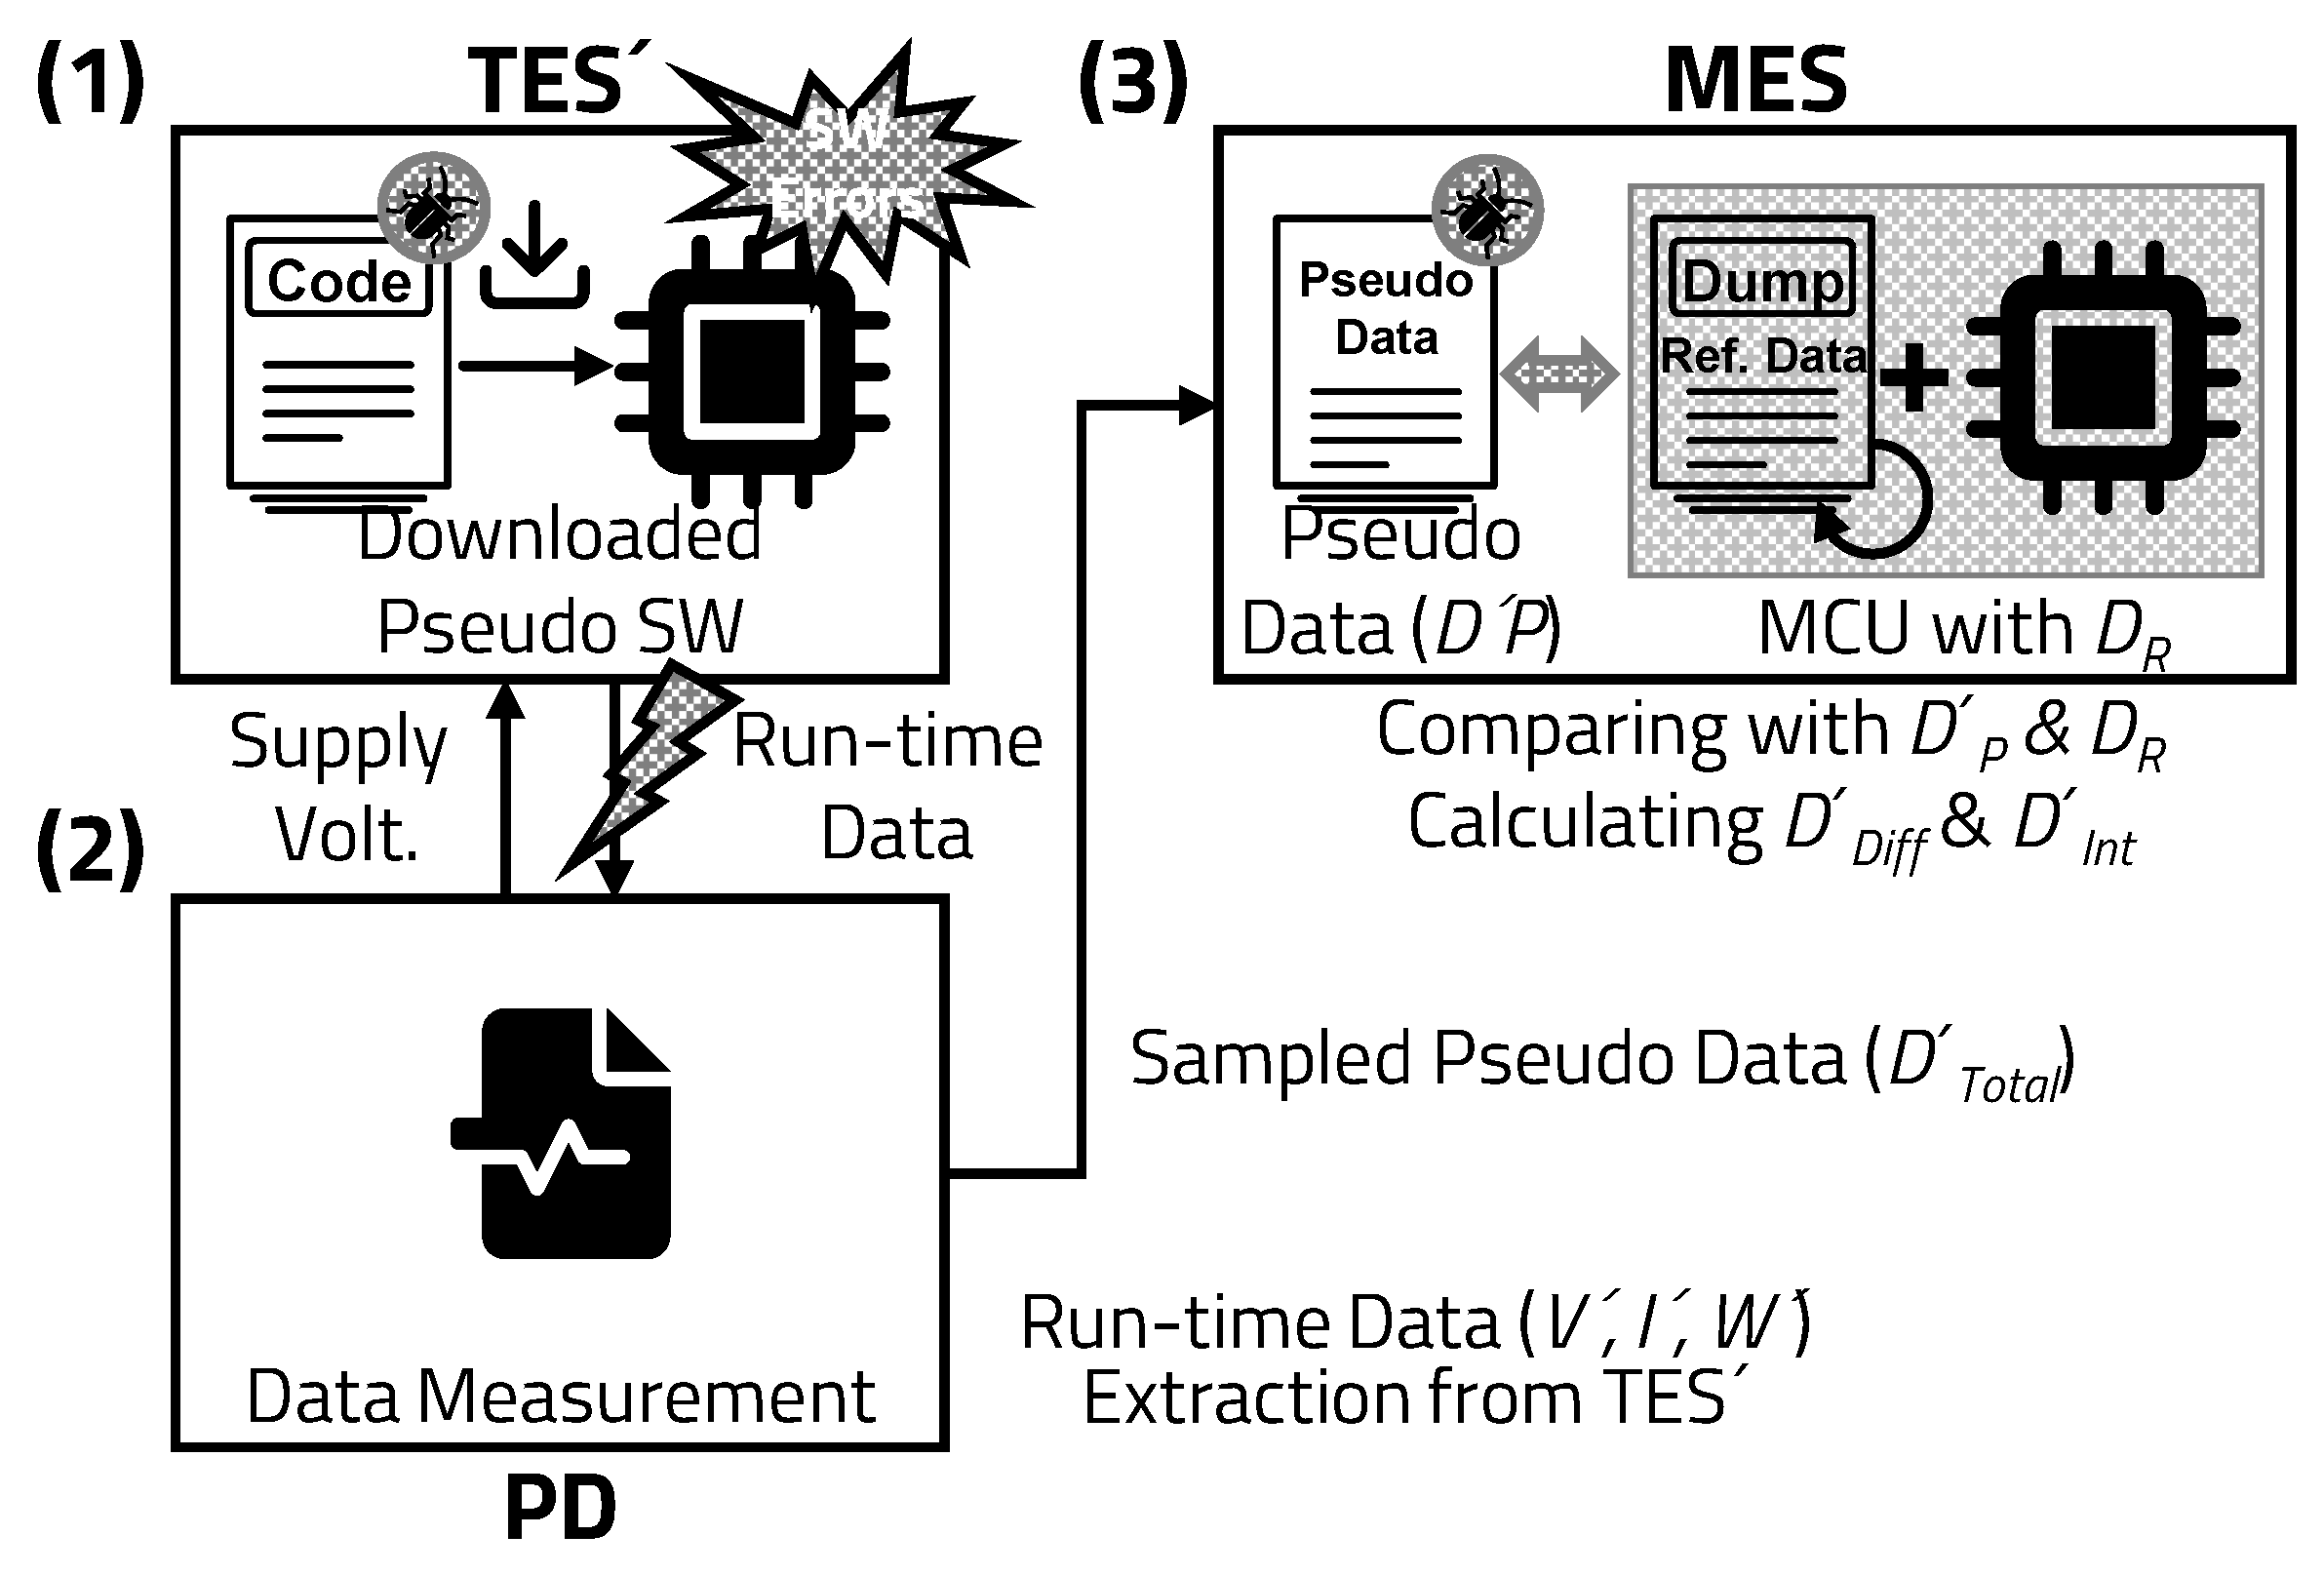
After generating and storing
, pseudo software with errors, as shown in
Figure 5, is loaded into the TES′. It is anticipated that the TES′ with the pseudo software loaded will output malfunctioning data different from the TES with the originally installed error-free software.
The malfunctioning data from the TES′ are transmitted in real-time from the PD to the MES using the same method as
. The MES receives the sampled data (
: voltage [
], current [
] and power consumption [
]) from the malfunctioning TES′, and converts them into malfunctioning current/voltage data (
) using feature points, differential data (
), and integral data (
) over the same sampling interval as
. The data output from each module is as follows, according to
Table 3.
and
include the voltage comparison data (
/
), current comparison data (
/
), and power consumption comparison data (
/
) between
and
.
3.1.2. Comparison of Data
The MES infinitely repeats data from to using the dumped dataset and compares them with of the TES′ in real-time to generate the error data and .
Taking current as an example as shown in ((
1)), the MES compares the dumped normal operation current (
) of the TES and the malfunction current (
) of the TES′ and calculates the error between the two current data (
).
Here,
represents the difference or error between the two current datasets:
Because the negative (–) value of
is lower than the normal operation data, it is classified as malfunction data by converting it to an absolute value (
). An error rate (
) in (
2) specifies the normal operating range using the error as a ratio and value of the reference data
.
Here,
represents the error rate, which is calculated by dividing the absolute value of
by
and multiplying by 100 to express it as a percentage:
A specific instantaneous current value
and the set
are compared as shown in (
3); if it is outside the normal operating range, it is considered the malfunction.
Here,
represents the absolute value of the current difference at a specific moment, and
represents the threshold or limit for determining whether the data fall within the range of the normal operation:
As shown in
Table 4, assuming that a maximum current (
) in the normal operation is 90 mA, the MES sets the error rate
to 10%. If
of the TES′ exceeds 99 mA, which is
, it can be detected as the malfunction.
3.2. System Recovery and Protection
As shown in
Figure 1, if the results based on real-time data from the functioning TES′ indicate a malfunction, the TES′ is controlled by the MES malfunction recovery algorithms for either recovery or shutdown.
There are two methods to restore the TES′: (1) The first method is to detect malfunctions by monitoring the current of the TES′ in the MES and restore the system through a reset (RST) function for an internal disturbance of the TES′. (2) The second method is to detect malfunctions by monitoring changes in the operating voltage of the system due to the internal disturbance of the TES′ and prevent an external disturbance that destroys the system by blocking the driving voltage.
3.2.1. Internal Disturbance
Software-induced malfunctions in the TES′ are likely to occur intermittently, irregularly, and temporarily during operation. Upon detecting such internal disturbances caused by software, the MES monitors the current level of the TES′ as shown in
Figure 6. The MES compares the reference current data
with the malfunctioning current data
.
Upon confirming the TES′ to be malfunctioning, the MES issues a reset signal to restore it to its pre-error state, facilitating normal operation. Furthermore, the system notifies that the software causing the malfunction has errors, allowing time to secure the error correction and verification.
3.2.2. External Disturbance
From a hardware perspective, software errors render the MCU and peripheral components inoperable, leading to system malfunction. As a result, they cause external disturbances such as issues with the system’s operating voltage. If the normally supplied voltage drops to a low voltage (
) due to the destruction of components inside the system, the MES considers the TES′ as a system malfunction and an emergency situation, providing a notification accordingly. To minimize the risk of system destruction and damage as shown in
Figure 7, the clock of the TES′ is stopped, and the internal power of the MCU is blocked using a barrier function.
4. Scenarios of System Recovery and Protection
Typically, MCUs feature three power-saving modes: sleep, stop, and standby. In this system, the standby mode, which shuts off power to the MCU and all peripheral devices while halting operation of a static random access memory (SRAM) and registers, is employed for system recovery and protection scenarios.
4.1. Scenario 1: Current Monitoring of Internal Disturbance
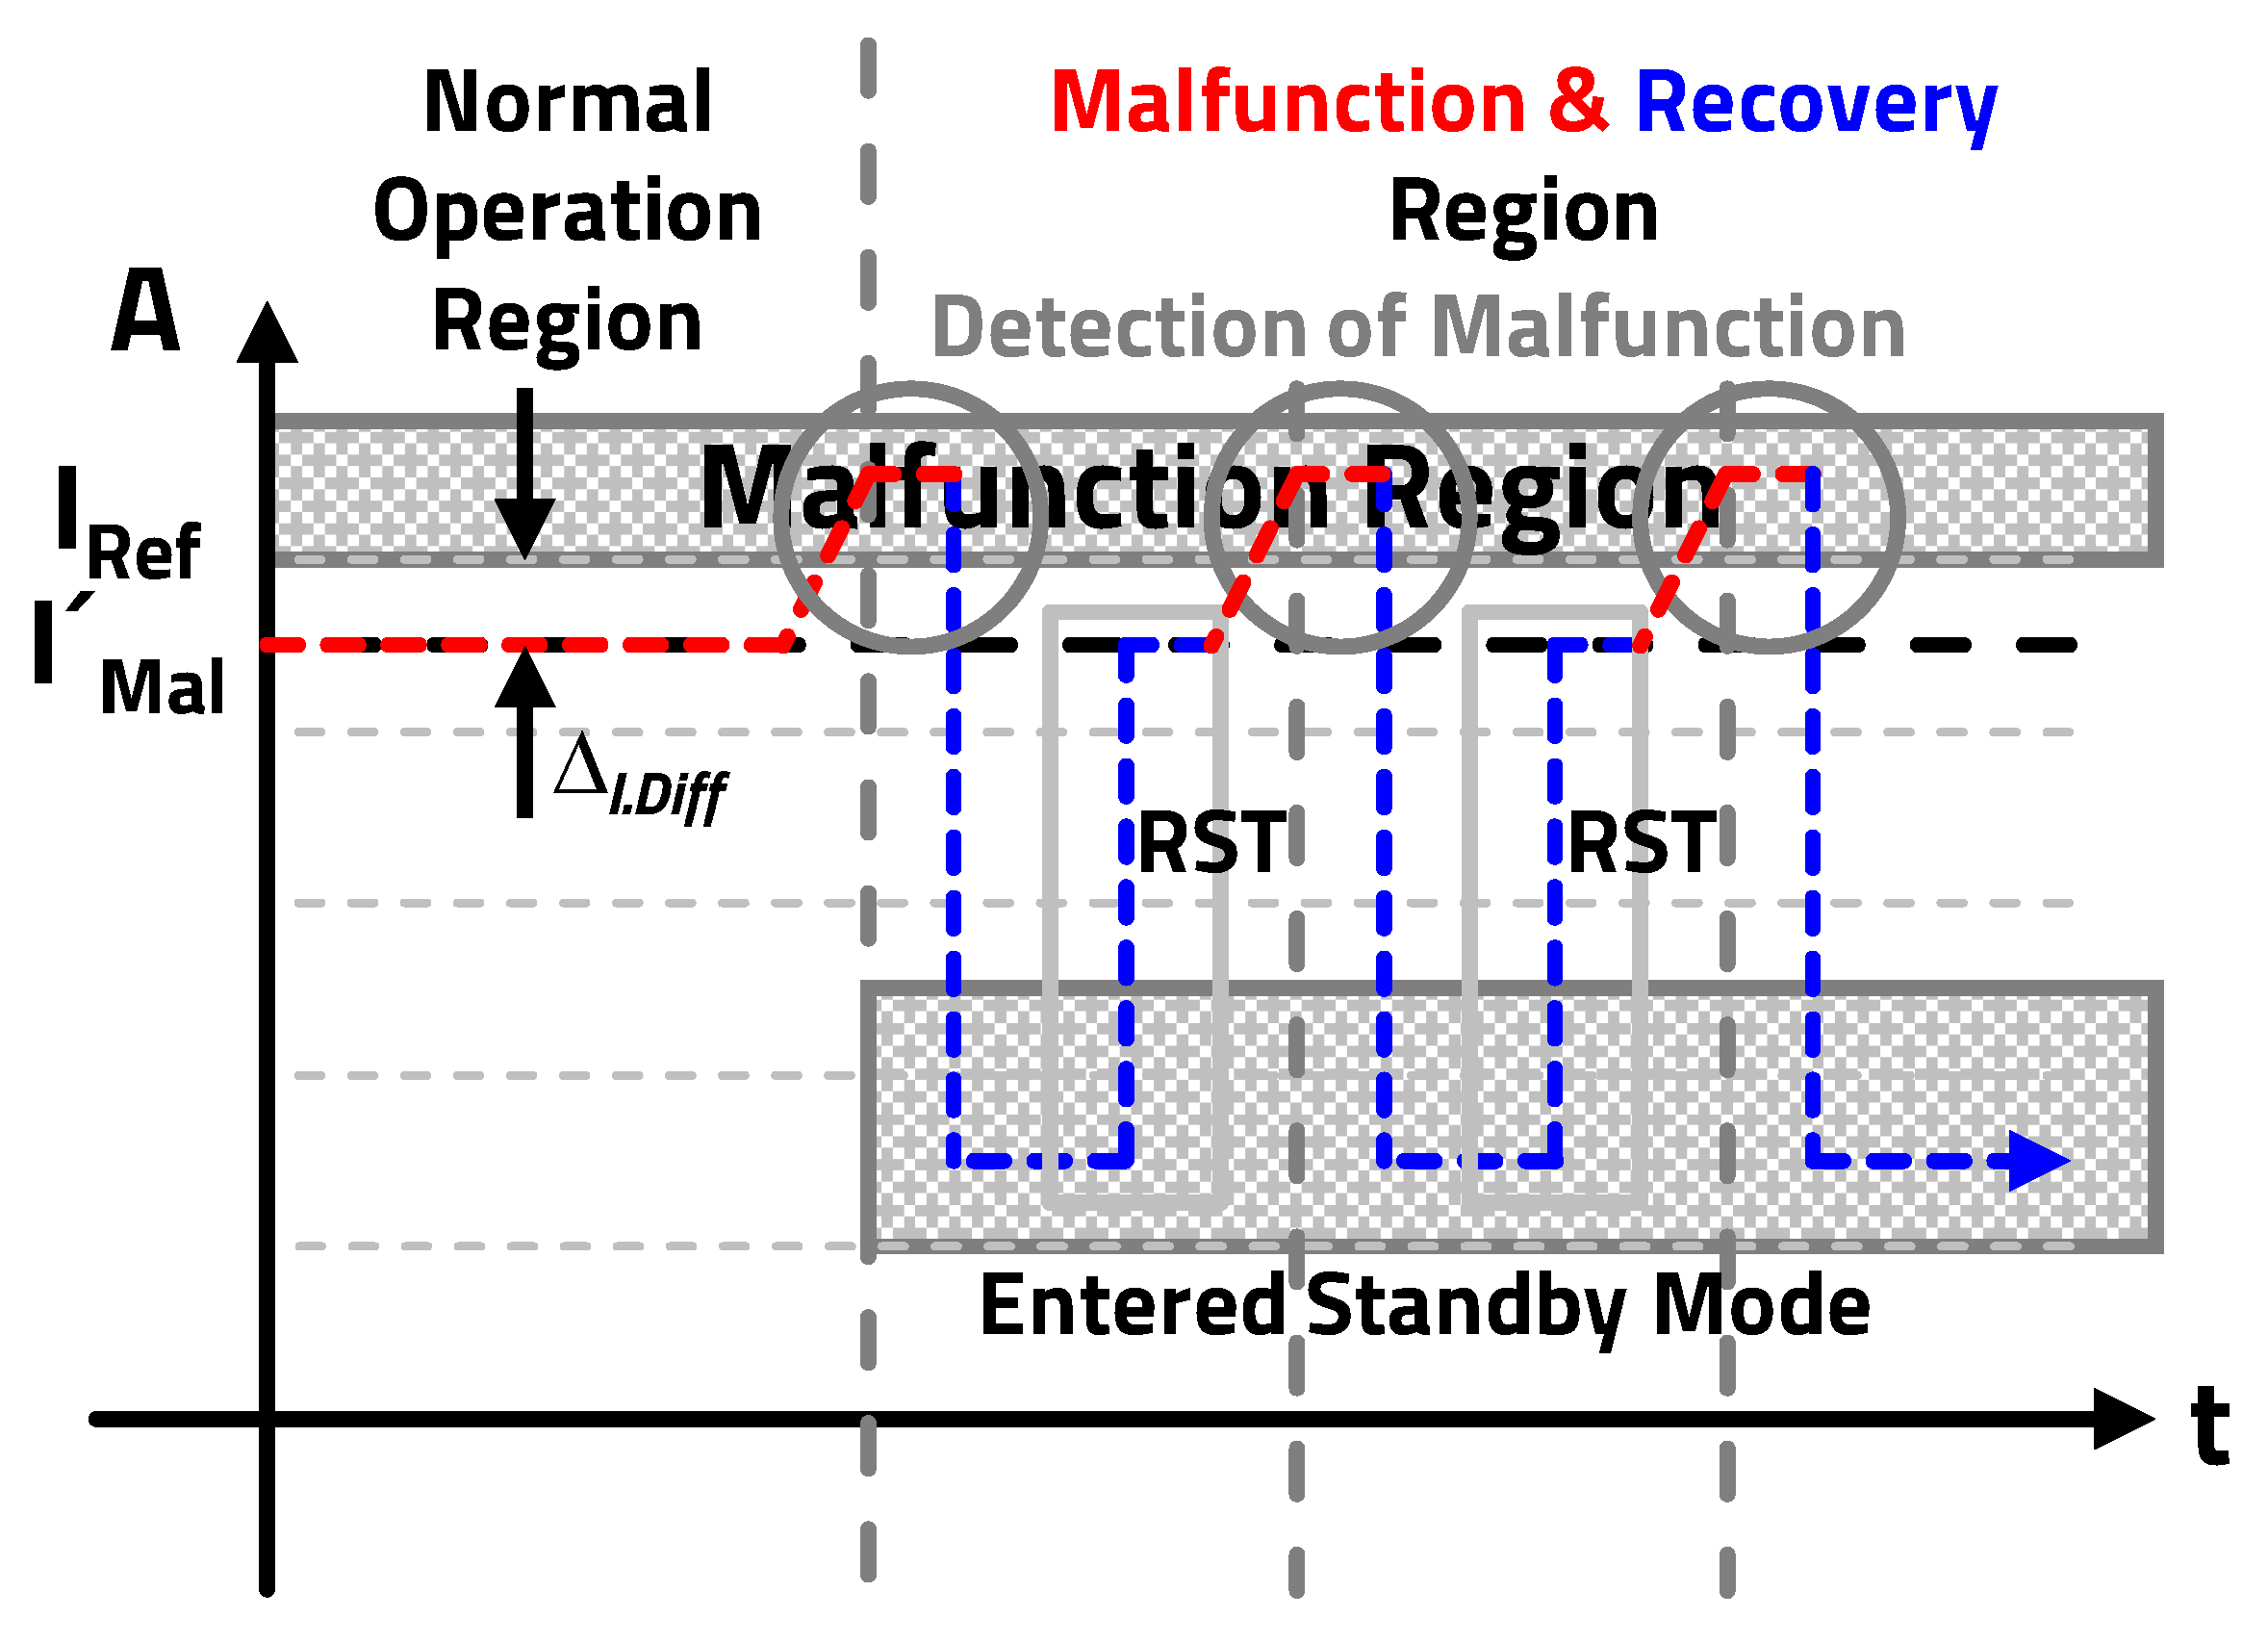
In the normal operating state, the system consumes a steady current. However, if a malfunction state consuming more than the reference current (
), as shown in
Figure 8, is detected, the MES triggers the TES′ to enter standby mode. System operation is temporarily halted, and a warning message is displayed. After a certain period, if the current of the TES′ returns to normal operation following RST and monitoring, the MES continues to monitor it. However, if the same malfunction repeats, the previous process is repeated. If the TES′ continues to malfunction even after several system RSTs, the MES deems it irrecoverable and outputs a message indicating that TES′ is irrecoverable while in standby mode, without further attempts to reset it.
Algorithm 1, as shown in
Figure 8, describes the scenario of internal disturbance current monitoring, detection of malfunctions, entering standby mode, recovery through RST, and stopping the system with a third RST.
As mentioned above, detecting malfunctions through the first current monitoring and resetting the system is also a method of system recovery. Moreover, when malfunctions are detected through current monitoring as shown in
Figure 9, another method involves suppressing the malfunctioning current of TES′ using the PID control.
As shown in
Figure 10, to protect the system, the current in the malfunctioning state is stabilized to move out of the malfunctioning region, while notifying that the system is in the malfunctioning state.
| Algorithm 1: Algorithm of current monitoring system. |
![Electronics 13 01526 i001]() |
4.2. Scenario 2: Voltage Monitoring of External Disturbance
During the monitoring of the TES′ voltage, if the internal or external components of the MCU are damaged due to system malfunction, there is a possibility of short-circuit and system destruction. As shown in
Figure 11, if
due to malfunction drops below the reference voltage level (
), the MES considers the voltage state of the TES′ as
and immediately enters standby mode to halt operation for system protection.
Algorithm 2 is a scenario where a warning message for system shutdown is displayed if the operating voltage drops below 4.3 V to prevent hardware damage and system destruction, aiming to minimize damage.
| Algorithm 2: Algorithm of voltage monitoring system. |
![Electronics 13 01526 i002]() |
5. Experiment Environment and Evaluation
5.1. Experiment Environment
The TES (=TES′), and the MES, in the proposed current/voltage-level monitoring system utilize the same module based on the Cortex-M4 core from STMicroelectronics, specifically the STM32F407G-DISC1. The characteristics of the STM32F407G-DISC1 module are as follows as listed in
Table 5.
To measure the data (voltage, current, and power consumption) of the TES′, we configured the experimental environment using ODROID’s Smart Power 3 for the PD as shown in
Figure 12.
In the configured experimental environment, when the TES′ operates using the power supplied from the PD as shown in
Figure 13, the MES compares it with the dumped
. (1) Depending on the current state due to internal errors, the MES applies a hardware reset control signal to the TES′ negative reset (NRST) port from a general-purpose input/output (GPIO). (2) If a voltage drop is detected that could lead to system damage due to internal errors, the MES enters standby mode to minimize power supplied internally to the TES′ and applies control signals through UART communication from GPIO.
5.2. Result of Data Extraction
of the normal operating state was extracted, and
was sampled at 100 ms intervals to show the feature points of the current level as shown in
Figure 14. Although only a few feature points are shown in
Figure 14, the actual data for normal operation are distributed in the range of 75 to 95 mA.
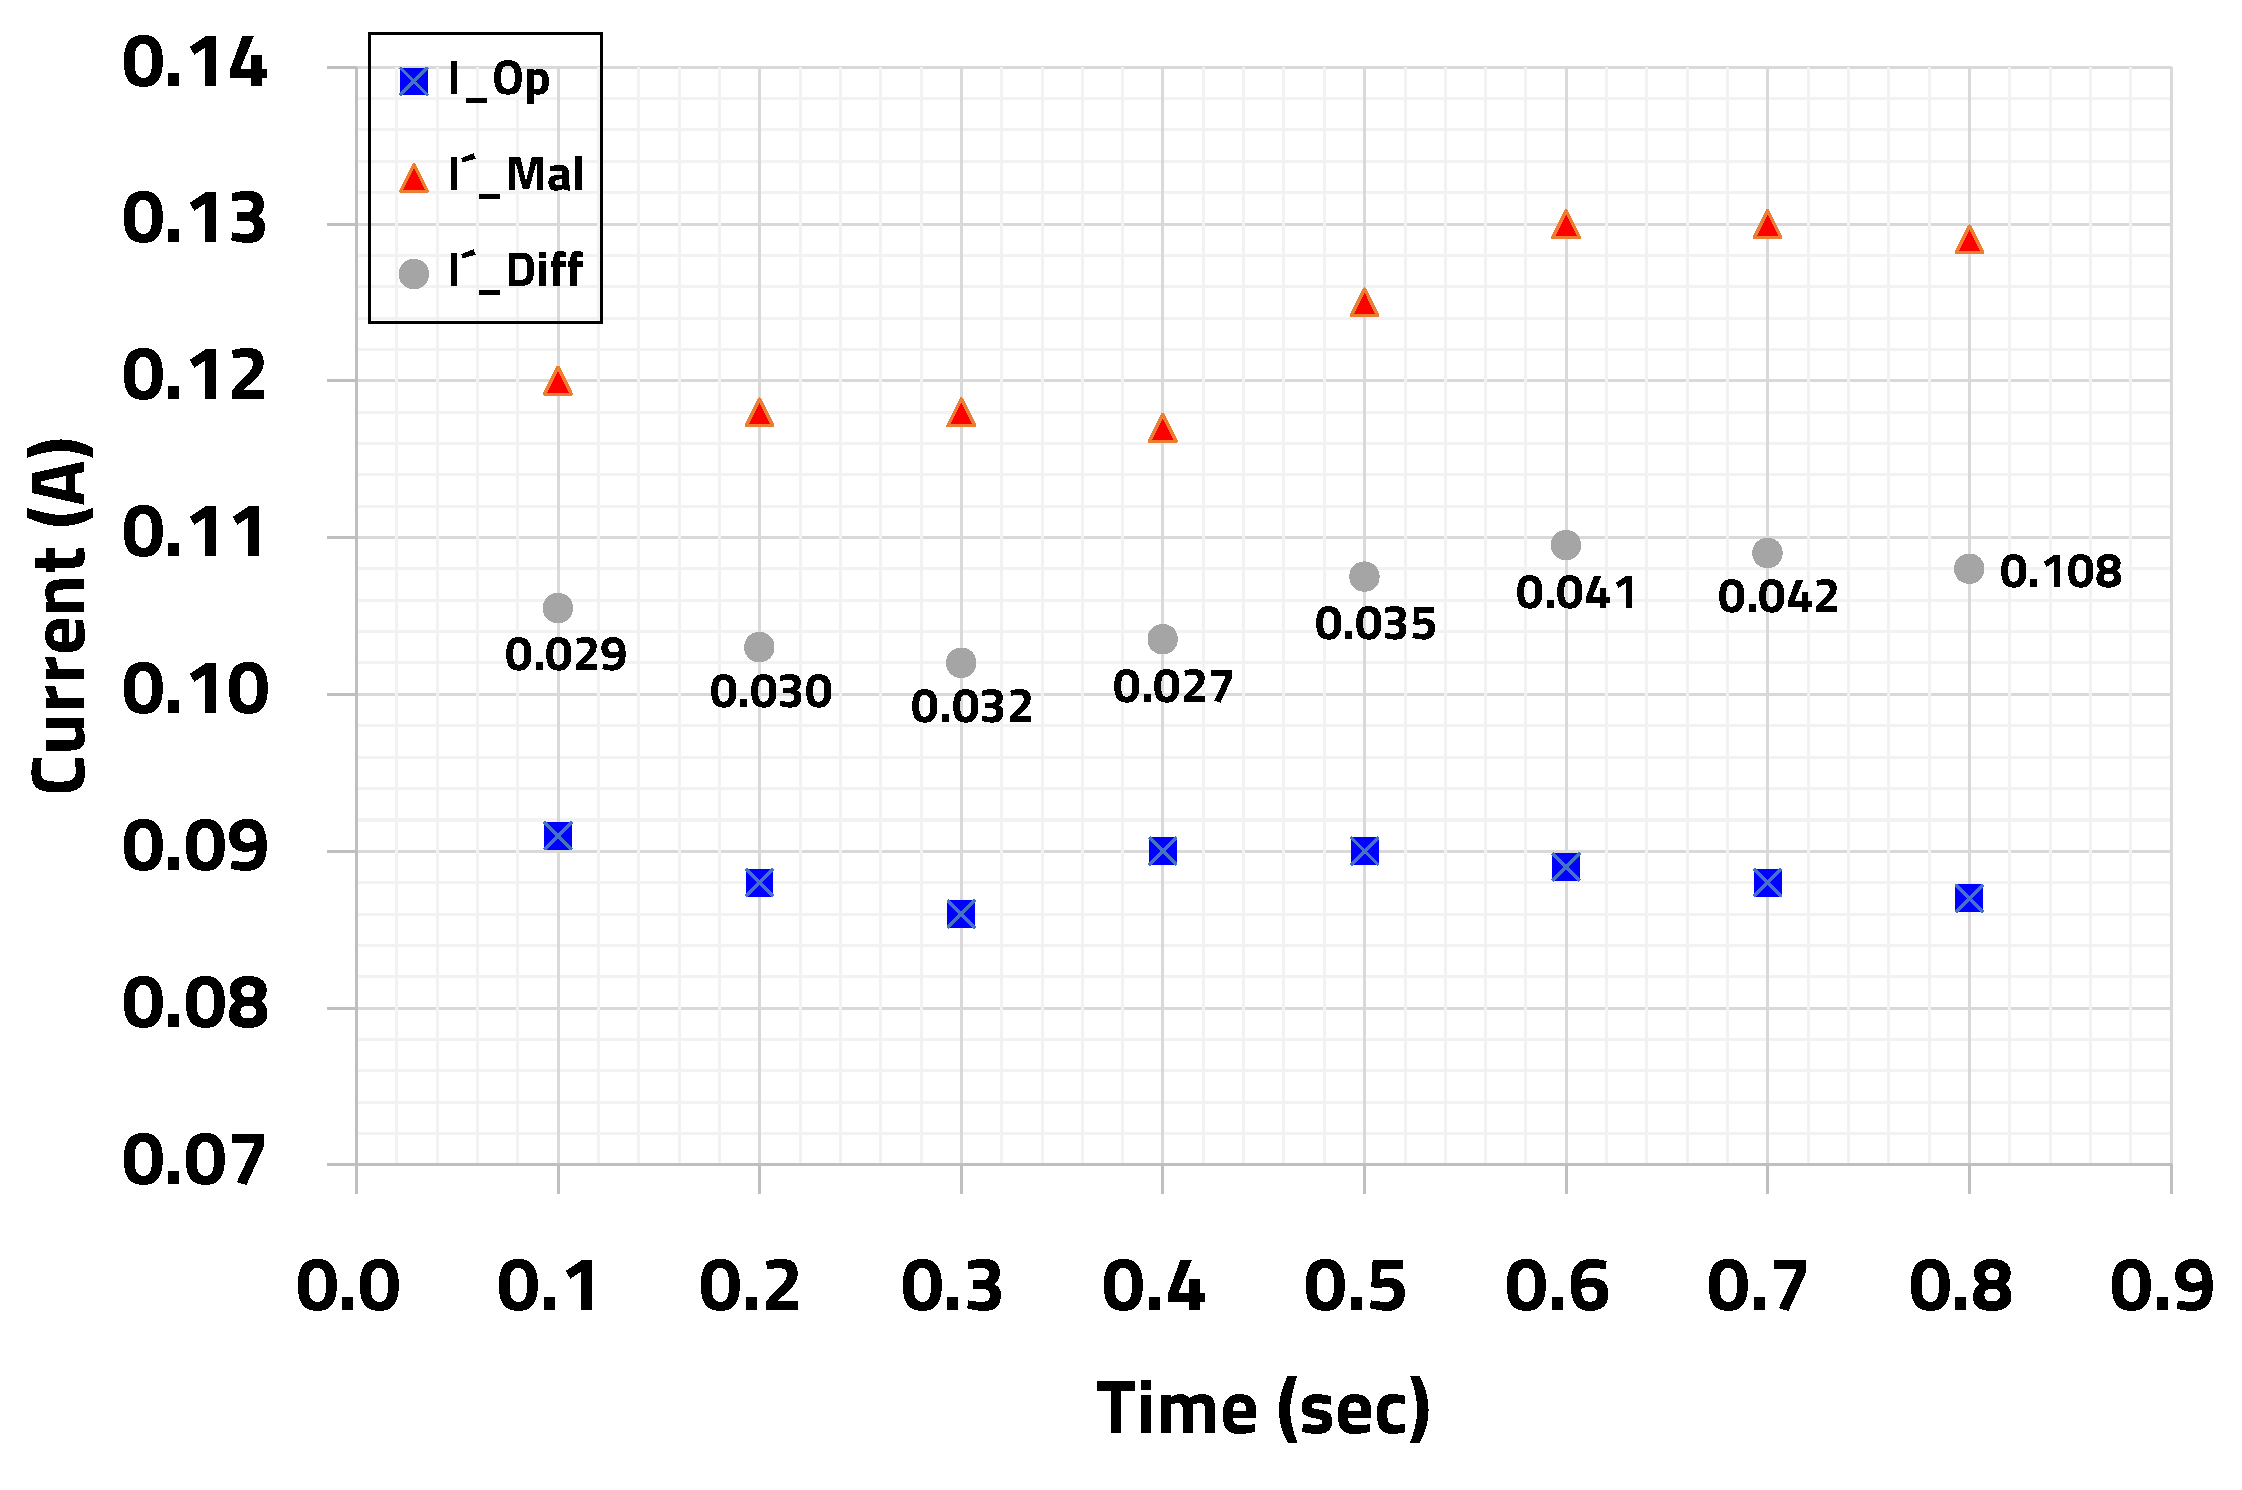
Similarly to
Figure 14,
Figure 15 also shows the comparison between the extracted feature points of TES′’s
and the associated error
. The feature points of normal operation data are represented in blue, those of malfunctioning data in red, and the gray points indicate the difference between the two datasets.
Additionally, the current data in
Figure 15 are represented as shown in
Table 6, and the feature points of voltage and power consumption data can also be extracted using the same method.
5.3. Experiment Evaluation
The experiment is divided into two main parts: (1) system recovery experiment for internal disturbance through current monitoring, and (2) system protection experiment for external disturbance through voltage monitoring.
5.3.1. Result of Internal Disturbance Experiment
The internal disturbance experiment validates the detection of system malfunctions through current monitoring and verifies the system’s recovery process.
For reliable malfunction detection, the experiment assumed that if 10 or more consecutive malfunction detection data points are output, it is considered the malfunction. As shown in
Figure 16, when malfunction detection data occur intermittently, the system confirms that it does not consider them to be the malfunction.
The requirement for 10 consecutive malfunction datasets is a system-defined value, so reducing the number of datasets is acceptable. However, if the number of malfunction datasets is reduced, it may mistakenly detect 2∼3 intermittent normal operation datasets as malfunctions. Therefore, it is necessary to dynamically adjust the number of datasets based on the state of the system when applying the algorithm.
Figure 17a shows the waveform of the current during normal operation, and as mentioned earlier in
Figure 16,
Figure 17b shows a waveform that does not detect intermittent transient current spikes as malfunctions. Following the sequence, it was confirmed that the first current spike was not detected as the malfunction with four datasets, the second with five datasets, and the subsequent ones with four, five, six, and five datasets.
Figure 17c compares the waveform of normal operation (
) with the current waveform during malfunction (
), setting the error margin to approximately 20%. When TES′ is in normal operation (=TES), the system’s
consumes approximately 75 to 95 mA. However, during malfunction, the current
increases to around 115 to 130 mA. Since
was detected to be over 20 mA, and it exceeded the 20% error range of the maximum current during normal operation,
, which is 95 mA, by reaching 114 mA, it was detected as the malfunction.
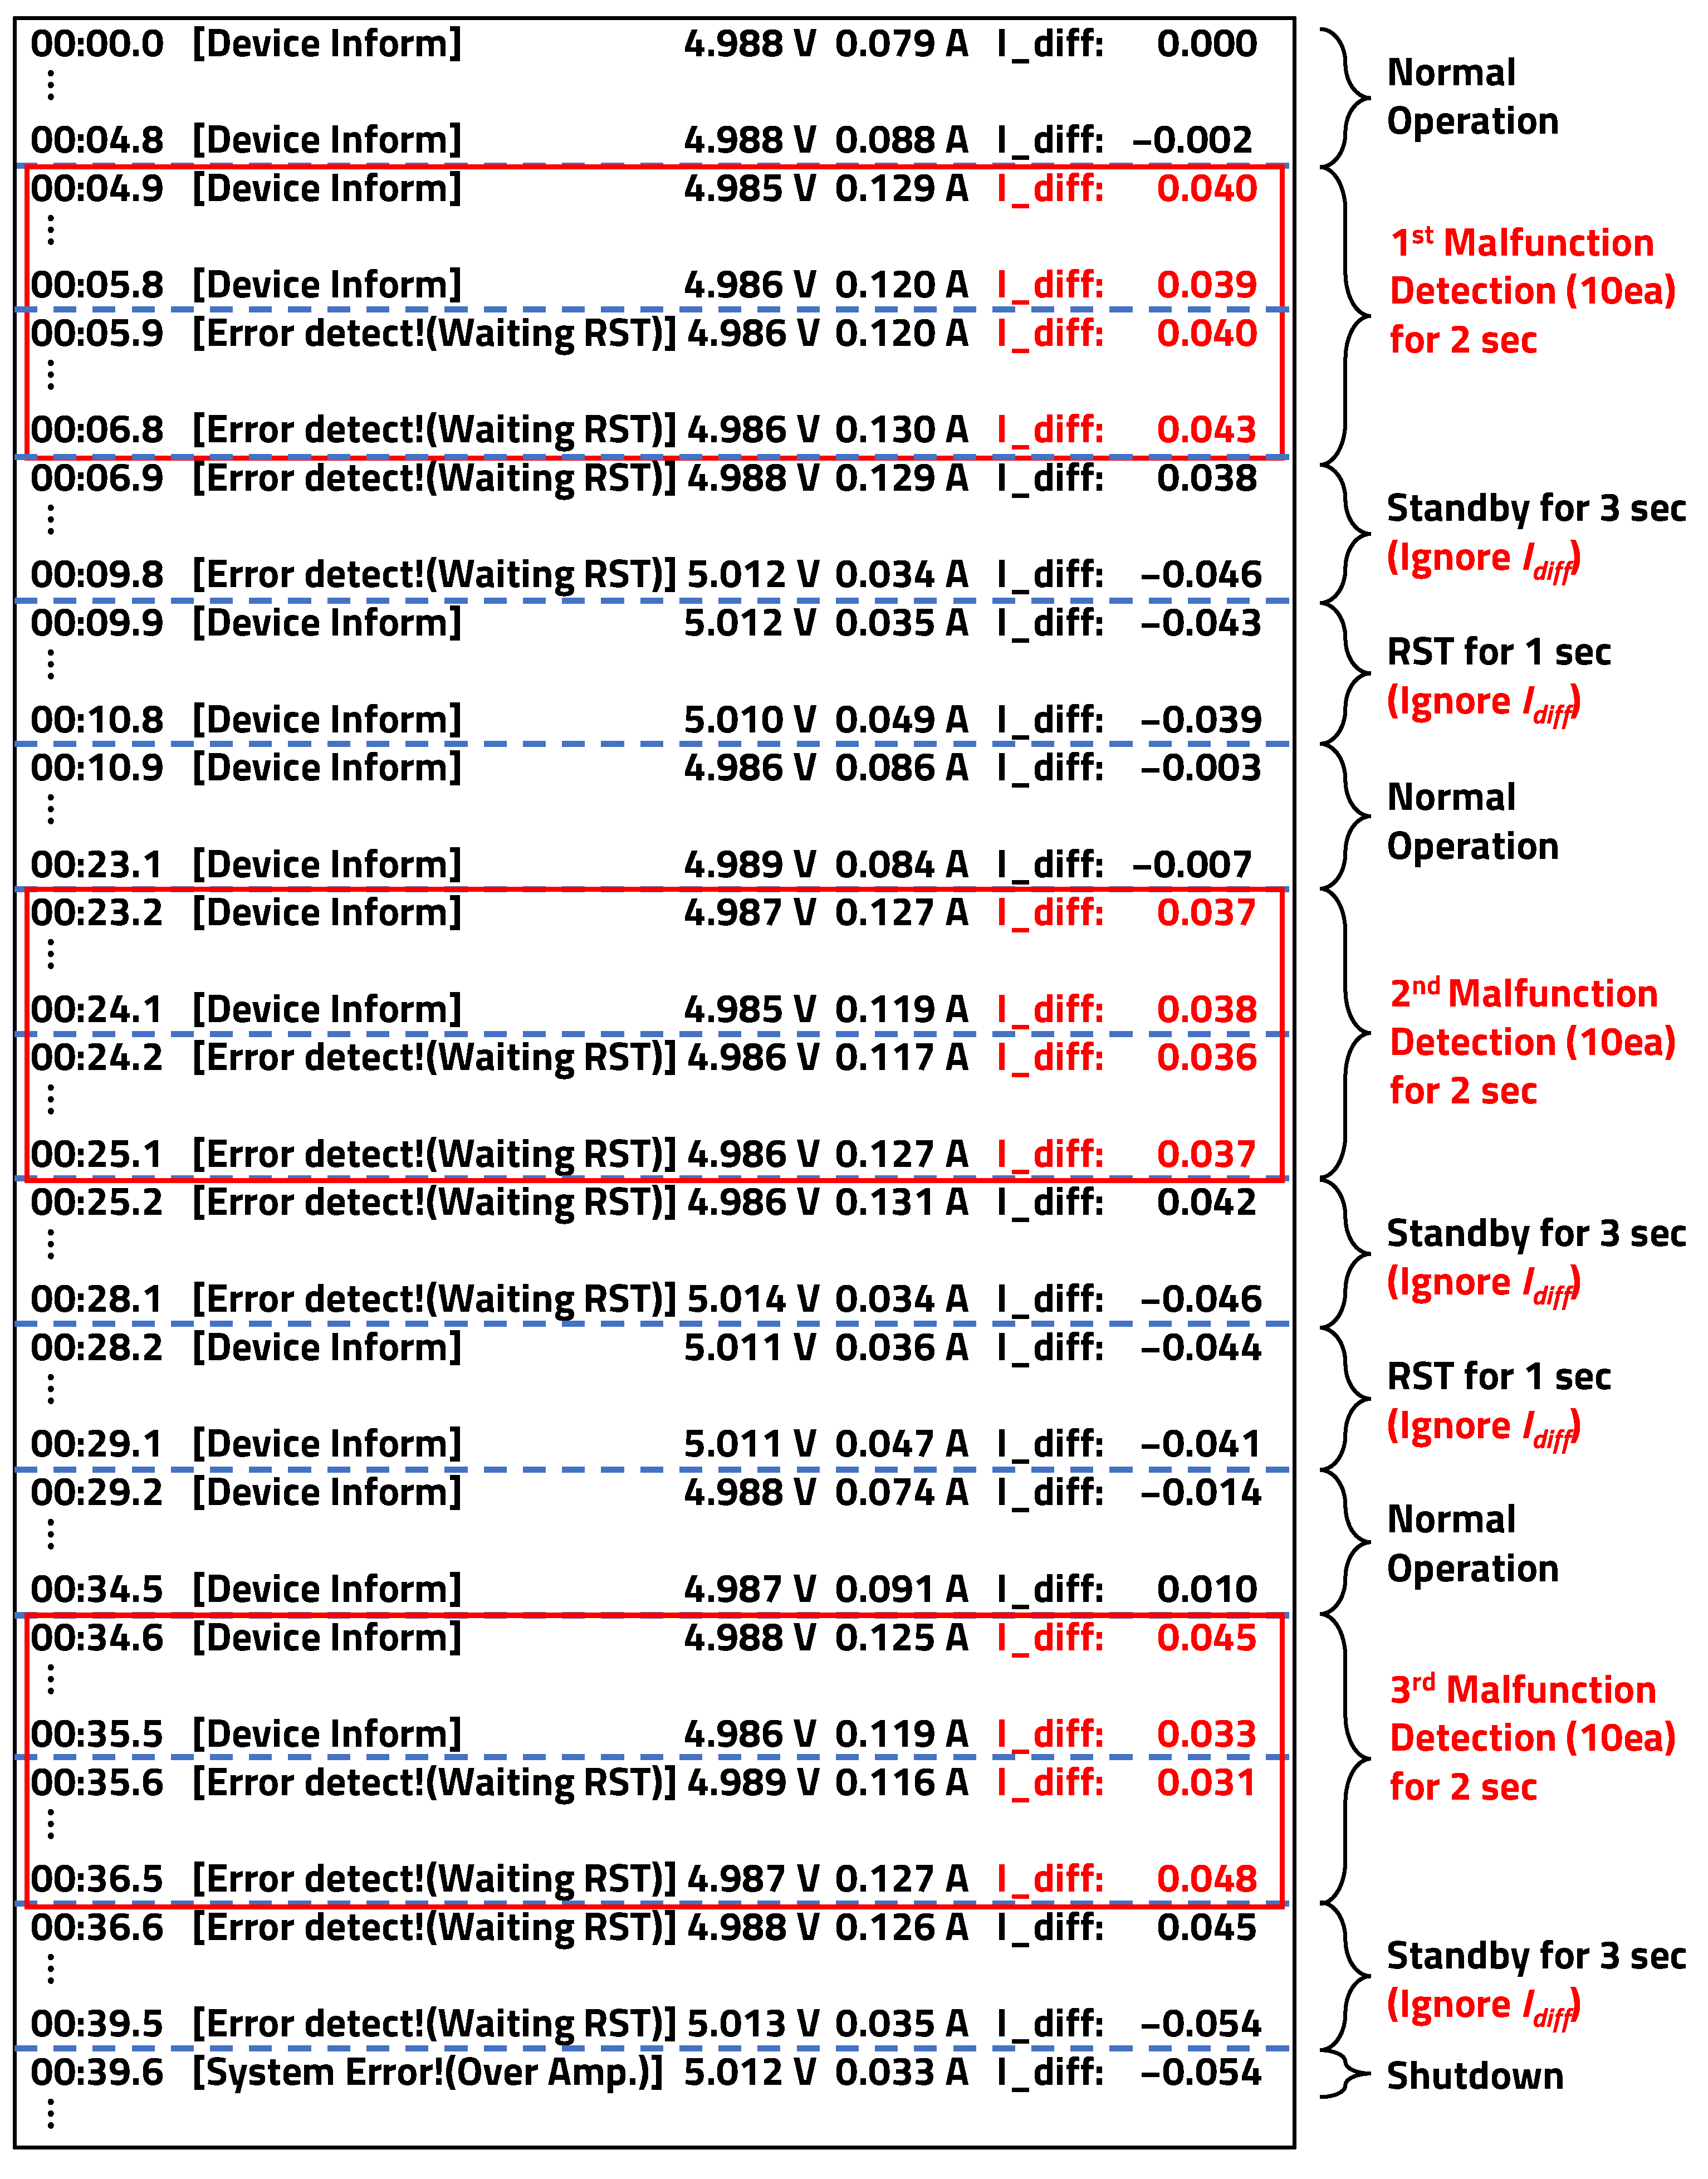
The MES, detecting the TES′ as malfunctioning, displayed the message “Error Detection!(Waiting RST)” as shown in
Figure 18 and temporarily put the TES′ into standby mode to halt the malfunction. The system was reset to restore it to the state before malfunction, and when the normally functioning system malfunctioned again, the previously performed recovery process was repeated. When the system, after two attempts at recovery, malfunctions for the third time, it is considered irrecoverable, and the TES′ is put into standby mode for system protection. Additionally, the “System Error!(Over Amp.)” message indicating the shutdown is displayed, confirming that no further attempts at RST will be made.
The experiment involved malfunction detection through a one-to-one comparison of each feature point. Through algorithm validation experiments, the possibility of applying additional algorithms using the correlation factor of datasets over time for more accurate malfunction detection and defense measures was confirmed.
The second method for system recovery, as mentioned in
Section 4.1, is to stabilize the current state of malfunction using the PID control. The experiment involved stabilizing the malfunctioning current state to the normal operating current state through the PID control when an increase in current was detected in the normally operating system to prevent system errors. As shown in
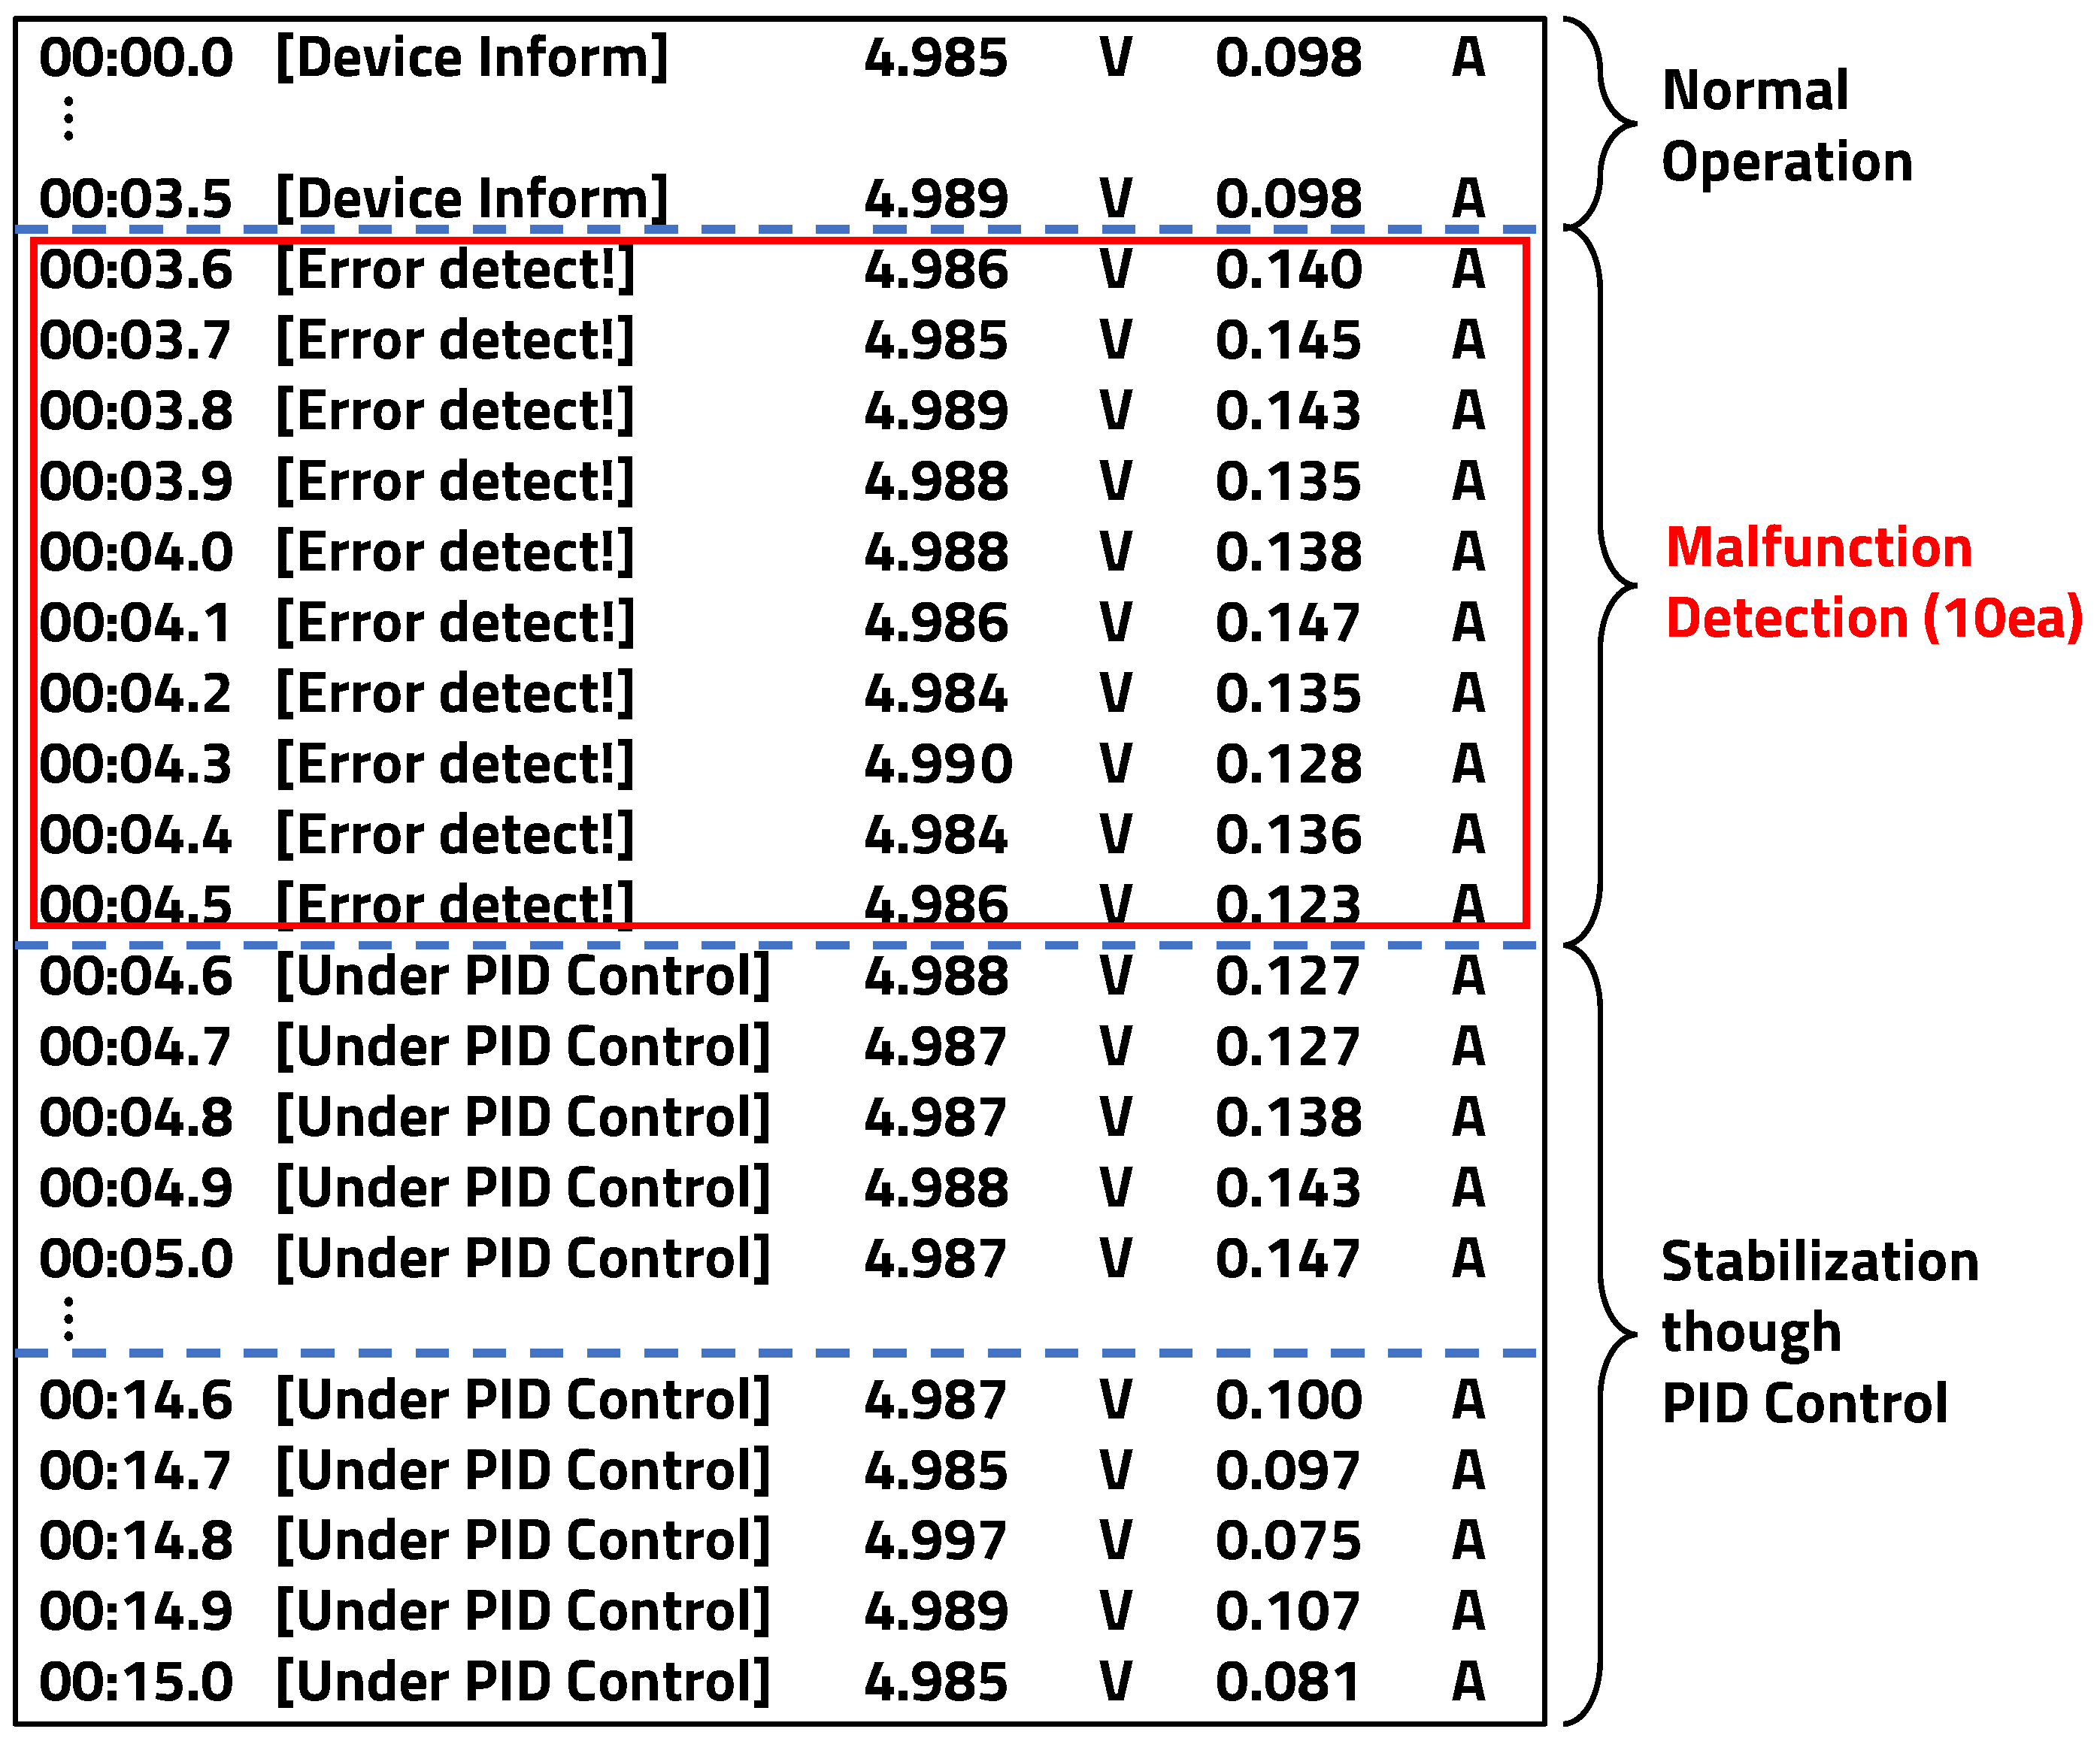
Figure 19, when a current exceeding approximately 110 mA, set as the malfunctioning state, was detected continuously for 10 iterations, the system determined that it was in the malfunctioning state. After this determination, it was observed that the system stabilized to the normal operating state through the PID control.
However, stabilizing the current state alone does not necessarily mean that the system has fully recovered to normal operation. Therefore, to allow administrators or users to analyze the system’s status, messages such as “Error Detection!” and “Under PID Control” are displayed, as shown in
Figure 20, to notify of the occurrence of system malfunctions.
5.3.2. Result of External Disturbance Experiment
The external disturbance experiment verifies the prevention and protection of system damage due to the influence of the system’s voltage status. This experiment follows the same method as the internal disturbance experiment, allowing for the comparison of voltage levels. However, it is expected that there will be minimal or negligible voltage changes due to malfunctions in the system’s operating voltage. Minor voltage fluctuations were excluded from the experiment, and it was conducted considering cases of voltage drops that could occur in actual systems.
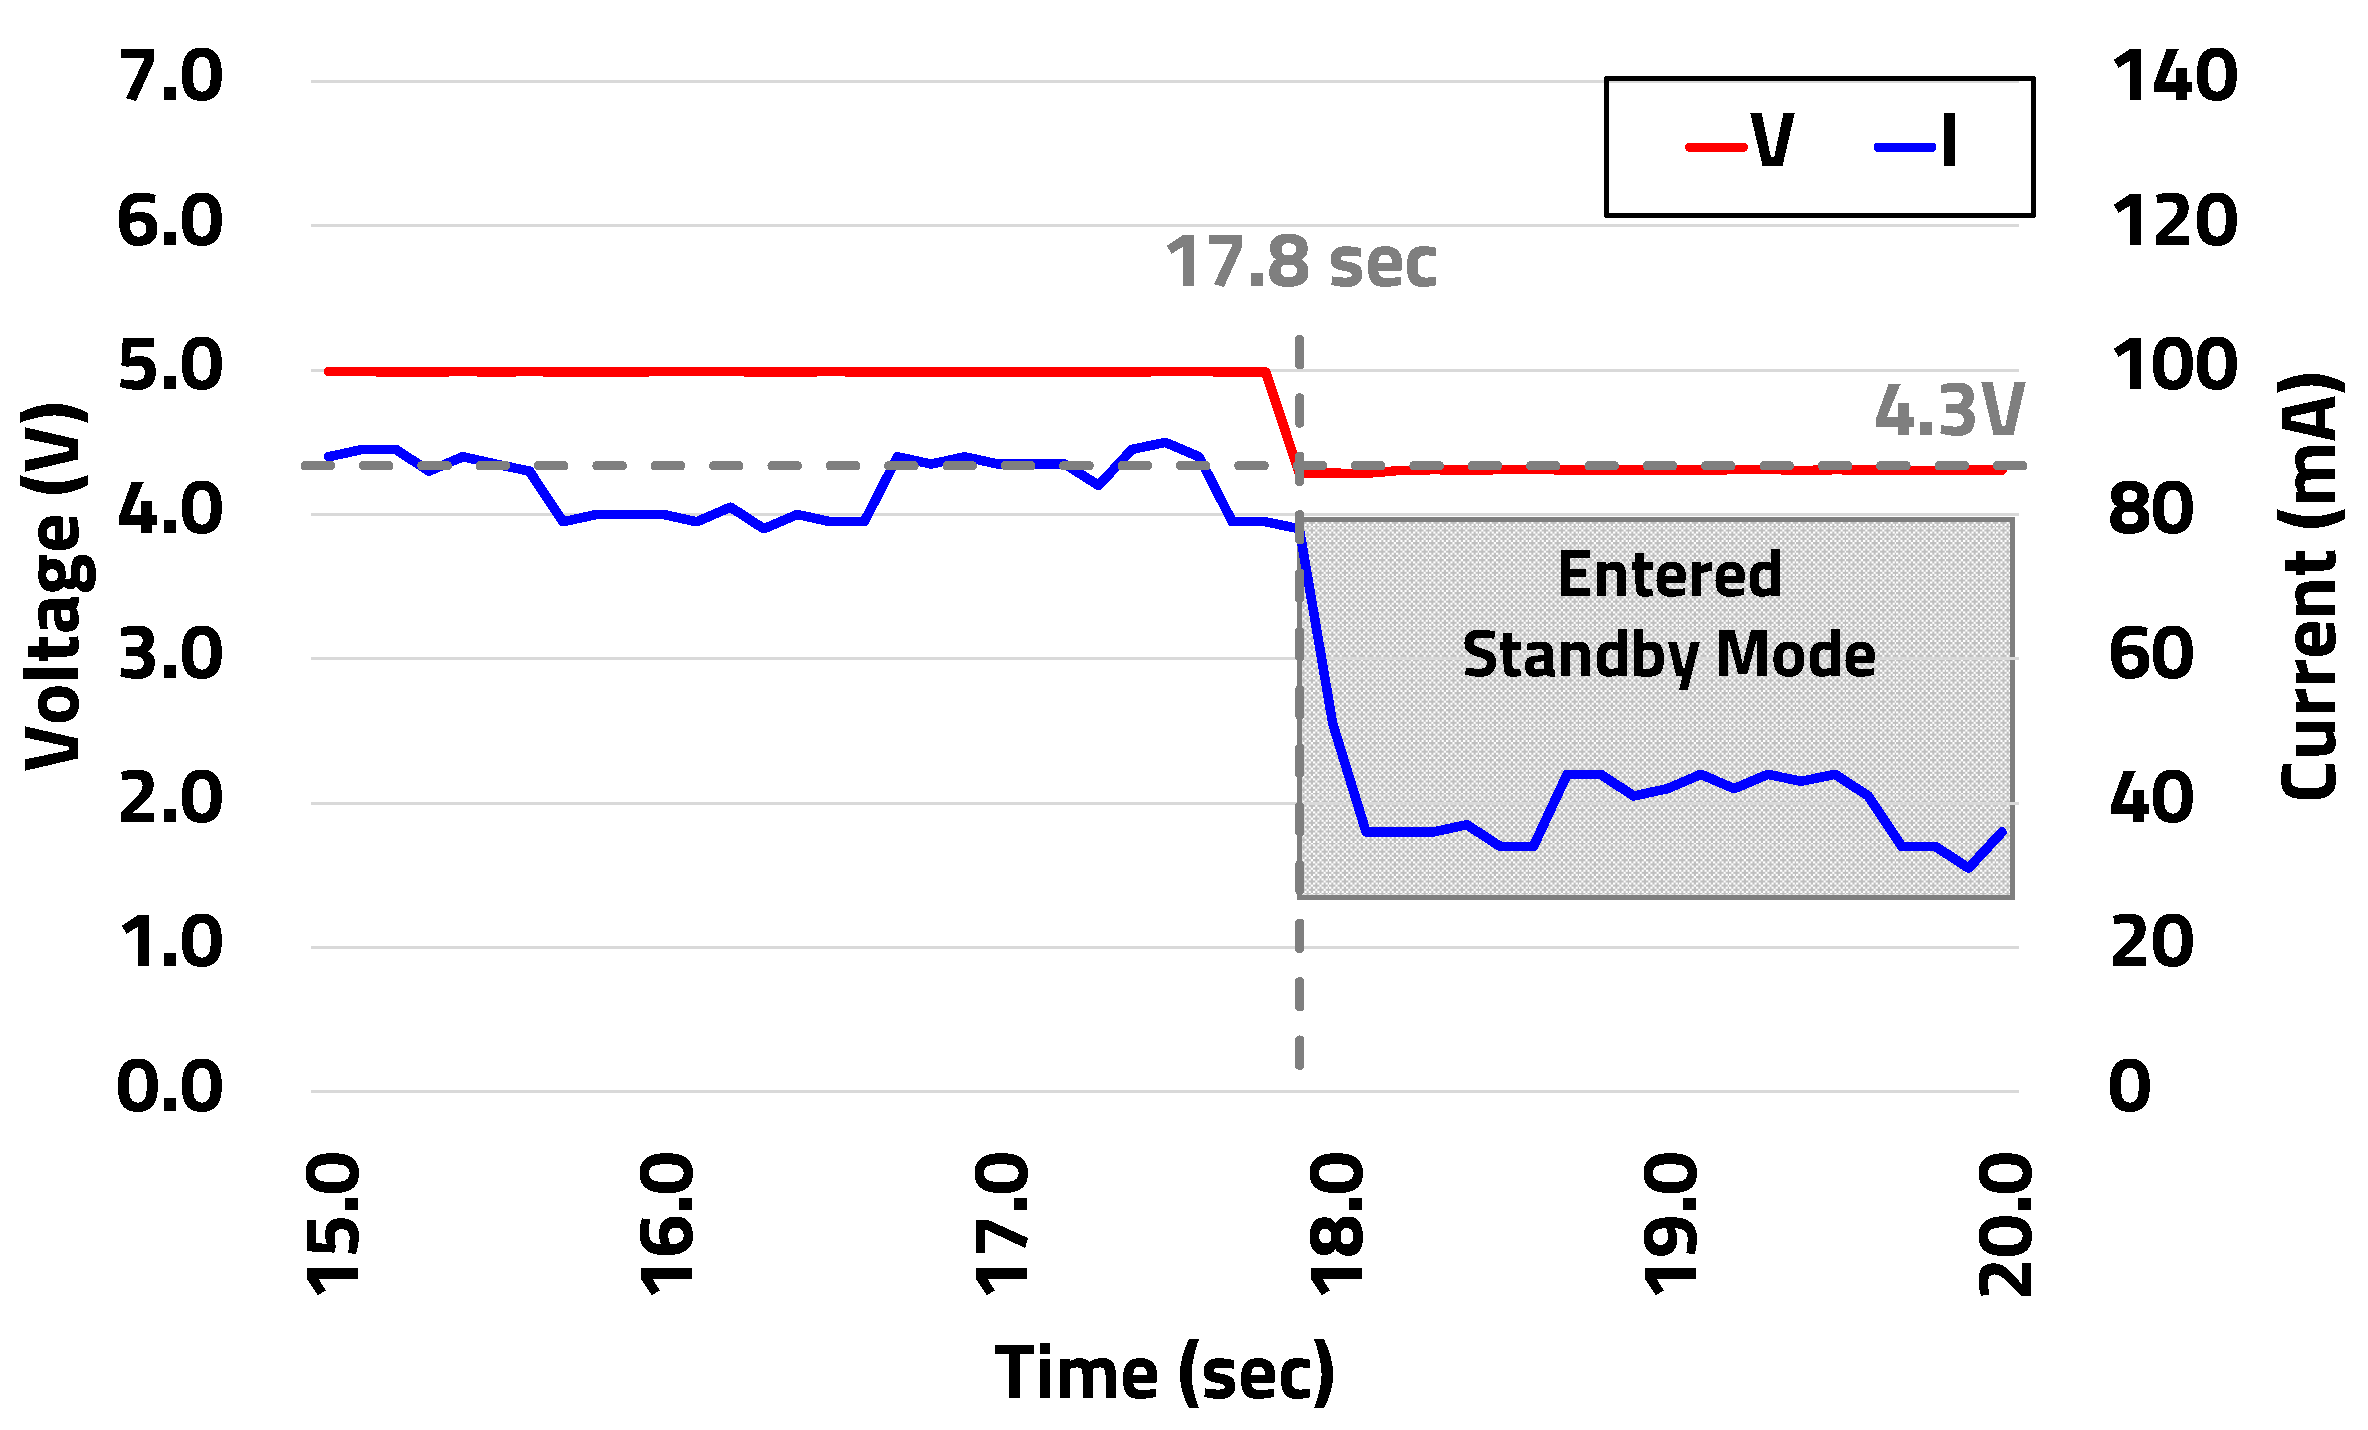
The external disturbance experiment compared the voltage
in the normal operating state with the voltage
in the malfunctioning state. When the TES′ is in the normal operating state,
remains at 5 V, but if internal disturbance occurs and damages the system components, the voltage will decrease. Therefore, if the system voltage drops below the threshold low voltage
of 4.3 V while operating at 5 V, as shown in waveform in
Figure 21, the TES′ transitions into standby mode.
To activate the system after it enters standby mode due to the detection of low voltage, it is designed to require hardware initialization. This is done to allow users or engineers to analyze the cause of the error, verify it, and make corrections before initializing the hardware.
When
decreased to
as shown in
Figure 21, it was confirmed that the system status triggers the message “System Error!(Under Volt.)” as shown in
Figure 22.
When applied in a real environment, the output data of the message can be converted into an emergency alert signal and conveyed to the user through devices such as LEDs or sirens to communicate the situation.
6. Conclusions
This paper proposes a system for monitoring current/voltage levels to detect system malfunctions caused by software errors in embedded systems.
Embedded system software code-based malfunctions occur during run-time, making it impossible to reproduce system behavior solely through verification of the software code level, excluding the system itself. Furthermore, static error modeling and reproduction of run-time errors are challenging, leading to increased costs associated with verification testing. Indeed, the process of loading embedded software directly onto the system and verifying its impact and behavior is essential. By applying the proposed malfunction monitoring system in this paper, it is possible to detect malfunctions caused by software errors through current/voltage level monitoring alone on the hardware where the software is loaded. Therefore, it was confirmed that it is possible to reduce the developer’s verification period and costs.
The MES monitoring the malfunction extracts the current/voltage data pattern during normal system operation. The extracted pattern, generated automatically with just one dump, compares the data with the TES′ in real-time, enabling the immediate detection of normal or malfunction states. Upon detecting a malfunction, the recovery and protection algorithms are utilized to initialize the TES′ for normal operation, thereby preventing system damage or destruction caused by malfunctions. The research confirmed the potential of ensuring the safety by controlling and preventing malfunctions caused by software errors in embedded systems through monitoring and comparing the patterns and changes in the current/voltage level characteristics.
The possibility of further applying algorithms utilizing the correlation factor of datasets for improved malfunction detection and recovery strategies was confirmed for future enhancements. Additionally, the intention to leverage an artificial intelligence (AI) technology using using a Tiny Machine Learning (TinyML), suitable for the limited resources of MCUs, is planned. However, applying the algorithms proposed in this paper universally to all systems poses challenges. While systems consuming linear current can readily adopt these algorithms, systems with non-linear current consumption require ongoing research using advanced malfunction detection methods such as the correlation factor algorithm and AI technology mentioned earlier.
This paper validated the malfunction monitoring system based on TES (MCU)–MES (MCU). In the future, research will focus on implementing malfunction monitoring systems based on field-programmable gate array (FPGA) embedded systems such as TES (FPGA)–MES (MCU), and TES (FPGA)–MES (FPGA). Additionally, there will be a need for research on efficient malfunction defense and power consumption reduction through power block control and system clock speed control in embedded systems. Establishing interfaces for stable system implementation across heterogeneous systems, transferring fault detection and monitoring algorithms and systems to the TES, and optimizing them are essential. Furthermore, we plan to enhance the safety and stability of systems in high-risk industries, such as automotive and medical fields, where complex software is prevalent.
Author Contributions
S.L. designed the entire architecture and performed the hardware/software implementation and experiments. D.P. had his role as corresponding author and the principle investigator for this research. All authors have read and agreed to the published version of the manuscript.
Funding
This study was supported by the BK21 FOUR project (4199990113966), the Basic Science Research Program (NRF-2018R1A6A1A03025109, 10%), (NRF-2022R1I1A3069260, 10%) through the National Research Foundation of Korea (NRF) funded by the Ministry of Education, and (2020M3H2A1078119) by Ministry of Science and ICT. This work was partly supported by an Institute of Information and communications Technology Planning and Evaluation (IITP) grant funded by the Korean government (MSIT) (No. 2021-0-00944, Metamorphic approach of unstructured validation/verification for analyzing binary code, 20%) and (No. 2022-0-01170, PIM Semiconductor Design Research Center, 20%) and (No. RS-2023-00228970, Development of Flexible SW-HW Conjunctive Solution for On-edge Self-supervised Learning, 30%). The EDA tool was supported by the IC Design Education Center (IDEC), Korea. This work was supported by the National Research Foundation of Korea (NRF) grant funded by the Korea government (MSIT) (NRF-2021R1A5A1021944, 10%).
Data Availability Statement
Data are contained within the article.
Conflicts of Interest
The authors declare no conflicts of interest. The founding sponsors had no role in the design of the study; in the collection, analyses, or interpretation of data; in the writing of the manuscript; or in the decision to publish the results.
Abbreviations
The following abbreviations are used in this manuscript:
| IT | Information technology |
| TES | Target embedded system |
| MES | Embedded system for monitoring |
| PID | Proportional Integral Derivation |
| PD | Power debugger |
| Output data from PD transmits data |
| UART | Universal asynchronous receiver/transmitter |
| Dumped dataset |
| Voltage of TES |
| Current of TES |
| Power consumption of TES |
| MCU | Microcontroller unit |
| Sampled data of TES′ |
| Voltage of TES′ |
| Current of TES′ |
| Power consumption of TES′ |
| Malfunctioning current/voltage data of TES′ |
| Differential data of TES′ |
| Integral data of TES′ |
| / | Voltage comparison data of TES′ |
| / | Current comparison data of TES′ |
| / | Power consumption comparison data of TES′ |
| Dumped normal operation current of TES |
| Malfunction current of TES′ |
| Compared current data of TES′ |
| Absolute value of TES′ |
| Error rate |
| Maximum current level of TES |
| RST | Reset |
| SRAM | Static random access memory |
| Low voltage level |
| Reference current level |
| Reference voltage level |
| GPIO | General-purpose input/output |
| NRST | Negative reset |
| AI | Artificial intelligence |
| TinyML | Tiny machine learning |
| FPGA | Field-programmable gate array |
References
- Kane, S.; Liberman, E.; DiViesti, T.; Click, F.; MacDonald, M. Update Report: Toyota Sudden Unintended Acceleration; Technical Report; Safety Research & Strategies, Inc.: Rehoboth, MA, USA, 2010. [Google Scholar]
- Travis, G. How the Boeing 737 Max Disaster Looks to a Software Developer; Technical Report; IEEE Spectrum: New York, NY, USA, 2019. [Google Scholar]
- Gottlich, P.; Reuss, H.C. Work-in-Progress: Physics-Based Software Analysis for Safety-Critical Embedded Applications. In Proceedings of the 2019 International Conference on Embedded Software (EMSOFT), New York, NY, USA, 13–18 October 2019; pp. 1–2. [Google Scholar] [CrossRef]
- Chang, J.; Oh, S.; Park, D. Work-in-Progress: Accuracy-Area Efficient Online Fault Detection for Robust Neural Network Software-Embedded Microcontrollers. In Proceedings of the 2022 International Conference on Embedded Software (EMSOFT), Shanghai, China, 7–14 October 2022; pp. 1–2. [Google Scholar] [CrossRef]
- Fellner, D.; StrasserThomas, T.I.; Kastner, W. The DeMaDs Open Source Modeling Framework for Power System Malfunction Detection. In Proceedings of the 2023 Open Source Modelling and Simulation of Energy Systems (OSMSES), Aachen, Germany, 27–29 March 2023; pp. 1–6. [Google Scholar] [CrossRef]
- Hasegawa, K.; Yanagisawa, M.; Togawa, N. Detecting the Existence of Malfunctions in Microcontrollers Utilizing Power Analysis. In Proceedings of the 2018 IEEE 24th International Symposium on On-Line Testing And Robust System Design (IOLTS), Platja d’Aro, Spain, 2–4 July 2018; pp. 97–102. [Google Scholar] [CrossRef]
- Liu, Y. The malfunction diagnosis and monitoring of power transformer. In Proceedings of the 2011 6th International Forum on Strategic Technology, Harbin, China, 22–24 August 2011; Volume 1, pp. 403–405. [Google Scholar] [CrossRef]
- Teymouri, A.; Mehrizi-Sani, A. Sensor Malfunction Detection and Mitigation Strategy for a Multilevel Photovoltaic Converter. IEEE Trans. Energy Convers. 2020, 35, 886–895. [Google Scholar] [CrossRef]
- Lockhart, J.; Purdy, C.; Wilsey, P.A. Error Analysis and Reliability Metrics for Software in Safety Critical Systems. In Proceedings of the 2018 IEEE 61st International Midwest Symposium on Circuits and Systems (MWSCAS), Windsor, ON, Canada, 5–8 August 2018; pp. 512–515. [Google Scholar] [CrossRef]
- Yongjie, L.; Yong, Q.; Meifang, D. Predict Malfunction-Prone Modules for Embedded System Using Software Metrics. In Proceedings of the 2007 8th International Conference on Electronic Measurement and Instruments, Xi’an, China, 16–18 August 2007; pp. 2-539–2-542. [Google Scholar] [CrossRef]
- Horikoshi, H. Preventing Method of Malfunctions by implemeting Fingerprint Reader Active Signal to NFC Controller. In Proceedings of the 2019 IEEE 8th Global Conference on Consumer Electronics (GCCE), Osaka, Japan, 15–18 October 2019; pp. 1016–1017. [Google Scholar] [CrossRef]
- Lutz, R.R. Analyzing software requirements errors in safety-critical, embedded systems. In Proceedings of the 1993 IEEE International Symposium on Requirements Engineering, San Diego, CA, USA, 4–6 January 1993; pp. 126–133. [Google Scholar] [CrossRef]
- Goues, C.L.; Pradel, M.; Roychoudhury, A.; Chandra, C. Automatic Program Repair. IEEE Softw. 2021, 38, 22–27. [Google Scholar] [CrossRef]
- Farazmand, N.; Fazeli, M.; Miremadi, S.G. FEDC: Control Flow Error Detection and Correction for Embedded Systems without Program Interruption. In Proceedings of the 2008 Third International Conference on Availability, Reliability and Security, Barcelona, Spain, 4–7 March 2008; pp. 33–38. [Google Scholar] [CrossRef]
- Sadi, M.S.; Myers, D.G.; Sanchez, C.O. A Design Approach for Soft Error Protection in Real-Time Embedded Systems. In Proceedings of the 19th Australian Conference on Software Engineering (ASWEC 2008), Perth, Australia, 25–28 March 2008; pp. 639–643. [Google Scholar] [CrossRef]
- Chen, Z.; Li, G.; Pattabiraman, K.; DeBardeleben, N. BinFI: An Efficient Fault Injector for Safety-Critical Machine Learning Systems. In Proceedings of the International Conference for High Performance Computing, Networking, Storage and Analysis, New York, NY, USA, 17–22 November 2019. [Google Scholar] [CrossRef]
- Pardo, J.; Campelo, J.C.; Serrano, J.J. Robustness study of an embedded operating system for industrial applications. In Proceedings of the 28th Annual International Computer Software and Applications Conference, COMPSAC 2004, Hong Kong, 28–30 September 2004; Volume 2, pp. 64–65. [Google Scholar] [CrossRef]
- Gold, R. Work-in-progress: Combining control flow checking for safety and security in embedded software. In Proceedings of the 2017 International Conference on Embedded Software (EMSOFT), Seoul, Republic of Korea, 15–20 October 2017; pp. 1–2. [Google Scholar] [CrossRef]
- Thati, V.B.; Vankeirsbilck, J.; Pissoort, D.; Boydens, J. Hybrid Technique for Soft Error Detection in Dependable Embedded Software: A First Experiment. In Proceedings of the 2019 IEEE XXVIII International Scientific Conference Electronics (ET), Sozopol, Bulgaria, 12–14 September 2019; pp. 1–4. [Google Scholar] [CrossRef]
- Yildiz, T.; Gol, M. A Malfunction Detection Method for PV Systems. In Proceedings of the 2019 IEEE Milan PowerTech, Milan, Italy, 23–27 June 2019; pp. 1–6. [Google Scholar] [CrossRef]
- Tsai, F.K.; Chen, C.C.; Chen, T.F.; Lin, T.J. Sensor Abnormal Detection and Recovery Using Machine Learning for IoT Sensing Systems. In Proceedings of the 2019 IEEE 6th International Conference on Industrial Engineering and Applications (ICIEA), Tokyo, Japan, 12–15 April 2019; pp. 501–505. [Google Scholar] [CrossRef]
- Franco1, I.T.; de Figueiredo, R.M. Predictive Maintenance: An Embedded System Approach. J. Control Autom. Electr. Syst. 2022, 34, 60–72. [Google Scholar] [CrossRef]
- Papaioannou, A.; Dimara, A.; Kouzinopoulos, C.S.; Krinidis, S.; Anagnostopoulos, C.N.; Ioannidis, D.; Tzovaras, D. LP-OPTIMA: A Framework for Prescriptive Maintenance and Optimization of IoT Resources for Low-Power Embedded Systems. Sensors 2024, 24, 2125. [Google Scholar] [CrossRef] [PubMed]
- Kanbara, H.; Kinjo, R.; Toda, Y.; Okuhata, H.; Ise, M. Dependable embedded processor core for higher reliability. In Proceedings of the 2009 IEEE 13th International Symposium on Consumer Electronics, Kyoto, Japan, 25–28 May 2009; pp. 819–822. [Google Scholar] [CrossRef]
- Ahmad, H.A.H.; Sedaghat, Y. Software-based Control-Flow Error Detection with Hardware Performance Counters in ARM Processors. In Proceedings of the 2022 CPSSI 4th International Symposium on Real-Time and Embedded Systems and Technologies (RTEST), Tehran, Iran, 30–31 May 2022; pp. 1–8. [Google Scholar] [CrossRef]
Figure 1.
Recovery and protection after detected malfunction: (1) Target embedded system controlled by the proposed protection systems, (2) power debugger (PD) gathering the power profile indicating the status of systems (3) monitoring embedded system with the expected patterns.
Figure 1.
Recovery and protection after detected malfunction: (1) Target embedded system controlled by the proposed protection systems, (2) power debugger (PD) gathering the power profile indicating the status of systems (3) monitoring embedded system with the expected patterns.
Figure 2.
Block diagram of power monitoring system.
Figure 2.
Block diagram of power monitoring system.
Figure 3.
Extractionand dump of normal operating data: (1) Target embedded system controlled by the proposed protection systems, (2) power debugger (PD) gathering the power profile indicating the status of systems (3) monitoring embedded system with the expected patterns.
Figure 3.
Extractionand dump of normal operating data: (1) Target embedded system controlled by the proposed protection systems, (2) power debugger (PD) gathering the power profile indicating the status of systems (3) monitoring embedded system with the expected patterns.
Figure 4.
Classification of TES and TES′. (a) TES downloaded normal software. (b) TES′ downloaded pseudo software with errors.
Figure 4.
Classification of TES and TES′. (a) TES downloaded normal software. (b) TES′ downloaded pseudo software with errors.
Figure 5.
Comparison of extracted data in normal operation (reference) and malfunction (pseudo): (1) Target embedded system controlled by the proposed protection systems, (2) power debugger (PD) gathering the power profile indicating the status of systems (3) monitoring embedded system with the expected patterns.
Figure 6.
Extraction and dump of normal operating data.
Figure 6.
Extraction and dump of normal operating data.
Figure 7.
Protection method for external disturbance.
Figure 7.
Protection method for external disturbance.
Figure 8.
Expected current change of malfunction state: Malfunction (red colored signal) can be mitigated with the proposed protection recoverty systems (entering blue colored signal).
Figure 8.
Expected current change of malfunction state: Malfunction (red colored signal) can be mitigated with the proposed protection recoverty systems (entering blue colored signal).
Figure 9.
Current monitoring using PID control.
Figure 9.
Current monitoring using PID control.
Figure 10.
PID control for current stabilization.
Figure 10.
PID control for current stabilization.
Figure 11.
Expected voltage change of malfunction state.
Figure 11.
Expected voltage change of malfunction state.
Figure 12.
Setup of proposed system.
Figure 12.
Setup of proposed system.
Figure 13.
Diagram and code of setup environment.
Figure 13.
Diagram and code of setup environment.
Figure 14.
Feature point extraction of current level.
Figure 14.
Feature point extraction of current level.
Figure 15.
Comparison of feature point.
Figure 15.
Comparison of feature point.
Figure 16.
Continuous output of malfunction data.
Figure 16.
Continuous output of malfunction data.
Figure 17.
Comparison of current and voltage according to operating state. (a) Normal operating state. (b) Operating state in which temporary changes in current are not detected an malfunctions. (c) State in which malfunctions are detected and recovered due to a continuous current rise of 10 points or more.
Figure 18.
Message output of malfunction and recovery.
Figure 18.
Message output of malfunction and recovery.
Figure 19.
Malfunction detection and recovery through PID control.
Figure 19.
Malfunction detection and recovery through PID control.
Figure 20.
Message output of malfunction and recovery through PID control.
Figure 20.
Message output of malfunction and recovery through PID control.
Figure 21.
Shutdown of system by voltage drop.
Figure 21.
Shutdown of system by voltage drop.
Figure 22.
Message output by voltage drop.
Figure 22.
Message output by voltage drop.
Table 1.
Summary of related work.
Table 1.
Summary of related work.
| Work | Field | Method | Application |
|---|
| [10,12] | Software | Predict Malfunction
Analysis | Embedded System |
| [13,14] | Software | Program Repair
Correction | Program
Embedded System |
| [15,16] | Software | Error Protection | Embedded System |
| [17,18,19] | Software | Error Checking | Embedded System |
| [20] | Network | Malfunction Monitoring | PV System |
| [6,21] | System | Malfunction Detection
Power Analysis | IoT System
Microcontroller |
| [22,23] | System | Predictive Maintenance | Embedded System |
| [24,25] | Software | Performance Monitoring | Embedded System |
| This work | System | Current/Voltage Monitoring | Embedded System |
Table 2.
Sampled dataset of normal operation.
Table 2.
Sampled dataset of normal operation.
| No. | Sec. | | | |
|---|
| 1 | 0.0 | 4.991 | 0.089 | 0.444 |
| 2 | 0.1 | 4.988 | 0.091 | 0.453 |
| 3 | 0.2 | 4.988 | 0.088 | 0.438 |
| 4 | 0.3 | 4.988 | 0.086 | 0.428 |
| 5 | 0.4 | 4.990 | 0.090 | 0.449 |
| ⋮ | ⋮ | ⋮ | ⋮ | ⋮ |
| 96 | 9.5 | 4.988 | 0.080 | 0.399 |
| 97 | 9.6 | 4.989 | 0.080 | 0.399 |
| 98 | 9.7 | 4.990 | 0.080 | 0.399 |
| 99 | 9.8 | 4.989 | 0.080 | 0.399 |
| 100 | 9.9 | 4.988 | 0.088 | 0.439 |
Table 3.
Output data through PD of TES and TES′.
Table 3.
Output data through PD of TES and TES′.
| TES | | , , |
| , , |
| TES′ | | , , |
| , , , , |
| , , |
| , , |
Table 4.
Error range of .
Table 4.
Error range of .
| Error | Error Range () |
|---|
| Rate () | Value () |
|---|
| 90 mA | 10% | 9 mA | >99 mA |
| 20% | 18 mA | >108 mA |
| 30% | 27 mA | >117 mA |
| ⋮ |
| 50% | 45 mA | >135 mA |
| ⋮ |
| 100% | 90 mA | >180 mA |
Table 5.
Specification of STM32F407G-DISC1.
Table 5.
Specification of STM32F407G-DISC1.
| MCU | STM32F407VGT6 |
| Core | 32-bit ARM Cortex-M4 with FPU |
| Flash | 1 Mbyte |
| RAM | 192 Kbyte |
| Freq. | ∼169 MHz |
Table 6.
Comparison of current data.
Table 6.
Comparison of current data.
| No. | Sec. | | | |
|---|
| 1 | 0.1 | 0.091 | 0.120 | 0.029 |
| 2 | 0.2 | 0.088 | 0.118 | 0.030 |
| 3 | 0.3 | 0.086 | 0.118 | 0.032 |
| 4 | 0.4 | 0.090 | 0.117 | 0.027 |
| 5 | 0.5 | 0.090 | 0.125 | 0.035 |
| 6 | 0.6 | 0.089 | 0.130 | 0.041 |
| 7 | 0.7 | 0.088 | 0.130 | 0.042 |
| 8 | 0.8 | 0.087 | 0.129 | 0.042 |
| ⋮ | ⋮ | ⋮ | ⋮ | ⋮ |
| Disclaimer/Publisher’s Note: The statements, opinions and data contained in all publications are solely those of the individual author(s) and contributor(s) and not of MDPI and/or the editor(s). MDPI and/or the editor(s) disclaim responsibility for any injury to people or property resulting from any ideas, methods, instructions or products referred to in the content. |
© 2024 by the authors. Licensee MDPI, Basel, Switzerland. This article is an open access article distributed under the terms and conditions of the Creative Commons Attribution (CC BY) license (https://creativecommons.org/licenses/by/4.0/).


