1. Introduction
The fifth generation (5G) of mobile networks ushers in a revolutionary era in telecommunications, promising unprecedented enhancements in network capacity, data rates, and quality of service. This leap forward is powered by cutting-edge technologies such as millimeter-wave (mmWave) frequencies, massive multiple-input multiple-output (mMIMO) antennas, and network slicing, which collectively aim to support a diverse range of applications from enhanced mobile broadband (eMBB) to ultra-reliable low-latency communications (URLLCs) and massive machine-type communications (mMTCs). Despite the significant advancements, the deployment of 5G, especially through Non-Standalone (NSA) architecture leveraging existing 4G infrastructure, presents unique operational challenges and uncertainties in performance that are crucial to investigate.
The recent literature underscores the importance of empirical research in uncovering the real-world implications of 5G deployment.
The authors of [
1] present a comprehensive study on 5G Non-Standalone (NSA) deployments in Rome, Italy, focusing on network deployment and performance for eMBB and URLLC use cases. Their results demonstrate that 5G NSA provides better downlink throughput and slightly lower latency than 4G, yet its performance is contingent upon several factors, emphasizing the need for further optimization. In [
2], the transition from 5G Non-Standalone (NSA) to Standalone (SA) networks is evaluated, using field trials to compare their performances. The findings show that SA networks have a slightly higher uplink rate than NSA networks, with comparable latency for both, underlining the importance of assessing these networks to meet 5G use case requirements. The authors of [
3] examine the progression of 5G deployment from NSA to Standalone (SA) architectures, aiming to fulfill the diverse requirements of 5G applications. They highlight the ITU’s eight key performance indicators for 5G, focusing on high speed, low latency, and large connectivity as critical features influenced by the network architecture. Through network trials on SA architecture, the article assesses latency for control and user planes, and coverage through multi-cell and single-cell testing.
The work in [
4] explores the impact of power allocation on network performance in a 5G Non-Standalone (NSA) sharing environment between two operators, focusing on coverage, capacity, and service availability. It examines how different power configurations affect uplink and downlink performance, including experiments on Reference Signal Received Power (RSRP) and throughput. In [
5], effective mobility management in 4G/5G networks is explored, focusing on ensuring uninterrupted service for users through strategies like cell reselection, handover, and redirection. It highlights interoperability between 4G and 5G systems and presents experiments aimed at optimizing mobility functions.
In [
6], a large-scale field trial was carried out focusing on the potential of mMIMO technology to enhance spectrum efficiency in 5G networks. The trial evaluated the effectiveness of various precoding schemes—linear, non-linear, and hybrid—in Multi-User MIMO setups, particularly under conditions of high user equipment correlation, which is a likely scenario in massive connectivity goals. The work in [
7] addresses the challenge of achieving sub-1ms latency in 5G networks, crucial for emerging services, through the introduction of new technologies. A field trial demonstrated that 5G can meet eMBB latency requirements with specific configurations and offered suggestions for improving latency in URLLC. In [
8], the authors present a field trial for Reconfigurable Intelligent Surface (RIS)-aided 5G networks, focusing on statistics-based optimization of RIS phases in three scenarios including outdoor-to-indoor transmission, indoor coverage extension, and outdoor interference suppression. Significant enhancements in signal quality and throughput were observed, supporting the potential for RIS integration in commercial 5G networks and the effectiveness of statistics-based optimization in complex environments.
Building on this foundation, our study conducts a comparative performance analysis of 5G and 4G networks across highway operational scenarios in Greece. Unlike previous research predominantly focused on urban or controlled environments, this investigation extends into the less explored domain of high-speed highway travel conditions. Employing advanced measurement techniques through portable smartphone devices, this research evaluates critical key performance parameters such as RSRP, SINR, and RSRQ, alongside latency and data throughput. Our findings not only contribute to the existing body of knowledge by revealing distinct performance patterns and challenges inherent to 5G and 4G networks in these scenarios but also suggest ways for optimization and strategic enhancement by network operators.
This study aims to bridge the gap between the anticipated benefits of 5G technologies and their actual performance in operational environments, providing valuable insights. In doing so, it underscores the importance of empirical data in guiding the evolution of mobile networks and ensuring the successful transition from 4G to 5G infrastructure, particularly in the context of NSA deployments and the unique demands of high-speed mobility environments.
The main contributions of this paper are as follows:
This study provides extensive real-world field trials to evaluate radio network performance metrics under highway operational conditions, which is less studied compared with urban-city scenarios.
This study performs detailed comparative analysis of service delivery among the three cellular operators in Greece, highlighting differences in their service quality and performance.
This study emphasizes key metrics like system availability, signal strength and quality, interference, latency, and throughput, offering insights into radio network performance under high-speed travel conditions.
This study reveals distinct patterns in these key performance indicators that underline the unique challenges and opportunities in high-speed travel scenarios.
2. Methodology
The methodology employed in this study revolves around real-world field trials, conducted using portable smartphone devices equipped with advanced measurement software. These trials were designed to capture a wide array of performance metrics across various operational scenarios, from urban to suburban and rural areas, particularly focusing on highway routes, providing a detailed comparison of network service delivery from all three cellular network operators in Greece.
2.1. Measurement Devices and Data Analysis Software
For the field trials, we utilized portable smartphone devices capable of operating across 2G, 3G, 4G, and 5G networks. The devices were equipped with Echo One from Enhancell, a handheld cellular protocol measurement tool that facilitates customizable end-to-end testing [
9]. Three Xiaomi 12 Pro 5G smartphones, rooted to use Enhancell’s Echo One software, performed measurements that were stored locally to each device and were then uploaded to Echo Cloud [
9], a web service that provides storage and automatic synchronization of device settings and log files. Each Xiaomi smartphone used a sim connected to a different network operator so that all three cellular operators (available in Greece) and their wireless networks (from 2G to 5G) could be measured. The test mobiles can measure all signals exchanged with base stations, but the focus in our analysis was on system availability, Reference Signal Received Power (RSRP), Signal Reference Signal Received Quality (RSRQ), the Signal-to-Interference plus Noise Ratio (SINR), latency, and uplink and downlink throughputs. Echo Studio [
9] was also employed for the measured data analysis. It is a measurement and analysis tool that combines measurement data from all Echo devices for detailed analysis and presentation. Furthermore, inhouse, purpose-built software was used to process and visualize the measured data.
2.2. Measurement Metrics
The task of evaluating 5G network performance presents cellular network operators with numerous challenges, notably because of the coexistence of multiple technologies within Non-Standalone (NSA) 5G configurations. This complexity often complicates the identification of specific technologies responsible for network performance issues. A comprehensive assessment of wireless network performance typically involves several key metrics. Among these, RSRP is pivotal. RSRP is defined [
10] as the linear average of power contributions (measured in Watts) from resource elements carrying cell-specific reference signals across the designated measurement bandwidth:
where
NRE is the number of resource elements that carry cell-specific reference signals within the measurement bandwidth, and
Si is the received signal on the
i-th resource element.
RSRP serves as a critical indicator of the power level a device receives from a specific cell, applicable to both 4G and 5G networks. Unlike 4G, which relies on the Cell-Specific Reference Signal (CRS), 5G networks employ Synchronization Signals (SSs) and Channel State Information (CSI) for similar purposes. RSRP is instrumental in facilitating cell selection, power management, mobility strategies, and beam management efforts. The RSRP reporting scale ranges from −140 dBm to −44 dBm, with a resolution of 1 dB, where values exceeding −80 dBm are deemed excellent, and those below −100 dBm are considered indicative of weak signal strength (or cell edge proximity).
The Secondary Synchronization Signal Reference Signal Received Quality (SS-RSRQ) is another critical metric. It is determined [
10] as the ratio of
NRB times the SS-RSRP to the NR carrier’s RSSI, where
NRB is the number of resource blocks in the NR carrier RSSI measurement bandwidth:
The NR carrier’s RSSI is the linear average of the total received power (Watts), perceived in specific OFDM symbols of the measurement time resource(s) across N resource blocks from serving and non-serving cells on the same channel, interference from adjacent channels, thermal noise, and others. Values above −10 dB are considered excellent, while values below −20 dB are poor (cell edge).
Another essential metric for assessing wireless network performance is the SINR. It evaluates the quality of the signal received by user equipment (UE), calculated as the ratio of desired signal power to the aggregate of interference and noise power within the same frequency spectrum. Specifically, the Secondary Synchronization Signal (SS-SINR) enables the UE to gauge and report the quality of signals from different beams, identified by their SSB beam indices, emanated by the gNodeB. The SINR is used to determine the modulation scheme and coding rate for data transmission, and it is derived from RSRP and RSRQ measurements [
10]:
where
Itot is the total received interference power and
No is the noise power spectral density. Values above 20 dB are considered excellent, while values below 0 dB are poor (cell edge).
The Physical Downlink Shared Channel (PDSCH) and Physical Uplink Shared Channel (PUSCH) are integral components of the network’s downlink and uplink data and control information transmission, respectively [
10]. Both channels employ Quadrature Amplitude Modulation (QAM), with modulation schemes ranging from QPSK to 256-QAM, dictated by the prevailing channel conditions. PDSCH and PUSCH transmissions are further optimized through Low-Density Parity-Check (LDPC) coding, precoding, and beamforming techniques to enhance downlink and uplink communication efficacy, respectively. Dynamic allocation of modulation and coding schemes (MCSs), time–frequency resource distribution, and the application of multiple-input multiple-output (MIMO) and beamforming technologies are governed by the base station (gNodeB), based on real-time channel conditions and network demand. A common method for estimating PDSCH and PUSCH throughput incorporates the following formula:
where
NRB is the number of resource blocks allocated to the channel,
NRE is the number of resource elements per resource block,
NSYM is the number of symbols per slot,
R is the coding rate, and
η is the modulation order.
Furthermore, the Synchronization Signal Block (SSB) beam index identifies specific beams broadcasted by the base station (gNodeB), playing a pivotal role in signal directionality to enhance performance, coverage, and capacity within 5G networks. The SSB beam index, representing a unique combination of Synchronization Signal (SS) and Physical Broadcast Channel (PBCH) patterns, enables efficient user equipment (UE) signal quality measurement and reporting, facilitating optimal beam selection and seamless handovers between beams.
Amidst the evolution from 4G to 5G networks, latency metrics also represent a paramount aspect in evaluating network performance and the resultant user experience. This facet is indispensable in scenarios necessitating real-time interaction, encompassing, but not limited to, live video streaming, online gaming, and autonomous vehicle navigation. The progression from 4G to 5G networks is heralded for its potential to markedly ameliorate latency, propelling towards the ambition of achieving quasi-instantaneous communication paradigms. Empirical analyses delineate a significant diminution in latency with the advent of 5G, transitioning from an average latency of 50–100 milliseconds (ms) characteristic of 4G networks, to an envisaged 1–10 ms in 5G environments. Incorporating latency metrics into the comprehensive evaluation of network performance facilitates an augmented understanding of the network’s operational responsiveness and dependability.
2.3. Measurement Process
The measurement route started from the central Peloponnese (Tripolis), continued north to Corinth, and then west to Patra. The designated ~180 km measurement route encapsulates a blend of operational environments, encompassing mostly highways, tunnels, and rural and suburban areas. Measurements were based on GPS locations, enabling precise mapping of network performance across different geographical areas. The measurement parameters could be customized and configured through the cloud. During the measurements, three mobile phone holders were used to secure the test smartphones on a car’s dashboard, enabling the simultaneous recording of data from the three network operators. This setup allowed for a direct comparison of network performances under identical conditions, minimizing variables and ensuring the reliability of the data collected.
To further refine the robustness and representativeness of the analysis, the same ~2-h route was traversed on two consecutive days, during identical hours. This deliberate repetition served multiple purposes as follows: it aimed to bolster the representativeness of the analysis by accounting for potential day-to-day variations in network performance, check possible repeatability and consistency in the data collected, and provide a more comprehensive understanding of the networks’ reliability and performance under a variety of conditions.
The data gathered from these field trials were then analyzed to produce color-coded diagrams and statistical analyses, illustrating the coverage and performance behavior of 5G and 4G networks and among different operators. The behavior of the three networks was further investigated by considering the distributions of the RSRP, RSRQ and SINR, using a generic approach via Kernel Density Estimation (KDE), which is a versatile non-parametric approach for estimating the probability density function (PDF) of a dataset [
11]. KDE operates by overlaying a kernel function atop each data point and aggregating their contributions to approximate the density at any given location. Several kernels (Gaussian, triangular, biweight, etc.) were tested before finally choosing to employ the Epanechnikov kernel [
11]:
This kernel has a parabolic shape and is zero for values of
u outside the interval [−1, 1], which means that only points within one bandwidth of the target point contribute to the density estimate. The use of the Epanechnikov kernel results in a smoother estimate compared with other kernels like the Gaussian, especially when dealing with unknown samples and sample sizes. The Kernel Density Estimator with the Epanechnikov kernel for a univariate dataset
x is given by:
where
K(
u) is the Epanechnikov kernel and
h is the bandwidth. The estimator represents the estimated probability density function at point
x.
3. Measurements and Analysis
3.1. Route Colormaps
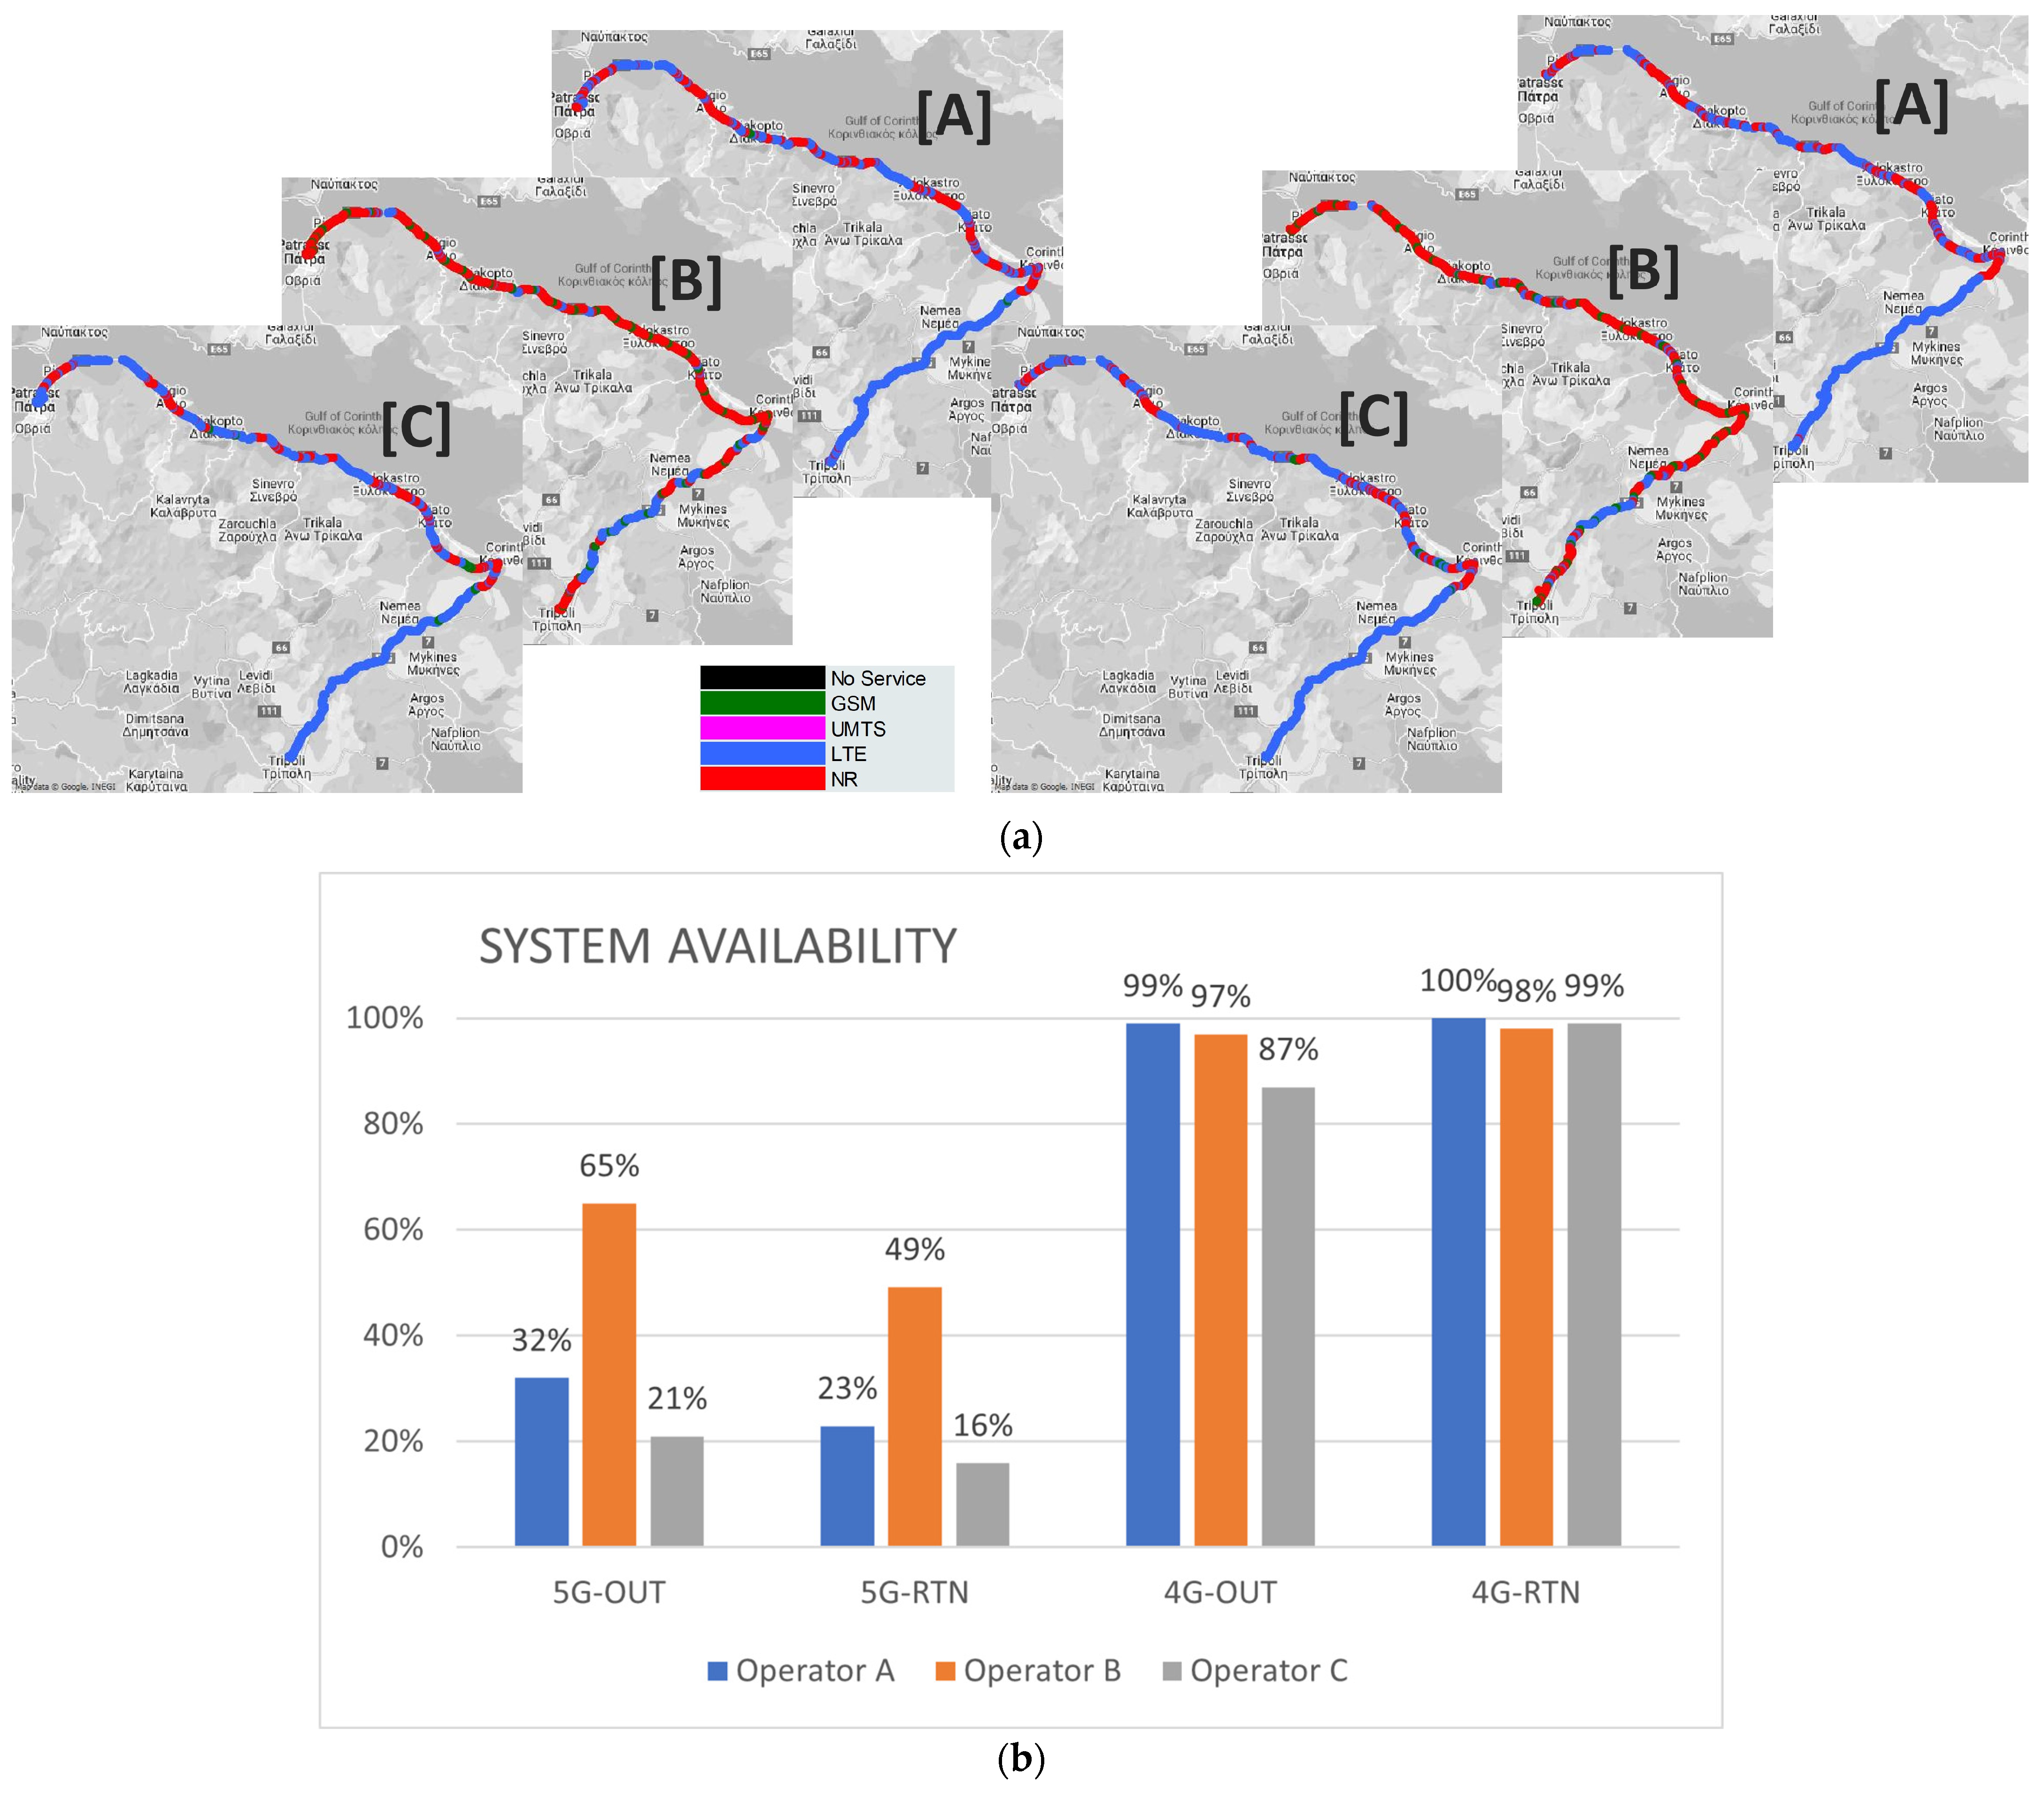
Figure 1a shows the actual measurement route on a map, colored according to the system availability (red: 5G, blue: 4G, green: 2G), for each of the three Greek operators, A, B and C, for the trip Tripolis–Patra (left) and the return trip Patra–Tripolis (right). Note that the maps for the three operators are overlapping.
Figure 1b shows the bar chart for the 5G/4G system availability for the three operators for the route Tripolis–Patra (OUT) and Patra–Tripolis (RTN).
Several observations can be made from these measurements as follows:
Operator A experiences a decrease in 5G availability when comparing the outbound journey (32%) with the return (23%). This may indicate region-specific challenges impacting the signal on the return route or perhaps a fluctuation in network usage patterns during the day.
Operator B demonstrates the highest 5G coverage among the three. Still, it shows a drop on the return journey (from 65% to 49%) but despite this reduction, its 5G availability remains comparatively robust, suggesting a more extensive 5G network infrastructure.
Operator C exhibits the lowest coverage for both journeys. It follows the same trend as the other two operators and maintains a slightly better performance outbound (21%) than return (16%). The availability pattern may highlight challenges in network consistency or indicate a strategic deployment that does not yet fully cover the measured route.
- 2.
System Availability Analysis of 4G
For Operator A, there is a negligible difference in 4G availability on the return trip (100%) compared to the outbound (99%). Such a figure suggests a well-established 4G network that maintains strong connectivity throughout the route.
Operator B shows a similar trend with a negligible decrease in availability on the return journey (97% to 98%). It also presents high 4G connectivity, aligning closely with Operator A.
Operator C shows a significant variance, with 87% availability outbound improving to 99% on the return trip. The low outbound availability is a point of concern, potentially indicating issues with network stability or capacity that warrant further investigation.
Comparing 5G and 4G availabilities across the operators highlights varying degrees of network development and possibly differing strategic focuses in network expansion and improvement. Operator A shows strong and consistent 4G availability, with more to desire from 5G, which also decreases on the return trip. Operator B shows the most robust 5G performance but experiences a decline on the return journey while maintaining strong 4G coverage with slight variances. For Operator C, 4G availability is variable but improves on the return trip, while 5G is the lowest of the three, and drops further on the return trip, indicating areas for potential enhancement.
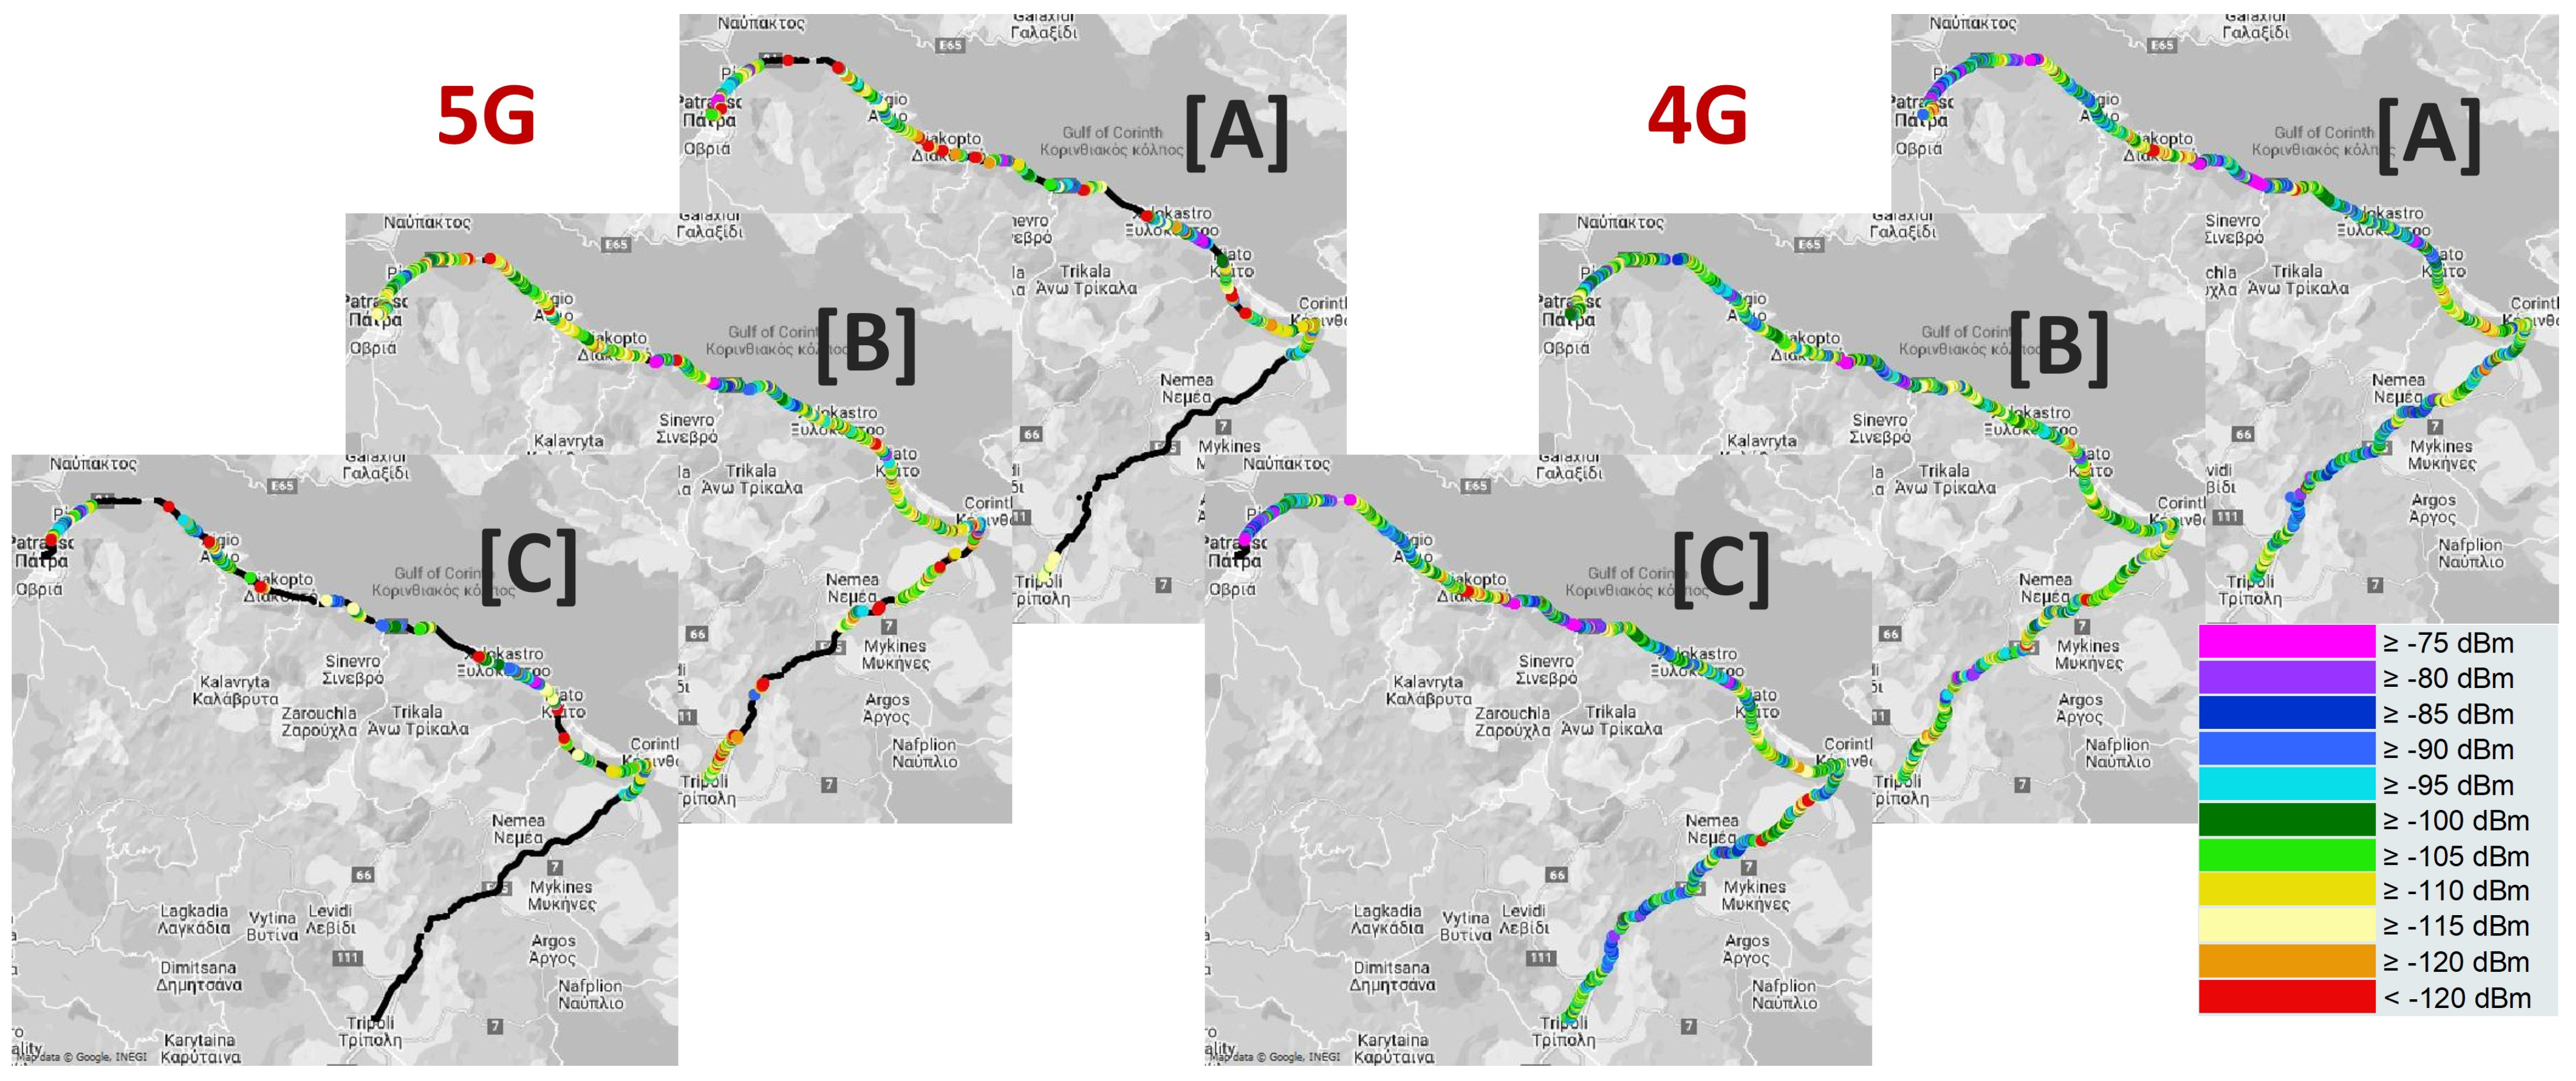
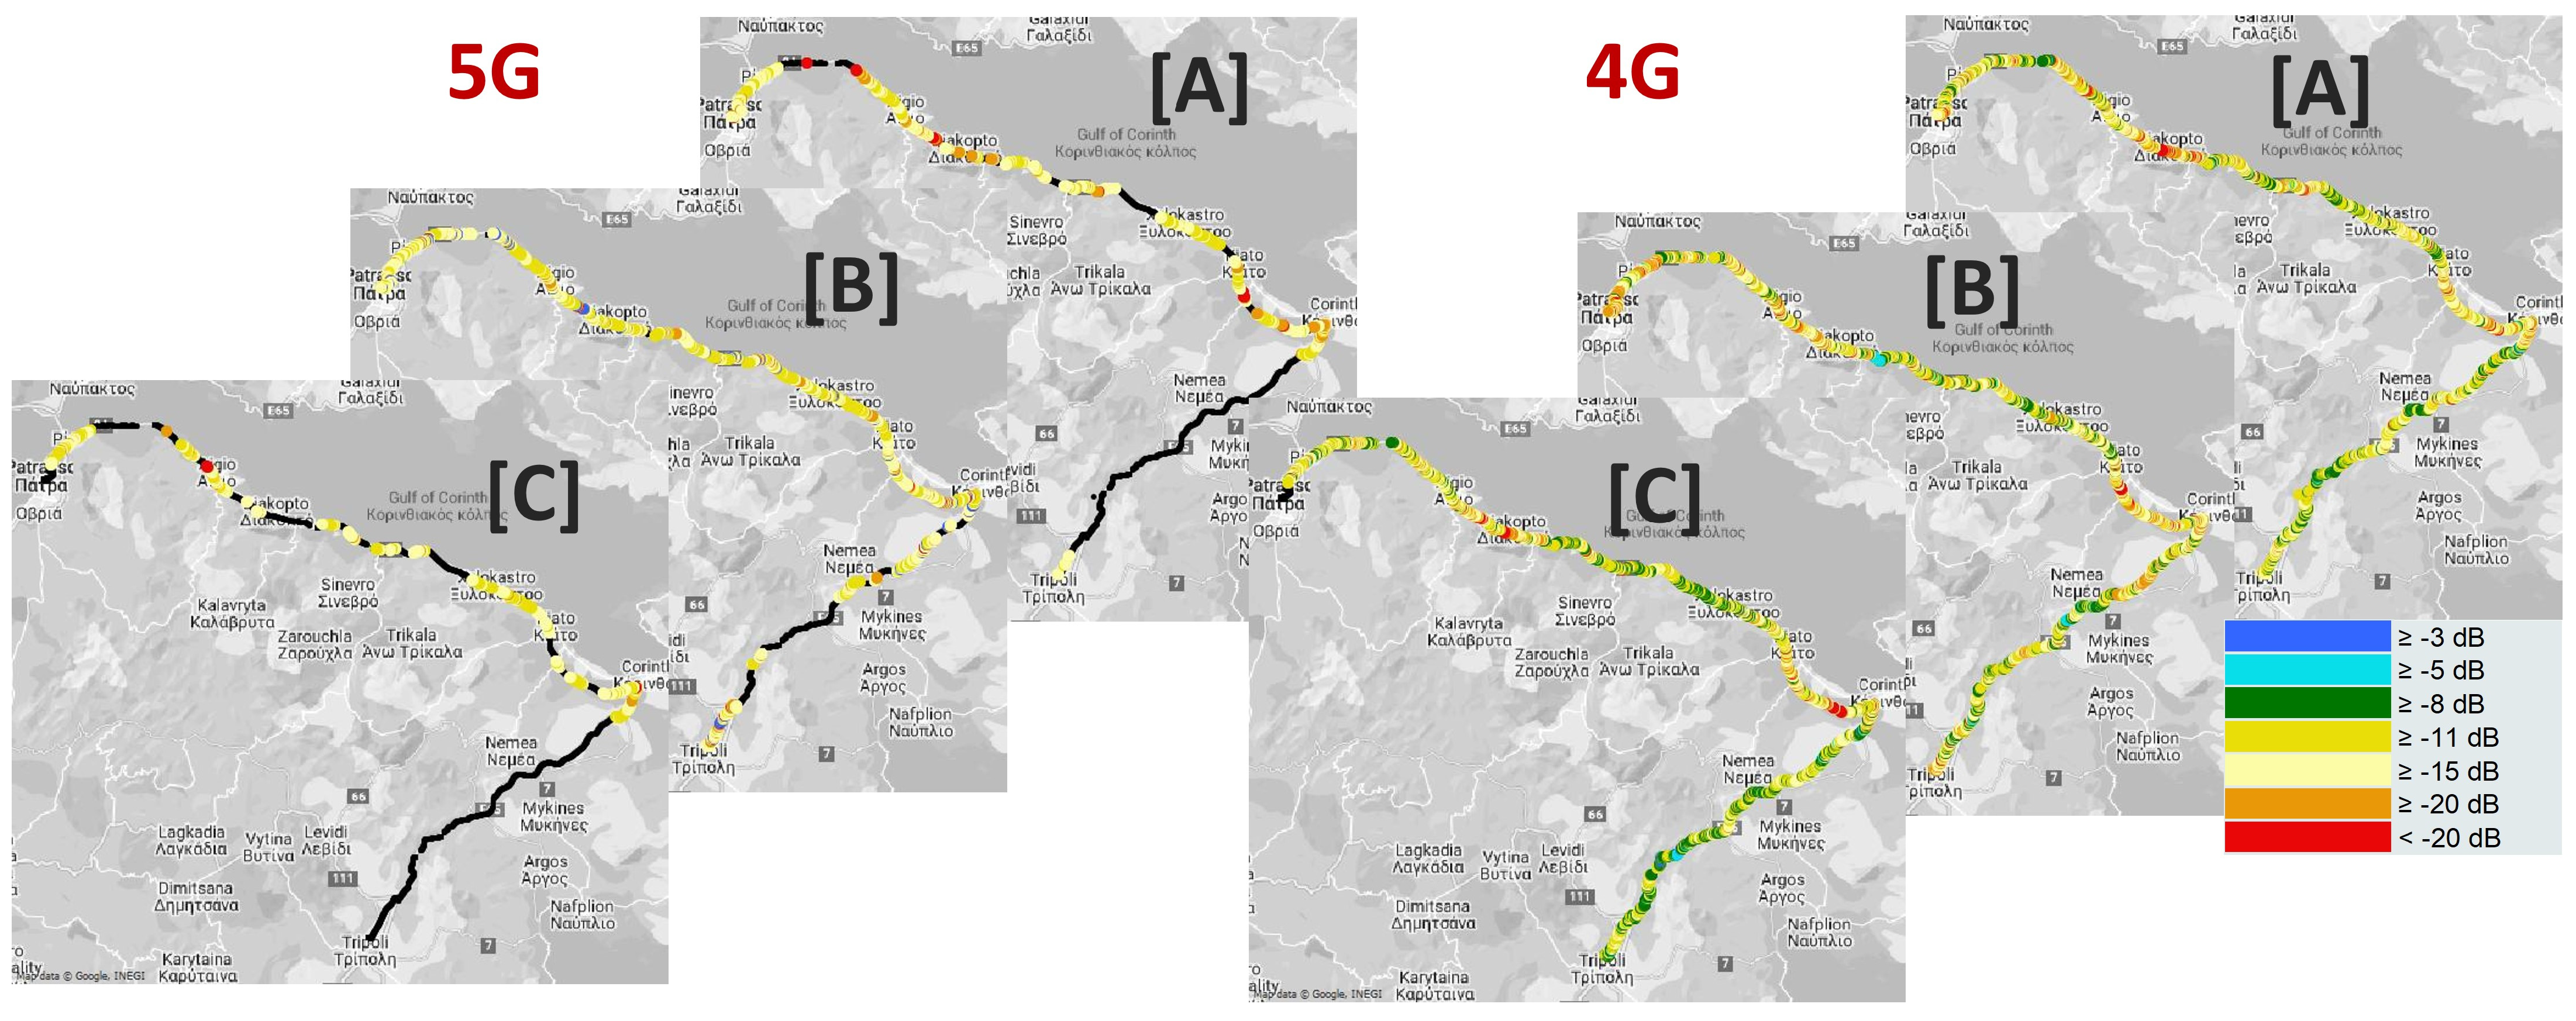
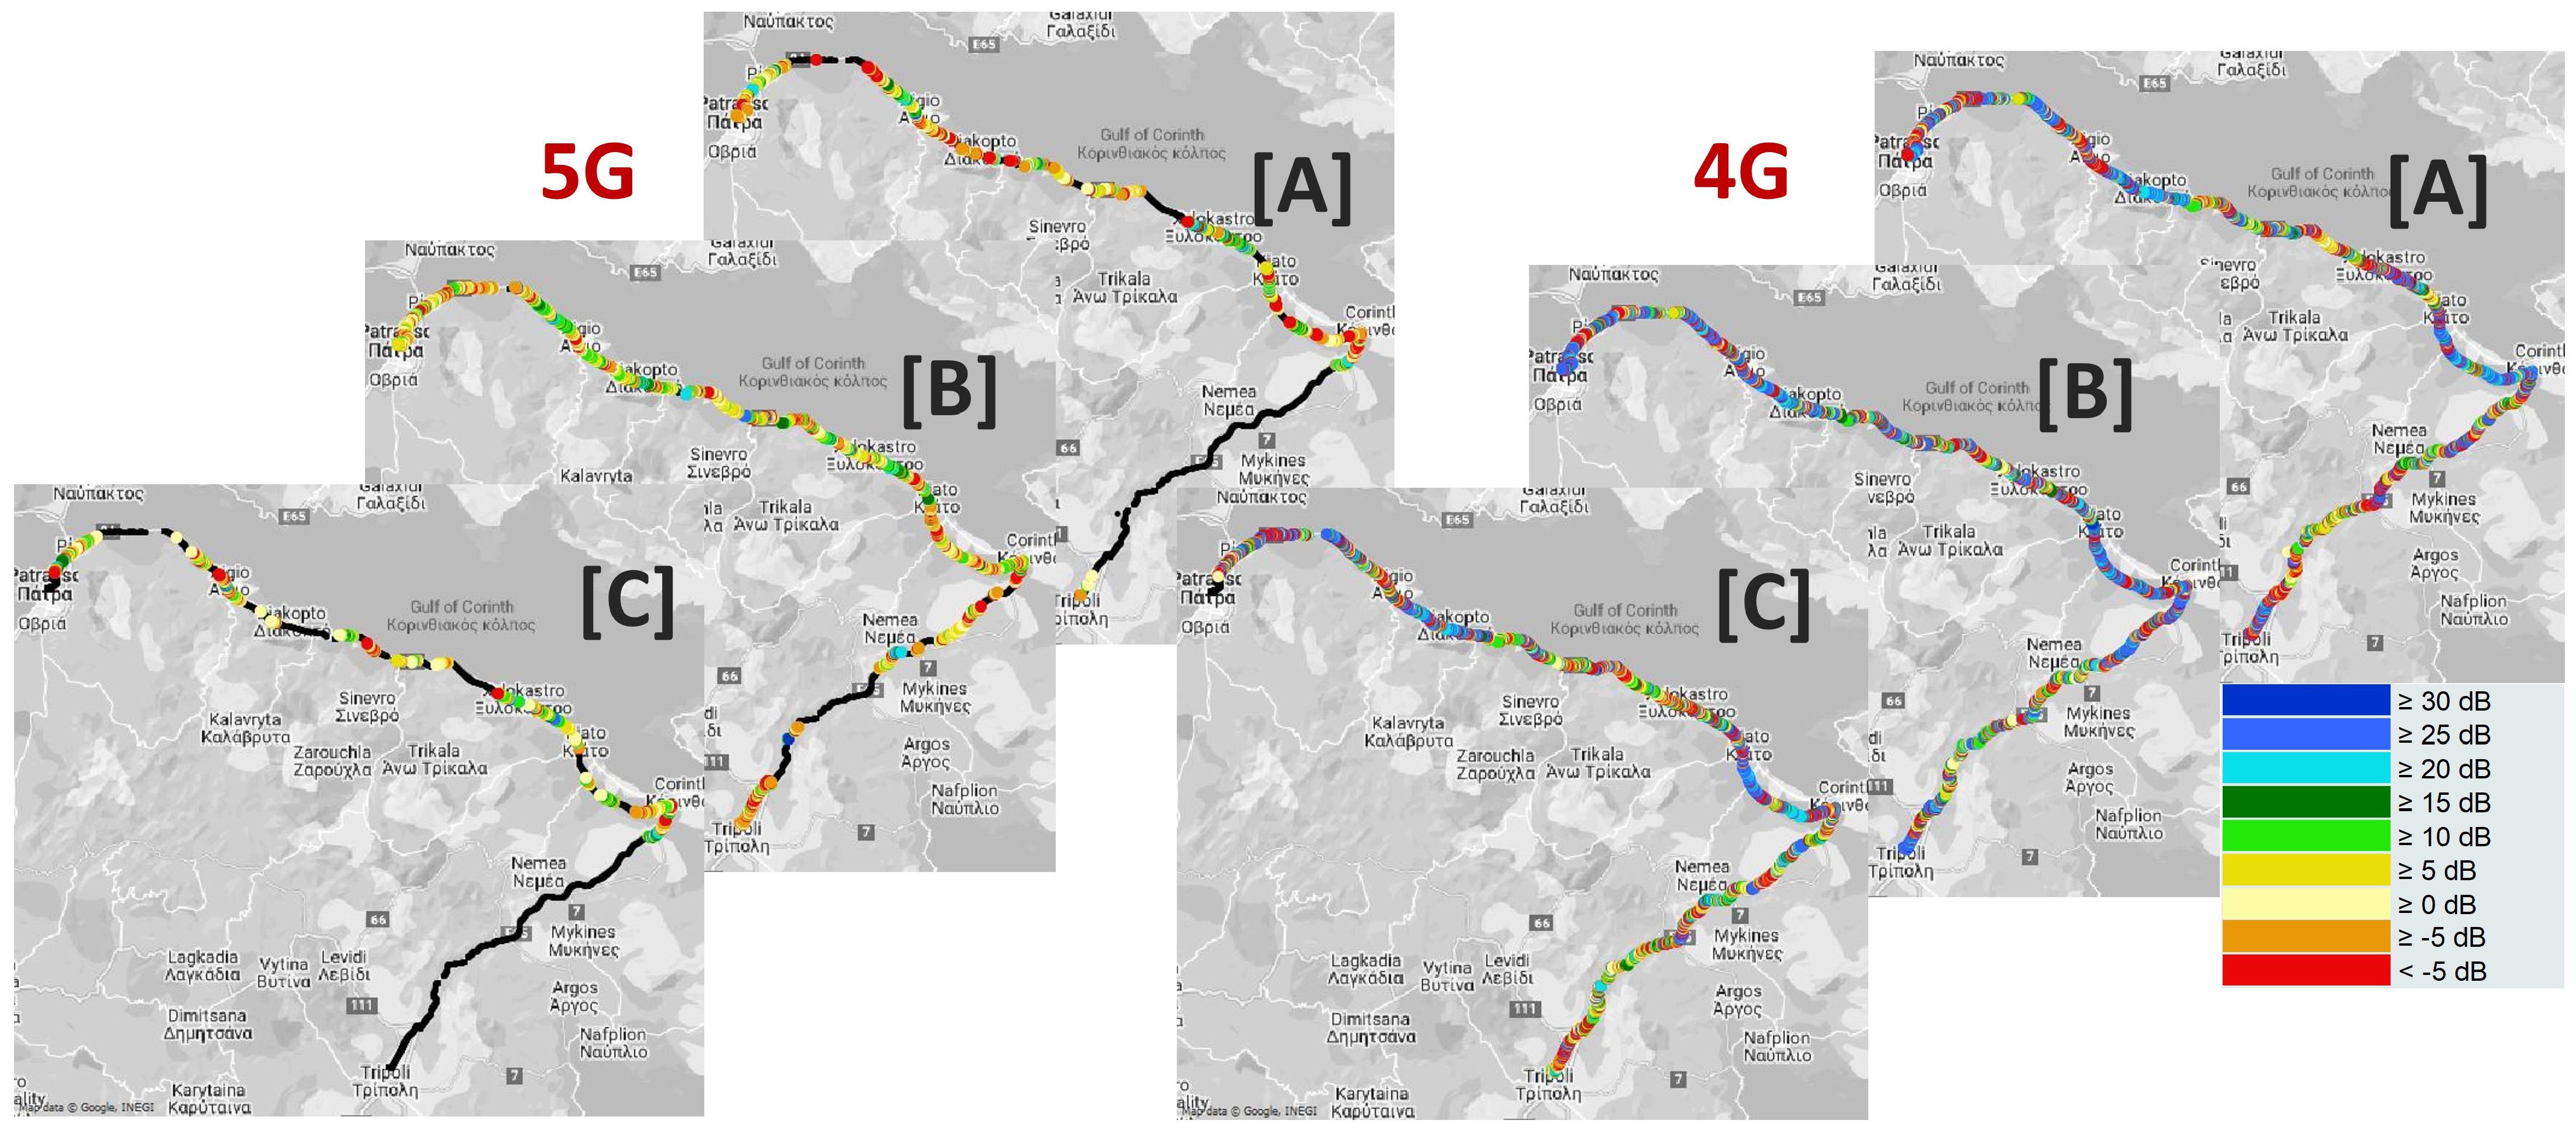
Figure 2,
Figure 3,
Figure 4 and
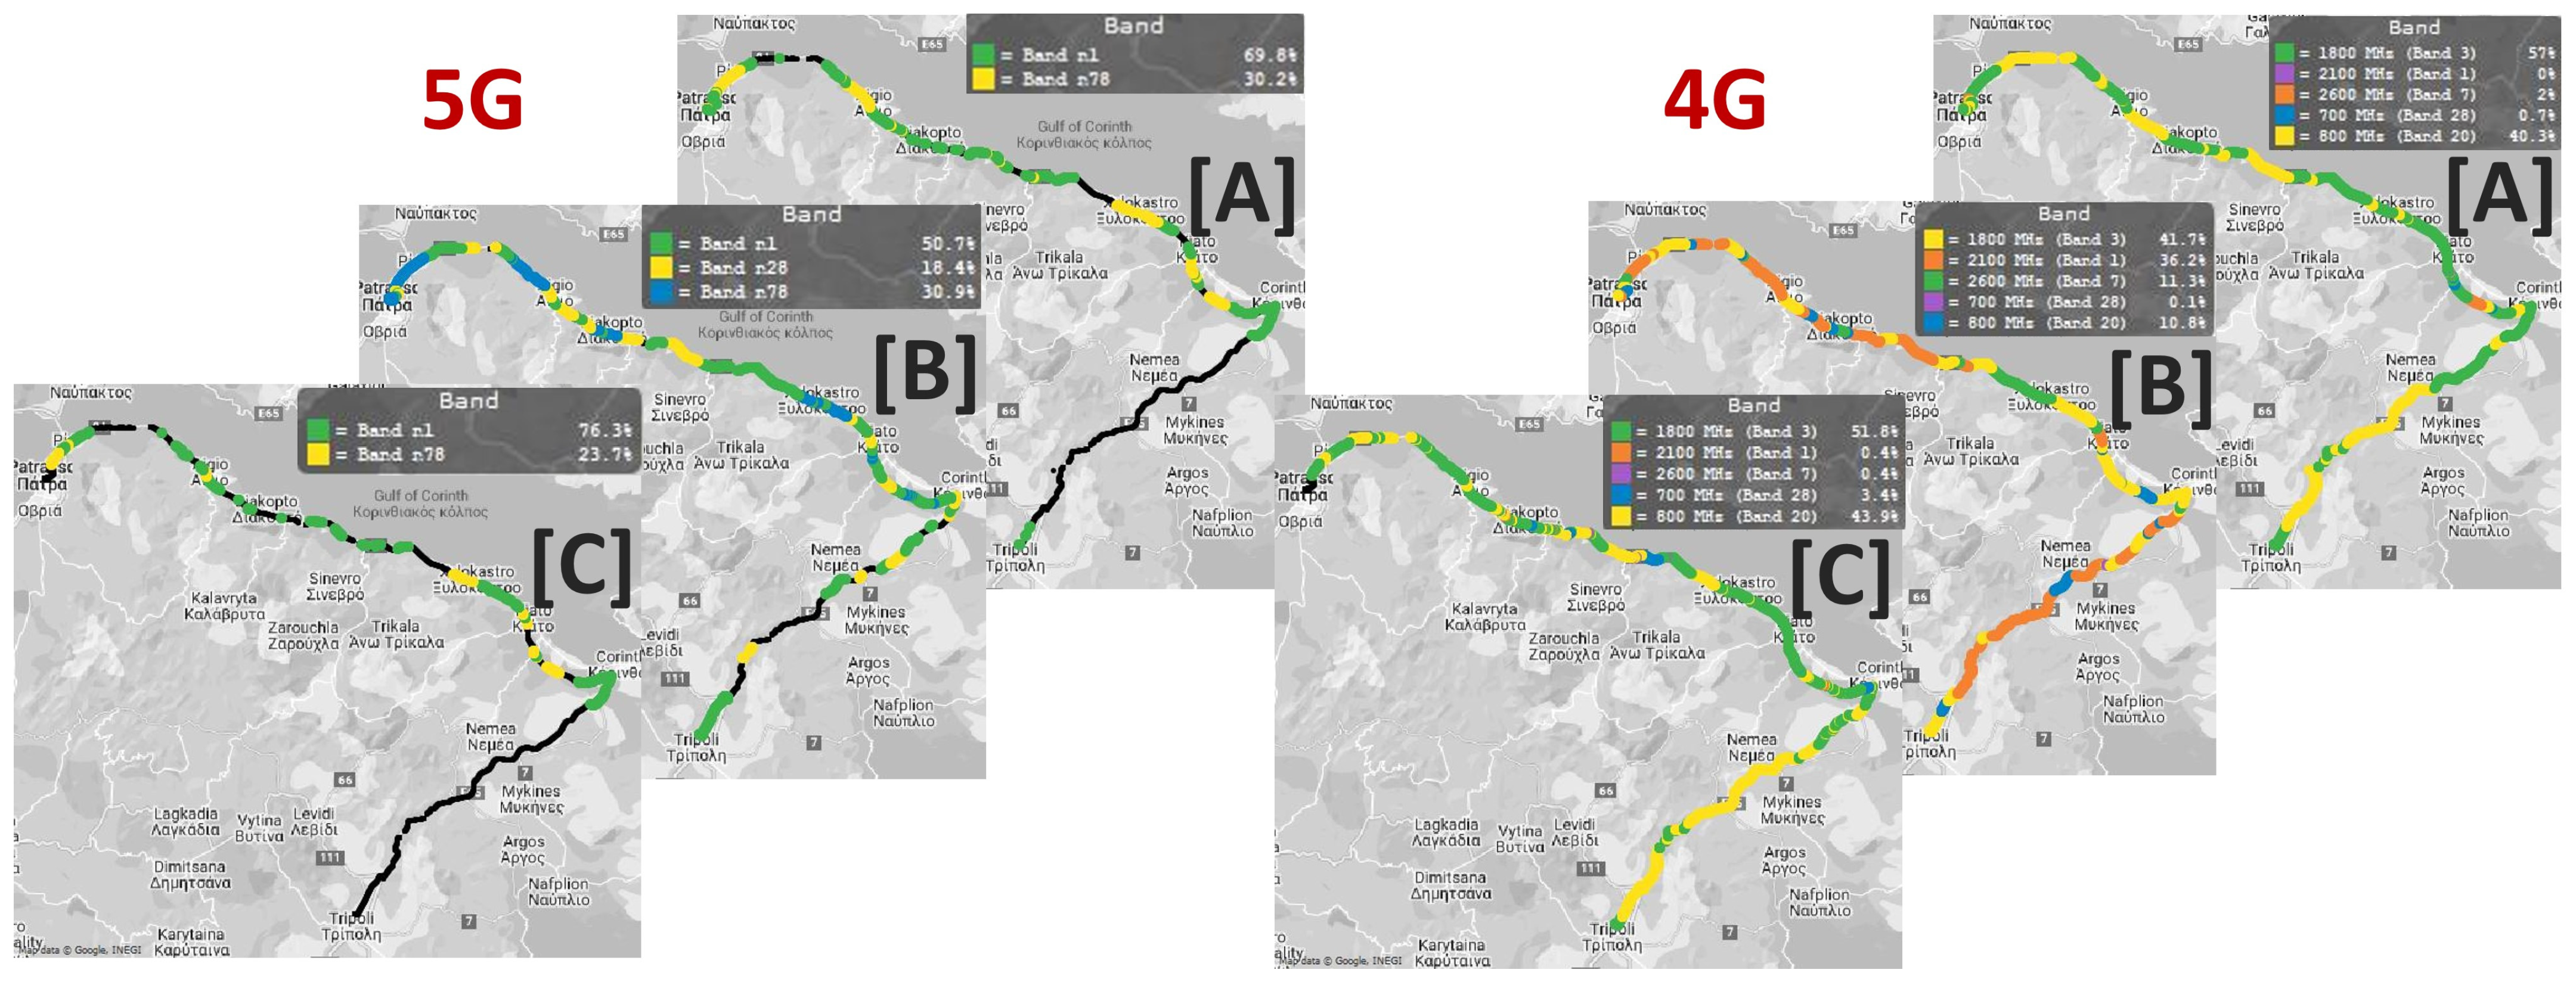
Figure 5 show the colormaps for RSRP, RSRQ, SINR, and frequency bands, for the three operators and the two systems, respectively. Although these figures are good for visualization purposes, a more detailed analysis of RSRP, RSRQ, and SINR is presented in the following section. For the frequency bands, it has to be mentioned that for 5G, bands n28 (700 MHz), n1 (2100 MHz), and n78 (3500 MHz) were used throughout the whole route. For 4G, band 28 (800 MHz), band 20 (MHz), band 3 (1800 MHz), band 1 (2100 MHz), and band 7 (2600 MHz) were used. Each of the three operators utilizes the n78 band for 20% to 40% of their deployments. It has been observed that within these n78 frequency bands, 5G performance is inferior to that of 4G. This performance discrepancy is expected since the 5G Non-Standalone (NSA) architecture utilizes the existing 4G site infrastructure, which is optimized for higher frequency bands. As a result, the performance of the network is significantly dictated by the allocation of specific frequency bands.
3.2. RSRP, RSRQ, and SINR Statistics
Table 1 and
Table 2 show the average and standard deviation statistics for RSRP/RSRQ/SINR, for 5G/4G and each operator, for the two measurement routes, i.e., Tripolis–Patra (outward) and Patra–Tripolis (return).
First, some observations from the outward trip are made as follows:
Operator A has an average RSRP of −82.38 dBm, which is closer to the ideal range than Operator B’s −89.39 dBm, suggesting better overall signal strength. Operator C sits in the middle with −84.82 dBm. The standard deviation for Operator B is the lowest, indicating more consistent signal strength compared with Operators A and C.
Operator C leads with an average SINR of 15.12 dB, followed closely by Operator A at 14.53 dB and Operator B at 13.31 dB. However, it has to be borne in mind that Operator C has the lowest 5G system availability, as shown in
Figure 1b. The standard deviation for Operator B is again the lowest, indicating more consistent signal quality compared with Operators A and C.
Operator B has the best average RSRQ at −9.61 dB, which may indicate more efficient signal usage, but with a slightly higher standard deviation, which might indicate a more variable signal quality. Operator C follows with −11.53 dB, and Operator A has the lowest average at −12.01 dB.
Operator B shows the lowest average RSRP at −84.81 dBm, suggesting weaker signal strength compared with Operators A and C, who have similar averages (−76.03 dBm and −76.47 dBm, respectively). However, the standard deviation for Operator B is lower, indicating that the 4G signal strength, while lower, is more consistent.
SINR values are higher across all operators for 4G compared with 5G, which is typical because of the more mature infrastructure of 4G. Operator B has the highest average SINR at 24.62 dB, with Operator A and C slightly lower at 23.45 dB and 22.07 dB, respectively. Nevertheless, the standard deviation is high across all operators, especially Operator A, suggesting that while 4G signal quality is generally good, it can be quite variable.
In terms of RSRQ for 4G, Operator C has the best average at −9.06 dB, and Operator B has the worst at −10.75 dB. The standard deviations are relatively tight for all operators, indicating consistent signal quality across the board.
Operator A shows good and consistent performance across both 4G and 5G networks.
Operator B has the most room for improvement in both 5G and 4G RSRP but shows the most consistent signal strength across both 4G and 5G. They lead in 4G SINR, suggesting strong signal quality where the 4G network is available.
Operator C presents a balance between Operators A and B, with relatively good signal quality in 5G (leading in SINR, although with low system availability) and the best 4G RSRQ, indicating efficient signal usage.
If we also consider the return route measurement statistics, as shown in
Table 2, then Operator A shows a decrease in RSRP values for 5G and an increase for 4G on the return trip, which could indicate a directional bias in network coverage. Operator B shows improved 5G and 4G on the return trip. Operator C exhibits consistent 5G and 4G behavior in signal strength and quality between the outward and return journeys (less than 2dB difference). The standard deviation values across all metrics for all operators suggest that there is some variability in network performance, which is to be expected in a real-world scenario with fluctuating traffic loads and environmental factors.
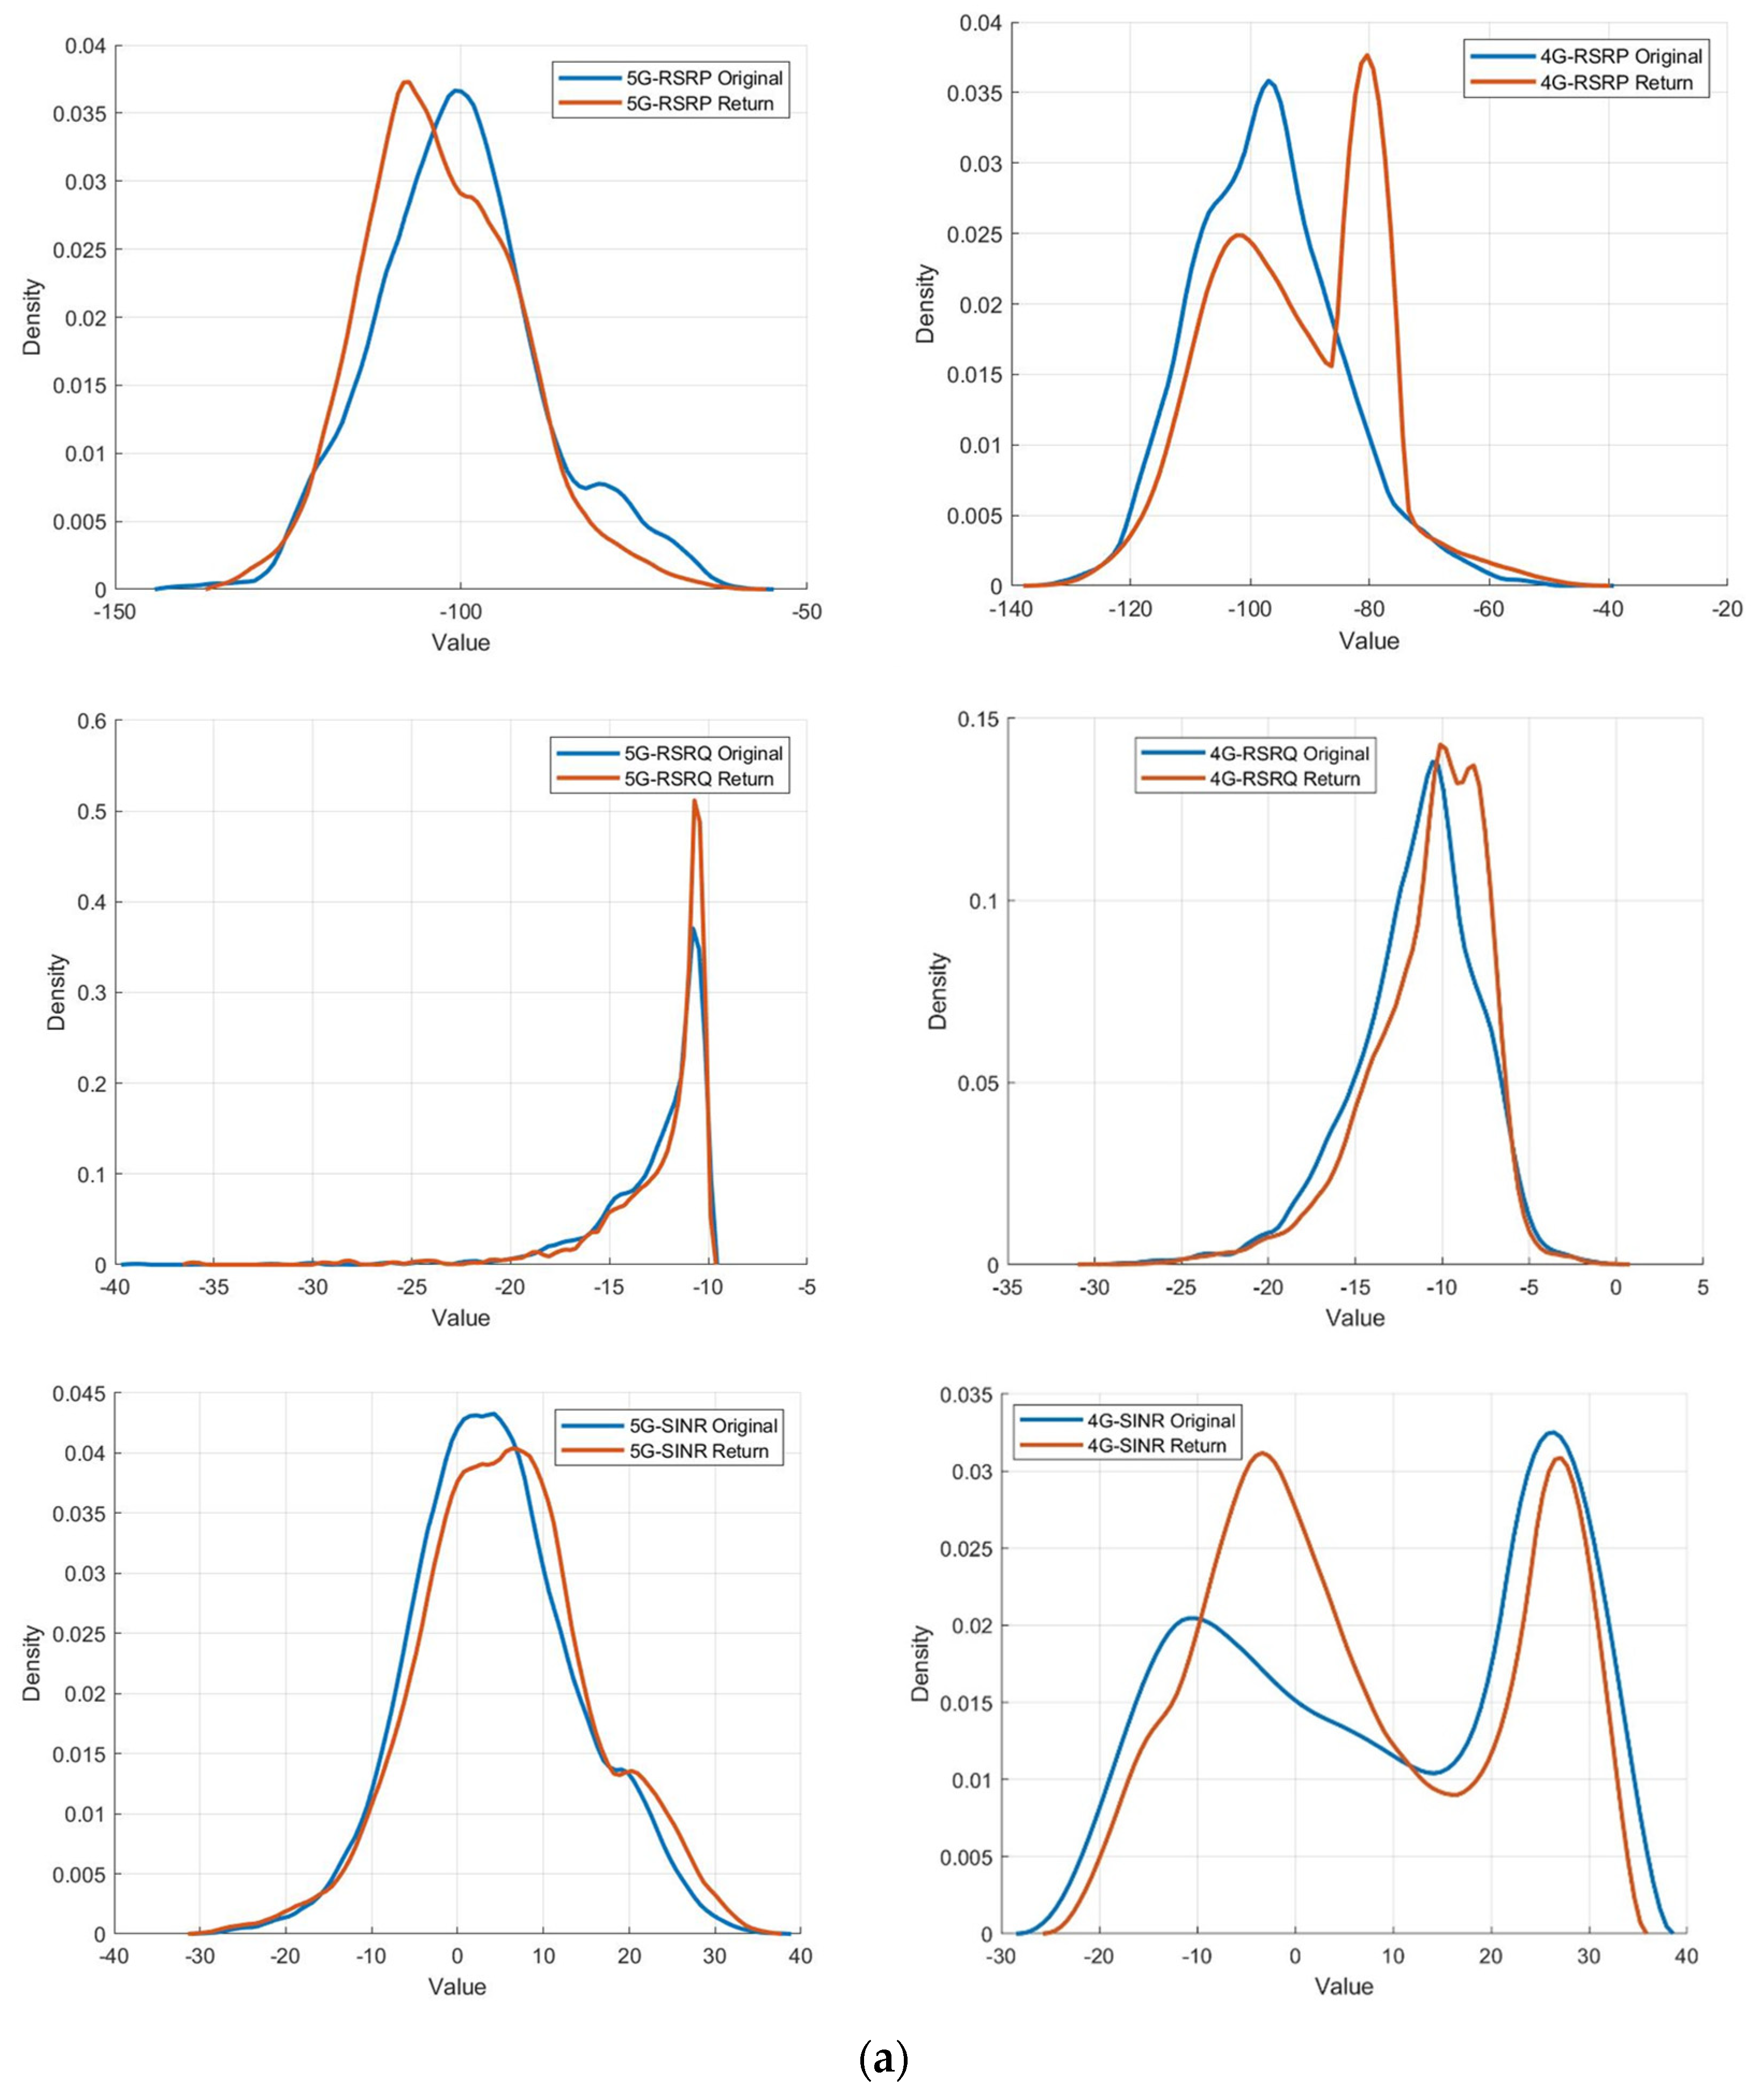
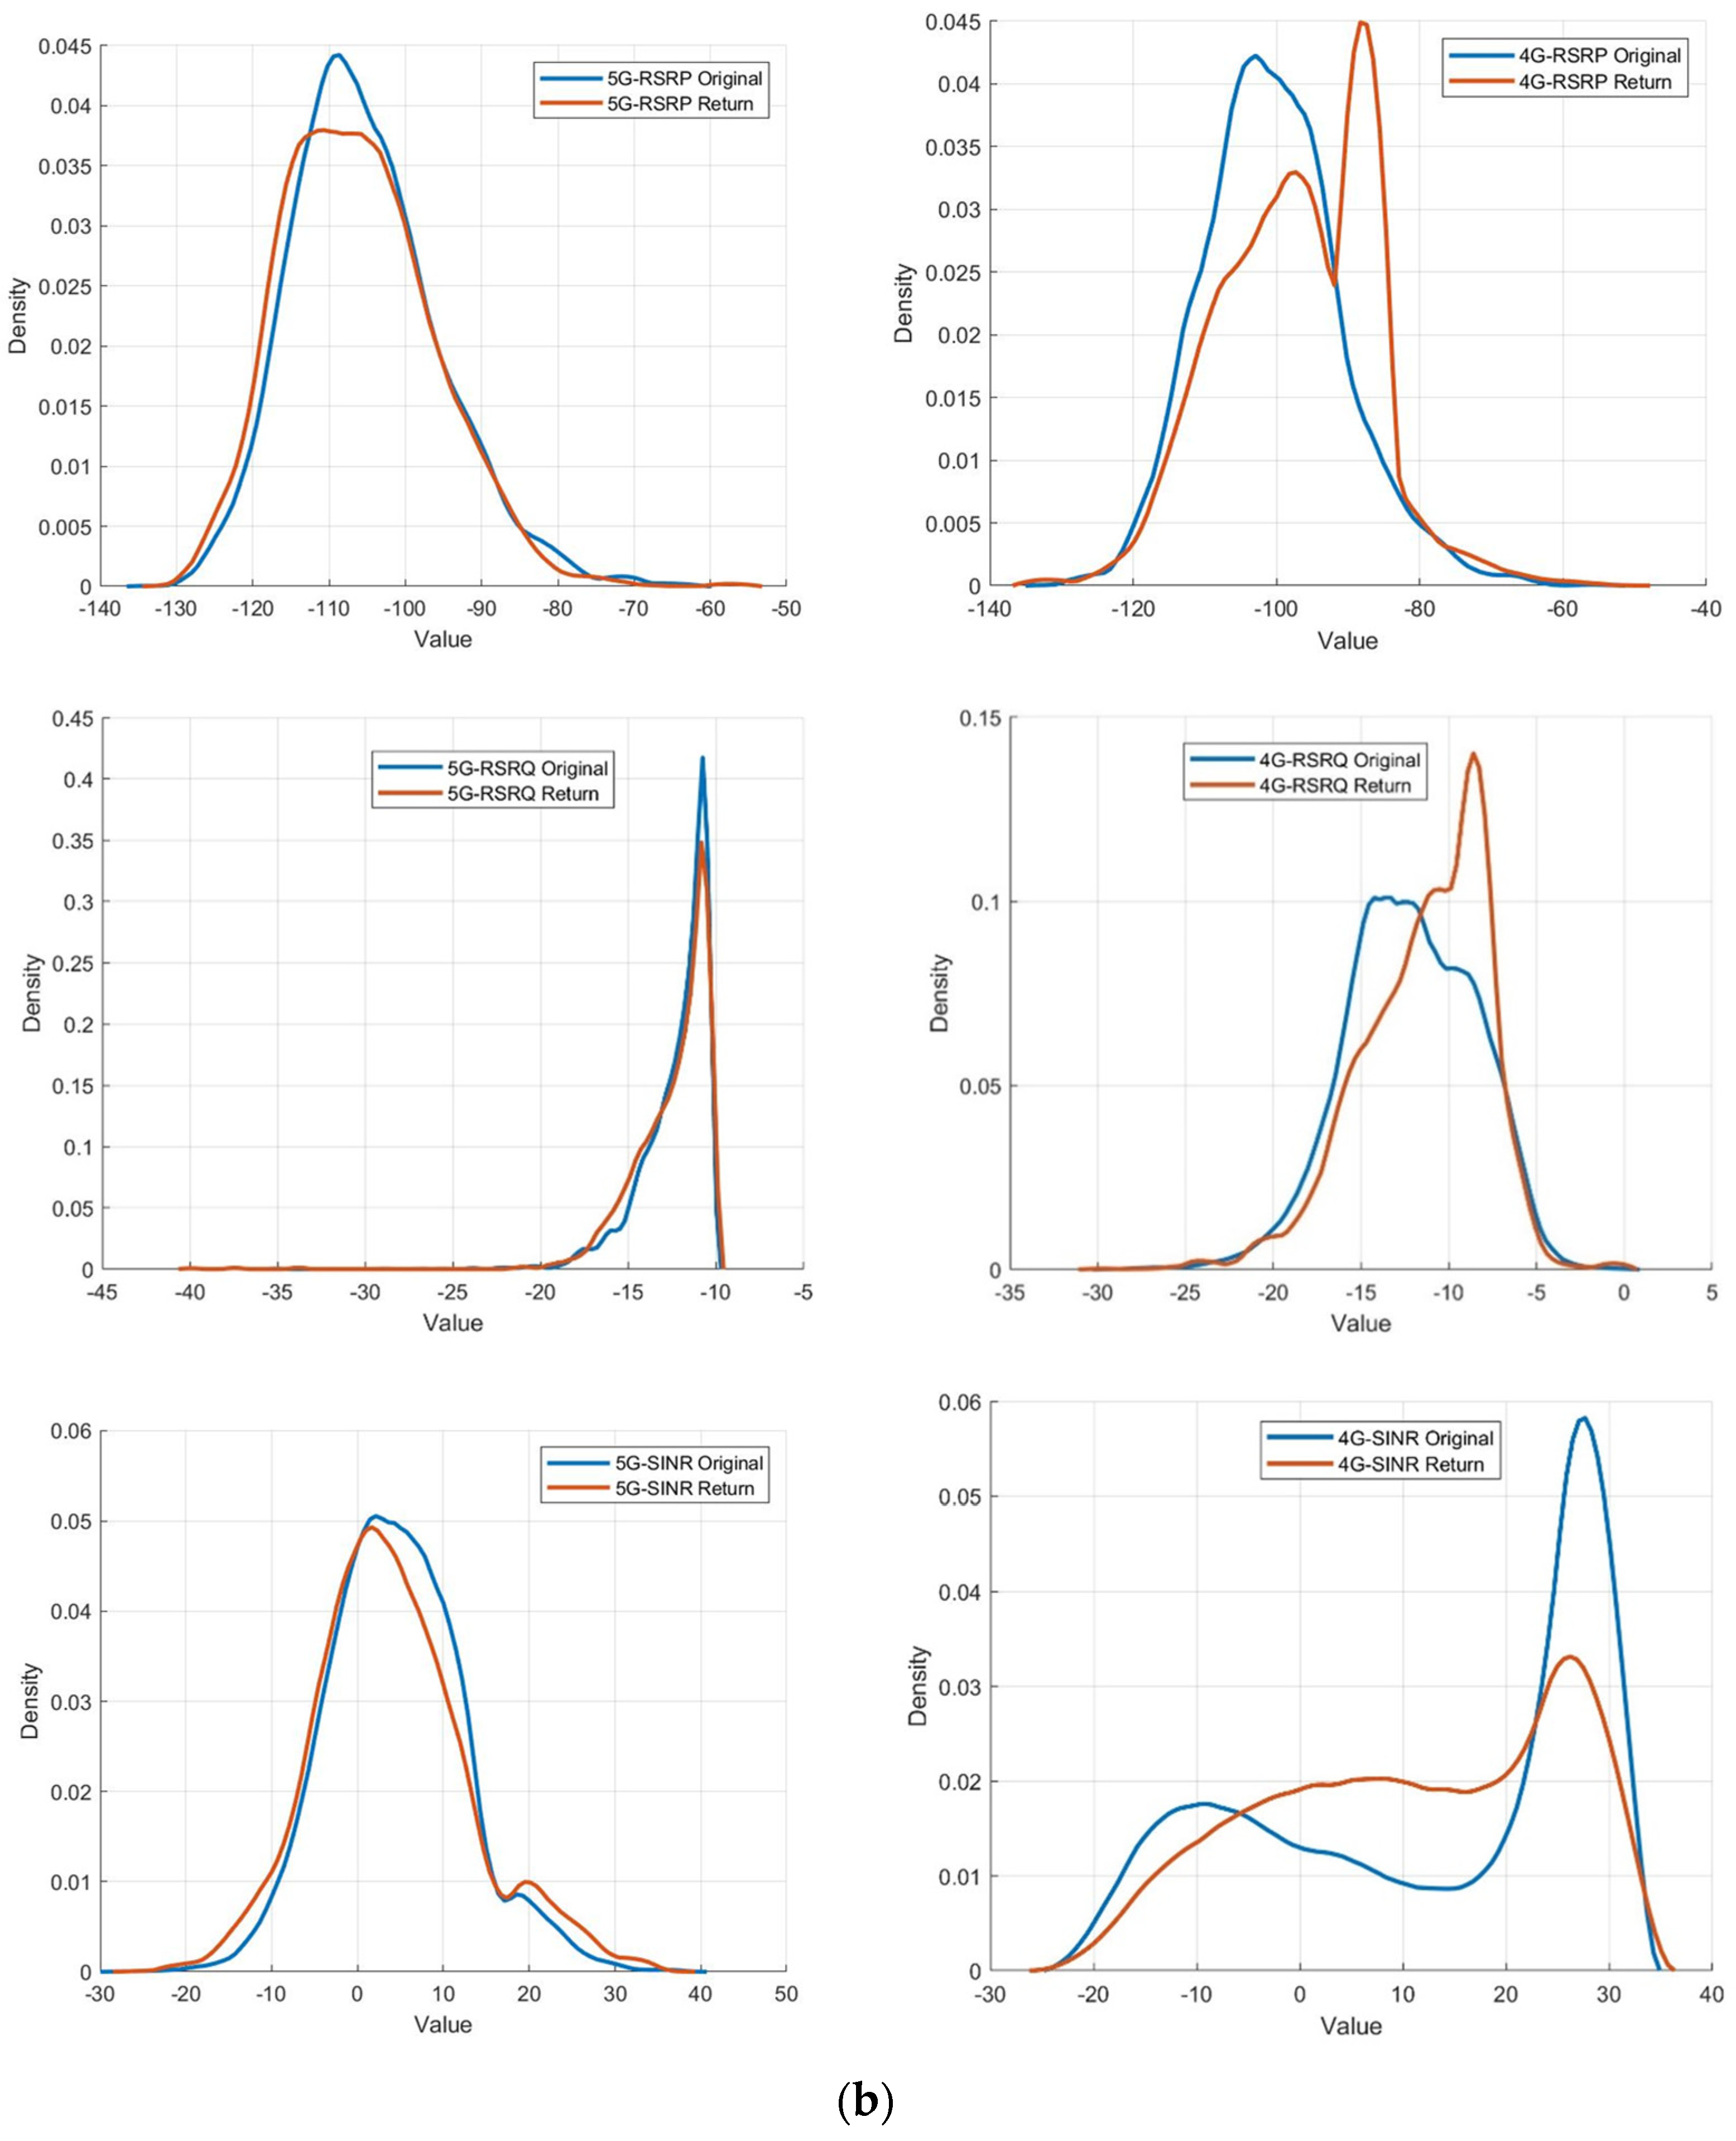
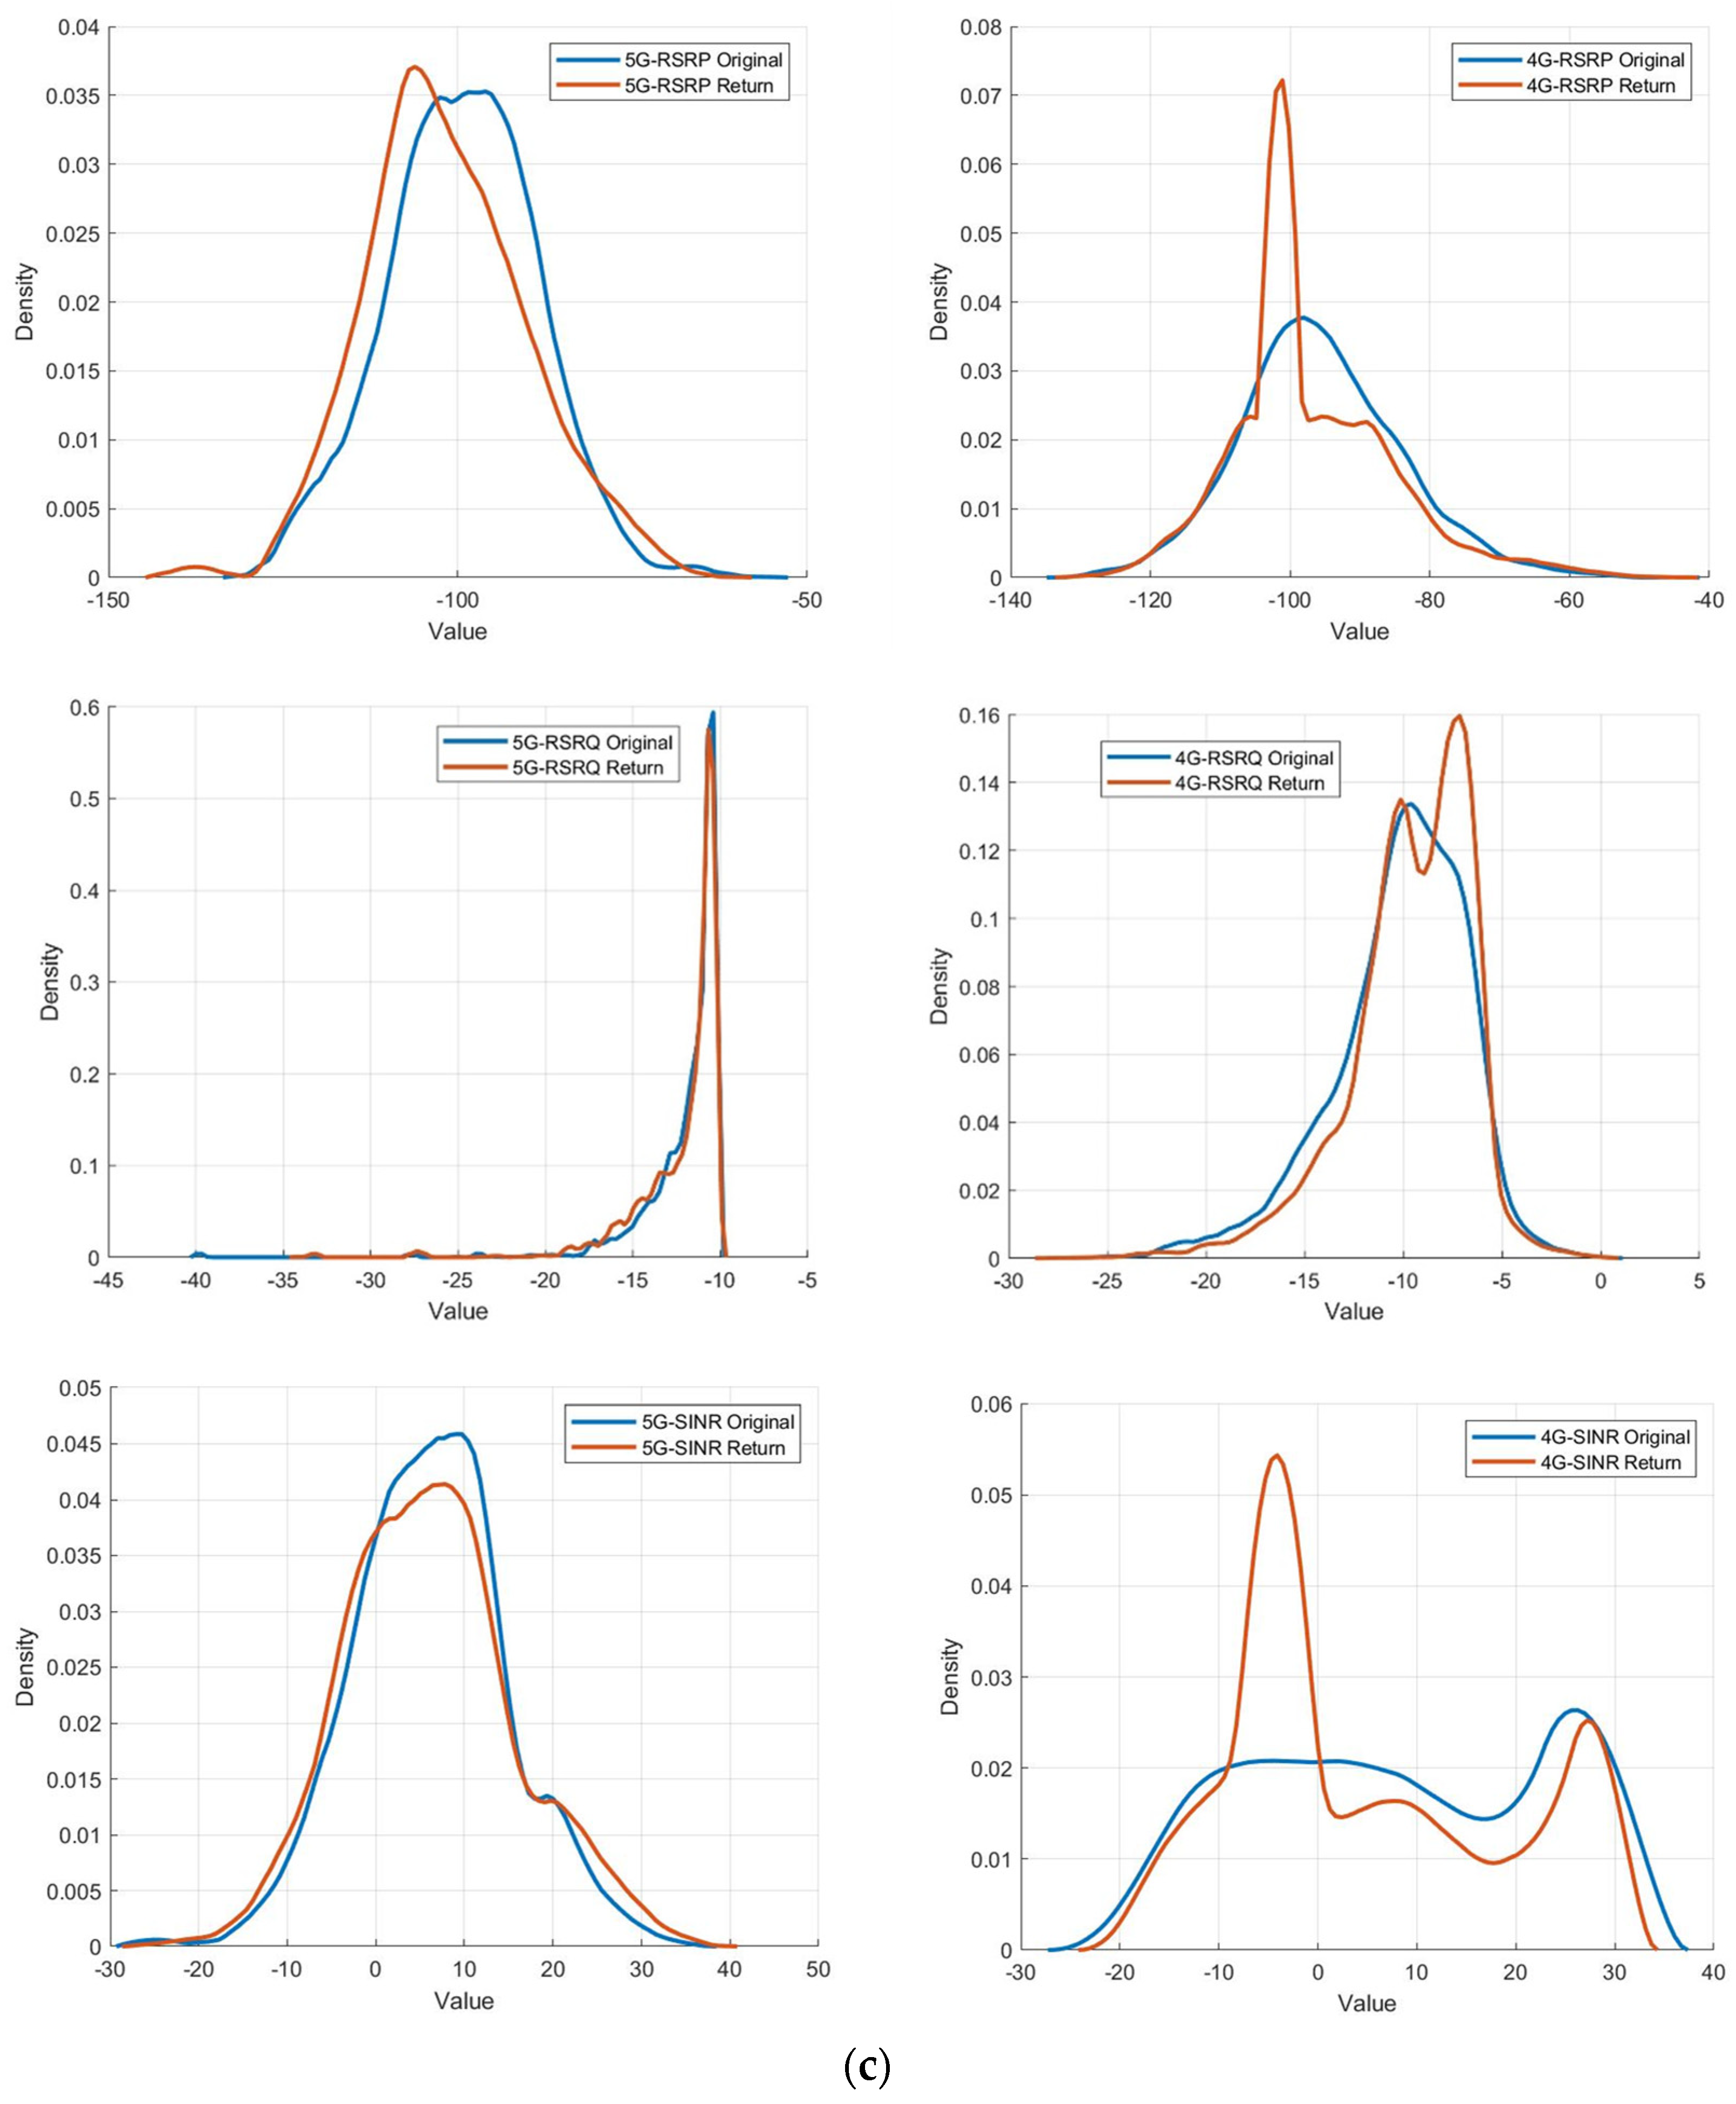
The behavior of the three networks is now further investigated by considering the distributions of the RSRP, RSRQ, and SINR, using the KDE approach, as outlined above. The results of this analysis are presented in the plots of
Figure 6.
For Operators A and B, there is a notable RSRP peak difference between the original and return curves in the 4G network, with the return curve peaking at a considerably higher value. This indicates a concentration of RSRP values on the return route, possibly because of different conditions or improved signal reception. Also, for all operators, the 5G original and return curves are rather aligned, suggesting that the signal conditions were pretty consistent in both directions. The SINR performance for Operators B and C shows similarities, B being clearly better with a high peak at around 26 dB and C having similar but “opposite” behavior with a peak in the return trip, around −5 dB. Interestingly, the 4G SINR distribution for operator A shows two distinct lobes as follows: a primary positive lobe around 25 dB and a secondary, lower peak around −5 dB. This bimodal distribution indicates two different operating conditions, where the SINR fluctuates significantly between excellent and poor performance. The original and return 4G RSRQ curves for all operators show peak density divergence with the return curve peaking at higher values, which may suggest an improved signal quality on the return path. Also, the 5G RSRQ original and return curves are closely aligned, suggesting consistent signal quality in both directions.
For a more granular and qualitative understanding of network performance,
Table 3 enumerates the thresholds corresponding to distinct categories of signal conditions. These thresholds for RSRP, RSRQ, and SINR serve as the benchmarks for evaluating the collected signal data. This evaluation framework allows for the quantification of the proportion of time during the measurement route that each signal parameter fell into the categories defined as excellent, good, fair, or poor. The choice of these threshold values in
Table 3 is grounded in empirical insights derived from prior measurement exercises [
12], as well as established analyses found in the literature [
13].
Following this line of thought,
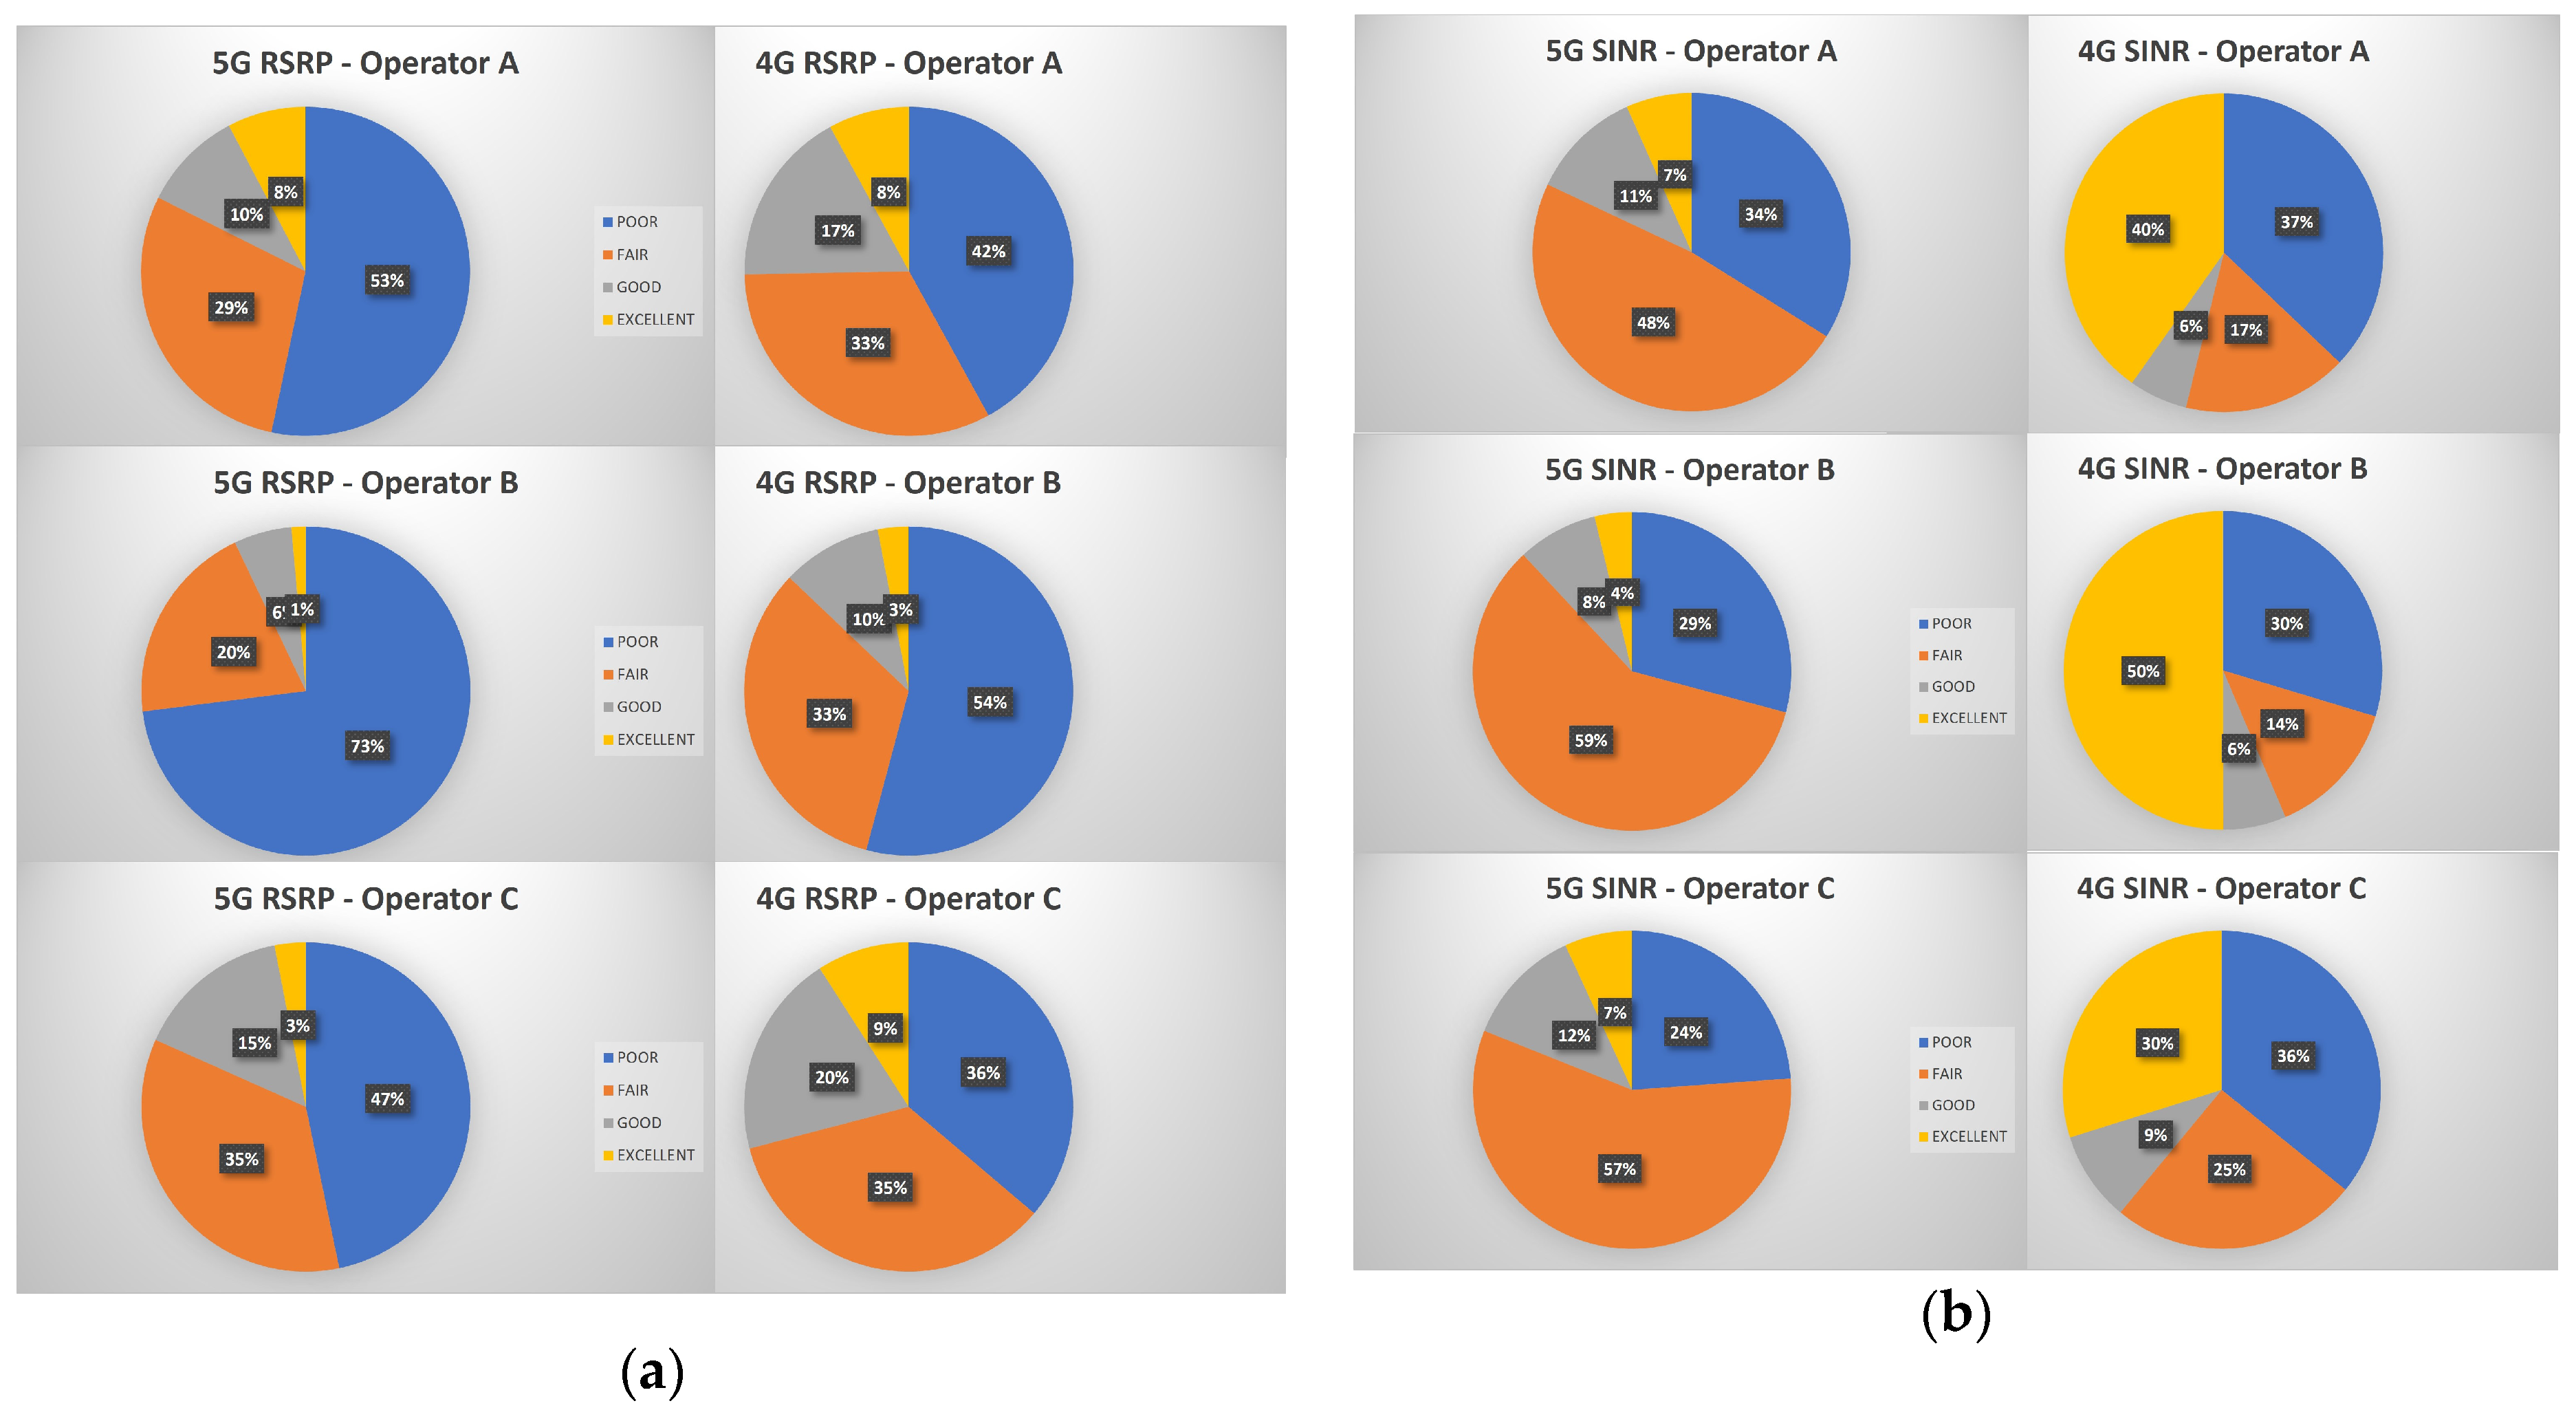
Table 4 shows the statistics for the “original” or outward measurement route, for the three operators and both 5G and 4G networks. For better visualization,
Figure 7 also shows pie charts for the RSRP and SINR.
For 5G RSRP, the majority (53%) of the RSRP measurements are categorized as poor, which may indicate significant areas with weak signal strength. Only a small fraction (18%) falls into the good and excellent categories.
The 5G SINR values are predominantly in the fair range (48%), with a relatively lower incidence of Poor (34%) and Good (11%) readings, suggesting reasonable signal quality and a notable amount of interference or noise in the network.
For 5G RSRQ, the vast majority (86%) of RSRQ measurements are good, showing strong signal quality, with minimal poor readings. Hence, despite the signal strength issues, the quality of the received signals is high. This suggests that the network is effective at utilizing the available signal for data transmission, which can help maintain a satisfactory user experience in terms of call quality and data service stability, especially in scenarios where RSRP is not optimal.
The 4G RSRP reflects a balanced distribution across poor and fair (75%), with limited good and excellent readings, indicating average signal strength.
The 4G SINR values for 4G show a significant amount (40%) categorized as excellent, suggesting very good signal quality despite a considerable proportion being poor (37%). This bimodal behavior between excellent and poor performance was also noticed in
Figure 6.
The 4G RSRQ shows a positive outlook with (50%) good and (35%) excellent, which indicates favorable signal quality and network conditions.
The 5G RSRP has a large proportion of poor readings (73%), indicating prevalent weak signal strength across the measured route. With “good” and “excellent” categories combined accounting for only 7%, this suggests that users in a significant portion of the network are likely experiencing difficulties in maintaining a stable connection, leading to potential issues with dropped connections, slow data rates, and generally poor service quality.
The 5G SINR displays a majority of fair (59%) and poor (29%) readings, suggesting moderate signal quality. This indicates that although the signal is often strong enough to maintain a connection, the quality of that connection may be compromised by interference or noise. Moderate SINR values (i.e., “fair”) suggest that while users might not experience the best possible data speeds and service quality, the network is still functional for basic to moderately demanding tasks. However, the presence of a substantial “poor” category indicates areas where user experience may be severely impacted because of high levels of interference and noise.
The 5G RSRQ shows a predominant share in the good category (87%), with some readings in excellent, pointing to generally high-quality signal conditions. The predominantly “good” RSRQ measurements, with some “excellent” readings, suggest that despite the challenges with signal strength and interference, the quality of the signal being utilized for data transmission is generally high. This means that when users do get connected, the efficiency and reliability of the data transmission are largely maintained.
For the 4G RSRP, similar to 5G, a significant amount (54%) of readings fall under poor, with fair at (33%), indicating a generally weaker 4G signal strength. This could lead to challenges in maintaining stable and reliable connections, impacting the ability of users to connect and stay connected reliably. This may affect call quality, increase call drops, and result in slower data speeds in many areas.
For the 4G SINR, a vast majority (50%) is categorized as excellent, indicating very high signal quality. On the other hand, 30% is poor, indicating again a bimodal behavior, as for Operator A.
The 4G RSRQ indicates good signal quality, with most readings classified as good (48%) and excellent (30%). This indicates favorable signal quality and network conditions, suggesting that the network is well-optimized for data transmission.
The 5G RSRP shows a more evenly spread distribution across poor and fair (82%) with a small proportion in good and excellent, suggesting varied signal strengths with a tendency towards weaker performance.
For the 5G SINR, more than half the readings (57%) are fair, with a good distribution across the other categories, reflecting moderate signal quality.
The 5G RSRQ stands out with a high percentage in the good category (93%), suggesting strong signal quality and reliability.
The 4G RSRP demonstrates a fairly even distribution, with a tilt towards better signal strength, as reflected in the higher good (20%) and excellent (9%) categories compared with Operators A and B.
The 4G SINR is more evenly distributed across the quality spectrum, with (30%) excellent readings, indicating high signal quality.
The 4G RSRQ shows the best distribution, with a majority in the good (37%) and excellent (54%) categories, implying superior signal quality and network condition.
To synthesize a comprehensive analysis, we integrate the statistics from the return trip, shown in
Table 5, with the findings from the outward trip.
Operator A: There is a noticeable shift toward poorer 5G RSRP quality on the return trip with 62% poor ratings, compared with 53% poor ratings on the outward trip. However, the SINR and RSRQ percentages remain relatively stable, suggesting that while the signal strength declined, the quality of the connection did not deteriorate proportionally.
Operator B: Operator B exhibits similar poor 5G RSRP ratings (75% on the return trip vs. 73% on the outward trip), which could indicate a consistent issue with 5G signal strength in both directions. SINR quality also decreased slightly on the return, while RSRQ quality showed a slight increase in good ratings.
Operator C: Operator C shows a worse poor performance in 5G RSRP ratings on the return trip (58% poor vs. 47% poor on the outward trip) but similar SINR and RSRQ.
Operator A: On the return trip, the percentage of poor 4G RSRP ratings decreased (33% vs. 42% on the outward trip), and the excellent ratings increased (22% vs. 8% on the outward trip), indicating better signal strength. SINR degraded in good/excellent ratings, while RSRQ improved, with excellent ratings reaching 48%.
Operator B: The 4G RSRP good and excellent ratings improved on the return trip, indicating better signal strength. The SINR excellent ratings degraded by 15%, while significant improvement was seen in 4G RSRQ, with excellent ratings at 42% on the return trip.
Operator C: Operator C demonstrates worse poor 4G RSRP on the return trip, with similar worse performance in SINR, while RSRQ shows a slight improvement, with excellent ratings reaching 60% on the return trip.
All operators face challenges with 5G signal strength to varying degrees, with Operator B showing the weakest signal strength. However, the quality and efficiency of the signal, as indicated by SINR and RSRQ measurements, suggest that networks are generally effective at delivering data services where a signal is available. Operator C appears to have a slight edge in maintaining stronger RSRQ performance, although it has to be highlighted that it has the smallest 5G system availability. In terms of 4G performance, the operators demonstrate better signal strength in their 4G networks compared with 5G, with Operator B showing the worst RSRP behavior. SINR and RSRQ ratings are favorable across all operators, indicating high-quality signal conditions and efficient network utilization for 4G services. While there are signal strength challenges, especially in 5G networks, the overall quality and efficiency of the networks (as reflected in SINR and RSRQ measurements) are maintained at a good level. This suggests that despite areas of weak signal, where connections are established, users can expect reliable and efficient service.
3.3. Latency and Throughput Analysis
Table 6 shows the measured latency times for the three operators and both trips. Operator B, despite having the highest latency, also has the highest 5G availability (see
Table 1), which suggests that when the network is available, it suffers from congestion or technical limitations that increase latency. Conversely, Operator A, with the lowest average latency for 4G, has full availability on 4G but significantly lower 5G availability, indicating a potential focus on 4G network reliability. Operator C has the lowest 5G availability, indicative of a less developed 5G network, but maintains high 4G availability with moderate latency times. It has to be observed from these statistics that, on average, the latency times are generally within 4G goals but in no case near 5G goals.
The throughput in
Table 7 reveals that Operator B has the highest average and maximum downlink (DL avg/max) throughput for 5G, suggesting its network is capable of delivering superior peak performances. Operator C stands out with the highest uplink (UL max) throughput for 5G, which may be preferable for users with high upload demands. Operator A provides consistent service with full 4G throughput, yet its 5G network, while offering a significant boost in average download speed, still lags behind in average throughput capabilities when compared with Operators B and C.
Furthermore,
Table 8 shows the performance results for the three operators and the two trips for a basic speed test that was conducted at two-minute intervals throughout the entire journey. Operator A demonstrates robust download performance on the outward trip and Operator B on the return trip. Operator B shows consistency between the outward and return trips, whereas Operator C is less competitive. Operator A presents good upload speeds, particularly on return trips. Operator B maintains a balance in upload performance, outperforming Operator C, which shows lower upload averages.
Overall, while Operator B shows strong 5G availability and download throughput, it struggles with high latency, possibly because of network congestion. Operator A prioritizes 4G reliability and demonstrates competitive download and upload speeds, especially in 4G. Operator C, although lagging in 5G availability, offers the best 5G upload throughput, positioning it favorably for users with high upload demands.
4. Discussion and Conclusions
This study adopts a comprehensive methodological approach by conducting real-world field trials using smartphones equipped with advanced measurement software, aimed at evaluating a wide range of network performance metrics across various operational scenarios. Specifically, this research focuses on highway operational conditions—a domain less explored compared with urban and city scenarios—providing a detailed comparative analysis of service delivery among Greece’s three primary cellular network operators. By emphasizing critical metrics such as system availability, RSRP, RSRQ, SINR, delays, and throughput, this study seeks to dissect the intricacies of network performance under these unique conditions, particularly examining the distinctions and interplay between 4G and 5G technologies.
This study’s findings reveal distinct behavioral patterns for these key performance indicators that underscore the unique challenges and opportunities presented by high-speed travel scenarios. For RSRP, the analysis indicates a general trend where signal strength varies significantly across the highway route, reflecting the impact of physical geography and infrastructure on network coverage. In terms of RSRQ, the data suggest that while there is variability similar to RSRP, the quality of the received signal can maintain relatively stable levels, indicating that networks are capable of managing signal quality even when signal strength fluctuates. This stability is vital for ensuring that data services remain reliable over the course of a highway journey. The SINR findings highlight the efficacy of networks in managing signal interference, with generally favorable SINR values reported across highway routes. This suggests that current network configurations are effectively minimizing interference from both internal and external sources, a key factor in maintaining high-quality communication links. Latency and throughput measurements present a mixed picture, with 5G networks lagging significantly behind the 5G goals for reduced latency while demonstrating the potential for increased throughput compared with 4G.
This investigation also reveals significant variances in network quality and performance, shedding light on the areas of excellence for each operator and pinpointing improvement needs. A key aspect of the analysis is the comparison of 4G infrastructure robustness against the emerging challenges in optimizing 5G networks, especially within the context of highway operational scenarios. Notably, while Operator B shows the highest 5G availability, indicating a lead in 5G deployment, there is a noticeable need for further optimization to enhance coverage and reduce latency. Conversely, Operator A demonstrates a solid and consistent 4G performance, hinting at a mature network but with a clear imperative to bolster 5G coverage and stability. Operator C, despite its lower 5G coverage, unveils potential for efficiency in signal usage within its 4G framework, suggesting opportunities for expansion.
Some potential applications and extensions of the work include the following:
Extend the field trials to include more diverse geographical regions and more varied environmental conditions to generalize the findings.
Use the measured data to develop and train predictive models with the help of Machine Learning methods for the radio network performance under various traffic and environmental conditions, aiding in proactive radio network management.


 ,
, 


