Article

Harnessing the Radio Frequency Power Level of Cellular Terminals for Weather Parameter Sensing

by
Alexandros Sakkas
1,
Vasilis Christofilakis
1,*,
Christos J. Lolis
2,
Spyridon K. Chronopoulos
1,* and
Giorgos Tatsis
1
1
Electronics-Telecommunications and Applications Laboratory, Physics Department, University of Ioannina, 45110 Ioannina, Greece
2
Laboratory of Meteorology, Physics Department, University of Ioannina, 45110 Ioannina, Greece
*
Authors to whom correspondence should be addressed.
Electronics 2024, 13(5), 840; https://doi.org/10.3390/electronics13050840
Submission received: 31 January 2024 / Revised: 16 February 2024 / Accepted: 20 February 2024 / Published: 22 February 2024
(This article belongs to the Special Issue New Advances of Microwave and Optical Communication)

Abstract

:
In light of recent extreme weather events, it is imperative to explore innovative methodologies for promptly and accurately measuring various meteorological parameters. The high spatial and temporal variability in precipitation often surpasses the resolution capabilities of traditional rain gauge measurements and satellite estimation algorithms. Therefore, exploring alternative methods to capture this variability is crucial. Research on the correlation between signal attenuation and precipitation could offer valuable insights into these alternative approaches. This study investigates (a) the feasibility of the classification of precipitation rate using signal power measurements in cellular terminals and (b) the impact of atmospheric humidity as well as other meteorological parameters on the signal. Specifically, signal power data were collected remotely through a specialized Android application designed for this research. During the time of analysis, the power data were processed alongside meteorological parameters obtained from the meteorological station of the Physics Department at the University of Ioannina gathered over one semester. Having in mind the radio refractivity of the air as a fascinating concept affecting the way radio waves travel through the atmosphere, the processed results revealed a correlation with signal attenuation, while a correlation between the latter and absolute humidity was also observed. Moreover, a precipitation rate classification was attained with an overall accuracy exceeding 88%.

1. Introduction

As a matter of fact, the climate can exhibit outspread variations even inside the same country or area of interest, so rainfall measurements and predictions are always of high interest. The potential consequences of insufficient monitoring include significant disasters, such as flooding or droughts. Consequently, observation systems, models, and devices of high precision are needed for proper real-time estimation of precipitation [1]. As part of Earth’s water cycle, the latter is acknowledged to impact all residents in a given area of interest.
It is widely known that meteorological measurements and estimations are based on various equipment that ranges from a simple rain gauge to a satellite system. Notably, rain gauges provide important data relevant to surface rainfall. Also, radar technology can supply quantitative precipitation estimation (QPE) for vast areas. In addition to the mentioned schemes, satellite measurements contribute more and more to a global profile of predictions. This technology becomes more and more mature while evolving into a vital solution in the absence of gauges or radars [2]. Recently, efforts have been made to incorporate signal power loss measurements into the existing techniques for estimating precipitation [3].
Inductively to the previous facts and techniques, many nations (Netherlands, France, Germany, and Israel among them) have utilized commercial microwave links (CMLs) in their cellular networks for acquiring vital information about their regional spatial and temporal properties of rainfall. Many attempts have been made for the creation of models relating signal attenuation to precipitation [4]. Various CMLs (also known as opportunistic wireless sensor networks—OWSNs) have been utilized by scientists to acquire measurements between base stations (fronthaul/backhaul communications). In this way, a large system of sensors can be established. As an example, we can refer to China, as reported in [5], where 5G stations number over one million while showing the extent of CML-based measurement technology integration for the particular area of rainfall estimation. CMLs have found widespread application in numerous studies dedicated to rainfall sensing. In various investigations conducted in the Netherlands, CMLs that range from a few tens to a few thousands were utilized for rainfall sensing [6,7,8] and the subsequent creation of rainfall maps [9,10]. One study leveraged data from 70 CMLs [11]. It explored long-term rainfall monitoring methodologies in Israel, whereas another study delved into rainfall maps through a smart-city wireless network, investigating both empirical and recurrent neural network approaches [12]. In Germany, data from thousands of CMLs were used for training convolutional neural networks to detect rainfall-specific attenuation [13]. Additionally, researchers utilized data from thousands of CMLs across Germany for rainfall estimation, while considering the wet antenna effect [14]. Another study focused on hourly precipitation sums (based on CMLs) during a flood event in Germany [15]. In Brazil, an analysis of the correlation between rain and power measurements from 145 CMLs was conducted, utilizing the RAINLINK open-source algorithm [16]. Also, a study from the Netherlands explored potential enhancements to the same algorithm [17]. A novel retrieval algorithm demonstrated the capability of microwave links to monitor urban rainfall in France by utilizing data from 25 CMLs [18]. Collaboration between researchers from Germany and the Czech Republic led to the amalgamation of CML data from both, with the production of transboundary rainfall maps [19]. The challenges of such an endeavor are discussed in [20]. Rainfall estimation via CML measurements has been studied in West Africa, involving the usage of over 1000 CMLs for data collection, as presented in a preliminary analysis [21]. The same research team utilized data from 100 CMLs to generate rainfall maps [22]. In Lebanon, a research team employed CML data to train a low-complexity neural network for rainfall estimation [23]. In the Republic of Korea, datasets from multiple research paper publications were examined using different ITU-R models, thus training an artificial neural network for rain attenuation scaling based on both frequency and polarity [24].
There is a distinct scientific interest in employing CMLs for rainfall estimations, with a prevailing emphasis on frequencies exceeding 10 GHz [25]. Despite the predominant focus on higher frequencies, a limited number of studies focused on exploring the area of lower frequencies. In West Africa, a CML operating at 7 GHz was used for rainfall monitoring during a monsoon season [26]. Power loss measurements from an experimental setup operating at 2 GHz led to the creation of a rain estimation model in Greece [27]. Data from SmartBro subscribers, at 5 GHz, were employed in the Philippines for the development of a rain alarm system [28]. Studies focusing on frequencies below 10 GHz, or even lower than 5 GHz, often combined cellular terminals for signal power measurements. The rain attenuation caused to the GSM frequency of 1.8 GHz was investigated by using cellular terminals in Taiwan [29]. Furthermore, in Italy, a cellular terminal was utilized to explore the impact of rainfall on a 4G/LTE signal, and a probabilistic neural network was trained for rain classification [30]. A detection model for wet/dry classification was trained while it was based on cellular terminal measurements at 2 GHz in China [31].
Concerning the influence of meteorological parameters beyond rainfall on signal power, limited research has been conducted, particularly for frequencies below 10 GHz. In Sweden, a research team delved into the correlation between the performance of IEEE 802.15.4 links and various meteorological factors such as temperature, absolute humidity, precipitation, and sunlight [32]. Similarly, in Finland, IEEE 802.15.4 links operating at the 2.4 GHz ISM frequency were utilized to investigate the effects of temperature and relative and absolute humidity on signal power [33]. A study conducted by researchers in Germany addressed, among other factors, the impact of vegetative growth, temperature, relative humidity, and absolute humidity on the received signal strength of IEEE 802.15.4 links [34]. Researchers from Croatia and Portugal utilized a LoRa-based system while employing deep-learning techniques to explore the correlation between signal strength and soil humidity [35]. Additionally, researchers from Germany and Tunisia investigated the influence of temperature and humidity on signal power measurements in indoor sensor networks operating at 868 MHz [36]. Last but not least, researchers in Italy analyzed signal strength measurements in LoRaWAN networks, aiming to establish a correlation with temperature and absolute humidity [37].
Research on rainfall estimation through signal propagation over the last decade has mainly focused on the utilization of signal data originating from backhaul cellular microwave links, with microwave frequencies ranging from 10 GHz to over 35 GHz [38]. On the other hand, significant research gaps exist in the literature at the lower microwave frequencies [39]. Specifically, the application of mobile cellular terminals’ signal power, expressed by RSSI, for either the detection or the classification of precipitation is a subject of contemporary research [25,30]. To the best of the authors’ knowledge, this is the first reported case of simultaneously harnessing the RF power level of cellular terminals for rain classification with temperature, atmospheric pressure, humidity, and radio refractivity while furthermore processing a wealth of data. This paper aims to investigate the correlation between received signal strength and precipitation, along with other meteorological parameters such as the temperature, atmospheric pressure, relative humidity, absolute humidity, and radio refractivity of the air. This study utilized a cellular terminal for power measurements in the 4G/LTE frequency of 2630 MHz, using a specialized Android application, developed for this study. A trained classification tree model categorized precipitation rates into five distinct categories, along with the presented comparison with several other models. Consequently, the present work aims to contribute to the aforementioned research gap. Furthermore, it is estimated that signal data from cellular terminals with backhaul of the cell phone networks in combination with conventional rain measurement methods will lead in due course to more accurate weather forecasts. The rest of this paper is organized as follows: Section 2 describes the measurement setup, the experimental data, and the meteorological data. The experimental results are presented in Section 3, followed by a discussion in Section 4 and the conclusions in Section 5.

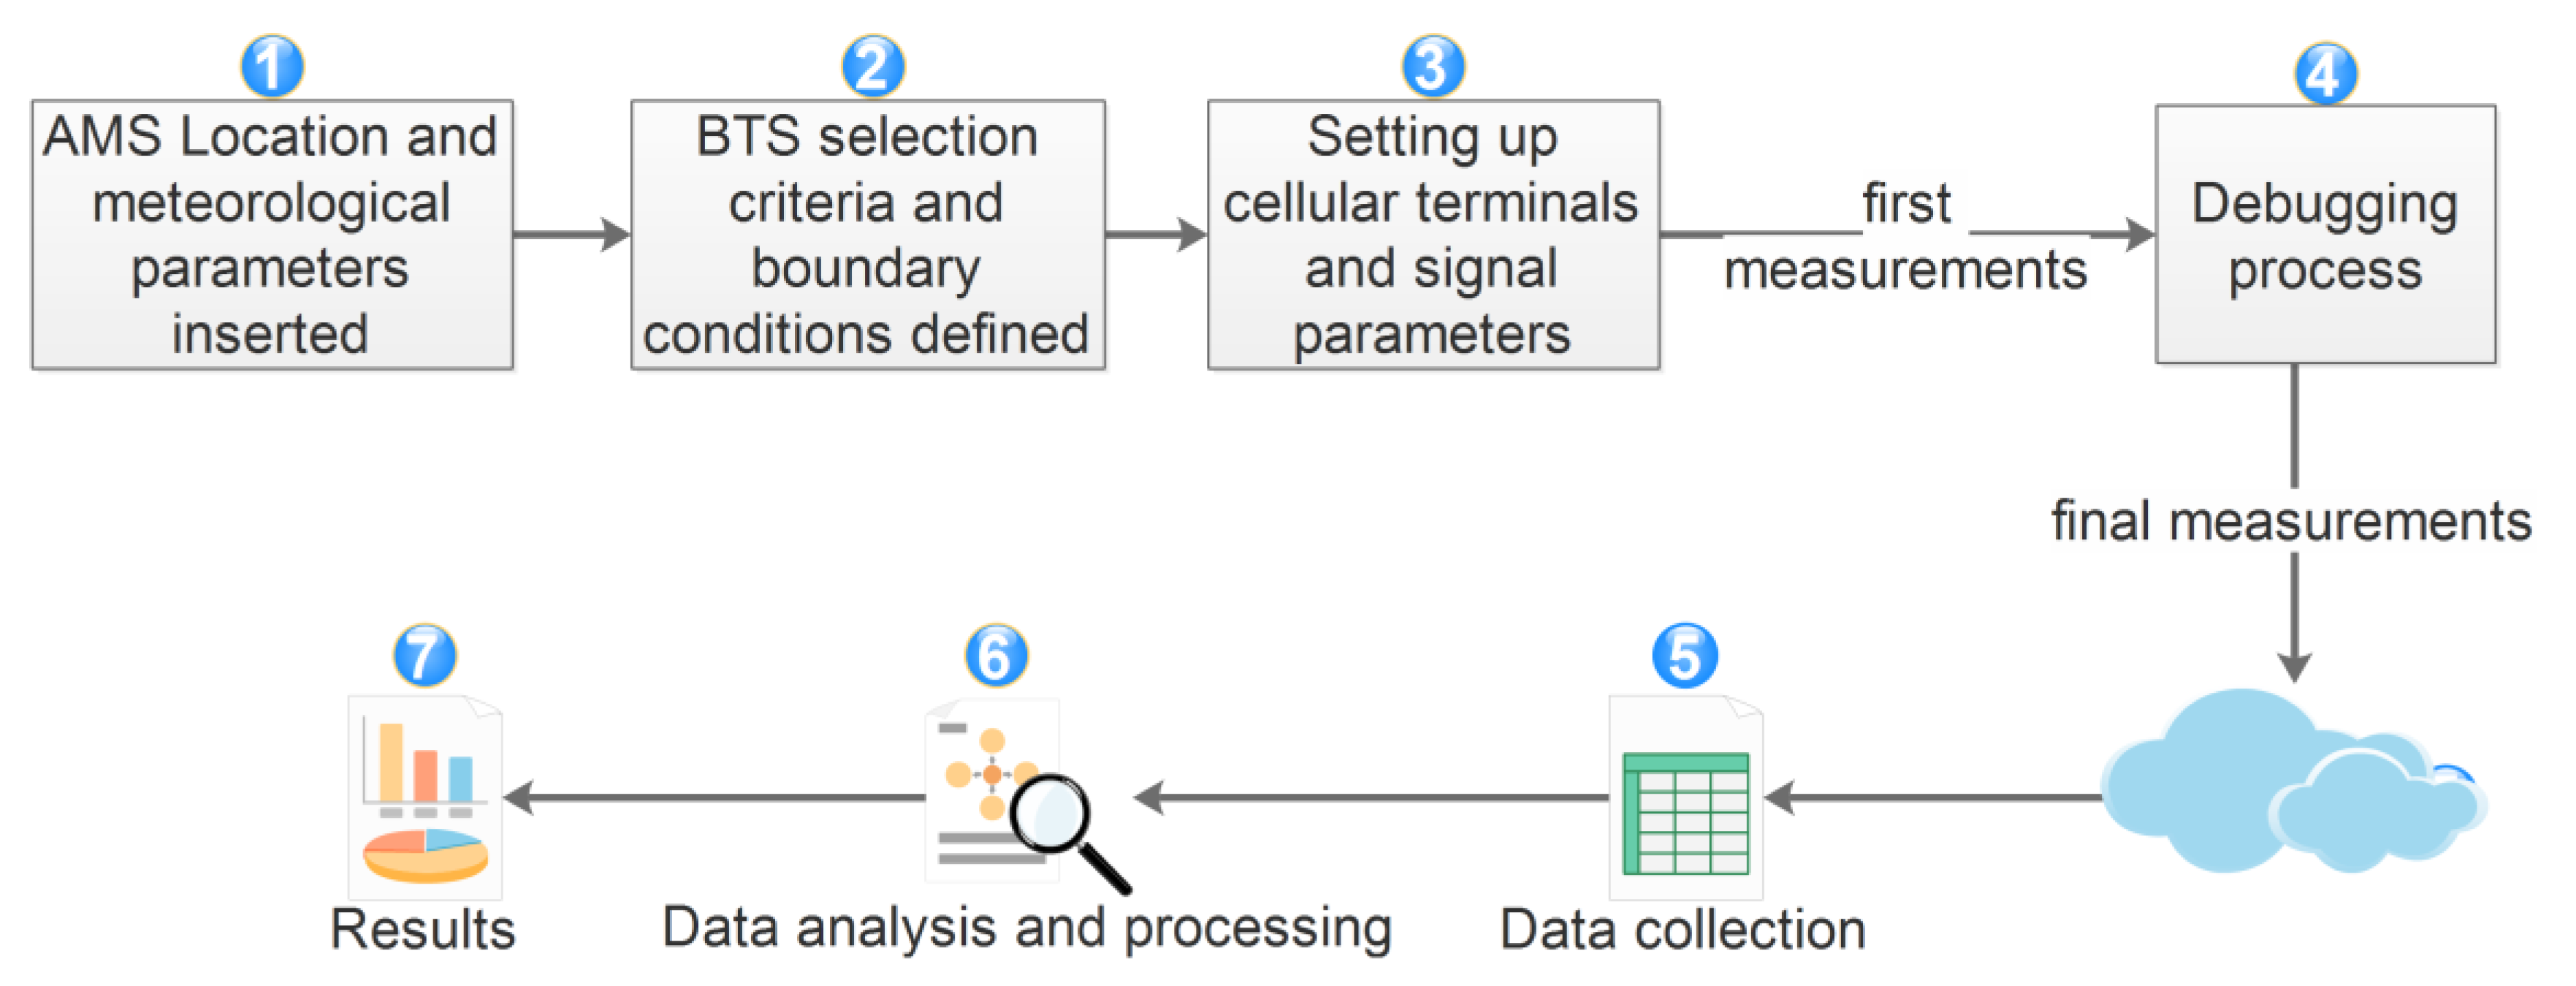
2. Measurement Setup and Data

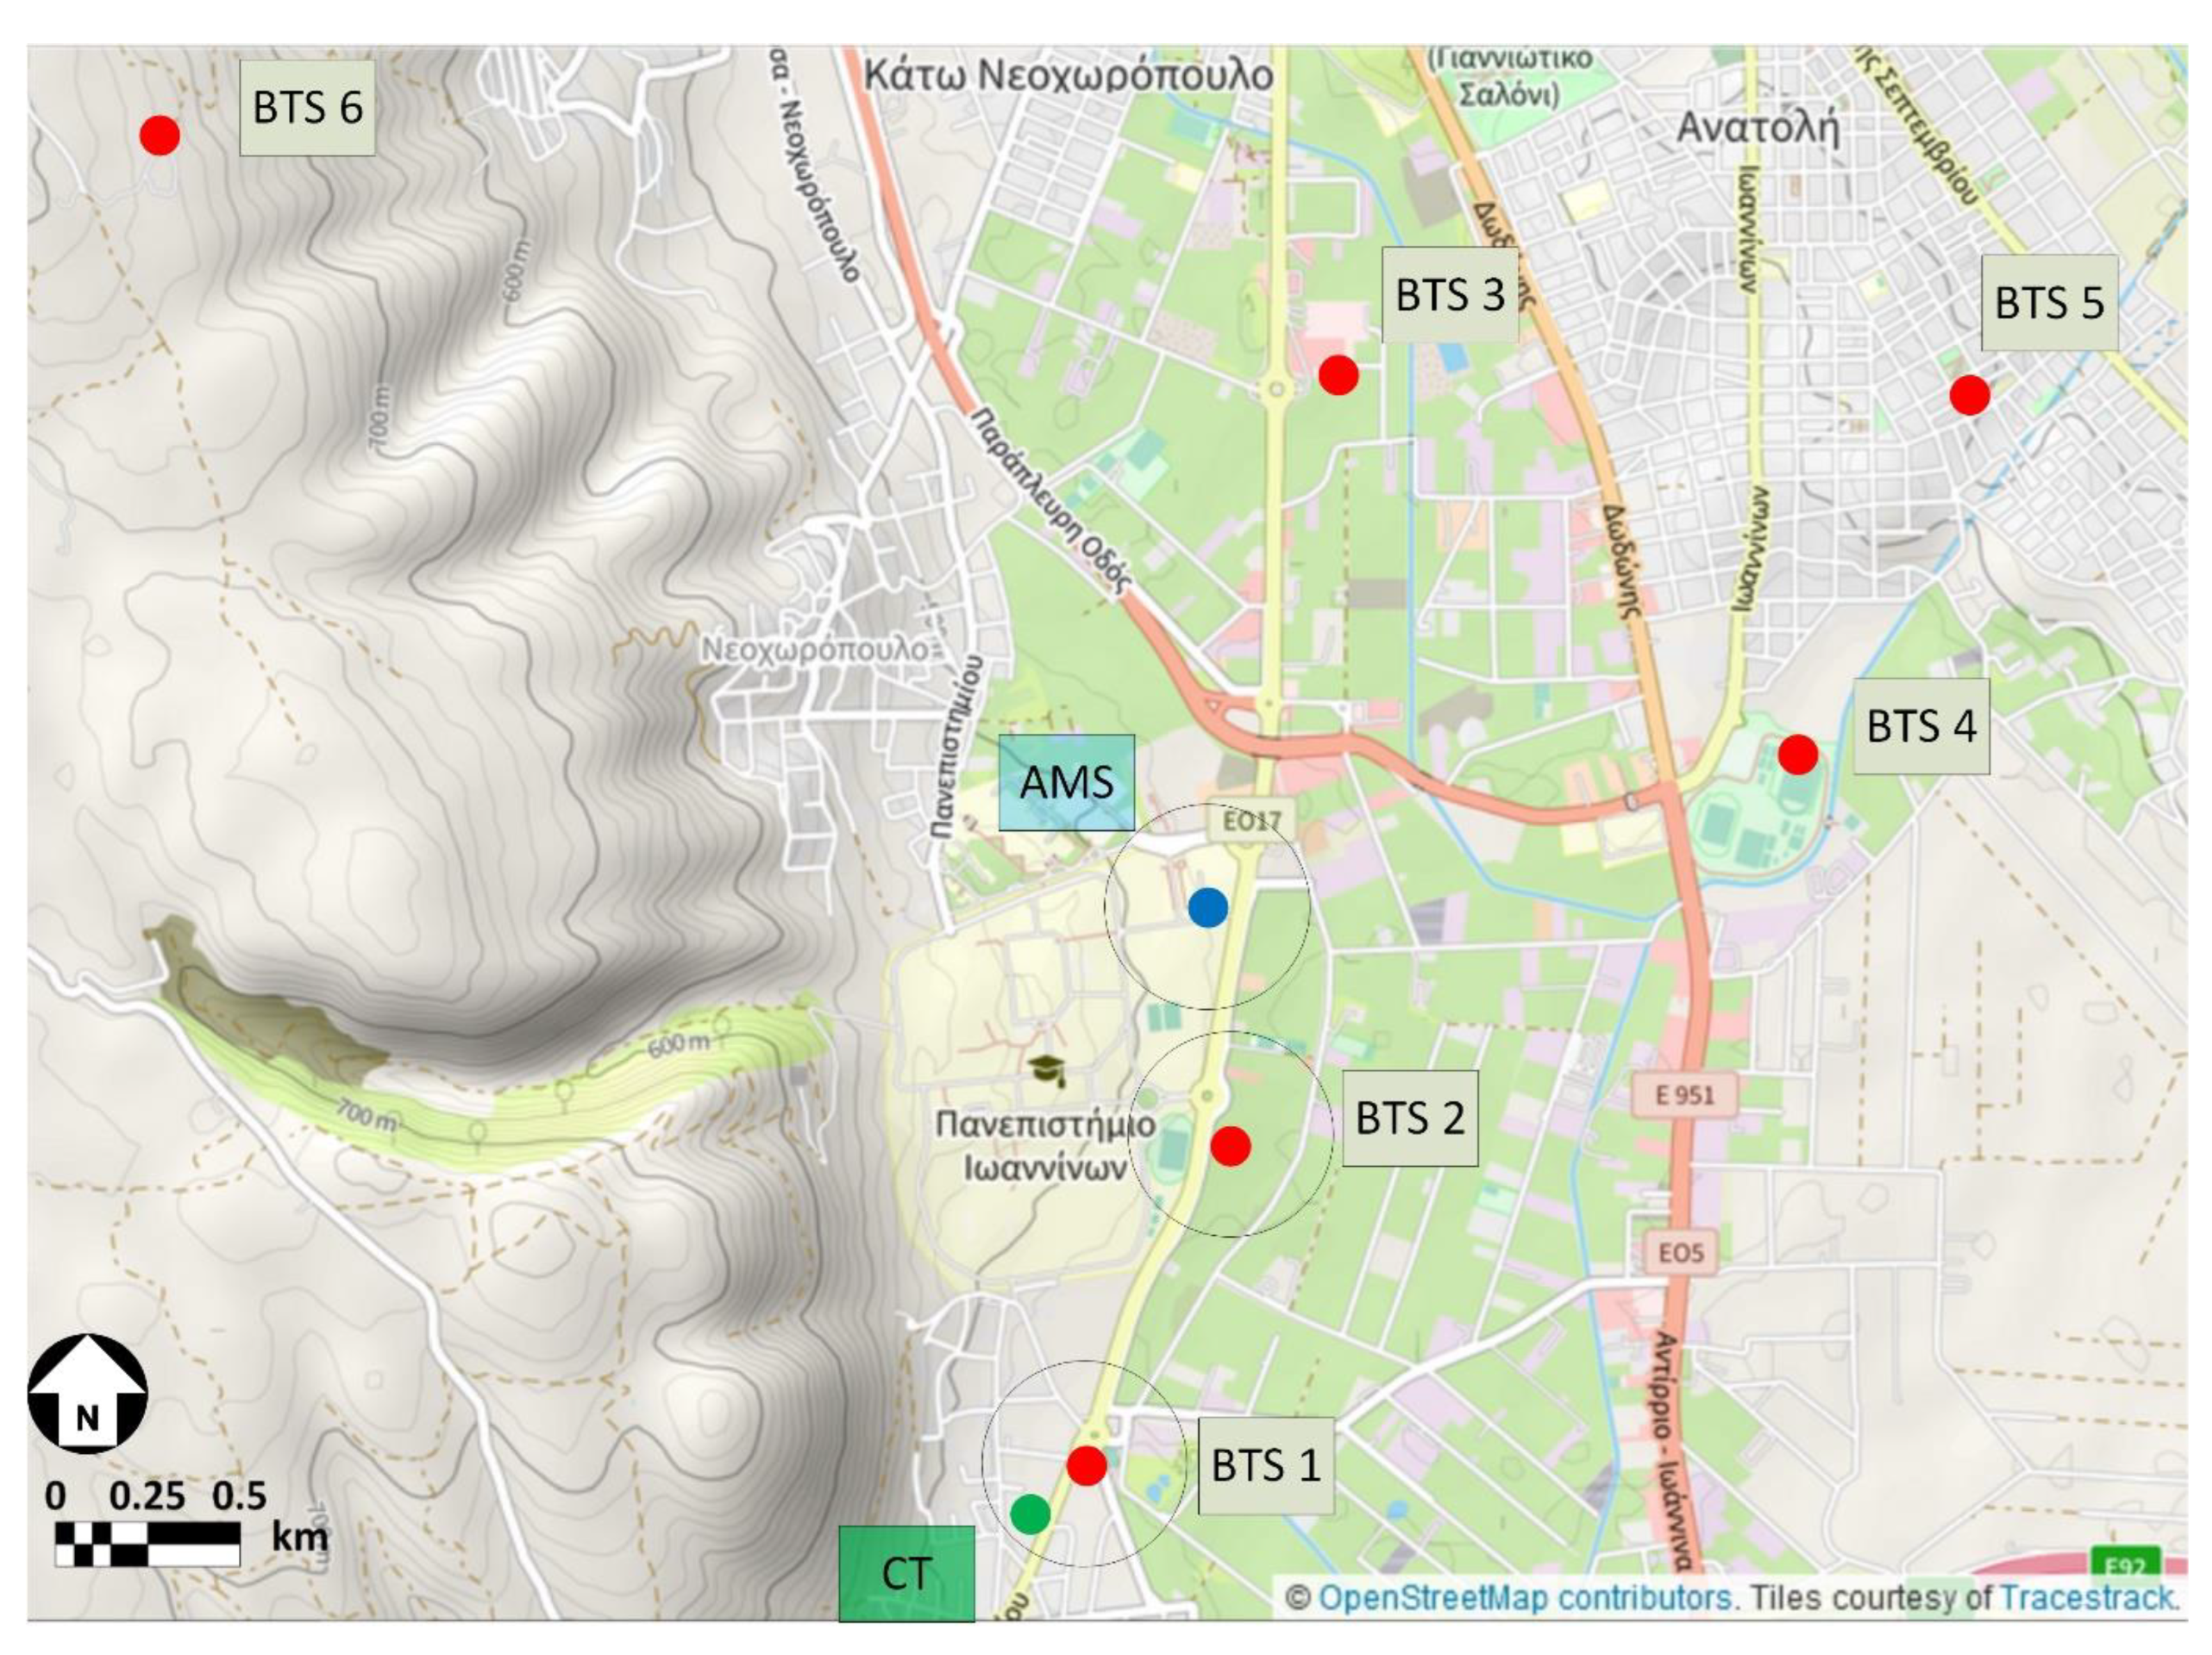
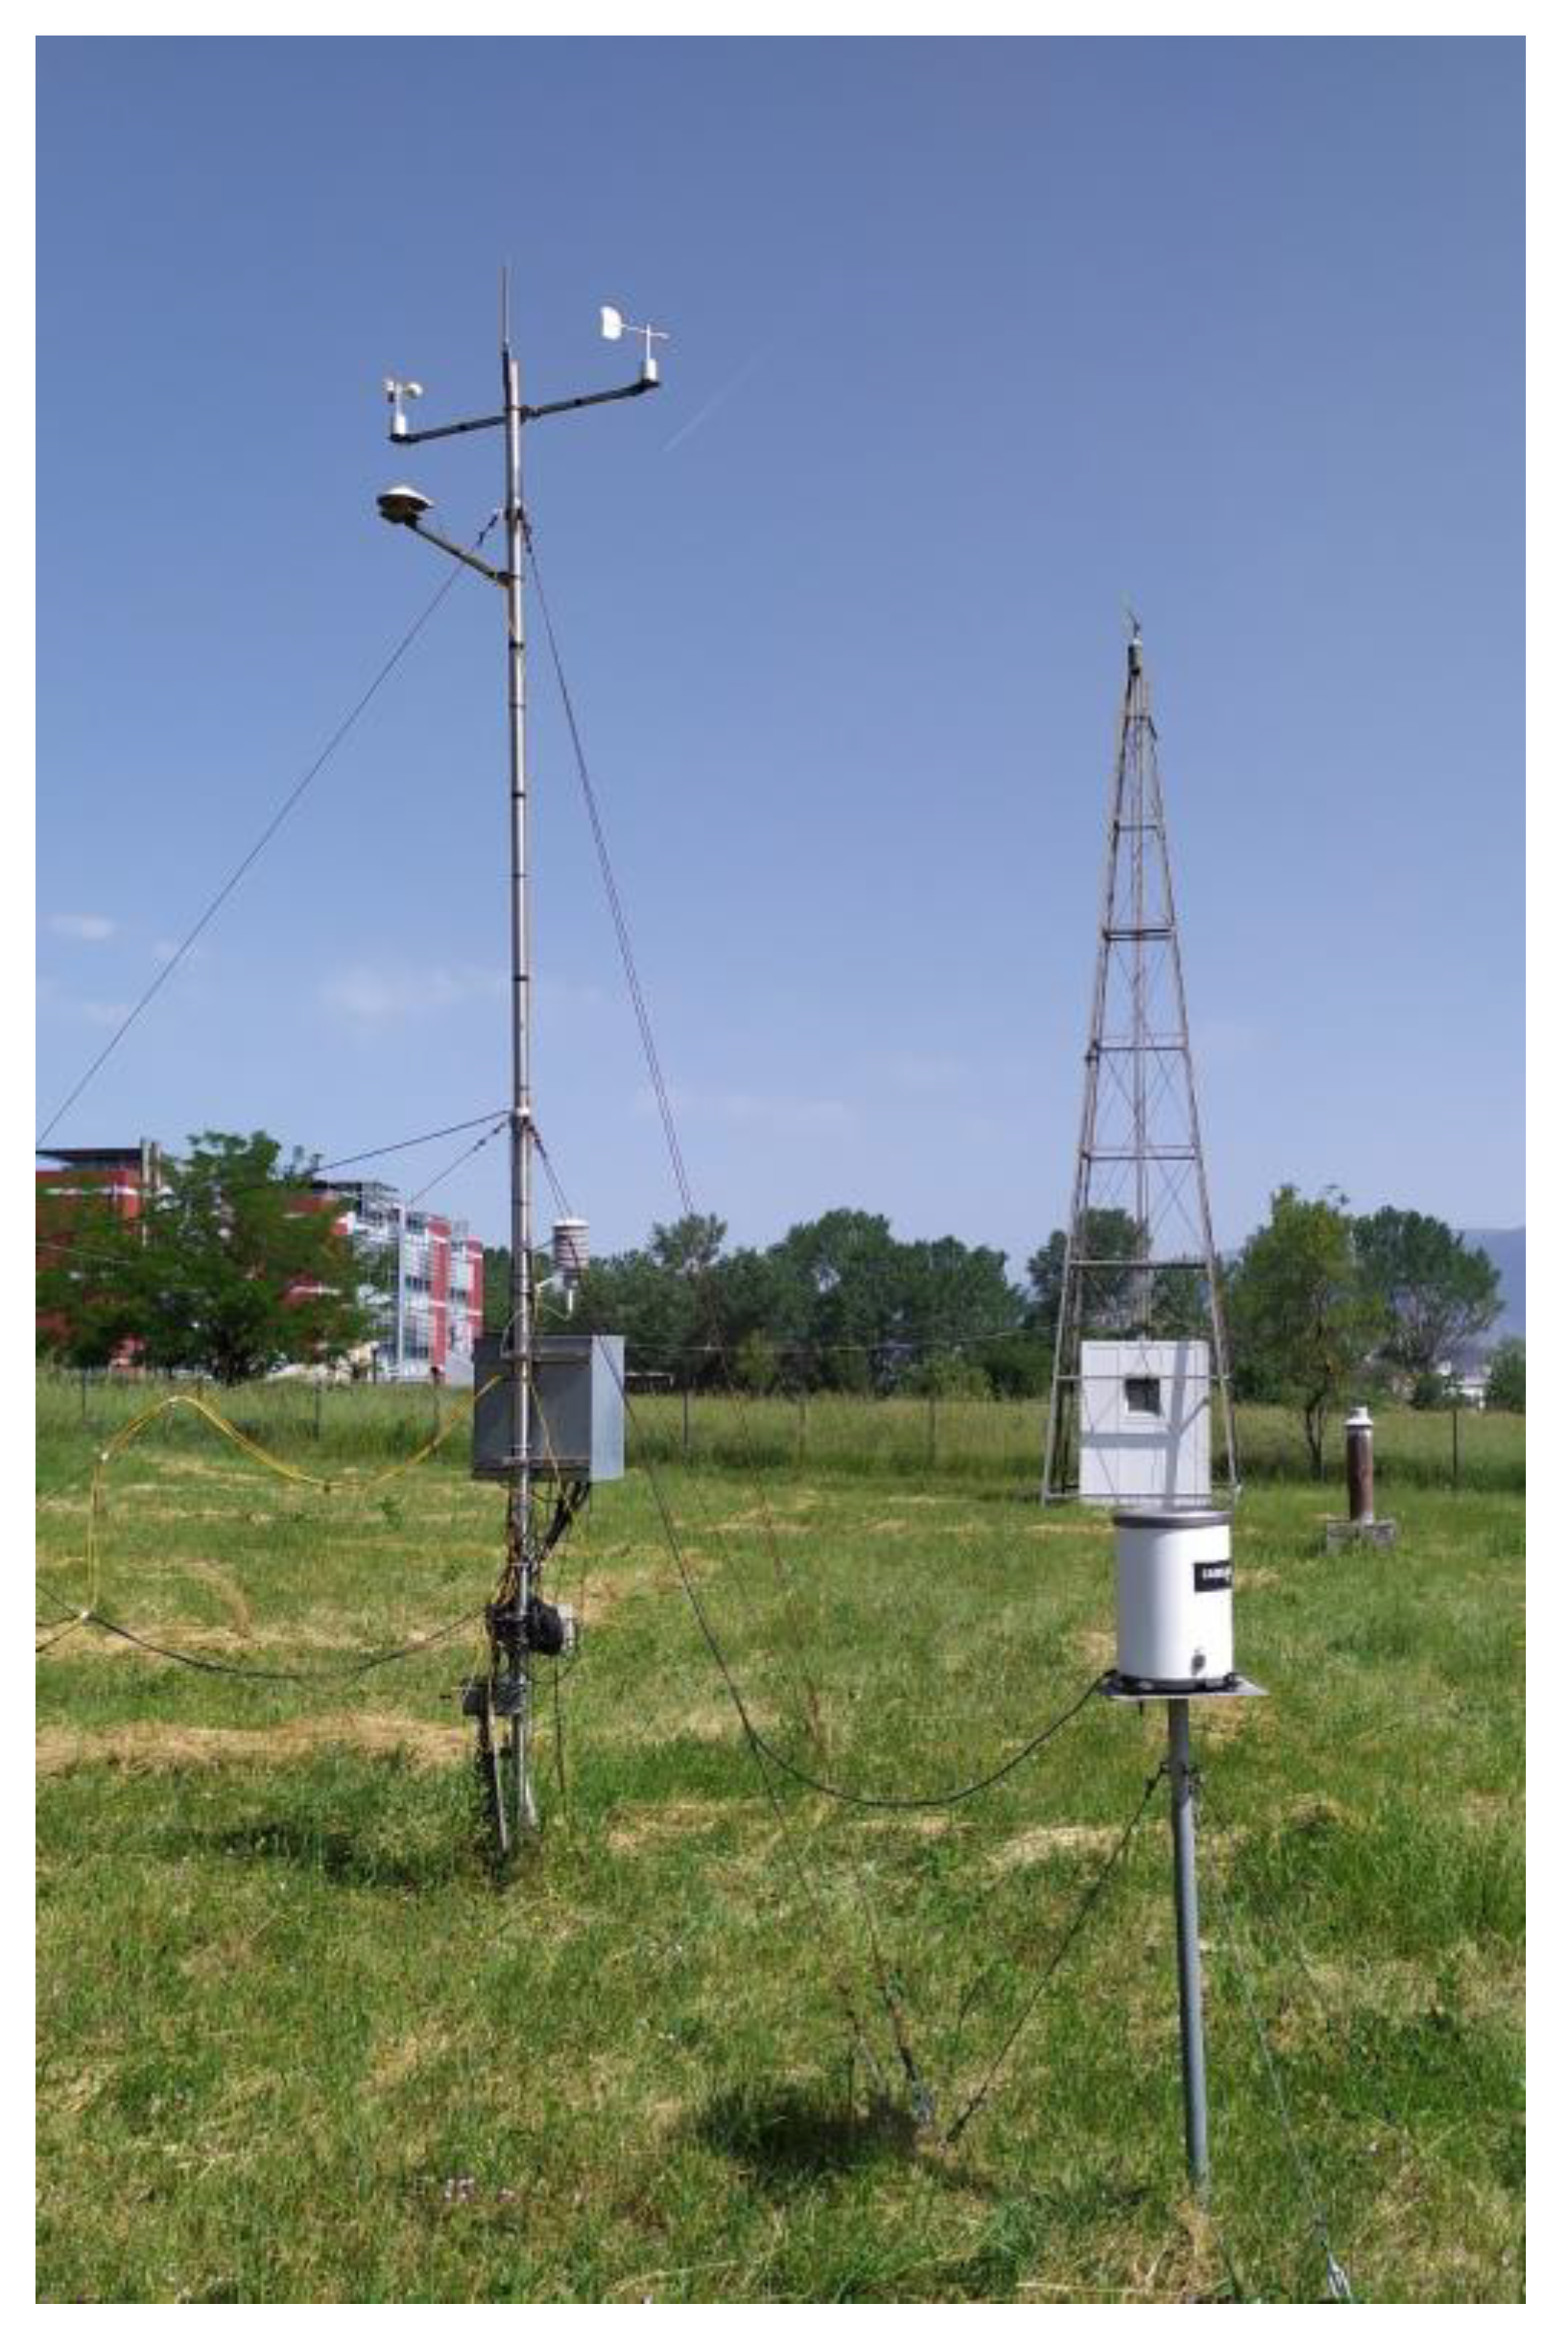
2.1. Measurement Site

It is known that meteorological parameters such as precipitation and humidity show strong spatial variability, mainly during extreme events. Therefore, the measurement site was chosen to be as near as possible to the meteorological station of the University of Ioannina. Before the measurement results, we needed the meteorological and signal parameter values over the location that had been selected under specific boundary conditions. The brief measurement workflow, found in Figure 1, describes the processes following the insertion of AMS location and weather parameters until the results. The final measurements and the raw data were accessed online and collected for offline analysis and signal processing. The automatic meteorological station (AMS) of the University of Ioannina is located within the university campus. Figure 2 shows its location on the map. The geographical coordinates of 39°37′11″ N latitude and 20°50′48″ E longitude, as well as the station altitude, are shown in Table 1.
As shown in Figure 2, there are six (6) base transceiver stations (BTSs) in the wider weather station area. The selection criteria of the BTSs were, on the one hand, (a) a distance smaller than 1.5 km from the AMS and, on the other hand, the possibility of placing a cellular terminal (b) in a radius not greater than 250 m from the BTS to ensure the uniformity of the precipitation (c) at the same height as the antenna with LOS between the BTS and terminal (d) at a point protected and accessible by the research team. BTS 6 is located more than 3.5 km from the AMS, outside the village of Marmara, at an altitude of 769 m. BTS 5 is located at 2.5 km and at an altitude of 506 m. These two BTSs were excluded due to the distance and the altitude difference from the AMS.
There were still four station options within a maximum radius of 1.5 km near the AMS. Specifically, BTS 4 and BTS 3 were located approximately 1.5 km away from the reference point. Regarding BTS 4, there was no possibility of placing a cellular terminal that could meet criterion (c), as the antenna of BTS 4 was located on top of a stadium projection tower at a height of more than 15 m. BTS 3 was excluded because it did not meet criterion (d). BTS 2 was the ideal case, as it stood at the shortest possible distance. On the other hand, BTS 2 did not meet criterion (d). During the debugging process, measurements were also acquired near the AMS, but in this case, the terminal was paired either with BTS 3 or BTS 6. Finally, it was possible to place a cellular terminal within the BTS 1 radius while meeting criteria (b) and (c). The cellular terminal (CT), utilized for measuring and logging Received Signal Strength Indication (RSSI) data, was positioned at a fixed distance of 228 m from BTS 1 to which it was paired. BTS 1 is a typical multiband base station transceiver operating at several frequencies (800/900/1800/2100/2600 MHz). BTS 1 parameter details are shown in Table 2 [40]. It is important to note that a clear line of sight (LOS) was maintained between the cellular terminal and the base station. LOS ensured quality measurements as intervening obstacles could significantly impede signal stability through reflections, absorption, shadowing, and other factors. Figure 3 includes a ground-level picture illustrating the area between the cellular terminal and BTS 1.

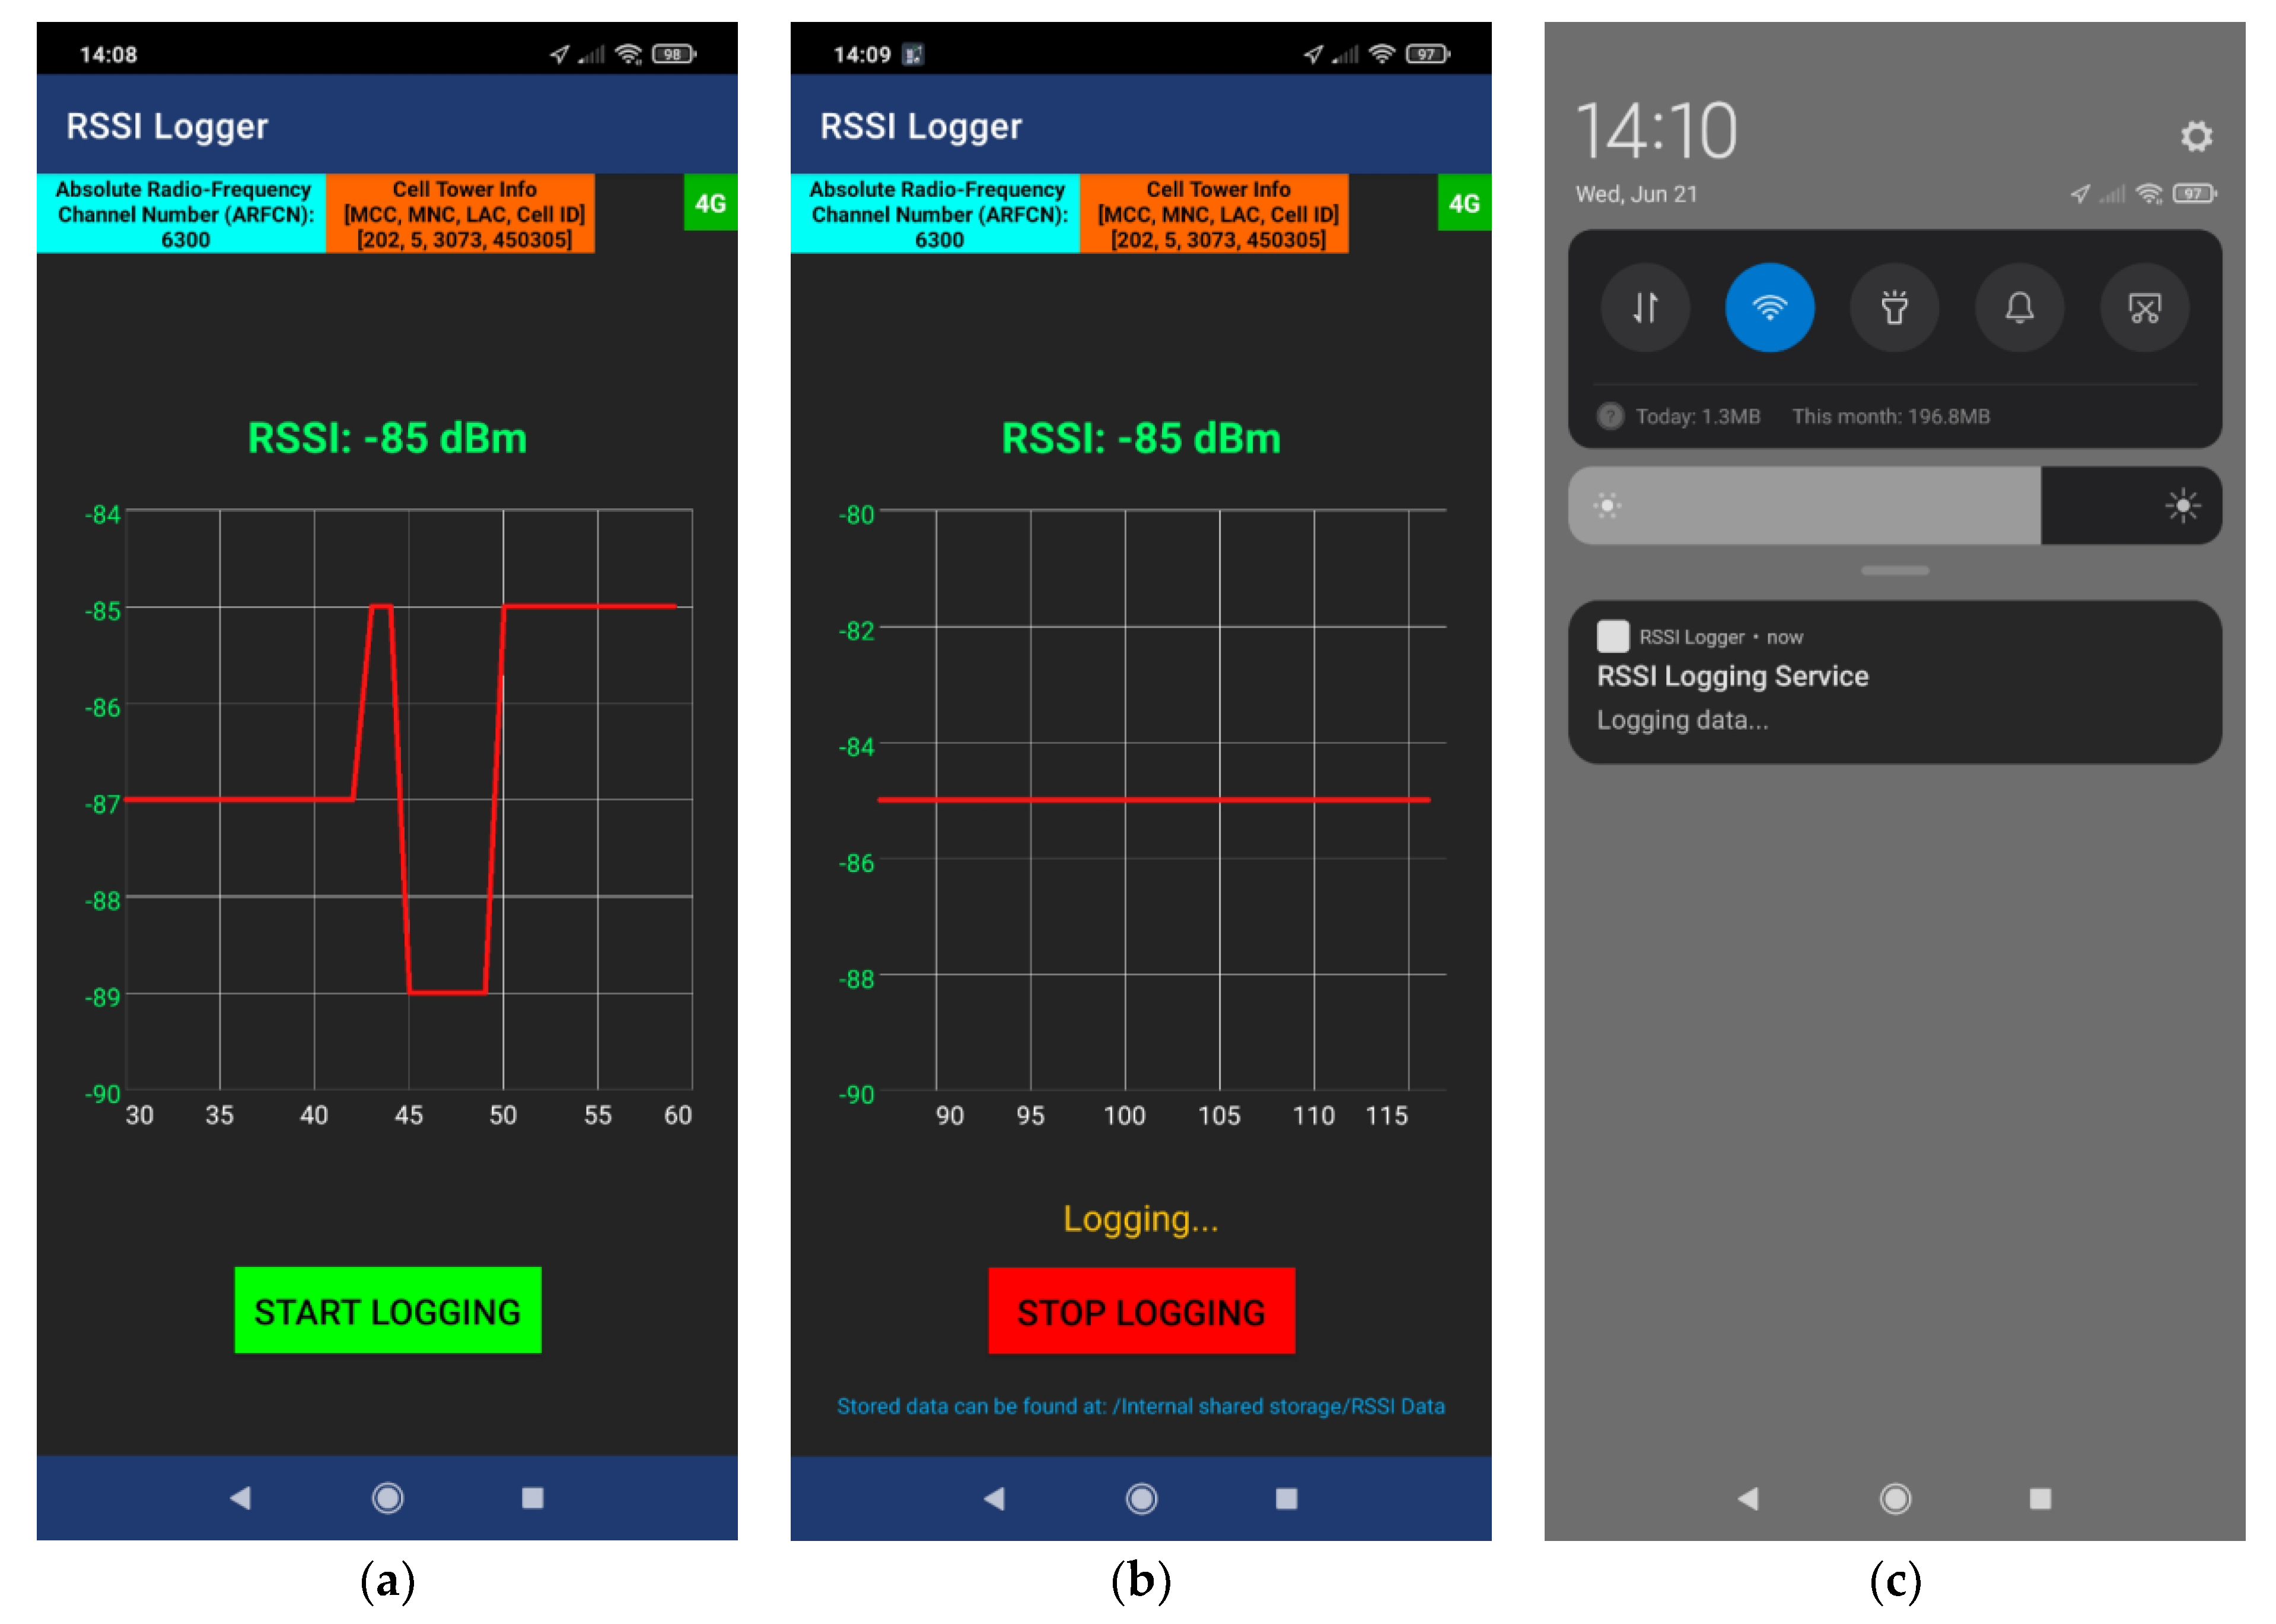
2.2. Cellular Terminal

The cellular terminal at the measurement site is a device running Android 8. While several Android applications offer indications for the received signal strength (RSSI), the challenge lies in finding one that provides sufficient RSSI logging capabilities and the required information to identify the cell tower and the frequency used for communication with the cellular terminal. The frequency variation depends on the cell tower that the device pairs with. Therefore, a specialized Android application was developed to meet the requirements of this study. The application logged RSSI data within text files at 10 s intervals. Due to restrictions imposed by Android 8 and later versions on applications running continuously in the background, the logging functionality of the application was implemented as a foreground service. This approach minimized the likelihood of termination by the Android system, enabling the application to remain active and log data for extended periods. When the service was active, a notification appeared in the Android device’s notification bar, alerting the user. The application is depicted in Figure 4.
As illustrated in Figure 4, the application displayed the latest RSSI value on the screen, concurrently plotting the 30 most recent values. At the top left of the screen, the Absolute Radio Frequency Channel Number (ARFCN) is shown, which was necessary for determining the downlink carrier frequency used for reception by the cellular terminal. Adjacent to this, four numbers are displayed, which were required to identify the cellular tower that was linked to the device, by searching local databases. These numbers are, namely, the Mobile Country Code (MCC), the Mobile Network Code (MNC), the Location Area Code (LAC), and the Cell Identity (Cell ID). The MCC is a three-digit code uniquely identifying a country in the International Mobile Subscriber Identity (IMSI). It is used to assign a specific country to a mobile network. The MNC is a two- or three-digit code that, when combined with the MCC, uniquely identifies a mobile network operating in a specific country. It helps distinguish between different mobile carriers within a country. The LAC is used to identify a location area within a mobile network. Location areas are groupings of cells, and the LAC helps in managing and organizing the tracking of mobile devices as they move between different areas. Lastly, the Cell ID is a unique number identifying a specific cell (transmitter/receiver) within a mobile network. Each cell in a network has a unique Cell ID, allowing the network to pinpoint the location of a mobile device based on the cell it is connected to. On the top right of the application, the network type is also displayed.
Pressing the “START LOGGING” button at the bottom of the screen initiates the RSSI logging service. All the information displayed on the screen was updated every 10 s, and it was then logged into text files, accompanied by a timestamp (Table 3). Each day, a new file was created and named according to the date. This type of file stored in the device’s internal storage had a visible path at the bottom of the screen when the logging service was active. The precision of the RSSI measurements was device-dependent. In this study, the cellular terminal exhibited 1 dB precision. Table 2 shows the contents of a text file where some example raw data are stored, from 22 May 2023.
In the context of a 4G/LTE network, the frequency channel number is denoted as E-UTRA Absolute Radio Frequency Channel Number (EARFCN). It can be employed to determine the downlink carrier frequency utilized by a cellular terminal for receiving data from a cellular tower, as specified in 3GPP TS 36.101, Chapter 5.7.3 [41], through the following equation:
FDL = FDL_low + 0.1(NDL − NOffs-DL),
where FDL represents the downlink carrier frequency in MHz, and NDL is the downlink EARFCN. Additionally, FDL_low and NOffs-DL correspond, respectively, to the lowest frequency and EARFCN values within the E-UTRA operating band determined by NDL. Both FDL_low and NOffs-DL are obtained from the technical specification 3GPP TS 36.101 [41].
In this study, at the location of the measurement site where the cellular terminal was placed, the EARFCN consistently had a value of 2850, corresponding to a downlink carrier frequency of 2630 MHz.

2.3. Meteorological Parameters

The meteorological measurements used in the present work were recorded via the automatic meteorological station of the University of Ioannina. Specifically, a piezoelectric barometer (±1 hPa) which recorded atmospheric pressure (P), air temperature (T), relative humidity (RH), and precipitation height (PH) values, an air temperature (±0.1 °C)–relative humidity (±0.1%) sensor, and a tipping bucket rain gauge (±0.2 mm) were used. All meteorological sensors were properly installed and maintained in order to provide reliable measurements, representative of the greater region of the University of Ioannina. The temporal resolution of the measurements was 30 min for atmospheric pressure, 15 min for air temperature and relative humidity, and 5 min for precipitation height. The above temporal resolution values were in agreement with the variability in the corresponding parameters. Precipitation is a parameter presenting high frequency variations, and therefore the temporal resolution of the corresponding measurements was the highest. On the contrary, atmospheric pressure is not characterized by high frequency variations, and a temporal resolution higher than 30 min would not have added significant information. From the above parameters, saturation water vapor pressure (es), water vapor pressure (e), absolute humidity (AH), and radio refractivity of the air (N) are calculated.
Specifically, the Clausius–Clapeyron equation is used for the calculation of es:
de s e s = LM v R dT T 2   ,
where the constants L, Mv, and R are the latent heat, the molecular weight of water, and the gas constant, respectively. The Clausius–Clapeyron Equation (2) expresses the dependence of saturation water vapor pressure on air temperature. It is shown that es increases as T increases, but this dependence is not linear. The physical meaning of the equation is that saturation, in a warmer atmosphere, can be achieved for higher pressure (and therefore higher concentration) of water vapor.
Then, the definition equation of relative humidity is used for the calculation of water vapor pressure (e):
e = RHe s   .
Absolute humidity (AH) is calculated using the equation of state of ideal gas for water vapor:
AH = eM v RT
Radio refractivity (N) is calculated using the following empirical formula [42]:
N = 77.7 T ( P + 4810 e T ) ,
where T, P, and e are in K, hPa, and hPa, respectively. As far as precipitation, for each 5 min interval, the corresponding precipitation rates (PRs) (mm/h) were calculated, and these values were then used for the comparison between precipitation and signal power. A picture of the meteorological station is included in Figure 5.

3. Results

3.1. Precipitation Rate Classification through Signal Power

The initial focus of this study was to assess the impact of precipitation on the signal power (RSSI) recorded by the cellular terminal. A moving average was calculated within a 5 min time window and applied to the RSSI data, which had a sampling rate of 10 s intervals. The outcomes were subsequently compared to the precipitation rate (expressed in mm/h) observed between May and November 2023. Illustrative instances of precipitation events and their corresponding impact on the RSSI are presented in Figure 6. The precipitation rate axis is inverted (with 0 mm/h being at the top) to enhance visualization while juxtaposing with the RSSI measurements.
The graphical representations in Figure 6 demonstrate that precipitation induces a decline in signal power. Particularly noteworthy is the observation in Figure 6c, where the precipitation also includes hail, resulting in a substantial signal power attenuation. Furthermore, it is observed that the signal power did not promptly revert to pre-precipitation levels following the cessation of precipitation. This could be attributed to the concurrent increase in humidity induced by precipitation events, which tended to persist over extended durations.
While the illustrations in Figure 6 revealed a distinct power loss during precipitation events, the 1 dB precision in RSSI measurements of the utilized cellular terminal did not permit the precise specification of the precipitation rate based on the RSSI level. Therefore, a classification approach was explored. The precipitation rate was categorized into the following five classes:
  • No Rain, 0 mm/h;
  • Light Rain, 0 to 3 mm/h;
  • Moderate Rain, 3 to 15 mm/h;
  • Heavy Rain, 15 to 30 mm/h;
  • Very Heavy Rain, higher than 30 mm/h.
The signal loss (due to precipitation) was calculated by subtracting the RSSI values during precipitation events from the average RSSI (observed over a 6 h period) preceding the onset. Subsequently, a comprehensive dataset, comprising approximately 40,000 data points that included power loss measurements and their associated precipitation rates, was employed to train and test the prediction accuracy of a classification tree model. A subset of 10% of the full dataset was reserved for testing the model. The model was trained using the MATLAB Classification Learner app, which is a specialized tool designed for training classification models.
A classification tree starts with a root node, symbolizing the entirety of the input dataset. The root node was the first decision node that led to subsequent internal decision nodes. At each of these nodes, a specific feature was evaluated, such as power loss in the context of this study, and data were split based on a split criterion. This repeating process created branches and leaf nodes, while the latter represented the final predicted classes. The tree was built by optimizing features and decision thresholds to minimize impurity. During classification, new data traversed the tree from the root to a leaf node, and the predicted class was based on the majority class in that leaf node. A generic diagram of a classification tree is illustrated in Figure 7.
The classification tree trained in this study was a binary tree, where each decision node always had a single parent node and two child nodes. Furthermore, the tree integrated the Gini’s diversity index as the split criterion. The Gini index in a classification problem is expressed as follows:
g ( t ) = 1 i p 2 ( i | t ) ,
where t represents the node to which the split criterion is applied, i signifies the total number of classes in the dataset, and p ( i | t ) denotes the probability of class i in node t . The Gini index serves as a metric for quantifying impurity within a decision tree, yielding values between 0 and 1. A Gini index value of 0 designates a pure node, indicating a node exclusively comprising instances from a single class. Each power loss value at a given node is a potential splitting candidate. For every candidate, two child nodes, a left and a right one, are created. Subsequently, the impurity reduction, Δ I , is computed using the following formula:
Δ Ι = g ( t ) ( N L N g ( t L ) + N R N g ( t R ) ) ,
where t L represents the left and t R the right child node, N L and N R are the numbers of observations in the left and right nodes, respectively, and N is the number of observations in the parent node, t . Eventually, the applied split is the one that maximizes the impurity reduction [43,44,45]. Individual nodes cease further splitting in the case of a proposed split leading to a child node with fewer than 10 observations or resulting in a leaf node containing no observations at all. The model’s ability to accurately predict the class within which the actual precipitation rate falls, based on power loss, is visually represented in the confusion matrix of Figure 8.
It should be noted before continuing to the analysis that the term “rate” in a con-fusion matrix refers to measurement factors. There are four kinds of factors, declared as TPR (true positive rate), FPR (false positive rate), TNR (true negative rate), and FNR (false negative rate). Generally, the best performance is linked to high values of the TPR and TNR, while the FNR and FPR should be as low as possible.
According to the confusion matrix in Figure 8, the trained model exhibited an overall accuracy of 88.4%. The matrix illustrates the model’s excellent performance in predicting the absence of precipitation, that is, in events categorized under the “No Rain” class, where the true positive rate (TPR) is 99.8%. For the other classes, namely, “Light Rain”, “Moderate Rain”, “Heavy Rain”, and “Very Heavy Rain”, the model achieved correct predictions at rates of 88.6%, 82.4%, 81.3%, and 90%, respectively.
The highest observed false negative rate (FNR) was 18.7%, related to the “Heavy Rain” class. Within this misclassification, 7.1% of instances involved the model erroneously predicting “Light Rain”, another 7.1% corresponded to the model incorrectly predicting “Moderate Rain”, and the remaining 4.4% were related to the model falsely predicting “Very Heavy Rain”. In all three cases, the true class (that the model should have predicted) was “Heavy Rain”. For the rest of the classes, “No Rain”, “Light Rain”, “Moderate Rain”, and “Very Heavy Rain”, the false negative rates were equal to 0.2%, 11.4%, 17.6%, and 10%, respectively.
These findings indicated that although predicting the exact precipitation rate based on power loss measurements was a challenging endeavor, these measurements could be effectively utilized for classifying precipitation rates with sufficient accuracy.
For the purposes of convenience and thus serving as a quick methodology, a brief summary of the whole procedure presented in this section follows:
  • Measurements were acquired between May and November 2023 (almost seven months).
  • Application of a 5 min moving average to the RSSI data.
  • The precipitation level was categorized.
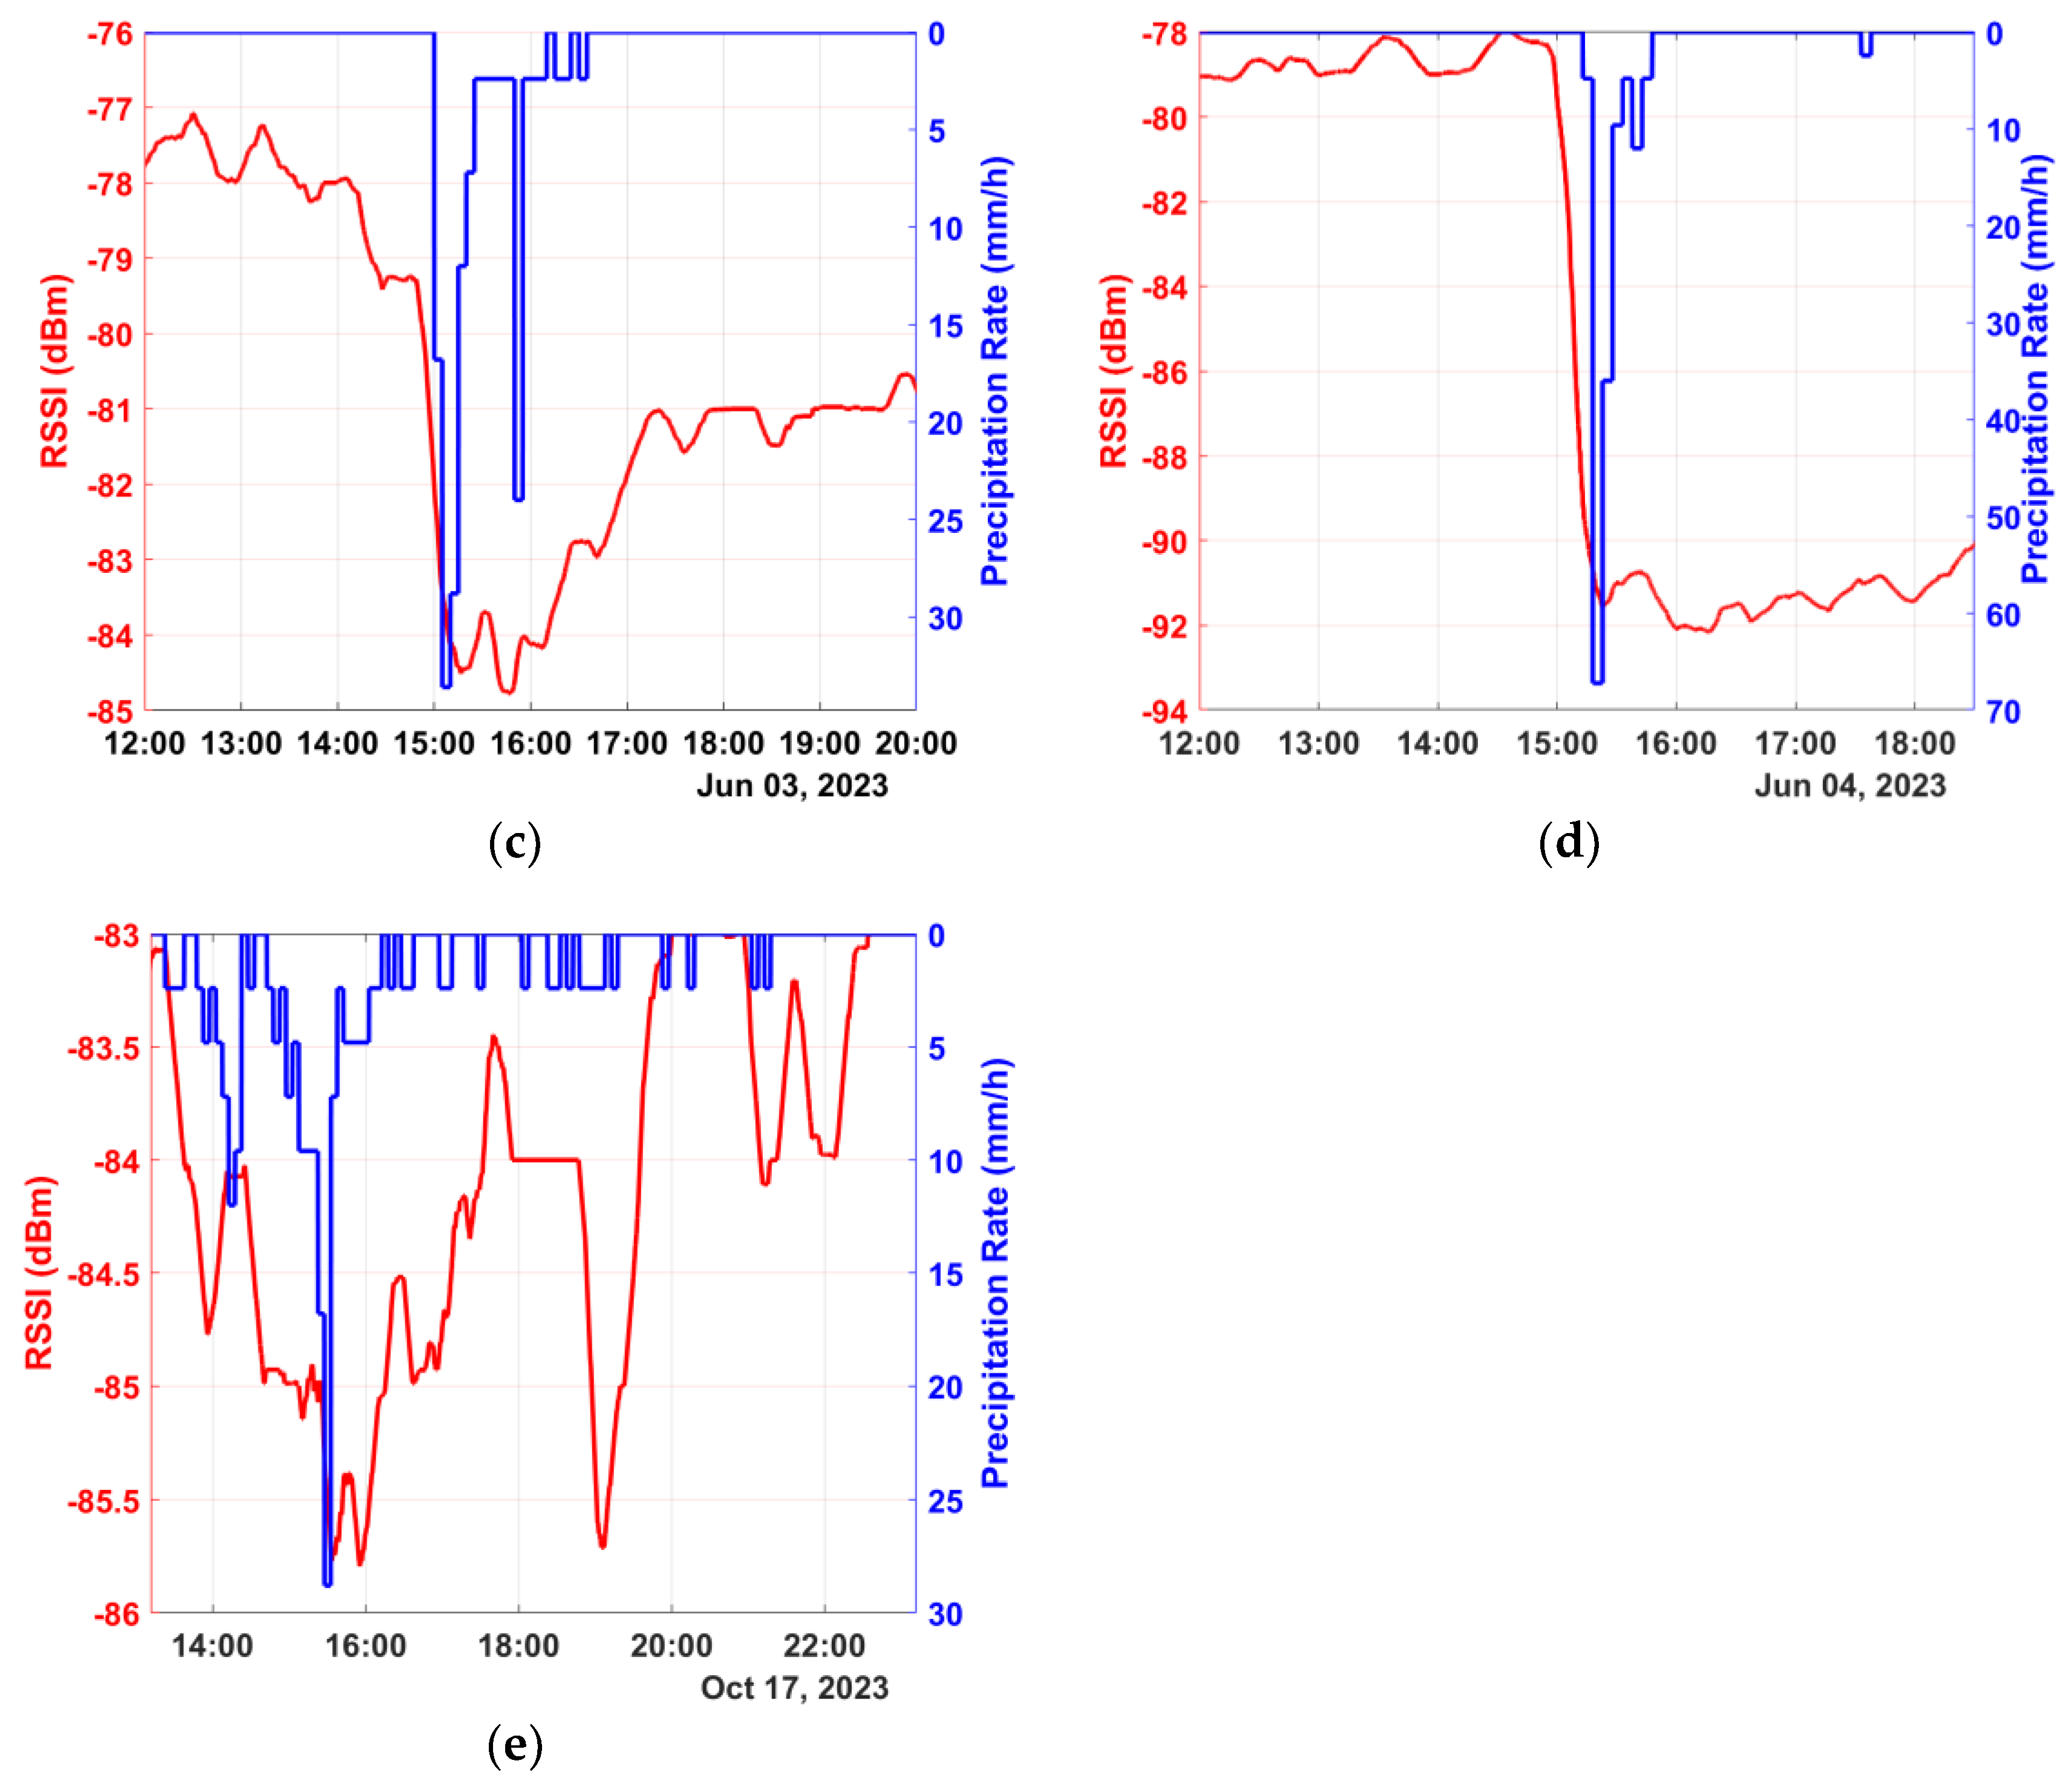
  • The results of precipitation events showed that precipitation led to a decline in signal power (attenuation).
  • After precipitation, the signal’s power levels did not revert to the previous state, alluding probably to increased humidity.
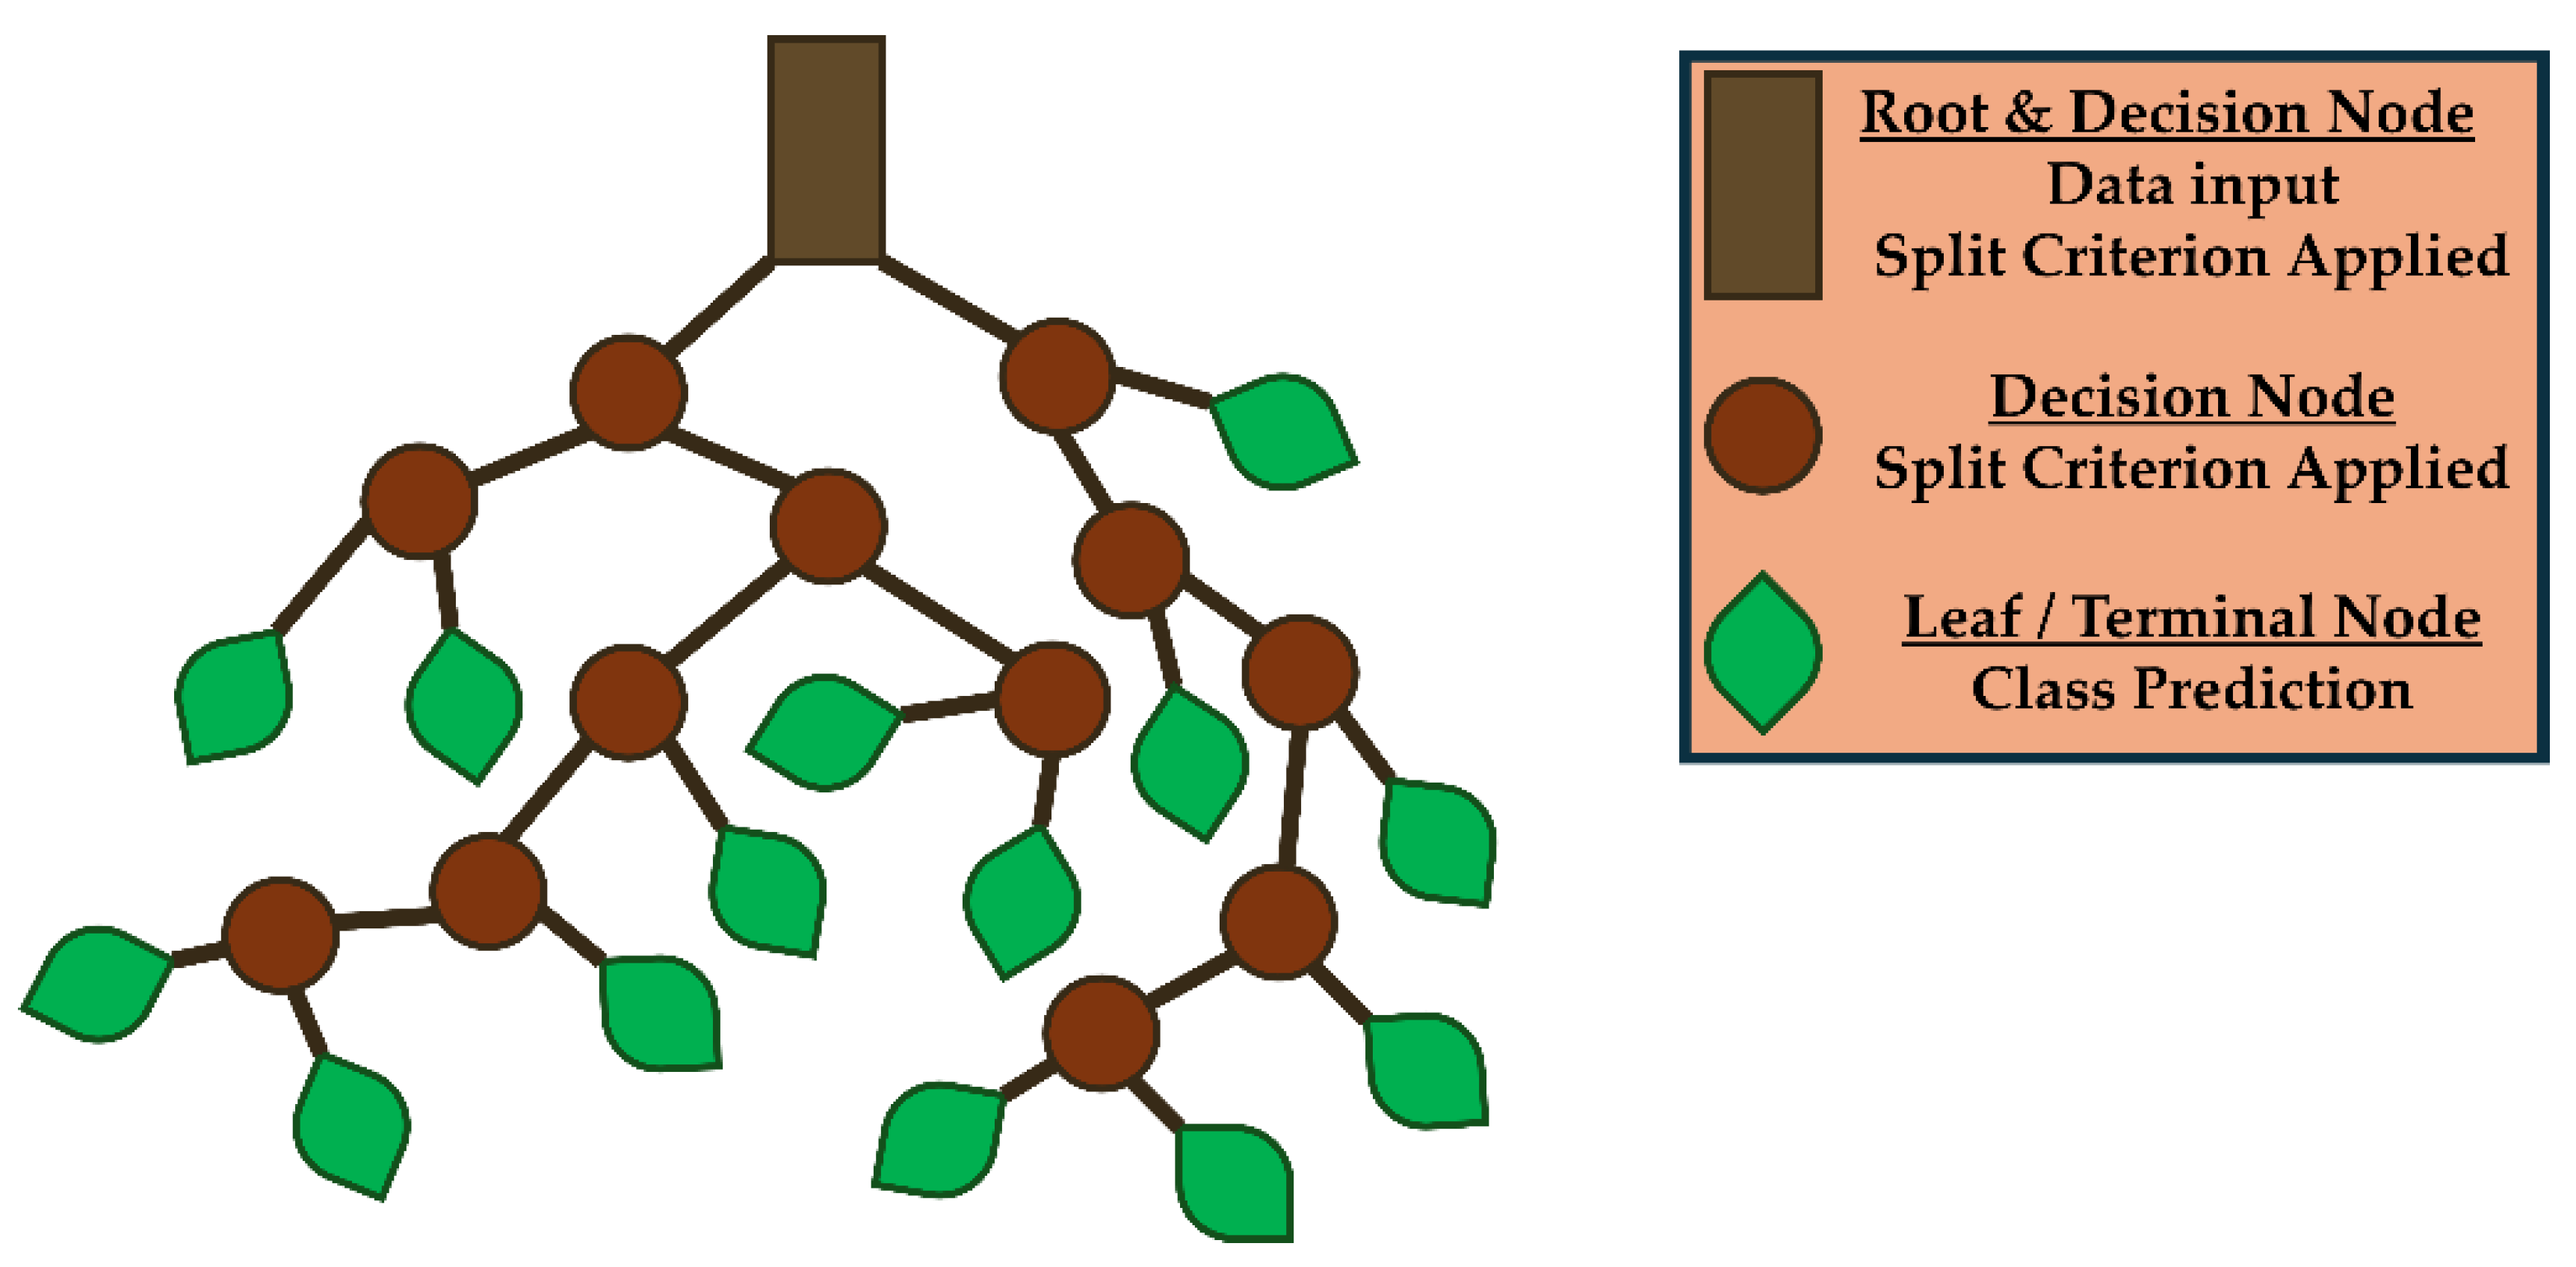
  • Statistical approaches included a trained binary decision tree model with an overall accuracy of over 88%.
The aforementioned decision tree model yielded the highest overall accuracy when compared to four other commonly used classification models, namely, Support Vector Machine (SVM) [46], K-Nearest Neighbors (KNN) [47], Adaptive Boosting (AdaBoost) with decision trees as base learners [48], and Feedforward Neural Network (FNN) [49]. The SVM model employed a Gaussian kernel with a scale parameter of 0.25 to construct a hyperplane for class separation. The KNN determined the class of data points based on the majority class among their nearest neighbors, with Euclidean distance used as the distance metric. AdaBoost with decision trees adjusted the weights of misclassified data points over 30 boosting iterations with a learning rate of 0.1. The FNN consisted of a single hidden layer with 25 neurons using the Rectified Linear Unit (ReLU) activation function for classification. The overall accuracy of these models was 88.4% for the decision tree model, 81.4% for the SVM, 80.6% for the KNN, 85.5% for AdaBoost, and 76.4% for the FNN. A comparison between all five models is shown in Table 4, which includes the TPR values for each model and class, as well as the overall accuracy in each case.

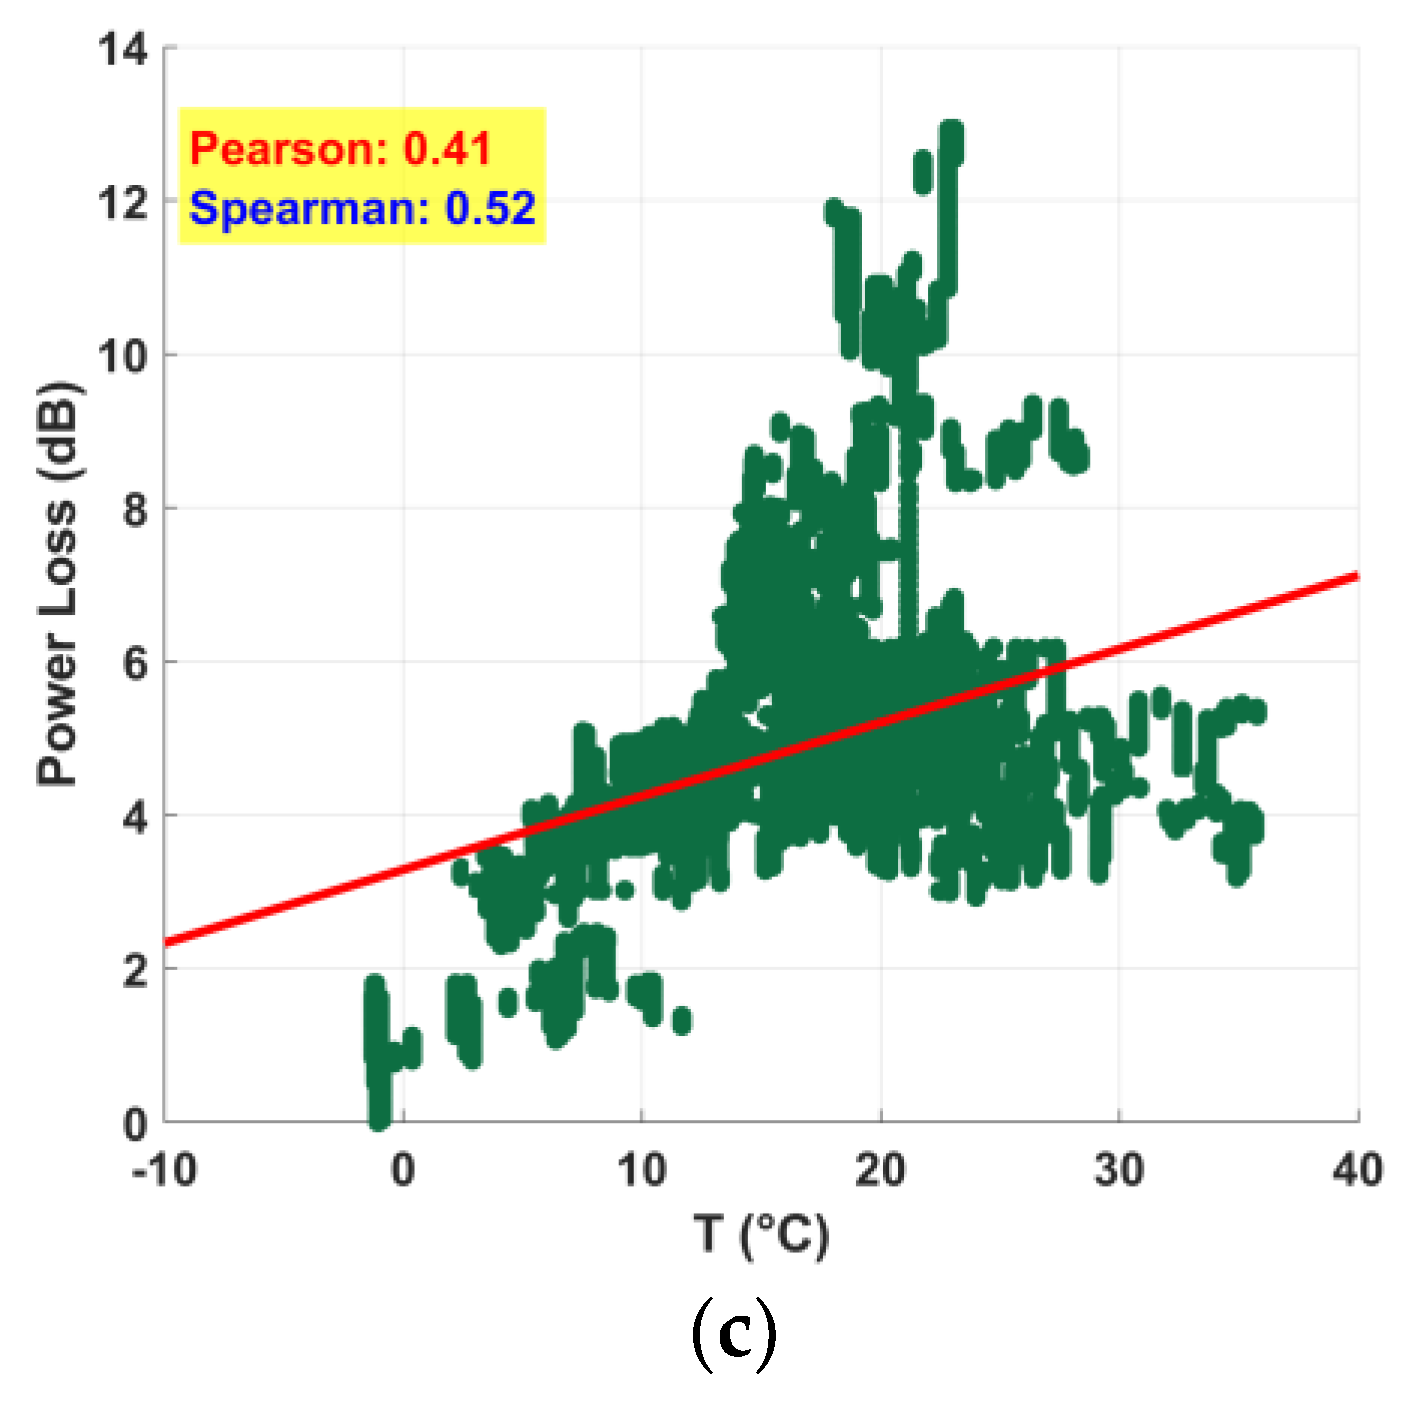
3.2. Impact of Atmospheric Humidity and Other Meteorological Parameters on the Signal

The second focus of this study was to assess the influence of atmospheric humidity, alongside other meteorological parameters, on signal power. Once again, we applied a 5 min moving average to the RSSI data. The correlation between the power loss, computed from approximately 220,000 RSSI measurements, and various meteorological parameters obtained from the meteorological station (at the University of Ioannina) was examined. These parameters contained the temperature (T), relative humidity (RH), absolute humidity (AH), atmospheric pressure (P), and radio refractivity of the air (N). Figure 9 depicts plots for each of the studied parameters against all other parameters, organized in the format of a correlation matrix. In each plot, the Pearson correlation coefficient is highlighted in red, while the Spearman’s rank correlation coefficient is presented in blue.
In Figure 9, there is a noticeable correlation between power loss and absolute humidity (AH). It is apparent that an increase in absolute humidity resulted in a power loss increase. The Pearson correlation coefficient stood at 0.82, with the Spearman’s rank correlation coefficient showing a slightly stronger association at 0.86, indicating a monotonic relationship between signal power and absolute humidity. Another substantial correlation was observed between power loss and the radio refractivity of the air (N). Once again, signal power loss increased with an increase in the radio refractivity of the air. In this instance, both the Pearson’s and Spearman’s rank correlations coefficient stood at 0.77. Lastly, a Spearman’s rank correlation coefficient of 0.52 implied that a potential correlation between power loss and temperature (T) could not be ruled out. When compared to the remaining meteorological parameters, power loss showed no other significant apparent dependence. In Figure 10, the plots depicting the correlation between power loss and the AH, N, and T are displayed separately.
A brief presentation of the procedure and results is shown below for the understanding of the impact of atmospheric humidity and other meteorological parameters on the signal:
  • Application of a 5 min moving average to the RSSI data.
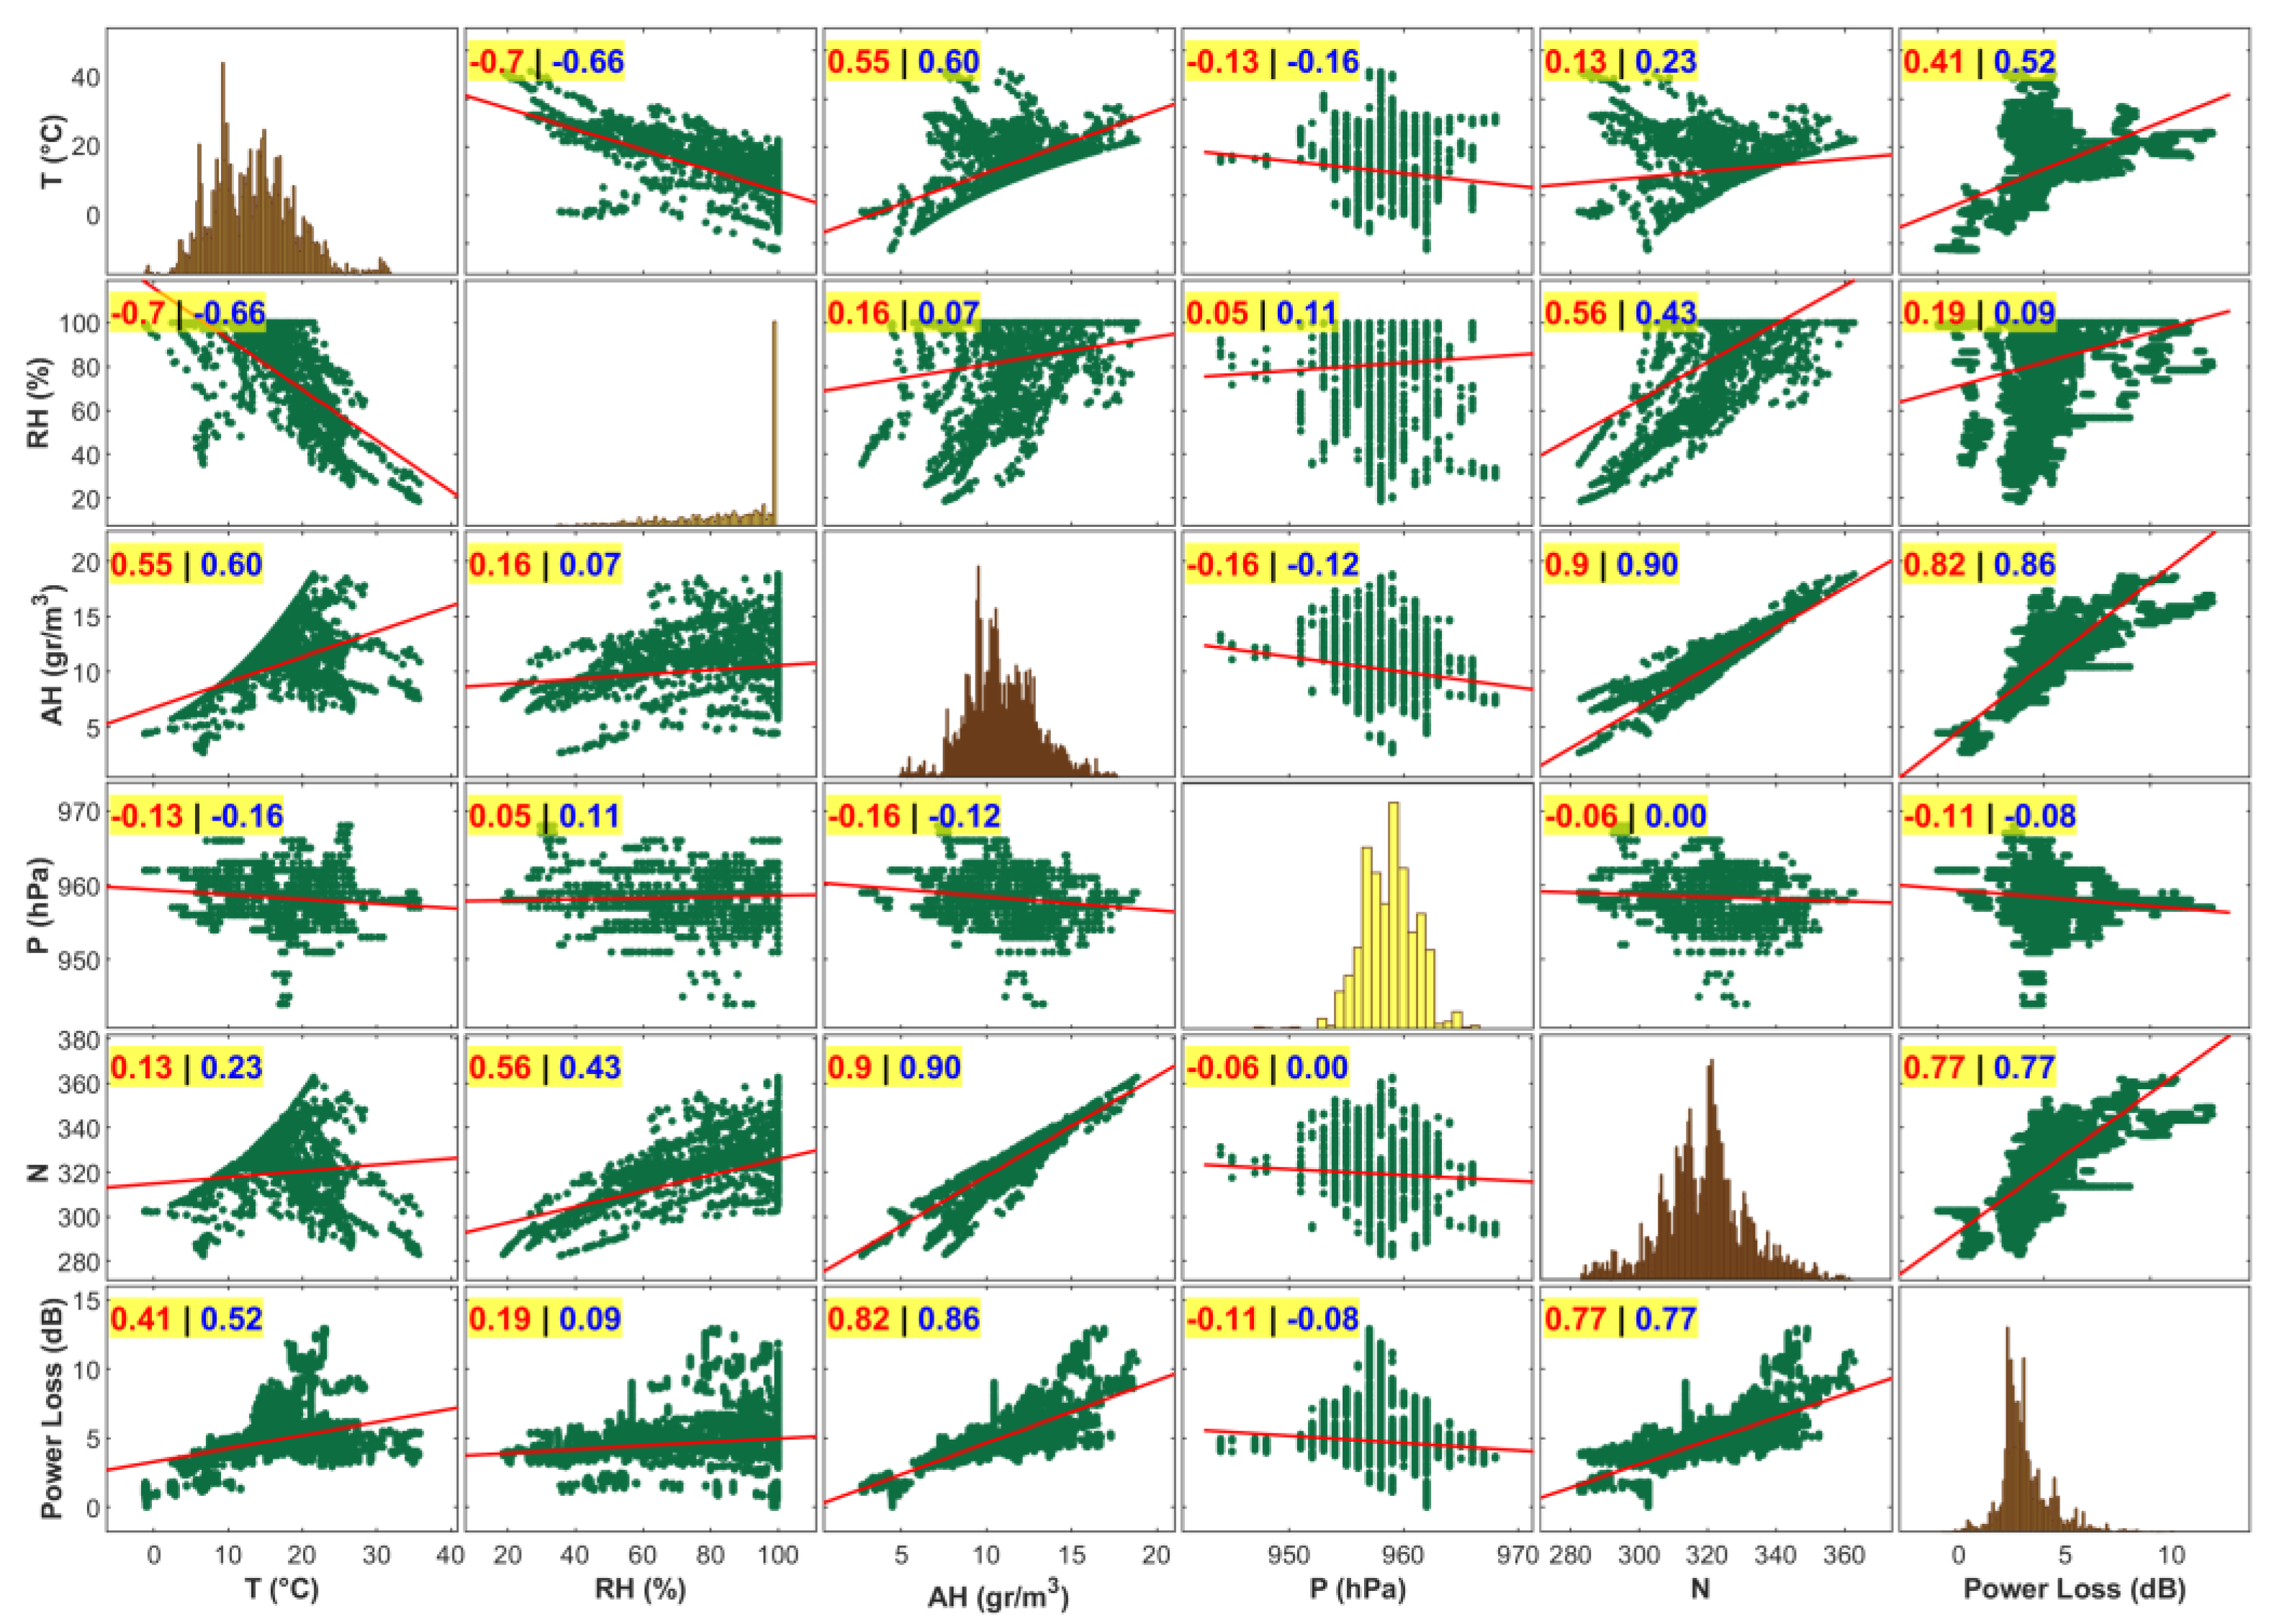
  • Examination of the temperature (T), relative humidity (RH), absolute humidity (AH), atmospheric pressure (P), and radio refractivity of the air (N).
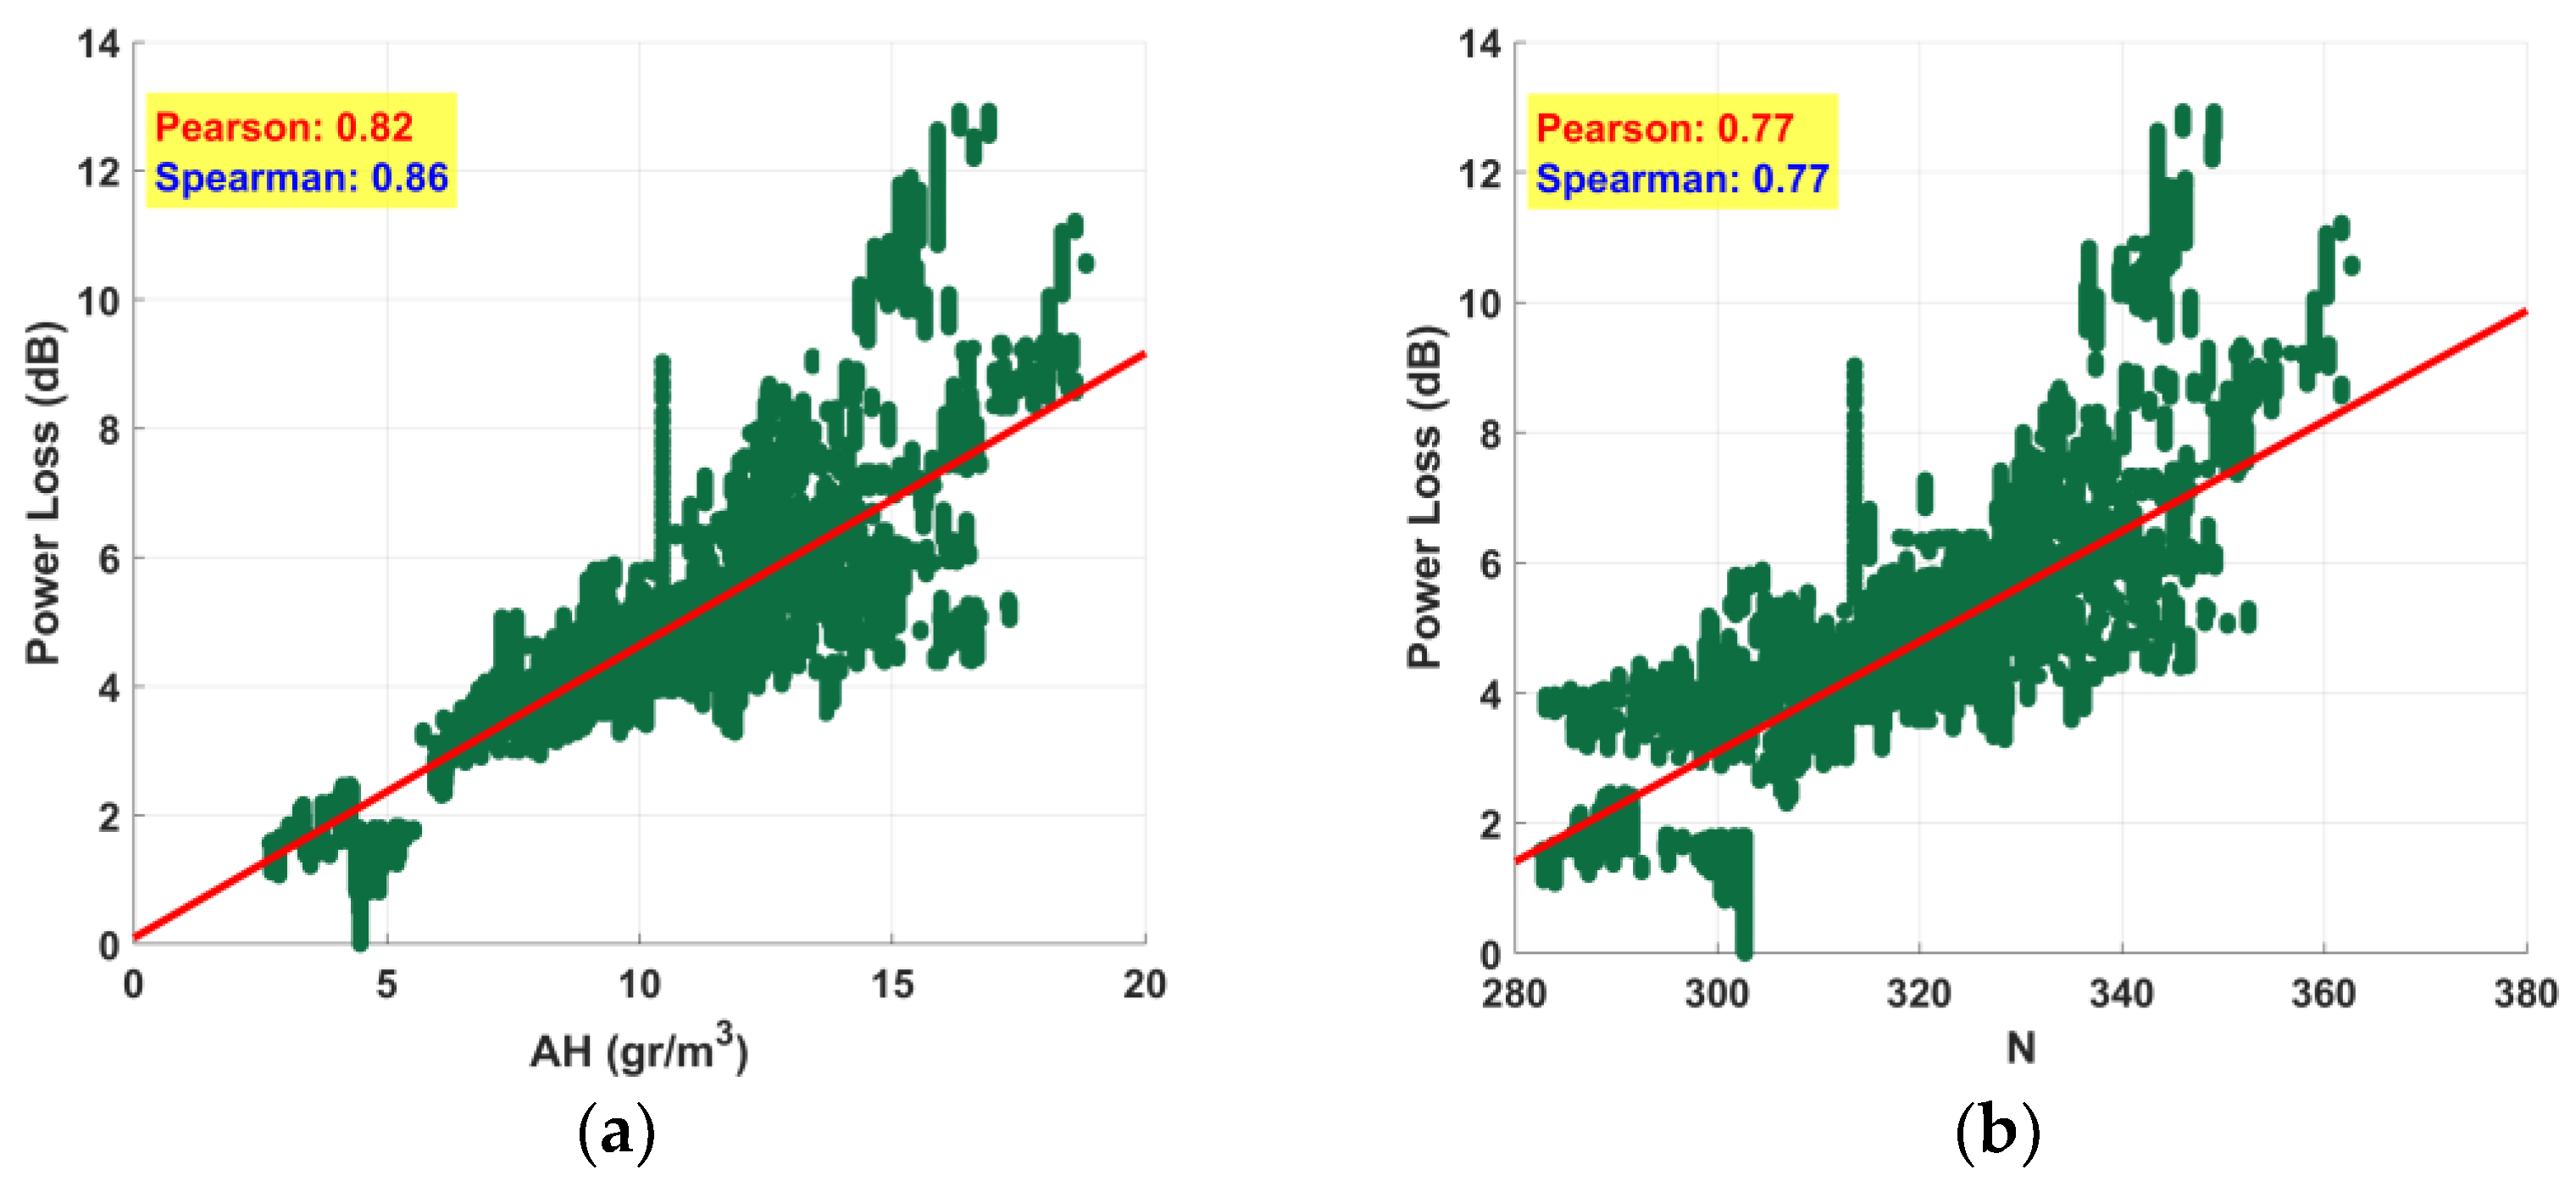
  • Apparent correlation between power loss and absolute humidity (AH).
  • The signal power levels decreased with an increase in the radio refractivity of the air.

4. Discussion

The presented measurement setup utilized an affordable cellular terminal, costing a few tens of euros. To cater to the specific requirements of our study, a specialized application was developed. This application, equipped with RSSI logging functionality operating as a foreground service, was seamlessly integrated into the cellular terminal. The collected data, stored internally, were accessed remotely to ensure no interference with the measurements. The frequency under consideration was 4G/LTE at 2630 MHz. Our investigation confirmed the efficacy of utilizing measurements from the cellular terminal for precipitation classification. Moreover, the experimental findings unveiled a noteworthy correlation between signal power measurements and both the absolute humidity and radio refractivity of the air. Additionally, preliminary observations hinted at a potential correlation with temperature. To fortify and ensure the reliability of the presented findings, it is imperative to gather additional data and explore enhanced methodologies and algorithms. This will contribute to extracting stronger and even more secure conclusions.

4.1. Comparative Study

There is a scarcity of data concerning signal attenuation in comparison to rain and other meteorological parameters for frequencies below 5 GHz. The majority of the few existing studies on meteorological parameters, excluding precipitation, tend to focus on the LoRa frequency of 864 MHz. This study contributes experimental data within the 4G/LTE frequency range of 2630 MHz. Table 5 juxtaposes this work with similar ones, those examining frequencies below 5 GHz for rain estimation through measuring the signal power of cellular terminals and those exploring other meteorological parameters in relation to signal power measured across various setups.
As previously noted, there is a limited amount of research on the estimation of the precipitation rate based on power loss for frequencies under 5 GHz. Three studies, which are included in Table 5, have employed a similar approach to this study, utilizing RSSI measurements from cellular terminals. The study presented in [29] was focused on distance estimations based on RSSI measurements from mobile terminals, at the 1.8 GHz GSM band. The accuracy of the estimations was evaluated under various precipitation conditions, specifically heavy rain, extremely heavy rain, torrential rain, and extremely torrential rain, in accordance with the standards established by the Central Weather Bureau, Taiwan. In [30], RSSI measurements for a 4G/LTE signal were conducted using a mobile terminal. A probabilistic neural network was trained to classify precipitation rates into four categories: no rain, weak rain, moderate rain, and heavy rain. The model exhibited a high overall accuracy of 96.7%. In [31], a 2 GHz link was established employing a cellular terminal, and RSSI measurements were utilized to train a model for classification between dry and rainy periods. The TPR of the predictions for dry periods was greater than 70%, while it was greater than 60% for the rainy periods.
The remaining works in Table 5 focused on the correlation between additional meteorological parameters and RSSI. This area of research has limited related works, especially for frequencies under 5 GHz. In [32], the correlation between several meteorological parameters and signal power measurements, based on outdoor links operating at 2.4 GHz, was explored. The meteorological parameters were temperature, absolute humidity, precipitation, and sunlight. The study concluded that temperature was the most dominant correlation factor. Similarly [33], examined signal power measurements at 2.4 GHz from outdoor sensor networks, identifying a correlation between signal power and absolute humidity, as well as temperature, while relative humidity had a minor impact. Additionally [34], investigated outdoor sensors operating at 2.4 GHz, with the considered parameters being vegetative growth, temperature, relative humidity, and absolute humidity. This study observed a strong correlation between signal power and vegetative growth, temperature, and absolute humidity. The remaining studies in Table 5 focused on the LoRa frequency of 868 MHz. In [35], RSSI measurements were correlated with soil humidity. A Long Short-Term Memory Neural Network was trained to estimate soil humidity based on signal strength, achieving high accuracy. In the research presented in [36], an indoor sensor network operating at 868 MHz was utilized for the exploration of the impact of both temperature and absolute humidity on the RSSI. The study found a strong negative correlation between the RSSI and temperature for receiver–transmitter distances greater than 5 m, and a strong positive correlation was also observed between the RSSI and relative humidity. Lastly, in [37], an outdoor LoRa sensor network was employed for RSSI measurements, and a correlation was evident with temperature and absolute humidity.
The current study aimed to further explore the feasibility of estimating precipitation and other environmental parameters utilizing signal strength measurements from cellular terminals, particularly within the frequency range below 5 GHz, where similar research is limited. Leveraging cellular terminals for this purpose offers significant convenience owing to their widespread availability and accessibility. Notably, to the best of the authors’ knowledge, cellular terminals have not been previously employed for the estimation of meteorological parameters beyond precipitation. Furthermore, the studies that utilize cellular terminals for precipitation estimations are themselves limited.

4.2. Restrictions and Challenges

The principal advantage of backhaul wireless links lies in the pre-existing infrastructure. Nevertheless, leveraging received signal power data from cellular terminals has the potential to surpass the benefits offered by backhaul links. Despite this, a common drawback persists in both approaches, the suboptimal precision, typically ranging from 0.5 to 1 dB. This precision limitation hampers the accuracy of measurements. The application of environmental sensing through signal power data from cellular terminals presents a significant advantage in terms of expansive spatial coverage. However, it is essential to acknowledge the current constraint that the device must be stationary, and the specific base station linked to the device must always be known to generate useful data. This means, in effect, that constant knowledge of the link distance and frequency is essential. Future improvements in cellular terminal technology, particularly in measurement precision, could potentially address these challenges, broadening the applicability of environmental sensing in diverse settings.

5. Conclusions

The accurate estimation of precipitation and weather conditions in general is very important in human life in many fields such as agriculture, water management, ecosystems, climate research, disaster prevention, and health. This study contributes toward the global scientific effort to develop efficient methods that allow the prediction of weather parameters such as rainfall and humidity. The key characteristic of this work is that it utilizes already-established mobile phone infrastructure that provides an effective and low-cost solution, not requiring extra equipment or hardware other than smartphone devices. More specifically, this study investigated the feasibility of estimating the precipitation rate and various meteorological parameters through signal power measurements (RSSI) using a cellular terminal, focusing on the 4G/LTE frequency of 2630 MHz. The experimental data presented in this paper indicated that, although the limited precision in RSSI measurements by cellular terminals prevented exact estimations of the precipitation rate, a viable classification became achievable when precipitation rate classes were defined. This is substantiated by training a classification tree model with preliminary experimental data, demonstrating good accuracy in predicting precipitation rate classes based on signal power loss. Furthermore, concerning other meteorological parameters, a preliminary analysis revealed a notable correlation between signal power loss and the absolute humidity, as well as the radio refractivity of the air. Moreover, a potential correlation with temperature could not be ruled out. The findings in this paper are encouraging, and future work may involve extended measurements in a broader area with multiple terminals and employing various machine learning techniques.

Author Contributions

Conceptualization, A.S., V.C. and C.J.L.; methodology, A.S., V.C. and S.K.C.; investigation, A.S., V.C. and G.T.; validation, A.S., V.C. and S.K.C.; data curation, A.S., C.J.L. and G.T.; software, A.S.; writing—original draft, A.S., V.C., S.K.C. and C.J.L.; writing—review and editing, A.S., V.C., C.J.L., S.K.C. and G.T.; supervision, V.C. All authors have read and agreed to the published version of the manuscript.

Funding

This research received no external funding.

Data Availability Statement

The data that support the findings of this study are available from the corresponding authors, upon reasonable request.

Acknowledgments

The authors would like to thank G. Baldoumas for indicating spots of measurement in the Ioannina basin. Also, they offer a special word of thanks to V. Kosmas and C. Koustousi for granting permission to install measurement setup at their placement.

Conflicts of Interest

The authors declare no conflicts of interest.

Abbreviations

All the abbreviations used throughout the paper have been compiled and listed below:
3GPP3rd Generation Partnership Project
AdaBoostAdaptive Boosting
AMSAutomatic meteorological station
ARFCNAbsolute Radio Frequency Channel Number
BTSBase transceiver station
Cell IDCell Identity
CMLCommercial microwave link
CTCellular terminal
EARFCNE-UTRA Absolute Radio Frequency Channel Number
E-UTRAEvolved Universal Terrestrial Radio Access
FNNFeedforward Neural Network
FNRFalse negative rate
FPRFalse positive rate
GSMGlobal System for Mobile communications
IEEE 802.15.4Institute of Electrical and Electronics Engineers Standard 802.15.4
IMSIInternational Mobile Subscriber Identity
IoTInternet of Things
ISMIndustrial, Scientific, and Medical
KNNK-Nearest Neighbors
LACLocation Area Code
LoRaLong Range
LTELong-Term Evolution
MCCMobile Country Code
MNCMobile Network Code
OWSNOpportunistic wireless sensor network
QPEQuantitative precipitation estimation
RSSIReceived Signal Strength Indicator
SVMSupport Vector Machine
TNRTrue negative rate
TPRTrue positive rate

References

  1. Zheng, S.; Han, C.; Huo, J.; Cai, W.; Zhang, Y.; Li, P.; Zhang, G.; Ji, B.; Zhou, J. Research on Rainfall Monitoring Based on E-Band Millimeter Wave Link in East China. Sensors 2021, 21, 1670. [Google Scholar] [CrossRef]
  2. Zhang, P.; Liu, X.; Pu, K. Precipitation Monitoring Using Commercial Microwave Links: Current Status, Challenges and Prospectives. Remote Sens. 2023, 15, 4821. [Google Scholar] [CrossRef]
  3. Dunkerley, D. Recording Rainfall Intensity: Has an Optimum Method Been Found? Water 2023, 15, 3383. [Google Scholar] [CrossRef]
  4. Alozie, E.; Abdulkarim, A.; Abdullahi, I.; Usman, A.D.; Faruk, N.; Olayinka, I.-F.Y.; Adewole, K.S.; Oloyede, A.A.; Chiroma, H.; Sowande, O.A.; et al. A Review on Rain Signal Attenuation Modeling, Analysis and Validation Techniques: Advances, Challenges and Future Direction. Sustainability 2022, 14, 11744. [Google Scholar] [CrossRef]
  5. Lian, B.; Wei, Z.; Sun, X.; Li, Z.; Zhao, J. A Review on Rainfall Measurement Based on Commercial Microwave Links in Wireless Cellular Networks. Sensors 2022, 22, 4395. [Google Scholar] [CrossRef]
  6. Overeem, A.; Leijnse, H.; Uijlenhoet, R. Measuring Urban Rainfall Using Microwave Links from Commercial Cellular Communication Networks. Water Resour. Res. 2011, 47. [Google Scholar] [CrossRef]
  7. Uijlenhoet, R.; Overeem, A.; Leijnse, H. Opportunistic Remote Sensing of Rainfall Using Microwave Links from Cellular Communication Networks. WIREs Water 2018, 5, e1289. [Google Scholar] [CrossRef]
  8. Overeem, A.; Leijnse, H.; Uijlenhoet, R. Rainfall Monitoring Using Microwave Links from Cellular Communication Networks: The Dutch Experience. In Proceedings of the 2018 IEEE Statistical Signal Processing Workshop, SSP 2018, Freiburg im Breisgau, Germany, 10–13 June 2018; Institute of Electrical and Electronics Engineers Inc.: Piscataway, NJ, USA, 2018; pp. 110–114. [Google Scholar]
  9. Overeem, A.; Leijnse, H.; Uijlenhoet, R. Two and a Half Years of Country-Wide Rainfall Maps Using Radio Links from Commercial Cellular Telecommunication Networks. Water Resour. Res. 2016, 52, 8039–8065. [Google Scholar] [CrossRef]
  10. Overeem, A.; Leijnse, H.; Uijlenhoet, R. Country-Wide Rainfall Maps from Cellular Communication Networks. Proc. Natl. Acad. Sci. USA 2013, 110, 2741–2745. [Google Scholar] [CrossRef]
  11. Rayitsfeld, A.; Samuels, R.; Zinevich, A.; Hadar, U.; Alpert, P. Comparison of Two Methodologies for Long Term Rainfall Monitoring Using a Commercial Microwave Communication System. Atmos. Res. 2012, 104–105, 119–127. [Google Scholar] [CrossRef]
  12. Janco, R.; Ostrometzky, J.; Messer, H. In-City Rain Mapping from Commercial Microwave Links—Challenges and Opportunities. Sensors 2023, 23, 4653. [Google Scholar] [CrossRef]
  13. Polz, J.; Chwala, C.; Graf, M.; Kunstmann, H. Rain Event Detection in Commercial Microwave Link Attenuation Data Using Convolutional Neural Networks. Atmos. Meas. Tech. 2020, 13, 3835–3853. [Google Scholar] [CrossRef]
  14. Graf, M.; Chwala, C.; Polz, J.; Kunstmann, H. Rainfall Estimation from a German-Wide Commercial Microwave Link Network: Optimized Processing and Validation for One Year of Data. Hydrol. Earth Syst. Sci. 2020, 24, 2931–2950. [Google Scholar] [CrossRef]
  15. Seidel, J.; Bárdossy, A.; Eisele, M.; Hachem, A.E.; Chwala, C.; Graf, M.; Kunstmann, H.; Demuth, N.; Gerlach, N. Using Opportunistic Rainfall Sensing to Improve Areal Precipitation Estimates and Run-off Modelling—The Case Study of the Ahr Flood in July 2021. In Proceedings of the EGU General Assembly 2023, Vienna, Austria, 24–28 April 2023. [Google Scholar]
  16. Rios Gaona, M.F.; Overeem, A.; Raupach, T.H.; Leijnse, H.; Uijlenhoet, R. Rainfall Retrieval with Commercial Microwave Links in São Paulo, Brazil. Atmos. Meas. Tech. 2018, 11, 4465–4476. [Google Scholar] [CrossRef]
  17. Wolff, W.; Overeem, A.; Leijnse, H.; Uijlenhoet, R. Rainfall Retrieval Algorithm for Commercial Microwave Links: Stochastic Calibration. Atmos. Meas. Tech. 2022, 15, 485–502. [Google Scholar] [CrossRef]
  18. Zohidov, B.; Andrieu, H.; Servières, M.; Normand, N. Retrieval of Rainfall Fields in Urban Areas Using Attenuation Measurements from Mobile Phone Networks: A Modeling Feasibility Study. Hydrol. Earth Syst. Sci. Discuss. 2016, 1–30. [Google Scholar] [CrossRef]
  19. Blettner, N.; Fencl, M.; Bareš, V.; Kunstmann, H.; Chwala, C. Transboundary Rainfall Estimation Using Commercial Microwave Links. Earth Space Sci. 2023, 10, e2023EA002869. [Google Scholar] [CrossRef]
  20. Blettner, N.; Fencl, M.; Bareš, V.; Chwala, C.; Kunstmann, H. Challenges in the Usage of Commercial Microwave Links for the Generation of Transboundary German-Czech Rainfall Maps. In Proceedings of the EGU General Assembly 2023, Vienna, Austria, 24–28 April 2023. [Google Scholar]
  21. Djibo, M.; Chwala, C.; Ouedraogo, W.Y.S.B.; Doumounia, A.; Sanou, S.R.; Sawadogo, M.; Kunstmann, H.; Zougmoré, F. Commercial Microwave Link Networks for Rainfall Monitoring in Burkina Faso: First Results from a Dense Network in Ouagadougou. In Proceedings of the 2023 IEEE Multi-Conference on Natural and Engineering Sciences for Sahel’s Sustainable Development (MNE3SD), Bobo-Dioulasso, Burkina Faso, 23–25 February 2023; pp. 1–7. [Google Scholar]
  22. Djibo, M.; Chwala, C.; Graf, M.; Polz, J.; Kunstmann, H.; Zougmoré, F. High-Resolution Rainfall Maps from Commercial Microwave Links for a Data-Scarce Region in West Africa. J. Hydrometeorol. 2023, 24, 1847–1861. [Google Scholar] [CrossRef]
  23. Daher, A.; Al Sakka, H.; Chaaban, A.K. Low Complexity Single-Layer Neural Network for Enhanced Rainfall Estimation Using Microwave Links. J. Hydroinformatics 2022, 25, 101–112. [Google Scholar] [CrossRef]
  24. Samad, M.A.; Diba, F.D.; Choi, D.-Y. Rain Attenuation Scaling in South Korea: Experimental Results and Artificial Neural Network. Electronics 2021, 10, 2030. [Google Scholar] [CrossRef]
  25. Christofilakis, V.; Tatsis, G.; Chronopoulos, S.K.; Sakkas, A.; Skrivanos, A.G.; Peppas, K.P.; Nistazakis, H.E.; Baldoumas, G.; Kostarakis, P. Earth-to-Earth Microwave Rain Attenuation Measurements: A Survey On the Recent Literature. Symmetry 2020, 12, 1440. [Google Scholar] [CrossRef]
  26. Doumounia, A.; Gosset, M.; Cazenave, F.; Kacou, M.; Zougmore, F. Rainfall Monitoring Based on Microwave Links from Cellular Telecommunication Networks: First Results from a West African Test Bed. Geophys. Res. Lett. 2014, 41, 6016–6022. [Google Scholar] [CrossRef]
  27. Christofilakis, V.; Tatsis, G.; Lolis, C.J.; Chronopoulos, S.K.; Kostarakis, P.; Bartzokas, A.; Nistazakis, H.E. A Rain Estimation Model Based on Microwave Signal Attenuation Measurements in the City of Ioannina, Greece. Meteorol. Appl. 2020, 27, e1932. [Google Scholar] [CrossRef]
  28. Labuguen, R.T.; Caballa, J.K.T.; Abrajano, G.D.; Guico, M.L.C.; Pineda, C.S.; Libatique, N.J.C.; Tangonan, G.L. Nationwide 5GHz-Fixed Wireless Network for Prototype Rain Alarm System. In Proceedings of the 2015 IEEE Tenth International Conference on Intelligent Sensors, Sensor Networks and Information Processing (ISSNIP), Singapore, 7–9 April 2015; pp. 1–5. [Google Scholar]
  29. Fang, S.-H.; Yang, Y.-H.S. The Impact of Weather Condition on Radio-Based Distance Estimation: A Case Study in GSM Networks With Mobile Measurements. IEEE Trans. Veh. Technol. 2016, 65, 6444–6453. [Google Scholar] [CrossRef]
  30. Beritelli, F.; Capizzi, G.; Lo Sciuto, G.; Napoli, C.; Scaglione, F. Rainfall Estimation Based on the Intensity of the Received Signal in a LTE/4G Mobile Terminal by Using a Probabilistic Neural Network. IEEE Access 2018, 6, 30865–30873. [Google Scholar] [CrossRef]
  31. Song, K.; Liu, X.; Gao, T.; Yin, M.; He, B. The Feasibility Analysis of Cellphone Signal to Detect the Rain: Experimental Study. IEEE Geosci. Remote Sens. Lett. 2020, 17, 1158–1162. [Google Scholar] [CrossRef]
  32. Wennerström, H.; Hermans, F.; Rensfelt, O.; Rohner, C.; Nordén, L.-Å. A Long-Term Study of Correlations between Meteorological Conditions and 802.15.4 Link Performance. In Proceedings of the 2013 IEEE International Conference on Sensing, Communications and Networking (SECON), New Orleans, LA, USA, 24–27 June 2013; pp. 221–229. [Google Scholar]
  33. Luomala, J.; Hakala, I. Effects of Temperature and Humidity on Radio Signal Strength in Outdoor Wireless Sensor Networks. In Proceedings of the 2015 Federated Conference on Computer Science and Information Systems (FedCSIS), Lodz, Poland, 13–16 September 2015; pp. 1247–1255. [Google Scholar]
  34. Bauer, J.; Aschenbruck, N. Towards a Low-Cost RSSI-Based Crop Monitoring. ACM Trans. Internet Things 2020, 1, 1–26. [Google Scholar] [CrossRef]
  35. Rodić, L.D.; Županović, T.; Perković, T.; Šolić, P.; Rodrigues, J.J.P.C. Machine Learning and Soil Humidity Sensing: Signal Strength Approach. ACM Trans. Internet Technol. 2021, 22, 1–21. [Google Scholar] [CrossRef]
  36. Guidara, A.; Fersi, G.; Derbel, F.; Jemaa, M.B. Impacts of Temperature and Humidity Variations on RSSI in Indoor Wireless Sensor Networks. Procedia Comput. Sci. 2018, 126, 1072–1081. [Google Scholar] [CrossRef]
  37. Goldoni, E.; Savazzi, P.; Favalli, L.; Vizziello, A. Correlation between Weather and Signal Strength in LoRaWAN Networks: An Extensive Dataset. Comput. Netw. 2022, 202, 108627. [Google Scholar] [CrossRef]
  38. Chwala, C.; Kunstmann, H. Commercial Microwave Link Networks for Rainfall Observation: Assessment of the Current Status and Future Challenges. WIREs Water 2019, 6, e1337. [Google Scholar] [CrossRef]
  39. Samad, M.A.; Diba, F.D.; Choi, D.-Y. A Survey of Rain Attenuation Prediction Models for Terrestrial Links—Current Research Challenges and State-of-the-Art. Sensors 2021, 21, 1207. [Google Scholar] [CrossRef]
  40. Ενημερωτική Πύλη Κατασκευών Κεραιών. Available online: https://keraies.eett.gr/ (accessed on 14 February 2024).
  41. 3GPP LTE; Evolved Universal Terrestrial Radio Access (E-UTRA); User Equipment (UE) Radio Transmission and Reception (3GPP TS 36.101 Version 17.11.0 Release 17). Available online: https://portal.3gpp.org/desktopmodules/Specifications/SpecificationDetails.aspx?specificationId=2411 (accessed on 22 January 2024).
  42. RECOMMENDATION ITU-R P.453-9—The Radio Refractive Index: Its Formula and Refractivity Data. Available online: https://www.google.com.hk/url?sa=t&rct=j&q=&esrc=s&source=web&cd=&ved=2ahUKEwjN_Mz6p7uEAxWmsVYBHX3JCtEQFnoECBMQAQ&url=https%3A%2F%2Fwww.itu.int%2Fdms_pubrec%2Fitu-r%2Frec%2Fp%2FR-REC-P.453-9-200304-S!!PDF-E.pdf&usg=AOvVaw3DceRTcq7hd6yzmsd38uS_&opi=89978449 (accessed on 29 January 2024).
  43. Breiman, L. Classification and Regression Trees; Routledge: New York, NY, USA, 2017; ISBN 978-1-315-13947-0. [Google Scholar]
  44. Coppersmith, D.; Hong, S.J.; Hosking, J.R.M. Partitioning Nominal Attributes in Decision Trees. Data Min. Knowl. Discov. 1999, 3, 197–217. [Google Scholar] [CrossRef]
  45. Loh, W.-Y.; Shih, Y.-S. Split Selection Methods for Classification Trees. Stat. Sin. 1997, 7, 815–840. [Google Scholar]
  46. Cortes, C.; Vapnik, V. Support-Vector Networks. Mach. Learn. 1995, 20, 273–297. [Google Scholar] [CrossRef]
  47. Cover, T.; Hart, P. Nearest Neighbor Pattern Classification. IEEE Trans. Inf. Theory 1967, 13, 21–27. [Google Scholar] [CrossRef]
  48. Freund, Y.; Schapire, R.E. A Desicion-Theoretic Generalization of on-Line Learning and an Application to Boosting. In Computational Learning Theory. EuroCOLT 1995. Lecture Notes in Computer Science; Vitányi, P., Ed.; Springer: Berlin/Heidelberg, Germany, 1995; pp. 23–37. [Google Scholar]
  49. Geva, M.; Schuster, R.; Berant, J.; Levy, O. Transformer Feed-Forward Layers Are Key-Value Memories. In Proceedings of the 2021 Conference on Empirical Methods in Natural Language Processing, Virtual Event/Punta Cana, Dominican Republic, 7–11 November 2021; Moens, M.-F., Huang, X., Specia, L., Yih, S.W., Eds.; Association for Computational Linguistics: Stroudsburg, Pennsylvania, USA, 2021; pp. 5484–5495. [Google Scholar]
Figure 1. Measurement workflow.
Electronics 13 00840 g001
Figure 2. Map illustrating the locations of the automatic meteorological station of the University of Ioannina (AMS, shown in blue), the base transceiver stations in the vicinity of the university (BTSs, shown in red), and the cellular terminal (CT, shown in green).
Electronics 13 00840 g002
Figure 3. Ground-level picture of the area between the cellular terminal and BTS 1.
Electronics 13 00840 g003
Figure 4. The Android application when the RSSI logging service is (a) stopped or (b) running and (c) the notification that appears in the Android device’s notification bar when the logging service is active.
Electronics 13 00840 g004
Figure 5. The automatic meteorological station of the University of Ioannina.
Electronics 13 00840 g005
Figure 6. Depiction of instances of five precipitation events (expressed in mm/h, shown in blue) and their corresponding impact on the signal power measured by the cellular terminal (expressed in dBm, shown in red) for dates (a) 28 May 2023, (b) 30 May 2023, (c) 03 June 2023, (d) 04 June 2023 and (e) 17 October 2023.
Electronics 13 00840 g006aElectronics 13 00840 g006b
Figure 7. Generic diagram of a classification tree.
Electronics 13 00840 g007
Figure 8. Confusion matrix of the decision tree model which was trained to predict the precipitation class based on power loss data and the true positive rates (TPRs) and false negative rates (FNRs) related to each of the classes.
Electronics 13 00840 g008
Figure 9. Graphical representation, in the form of a correlation matrix, depicting the correlation between temperature (T), relative humidity (RH), absolute humidity (AH), atmospheric pressure (P), radio refractivity of the air (N), and power loss. The corresponding Pearson correlation coefficients are highlighted in red, while the Spearman’s rank correlation coefficients are presented in blue.
Electronics 13 00840 g009
Figure 10. Graphical representation of power loss in regard to (a) absolute humidity (AH), (b) radio refractivity of the air (N), and (c) temperature (T) and the respective Pearson and Spearman’s rank correlation coefficients.
Electronics 13 00840 g010aElectronics 13 00840 g010b
Table 1. Geographical coordinates, altitude, and distance metrics for the meteorological station and its surrounding base transceiver stations.
SpotGeographical CoordinatesDistance from AMS (km)Altitude (m)
AMS *39°37′10.5″ N 20°50′48″ E0487
BTS + 139°36′21.7″ N 20°50′32.7″ E1.5482
BTS 239°36′50.3″ N 20°50′48.3″ E0.6485
BTS 339°37′59″ N 20°51′00″ E1.5477
BTS 439°37′24.7″ N 20°51′53.1″ E1.6477
BTS 539°37′56.5″ N 20°52′12.8″ E2.5506
BTS 639°38′17″ N 20°48′50.3″ E3.5769
* Automatic meteorological station; + base transceiver station.
Table 2. BTS 1 parameters.
ParameterValue
Location number code1106093
Cell identifier230153
Downlink frequency (MHz)2630
Main lobe max. gain (dBi)18.3
Power at input of the antenna (W)6
Table 3. One-minute timeframe of logged data from 22 May 2023.
RSSIChannelNetworkMCCMNCLACCIDTime
−7828504G2025406023015319:41:44
−7828504G2025406023015319:41:54
−7828504G2025406023015319:42:04
−7828504G2025406023015319:42:14
−7828504G2025406023015319:42:24
−7828504G2025406023015319:42:34
−7828504G2025406023015319:42:44
Table 4. Comparison of the accuracy, based on the true positive rate (TPR), for the five trained models: decision tree, Support Vector Machine (SVM), K-Nearest Neighbors (KNN), Adaptive Boosting (AdaBoost), and Feedforward Neural Network (FNN).
Classification
Model
Decision Tree
TPR (%)
SVM
TPR (%)
KNN
TPR (%)
AdaBoost
TPR (%)
FNN
TPR (%)
Class
1. No Rain99.891.399.893.990.1
2. Light Rain88.67510081.373.7
3. Moderate Rain82.476.574.580.965
4. Heavy Rain81.378.642.882.872.8
5. Very Heavy Rain9085.785.788.580.1
Overall Accuracy (%)88.481.480.685.576.4
Table 5. Comparison between the present study and other related works.
Ref.Experimental SetupFrequencyStudied
Meteorological
Parameters
Precipitation Classification
[29]Cellular terminalsGSM
(1.8 GHz)
Precipitation, wind speed-
[30]Cellular terminal4G/LTEPrecipitationNo rain and three rain classes
[31]Cellular terminal2 GHzPrecipitationWet/dry
[32]Outdoor linksIEEE 802.15.4
(2.4 GHz)
Temperature, absolute humidity, precipitation, sunlight-
[33]Outdoor linksIEEE 802.15.4 (2.4 GHz)Temperature, relative humidity, absolute humidity-
[34]Outdoor linksIEEE 802.15.4
(2.4 GHz)
Vegetative growth, temperature, relative humidity, absolute humidity-
[35]Outdoor linksLoRa
(868 MHz)
Soil humidity-
[36]Indoor sensor network868 MHzTemperature, relative humidity-
[37]Outdoor linksLoRa
(868 MHz)
Temperature, absolute humidity-
This studyCellular terminal4G/LTE
(2630 MHz)
Precipitation, temperature, atmospheric pressure, relative humidity, absolute humidity, radio refractivityNo rain and four rain classes
Disclaimer/Publisher’s Note: The statements, opinions and data contained in all publications are solely those of the individual author(s) and contributor(s) and not of MDPI and/or the editor(s). MDPI and/or the editor(s) disclaim responsibility for any injury to people or property resulting from any ideas, methods, instructions or products referred to in the content.

