Article

Virtual Inertia Methods for Supporting Frequency Stabilisation in Autonomous AC/DC Microgrids

1
School of Engineering, The University of Birmingham, Edgbaston, Birmingham B15 2TT, UK
2
School of Engineering, Newcastle University, Newcastle Upon Tyne NE1 7RU, UK
*
Author to whom correspondence should be addressed.
Electronics 2025, 14(1), 91; https://doi.org/10.3390/electronics14010091
Submission received: 9 September 2024 / Revised: 25 December 2024 / Accepted: 26 December 2024 / Published: 28 December 2024

Abstract

:
Isolated microgrids have long been considered alternative power system entities that can integrate various types of distributed energy sources such as diesel and renewable power generators including energy storage. Renewable energy sources, such as wind and solar PV, introduce low inertia and high intermittency to the microgrid. For this reason, coordinated control and frequency stabilisation are crucial for maintaining higher service levels in the microgrid. This paper reports on the design and development of two proposed methods for virtual inertia provision, namely model-based and filter-based methods, which support the frequency stability of AC/DC microgrids. The inertial power produced by these methods was implemented through power-controlled voltage source converters, associated with a Li-ion battery energy storage system. To derive and develop the functions for the virtual inertia providers using these methods, a new electromechanical power-speed model was developed to represent the interaction between the microgrid AC/DC-sides and its generators. Small-signal analysis using the linearised form of this model was carried out, in addition to deriving the law for the model-based virtual inertia method. Detailed physical-system simulation and tests were performed, and performance analysis of the resulting generator speed-responses using the proposed methods illustrated their merits compared with other methods, namely the standard d f / d t and frequency-event techniques.

1. Introduction

Research into microgrids and their application is being carried out globally, with various projects around the world integrating different types of distributed energy resources (DERs), such as wind and solar PV, energy storage systems (ESS), and rotating generators [1,2,3]. These microgrids can provide better reliability, stability, and resilience to the connecting grid and within their service sites operating in both grid-connection and islanded modes [4,5,6]. Moreover, they can be designed with different hybrid topologies, including DC distribution networks, integrated battery ESSs, and advanced capabilities in terms of control, protection, and operational coordination [7,8,9]. Grid-forming capabilities with local microgrid generators and ESSs, mainly based on power-electronic (PE) systems such as the voltage source converter (VSC), are the minimum requirements for steady/uninterruptible operation of such microgrid systems when switching to islanded mode. In addition, adding a DC network to a microgrid increases its flexibility for integrating battery energy storage systems (BESS) and multi-level DC capability using DC-DC converters [10,11].
As most DERs with PE systems provide power to the grid without adding any rotating mechanical inertia to the large connecting power system, they have a considerable effect on the transient frequency response of such systems [12]. However, in response to extreme loading events or partial loss of power generation, this inertia is important for stabilising the system frequency, as it allows crucial time for dispatching other generators/sources to balance power generation with consumption. More importantly, when the microgrids are islanded, they inherently become low inertia systems, and their frequency stability is more affected. Therefore, attempts have been made to address and resolve this issue [13,14], suggesting and adopting control methods for synthetic inertia (SI) or virtual inertia (VI) emulation through PE inverters/converters [15,16,17,18,19,20,21], and even through connected electric vehicles and data centres, as reported in [22]. The research reported in [23] compared two SI methods, active and passive synthetic inertia, through simulating their behaviour in a small microgrid by modelling converter-based generators. It was proved that both types of SI realisation help in stabilising microgrid frequency. Reference [24] proposed a VI emulation strategy which is based on model reference control for diesel-wind systems, where a typical model representing the frequency response was used for realising the desired inertial response. The authors in [25] compared the VI control for frequency stability in both islanded microgrids and grid-connected power systems, and it was shown that, in a power system with island-optimised areas, dynamic behaviour can result in stability issues. In [26] a model predictive control-based VI system, integrated into a microgrid control loop, stabilised the microgrid frequency under high penetration of renewable energy sources (RESs). For microgrids with DC distribution networks, VI strategies for stabilising DC voltage, which adopt a similar philosophy to frequency or generator-speed stabilisation, have also been reported [27,28]. Whilst the inertia constant in the AC system is based on the total mechanical moment of inertia of the connected rotating generators, in the DC system it is based on the total capacitance of the DC sources connected to the DC network [27].
In this paper, we propose two virtual inertia methods––model-based and filter-based––with design, analysis, and mathematical modelling, including tests, result analyses, and comparison with two other methods reported in the literature. An electromechanical power-speed model of a power system AC/DC microgrid, connecting diesel generators and interfacing VSCs, was also derived to support virtual inertia analysis, control, and design. The case-study microgrid is powered by two 0.5 MVA diesel engine generators (DEGs) with a relatively low inertia constant (H = 0.247 s), which is small in comparison to a typical high-power generator with H 3.5   s [29]. Therefore, the DEG speed/frequency can easily deviate in response to load events, as the reaction of the diesel engine is comparatively slow. As such, electrical synchronous generators mechanically coupled to small diesel engines should be able to provide grid-forming and minimal stabilisation capabilities to the microgrid. For improved stabilisation performance, this paper addresses the challenge of developing the most appropriate virtual inertia methods to stabilise generator speed in an AC/DC microgrid, utilising a power-controlled VSC [30], with 0.5 MW Li-ion BESS. It also reports on the performances of the proposed VI methods for frequency support, in addition to underlying dynamic modelling of the microgrid and its components, including non-linear analysis and comparison with two standard VI methods reported in the literature [31,32]. In [31], for the considered d f / d t VI control method with ESS, the authors reported that a first-order lag with a large time constant of around 1 s is required for a medium stiff point of common coupling (PCC) of the local network. Reference [32] reports on utilising the d f / d t VI for under-frequency support but using an activation frequency limit, so that VI is only applied when the frequency drops below this limit or at this frequency event. The authors in [33] proposed a method for continuous VI by extracting/storing kinetic energy associated with the rotor inertia of the wind turbine, even when the inertia constant, H, is continuously changing due to the variable speed operation of the wind turbine.
The paper is organised in the following manner. Section 2 describes the configuration of the microgrid considered as a case study in this paper. Section 3 and Section 4 report on the derivation of the non-linear electromechanical model which combines the dynamics of both the VSC, including its AC-bus interface, and the DEGs that supply this bus within the microgrid. Model linearisation and system small-signal analysis based on this model around the nominal operating point, which covers power–voltage and power–speed interactions, were derived and are reported in Section 5. Section 6 deals with the development and design aspects of the proposed VI methods and their implementation. System simulation, results, performance analysis, and cross-comparison of the proposed VI methods with the other techniques reported in the literature are discussed in Section 7. Section 8 draws conclusions from the reported research and summarises the advantages of the proposed VI methods.

2. The Proposed Structure of the Microgrid

To develop an effective structure for an AC/DC microgrid that considers power quality, a detailed study was carried out with a focus on islanded applications. Accordingly, it was considered that the microgrid should be capable of supplying the maximum consumer load, which also should be covered by the Li-ion BESS for a certain period to minimise the use of the DEGs. The microgrid structure shown in Figure 1 was adopted, in which two 0.5 MVA diesel generators were connected to the AC-bus of the microgrid, whilst the BESS, scaled at 1 MWh, was connected to the DC-bus along with any other RESs. The latter can be energised by the DEG through four identical 125 kVA VSCs connected in parallel, by the BESS, or by both sources. Each VSC is based on three-level NPC topology [34] and designed using IGBTs as the main power-electronic switches operating at 2.25 kHz PWM switching frequency. Although modern power electronic converters at this power level can operate at PWM frequencies of 10 to 20 kHz, switching at lower frequencies is highly desirable to reduce the switching losses of the converter PE devices and to increase system efficiency for energy saving. The waveforms of the VSCs’ switching frequencies are shifted by 2 π / 4 rad for interleaved operation of the VSCs to reduce the ripple in their total current waveforms injected into the AC-bus. With this operation, the frequency of the ripple peak will be equivalent to four times the VSC switching frequency (four VSCs), which permits the use of a VSC switching-frequency filter tuned at four times the switching frequency, leading to reduction in the rating and size of the filter components [35]. As such, the filter provides very low-impedance path for the current harmonic component at this tuned frequency, preventing it from propagation into the AC loads and rotating generators. Details about calculating/designing the components of a network single-tuned shunt-filter, considering a tuning frequency of 4 × 2.25 kHz, are provided in the Appendix B.
Due to the bidirectional power capability of the VSCs, the AC-bus can be energised by the BESS through the VSCs in addition to the DEG, exploiting the bidirectional power-control capability of the VSCs with other supporting functions for VI provision or frequency support. AC and DC loads can then be supplied or connected flexibly to the microgrid even when the DEG is idling. It should be noted that, whilst the DC-bus of the microgrid is regulated to 1 kV by the VSCs when the AC-bus is energised by the DEGs, it can also be regulated to this voltage level through the bi-directional buck-boost DC-DC converter of the BESS [36] when the DEGs are shut down and disconnected from the AC-bus.
To test the performance of the proposed VI methods for DEG frequency/speed support, the microgrid in Figure 1 was simulated in continuous time using the physical modelling tools of the Matlab/Simulink® software (ver. R2024b) to represent the actual components of the microgrid and their connections. The converter PWM controllers and VI power algorithms/controllers were also modelled and simulated within their relevant units at sampling rate equivalent to the converter switching frequency.

3. VSC Network Connection Power Model

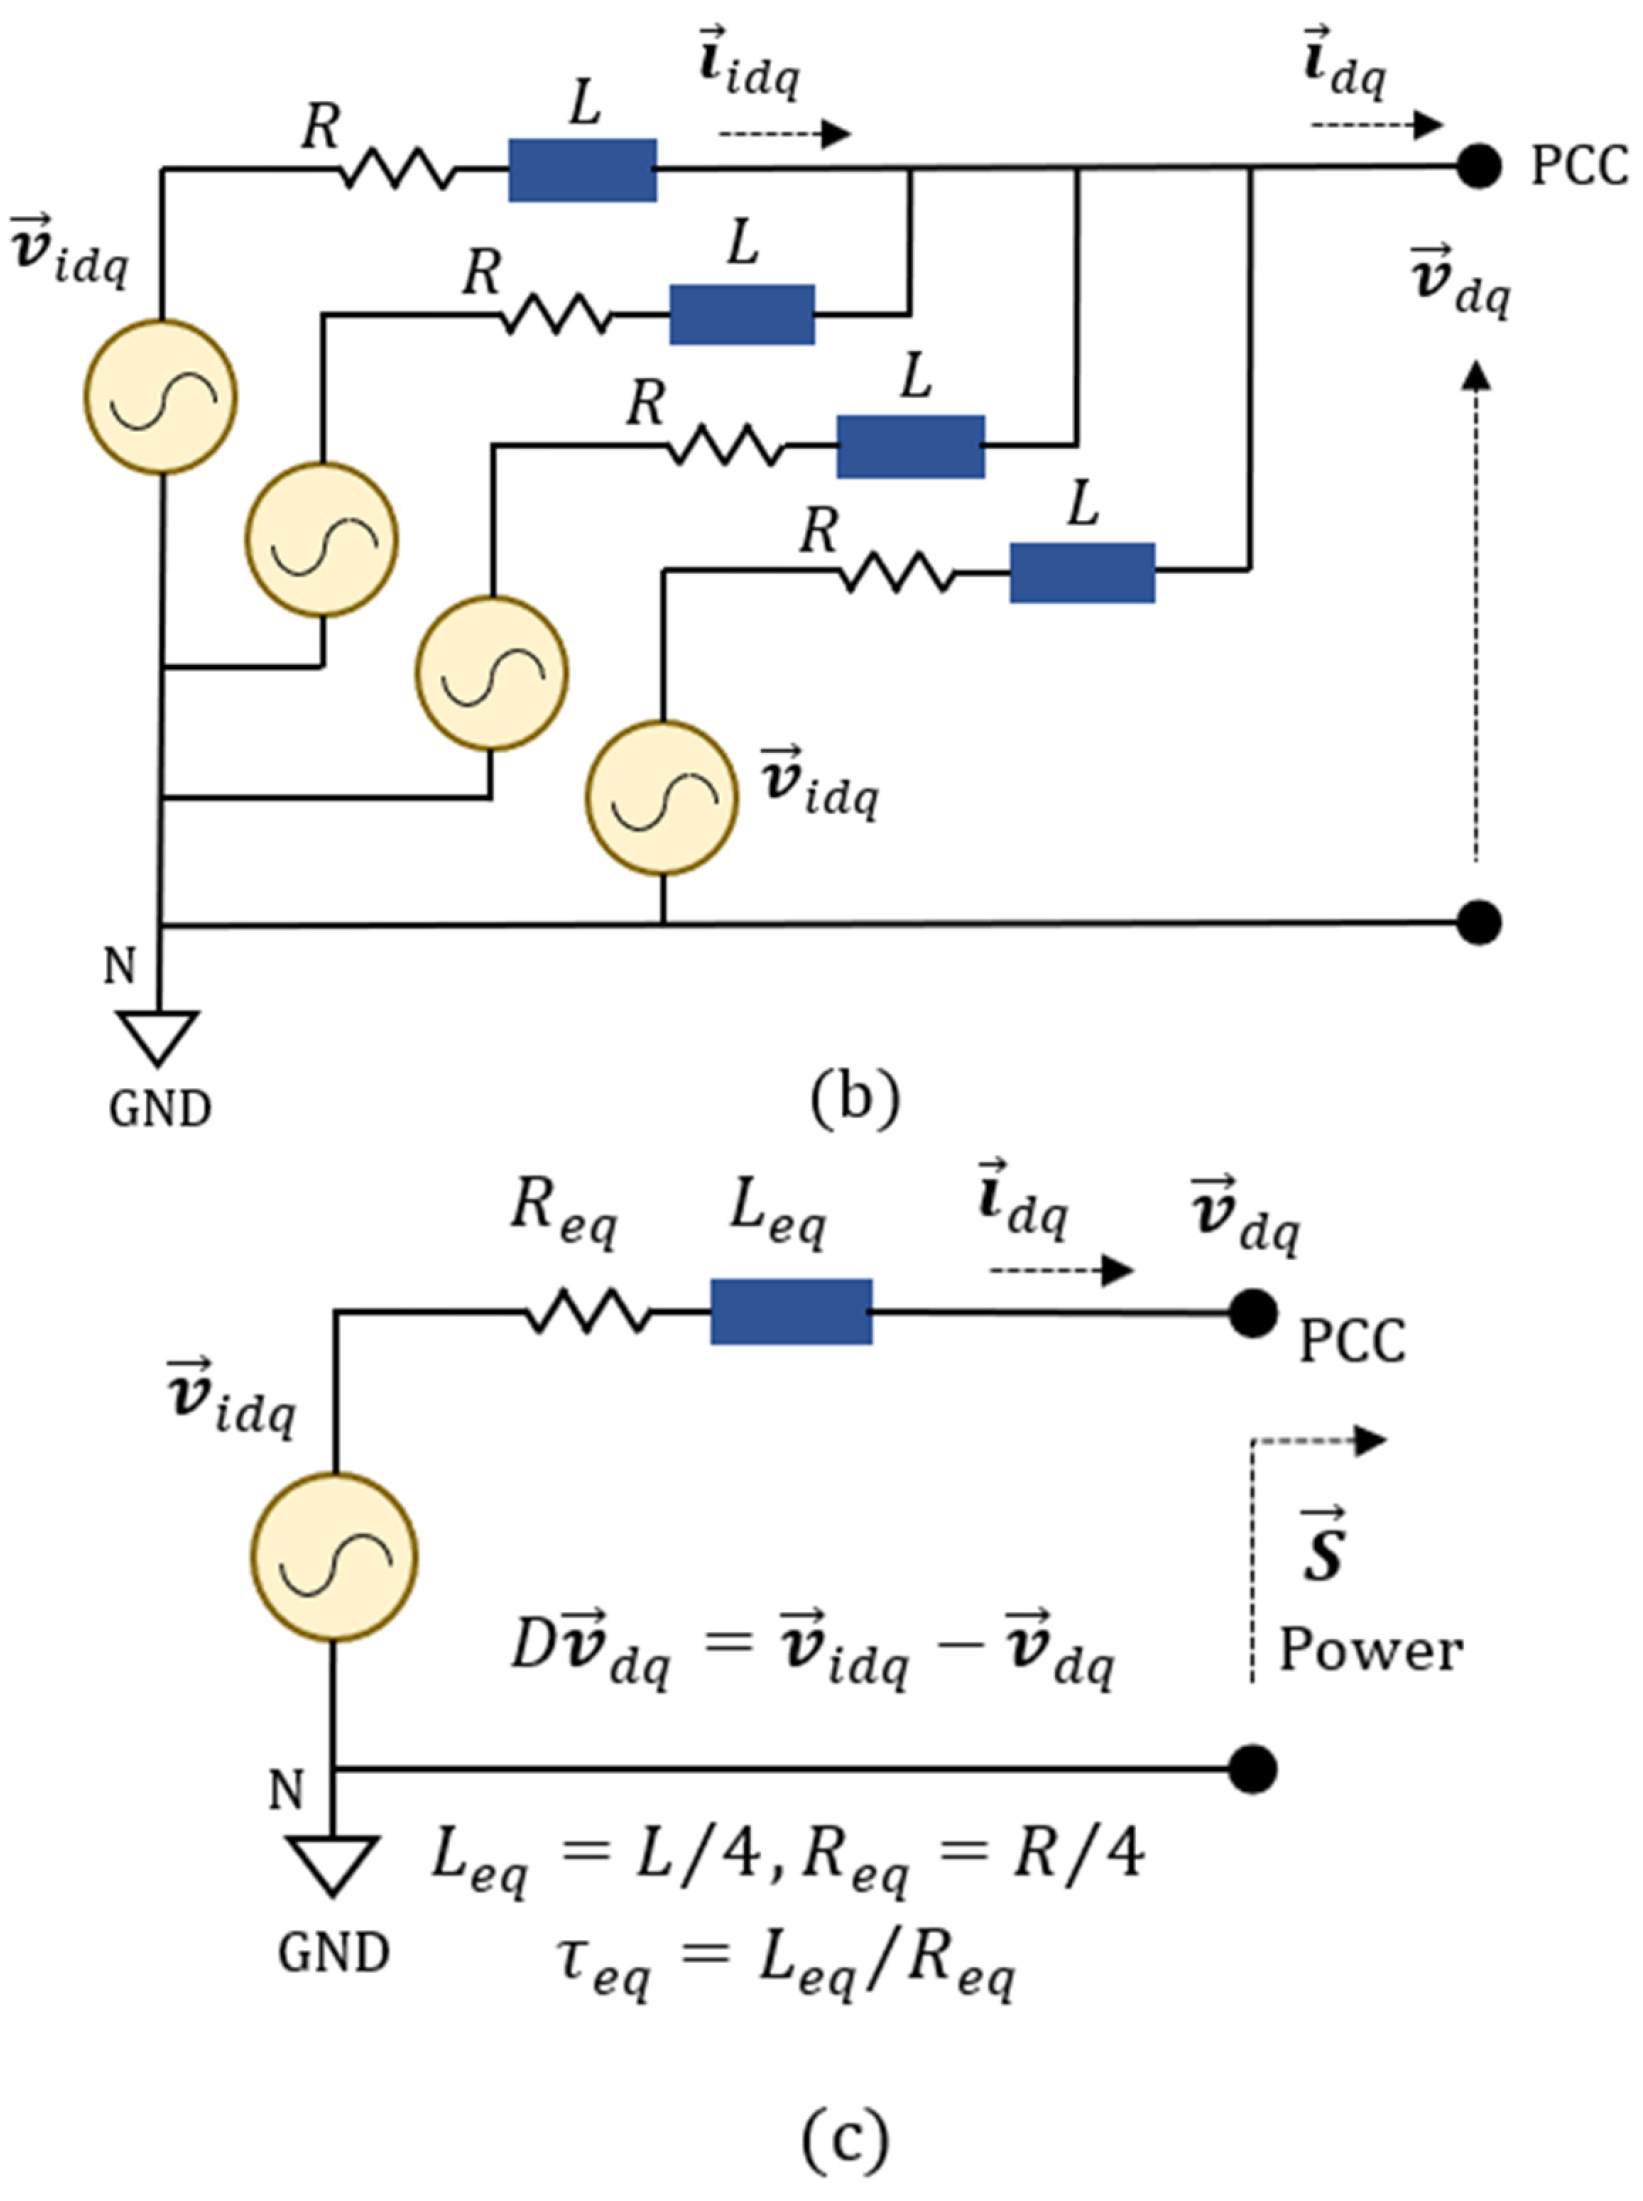
To gain insight into the power flow dynamics through the VSC AC connection, and to derive the proposed VI control functions, a dynamic power-flow model, when the power-electronic VSCs are interfaced to the AC- and DC-buses, was derived. The VSC connection to the PCC of the AC-bus can be simply accomplished through an equivalent inductor (for a transformer-less connection), which can be represented by two parameters, namely its inductance value L and its average internal resistance R, as illustrated by the connection circuit as shown in Figure 2a. The VSCs can be represented by four identical power sources connected in parallel, as illustrated in Figure 2b, which in turn results in an equivalent power-source circuit, shown in Figure 2c, as all VSCs have an identical fundamental voltage component of the PE converter output, v i d q . Given that the voltage vector v d q at the PCC is aligned with the d-axis of the synchronous d-q reference frame, a representation of the apparent dynamic power S , in volt-ampere, which represents the total active and reactive power, P and Q, in a complex vector form, can be given as:
S = P + j Q =   3   2 ( v d   i d + j v d   i q ) ,   or
S =   3   2   V n   ( i d + j   i q ) ;   v d = V n ,
where v d is the d-axis voltage, V n is the per-phase voltage magnitude at the PCC, and i d , i q are the d and q components of the inductance current vectors, respectively. The q voltage component v q disappears (becomes zero) as its voltage vector forms a 90° angle with the q-axis of the reference frame. It should be noted that the above power representation in complex form is based on dynamic variables for dynamic modelling and should be differentiated from steady-state phasor expressions. The time derivative of the above equation is:
S ` =   3   2 V n `   i d + j   i q +   3   2 V n   i d ` + j   i q ` ,
where ` denotes a variable’s time-derivative. Based on the equivalent circuit of Figure 2c, the following voltage-current relationships at the PCC can be worked out:
i d ` = R e q L e q   i d + ω e i q + 1 L e q   D v d     i q ` = R e q L e q   i q ω e i d + 1 L e q   D v q   ,
w h e r e   L e q = L / 4   a n d   R e q = R / 4 are the equivalent inductance and resistance of the VSCs’ interfacing inductors, respectively, D v d and D v q are the d and q components of the applied voltage-difference vector D v d q , respectively, and ω e is the angular frequency of the electrical network voltage or reference frame. Substituting i d ` and i q ` from (3) into (2), and then using (1) to substitute i d and i q with 2 P / 3 V n and 2 Q / 3 V n , respectively, can result in the following power model:
P `   Q ` = V n ` V n P   Q + 3   2 V n R e q L e q   2   P 3 V n + ω e 2   Q 3 V n + 1 L e q   D v d   R e q L e q   2   Q 3 V n ω e 2   P 3 V n + 1 L e q   D v q
This model may be expressed using the canonical state-space form as:
P `   Q ` = ( V n ` V n 1 τ e q ) ω e ω e ( V n ` V n 1 τ e q ) P   Q + 3 V n 2 L e q 0 0 3 V n 2 L e q D v d   D v q
where τ e q = L e q / R e q is the time constant of the connecting inductor. The active and reactive power, P and Q, respectively, represent the states and the outputs of the model and are interdependent or cross-coupled at the PCC, whilst D v d and D v q represent the model inputs.

4. The Electromechanical Power-Speed Model

For dynamic modelling, the two synchronised DEGs can be treated as single generator with a 1 MVA power rating. As such, the electromechanical dynamic model, which links this generator’s electrical load, the VSCs’ power P, and the engines’ mechanical power to the generator speed, can be derived as the following power-speed form [30,37]:
d ω m d t = K H ω m   P + P a P l s ;
K H = 1 / ( 2   H   S m ) ,   P a = P m P e ;
where ω m , H, and S m are the generator’s speed, inertia constant, and rated VA power, respectively, P a , P l s , and P m are the generator’s accelerating/decelerating power, total power losses, and mechanical power, respectively, and P e is the load electrical power. Integrating Equation (6) into Equation (5) results in an expanded state-space model:
P ` Q ` ω ` m = ( V n ` V n 1 τ e q ) ω m N p 0 ω m N p ( V n ` V n 1 τ e q ) 0 K H ω m 0 K H P l s A P Q ω m + 3 V n 2 L e q 0 0 0 3 V n 2 L e q 0 0 0 K H ω m B D v d D v q P a ;
where ω m = ω e   N p , and N p is the generator number of pole pairs. In general, this system model is non-linear, as its transient and output matrices, A and B, depend on the state and exogenous variables, mainly the generator speed ω m and the AC side voltage component V n (or v d ) that affects the input voltage components D v d and D v q . Therefore, the model matrices are not constant, and the system transient matrix can be affected by voltage magnitude variations at the PCC because of loading events. This model includes all state and output variables that interact with each other in transient and steady-state operations, where the control inputs can affect the generator speed directly or indirectly through the injected VSC power P.

5. Model Linearisation and System Analysis

Model linearisation of the above power system around an operating point (OP) (i.e., around operating speed, active and reactive power, and when considering the voltage deviation at the PCC) results in the following approximate perturbation model:
P ` Q ` ω m ` V n ` V n 1 τ e q ω m   N p N p   Q ω m   N p V n ` V n 1 τ e q N p   P K H   ω m 0 K H P + P a P l s   O P P Q ω m + 3 ( V n D v d ) 2 L e q 0 0 3 D v q 2 L e q 3 V n 2 L e q 0 0 0 K H   ω m   O P D v d D v q P a
It should be noted that, at some point of the derivation process, V n was reconsidered as v d and equal to v i d D v d , according to Figure 2c. The time domain model in (9) can be converted to a model in the frequency or Laplace domain at any fixed operating point. For the analysis in this section, an operating point is considered when the VSC does not contribute any continuous power to the AC-bus, and therefore all its power outputs and the voltage difference components D v d and D v q are null. Also, at this point the DEG speed ω m is considered nominal (which is normally the case) without an accelerating power P a . Applying these conditions to the model in (9), which conforms to the dynamic VI provision, the converted model in the Laplace domain can be written as:
Y s = G s   U s ;
Y s = P ( s ) Q ( s ) ω m ( s ) T ,
U s = D v d ( s ) D v q ( s ) P a ( s ) T ;
where T indicates a matrix transpose, and:
G s = g 11 ( s ) g 12 ( s ) g 13 ( s ) g 21 ( s ) g 22 ( s ) g 23 ( s ) g 31 ( s ) g 32 ( s ) g 33 ( s ) ;
g 11 s = g 22 s = 3   V n 2   L e q   s + ( 1 τ e q V n ` V n ) D 1 ( s ) ,
g 12 s = g 21 s = 3   V n 2   L e q   ω m   N p D 1 ( s ) ,
g 31 s = 3   V n 2   L e q   K H   ω m   s + ( 1 τ e q V n ` V n ) D 2 ( s ) ,
g 32 s = 3   V n 2   L e q   K H   ω m 2   N p D 2 ( s ) ,
g 33 s = K H   ω m s +   K H   P l s ;
g 13 s = g 23 s = 0 and:
D 1 s = s 2 + 2   1 τ e q V n ` V n s + ( 1 τ e q V n ` V n ) 2 + ω m 2   N p 2 ,
D 2 s = s +   K H   P l s   D 1 s .
As the parameters of the linearised model can be within a range of values, they can lead to a large set of Laplace or frequency-domain models which result in different system characteristics. Investigating all possible numerical models is beyond the scope of this paper. However, for system analysis and designing the proposed model-based VI method, the system parameters given in Appendix A were considered.
Using the characteristic polynomials D 1 s and D 2 s above, the open-loop system poles can be found as functions of the model parameters:
p 1 = V n ` V n 1 τ e q j   ω m   N p ,
p 2 = V n ` V n 1 τ e q + j   ω m   N p ,
p 3 = K H   P l s .
As K H is always positive, p 3 has a negative real value, and it is always in the left half of the complex plane. However, this is not the case with poles p 1 and p 2 , as they can easily move to the right half of the plane when V n ` / V n becomes higher than 1 / τ e q . Therefore, to ensure VSC connection stability under extreme events, the condition 1 / τ e q > V n ` / V n must always be maintained. Since p 1 and p 2 are conjugate poles, the system is oscillatory at a frequency equal to the angular frequency of the AC network, ω e = ω m N p . Using the values of the system parameters given in Appendix A and for a constant V n , the numerical values for the system poles become p 1,2 = 20 ± j 314.16 , p 3 = 0.04 . These poles characterise the model with an oscillatory power response at 314.16 rad/s and a sluggish, non-oscillatory speed response, as demonstrated below.
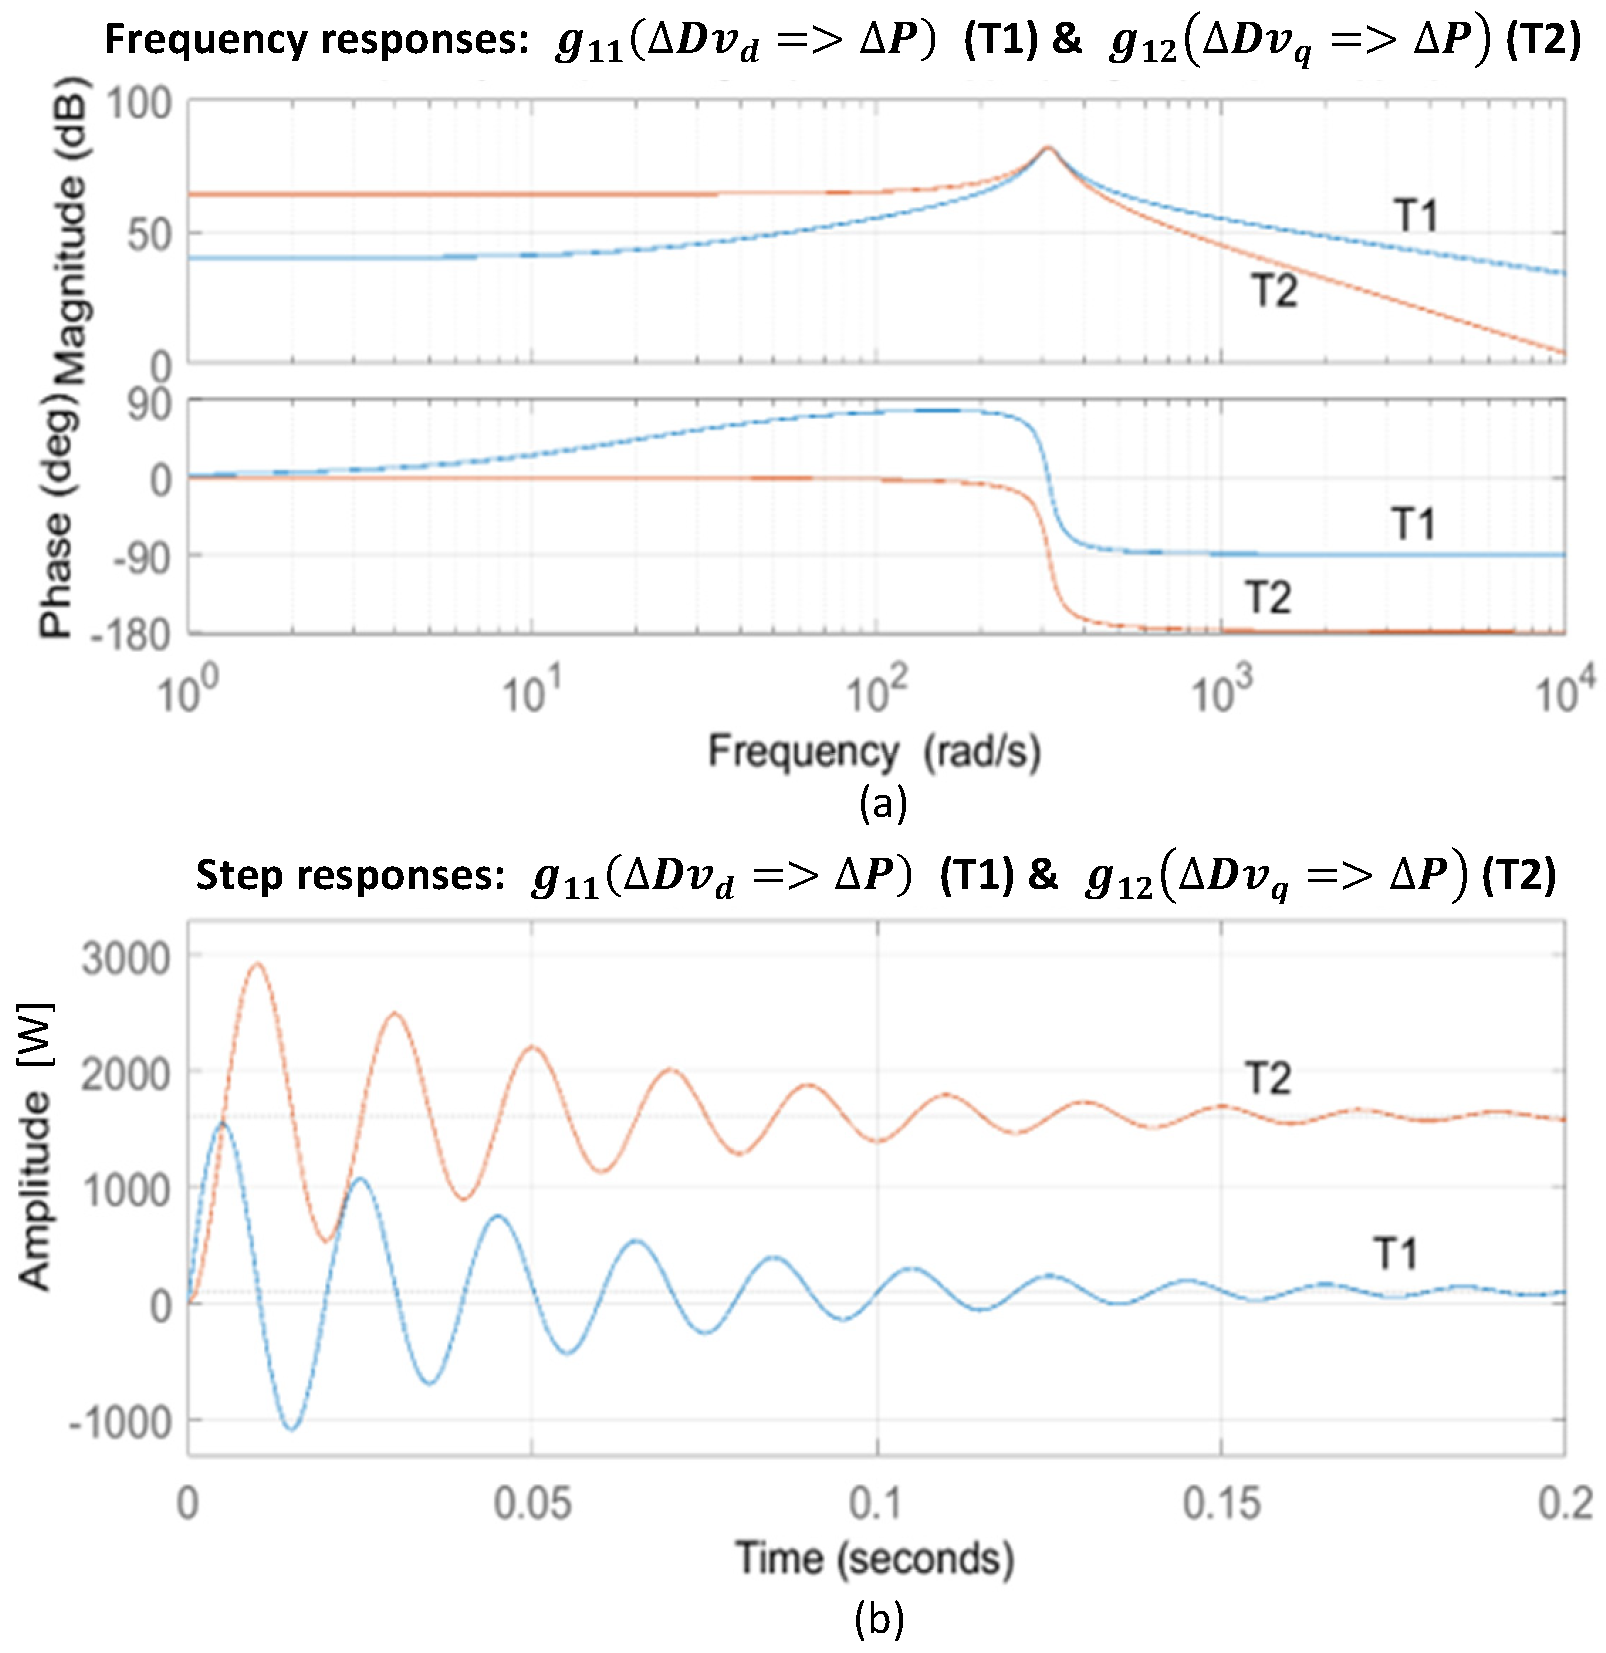
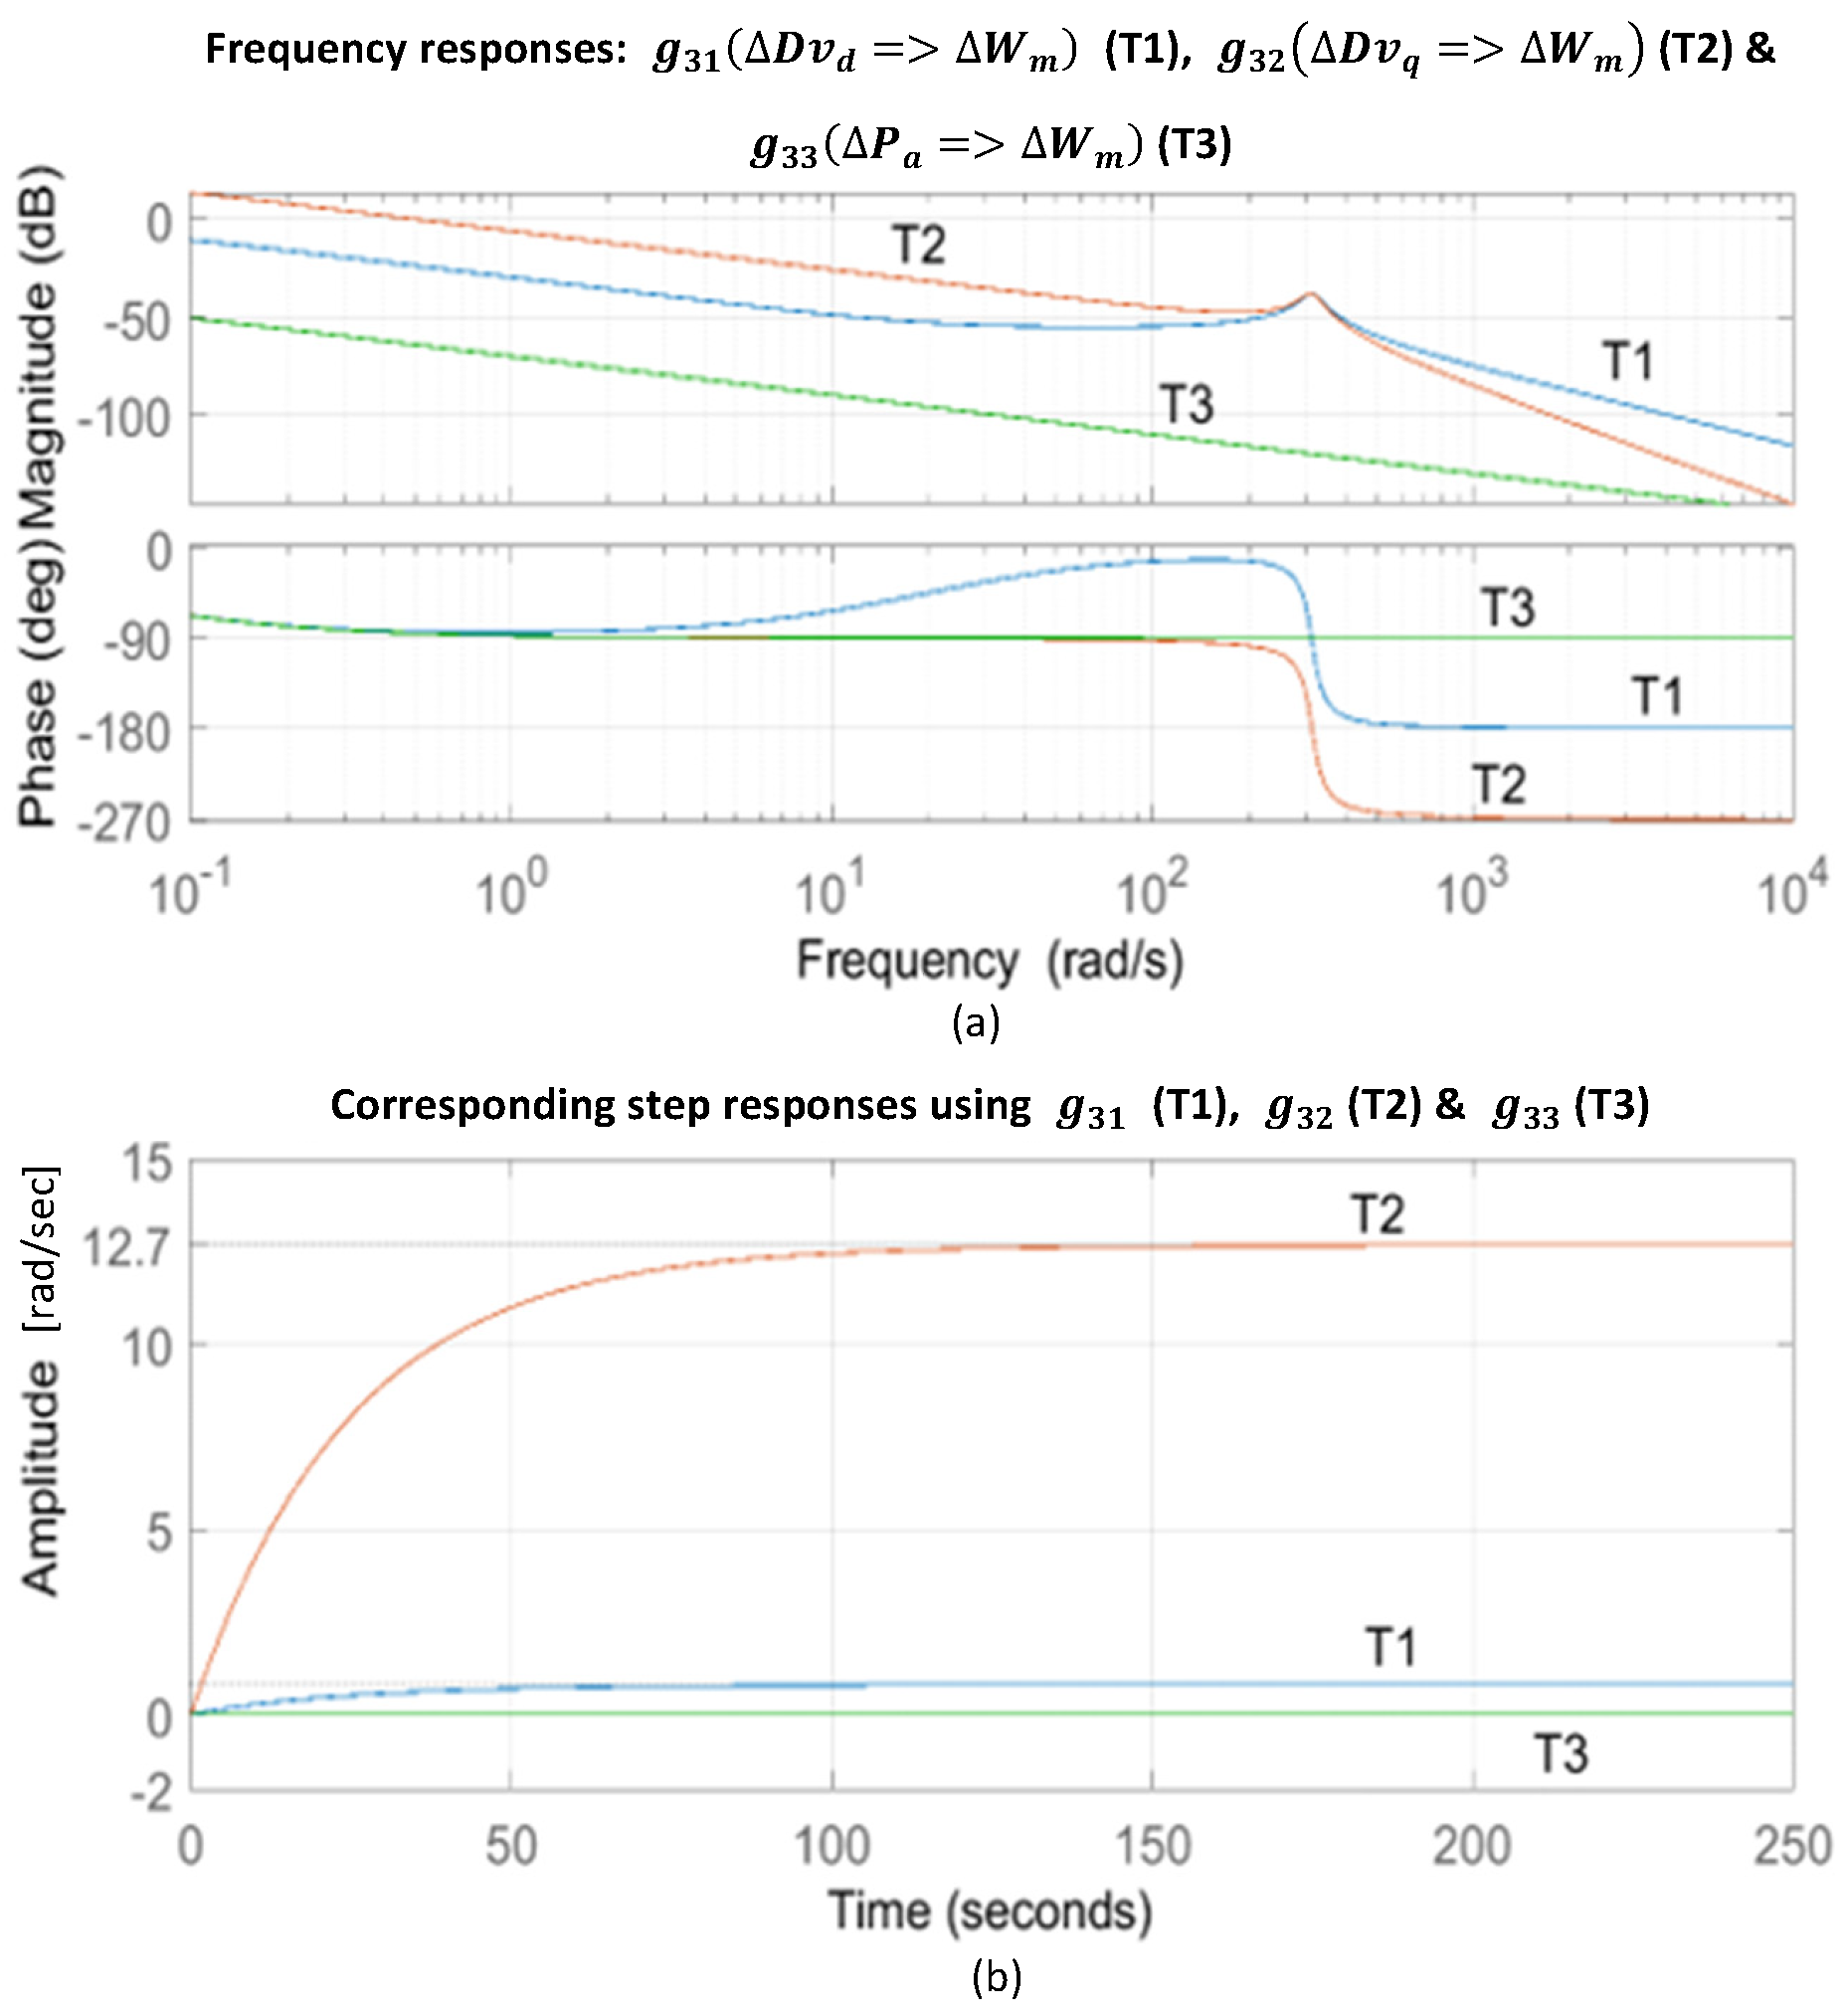
Based on the system transfer functions in (13), the frequency and step responses, which give insights into the model characteristics and stability issues for system analysis, can be depicted as shown in Figure 3 and Figure 4. The two graphs in the top of Figure 3 represent the frequency responses of the active power, where the traces show the oscillatory response at 314.16 rad/s for both g 11 and g 12 . The related step responses confirm their oscillatory nature, as shown in the lower graph, and it can be noticed that the active power is mainly affected by the deviation in the quadrature component of the control voltage-difference D v q of the VSC. Figure 4 shows the responses associated with g 31 , g 32 , and g 33 , where the three graphs represent the frequency responses of the generator speed to VSC voltages D v d and D v q , and to the accelerating power P a , respectively. It is demonstrated that the responses g 31 and g 32 have very low oscillation around 314 rad/s due to their links to the VSC active and reactive power deviation, whereas the response g 33 ( P a ω m ) does not exhibit such an oscillation. The traces of the corresponding step responses for the generator speed, as given in the lower graph, illustrate that a much higher speed response or gain can be obtained when using the quadrature voltage-difference D v q in comparison with D v d and P a effects. In other words, whilst speed can be changed considerably in response to a small change in D v q , its sensitivity to changes in D v d and P a is very low, and therefore a very large change in P a must be made to make any significant change in speed or frequency. For further insight into the system closed-loop characteristics, Table 1 summarises the model’s gain and phase margins based on its transfer functions in (13).

6. The Proposed Methods for Frequency Support

As the VSC can be controlled as a dynamic power-source/sink, it can be employed to act effectively as another synchronous generator (with similar or different power scale) connected in parallel with the DEG, adding an extra AC virtual inertia to the microgrid power system through its AC-bus. As such, it enhances frequency stabilisation for the existing power system, especially when the VSC is equipped with fast-response power-control capability, in addition to suitable VI functions. The methods proposed below are considered for designing and providing VI of similar order to that of the DEG through the static VSC.

6.1. The Model-Based Virtual Inertia Method

In this proposed method, the VI power can be defined as the change in the acceleration power P a , which can be derived using the last line of the matrix in (9) around the generator’s speed and power operating point. Substituting K H P + P a P l s from (6) and replacing H with its expression J ω m 2 / ( 2   S m ) within K H into the third matrix line in (9), the law for calculating the required VI power can be derived as:
P V I * = P a = J   ω m   ω ` m J   ω ` m   ω m P ;
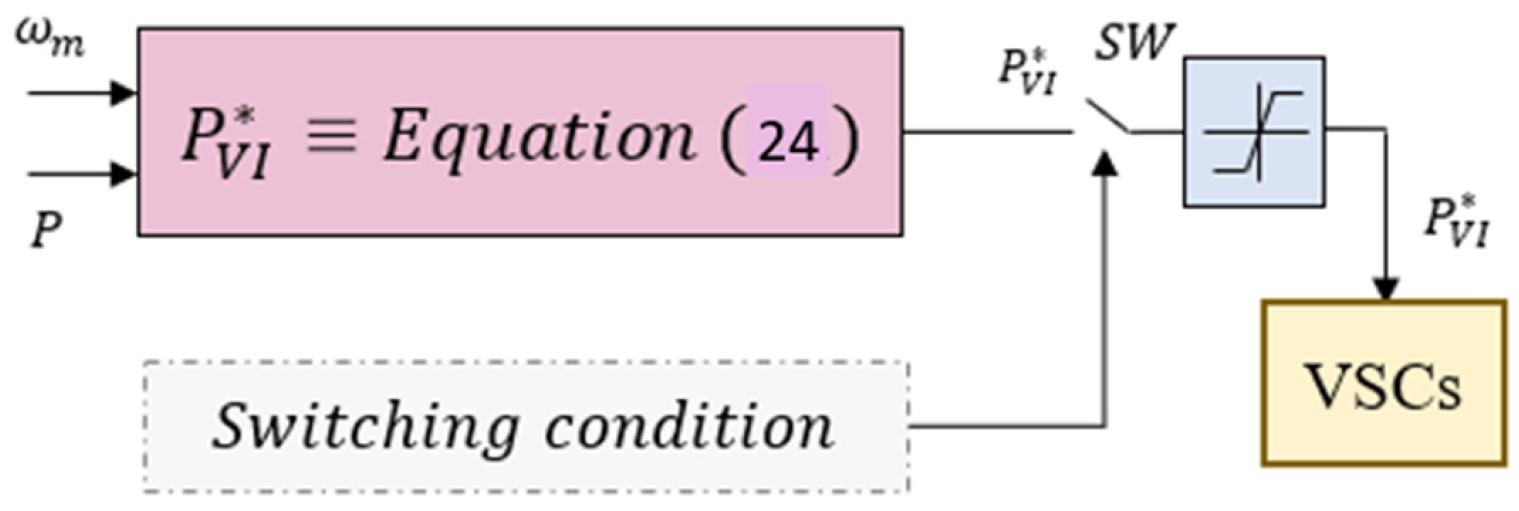
where J is the generator’s moment of inertia considered for calculating the VI power. Accordingly, a VI model-based provider based on Equation (24) can be realised within the VSC power controller by passing the calculated P V I * as part of the total VSCs’ power demand or reference, as illustrated in Figure 5. A switching function SW was introduced to apply the VI power only when the speed is diverging away from its nominal value, ensuring that the VI power does not oppose the action of the DEG governor when the generator speed is approaching its set point. This SW condition can be derived as follows:
I f   ( ω m * ω m ) · P V I * > 0   t h e n , S W   i s   c l o s e d ,   e l s e   S W   i s   o p e n .  

6.2. The Filter-Based Virtual Inertia Method

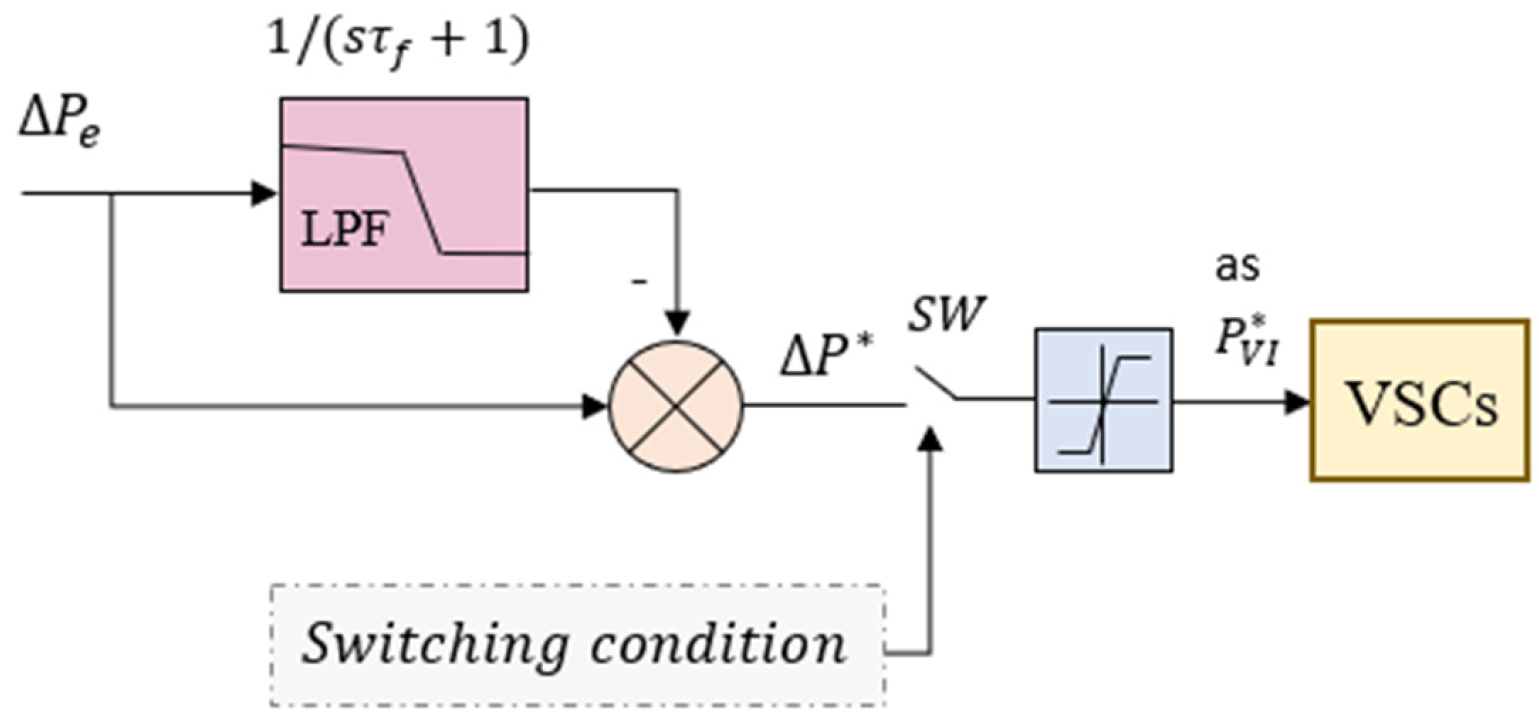
A change in the microgrid transient AC load is the main cause of speed/frequency deviation of the DEGs, whilst the transient DC load can directly affect the DC-bus voltage. The aspect of regulating the DC-bus voltage through the BESS and the VSC converters is beyond the scope of this paper. Accordingly, the idea for this method is to divert the impact of the transient AC load away from the rotating generator by absorbing the load variations utilising the VSCs and the integrated BESS. This mechanism was achieved by extracting the high-frequency components of the load perturbation P e , which can become a part of the accelerating/decelerating power as in Equation (6), utilising a low-pass filter (LPF). As such, the impact of the mechanism using the LFP is similar to adding extra inertia or VI to the DEGs or the AC power system. The proposed structure for this filter-based VI method, illustrated in Figure 6, demonstrates how the high-frequency components of the load VI power demand can be extracted. By demanding these power components (assigned as P * ) through the VSC power controller, the required transient power can be generated to offset the changes in the AC load and to alleviate their effect on the generator speed. It is worthwhile to mention that frequency-division methods, using high-pass and low-pass filters, were presented in [38,39,40], for a different purpose: to produce a power reference for short-term energy storage systems. However, in [39,40], high-pass filtering was applied to the DC-voltage error, whilst in [38] it was applied to wind turbine power.
When utilising the proposed filter-based method, load uncertainty will not be an issue, as AC-load power can be accessed for direct measurement within the microgrid. The LPF used to derive the high-pass filtering function can be designed with different time constants T f to satisfy the speed/frequency deviation limits, considering the response delay of the DEG speed-governor control loop and minimal usage of stored energy for VI purpose. In addition to covering these limits, the recommended approach to selecting the best value for the filter time constant can also be based on design and protection factors, such as the rate of change of frequency (RoCoF) limits and available peak power by the VSCs for VI provision.
The electromechanical model in (6) was used to evaluate the speed response at various values of the time constant T f . When the change in AC load is P e , the VSC initially provides the same amount of power P e by injecting P * , as illustrated in Figure 6. Based on Equation (6), the power-speed dynamics (around the synchronous speed) at the instant of applying the load step can be found as:
d ω m d t + K H   ω m   P l s K H   ω m s   ( P * P e ) ;
where ω m s is the synchronous speed of the rotating generator. In the s-domain, Equation (25) takes the following form:
ω m s   s + K H   P l s = K H   ω m s   [ P * ( s ) P e ( s ) ] .
Obtaining the relationship between P e and P * in the s-domain from Figure 6 and inserting it into (26), the following transfer function between the speed and the change in the electrical AC load can be derived:
ω m ( s ) P e ( s ) = K H   ω m s s + K H   P l s s   T f + 1 .
Using this expression, an expression for calculating the time-domain response of the DEG speed as a function of AC-load change P e , filter time-constant T f , and time can be found:
ω m P e ,   T f ,   t = P e   ω m s P l s     1 T f   e ( K H   P l s )   t K H   P l s   e t / T f 1 T f K H   P l s 1 .
For comparison with the case without using the filter, Equation (27) also gives the following time-domain expression:
ω m P e ,   t = P e   ω m s P l s   e ( K H   P l s )   t 1
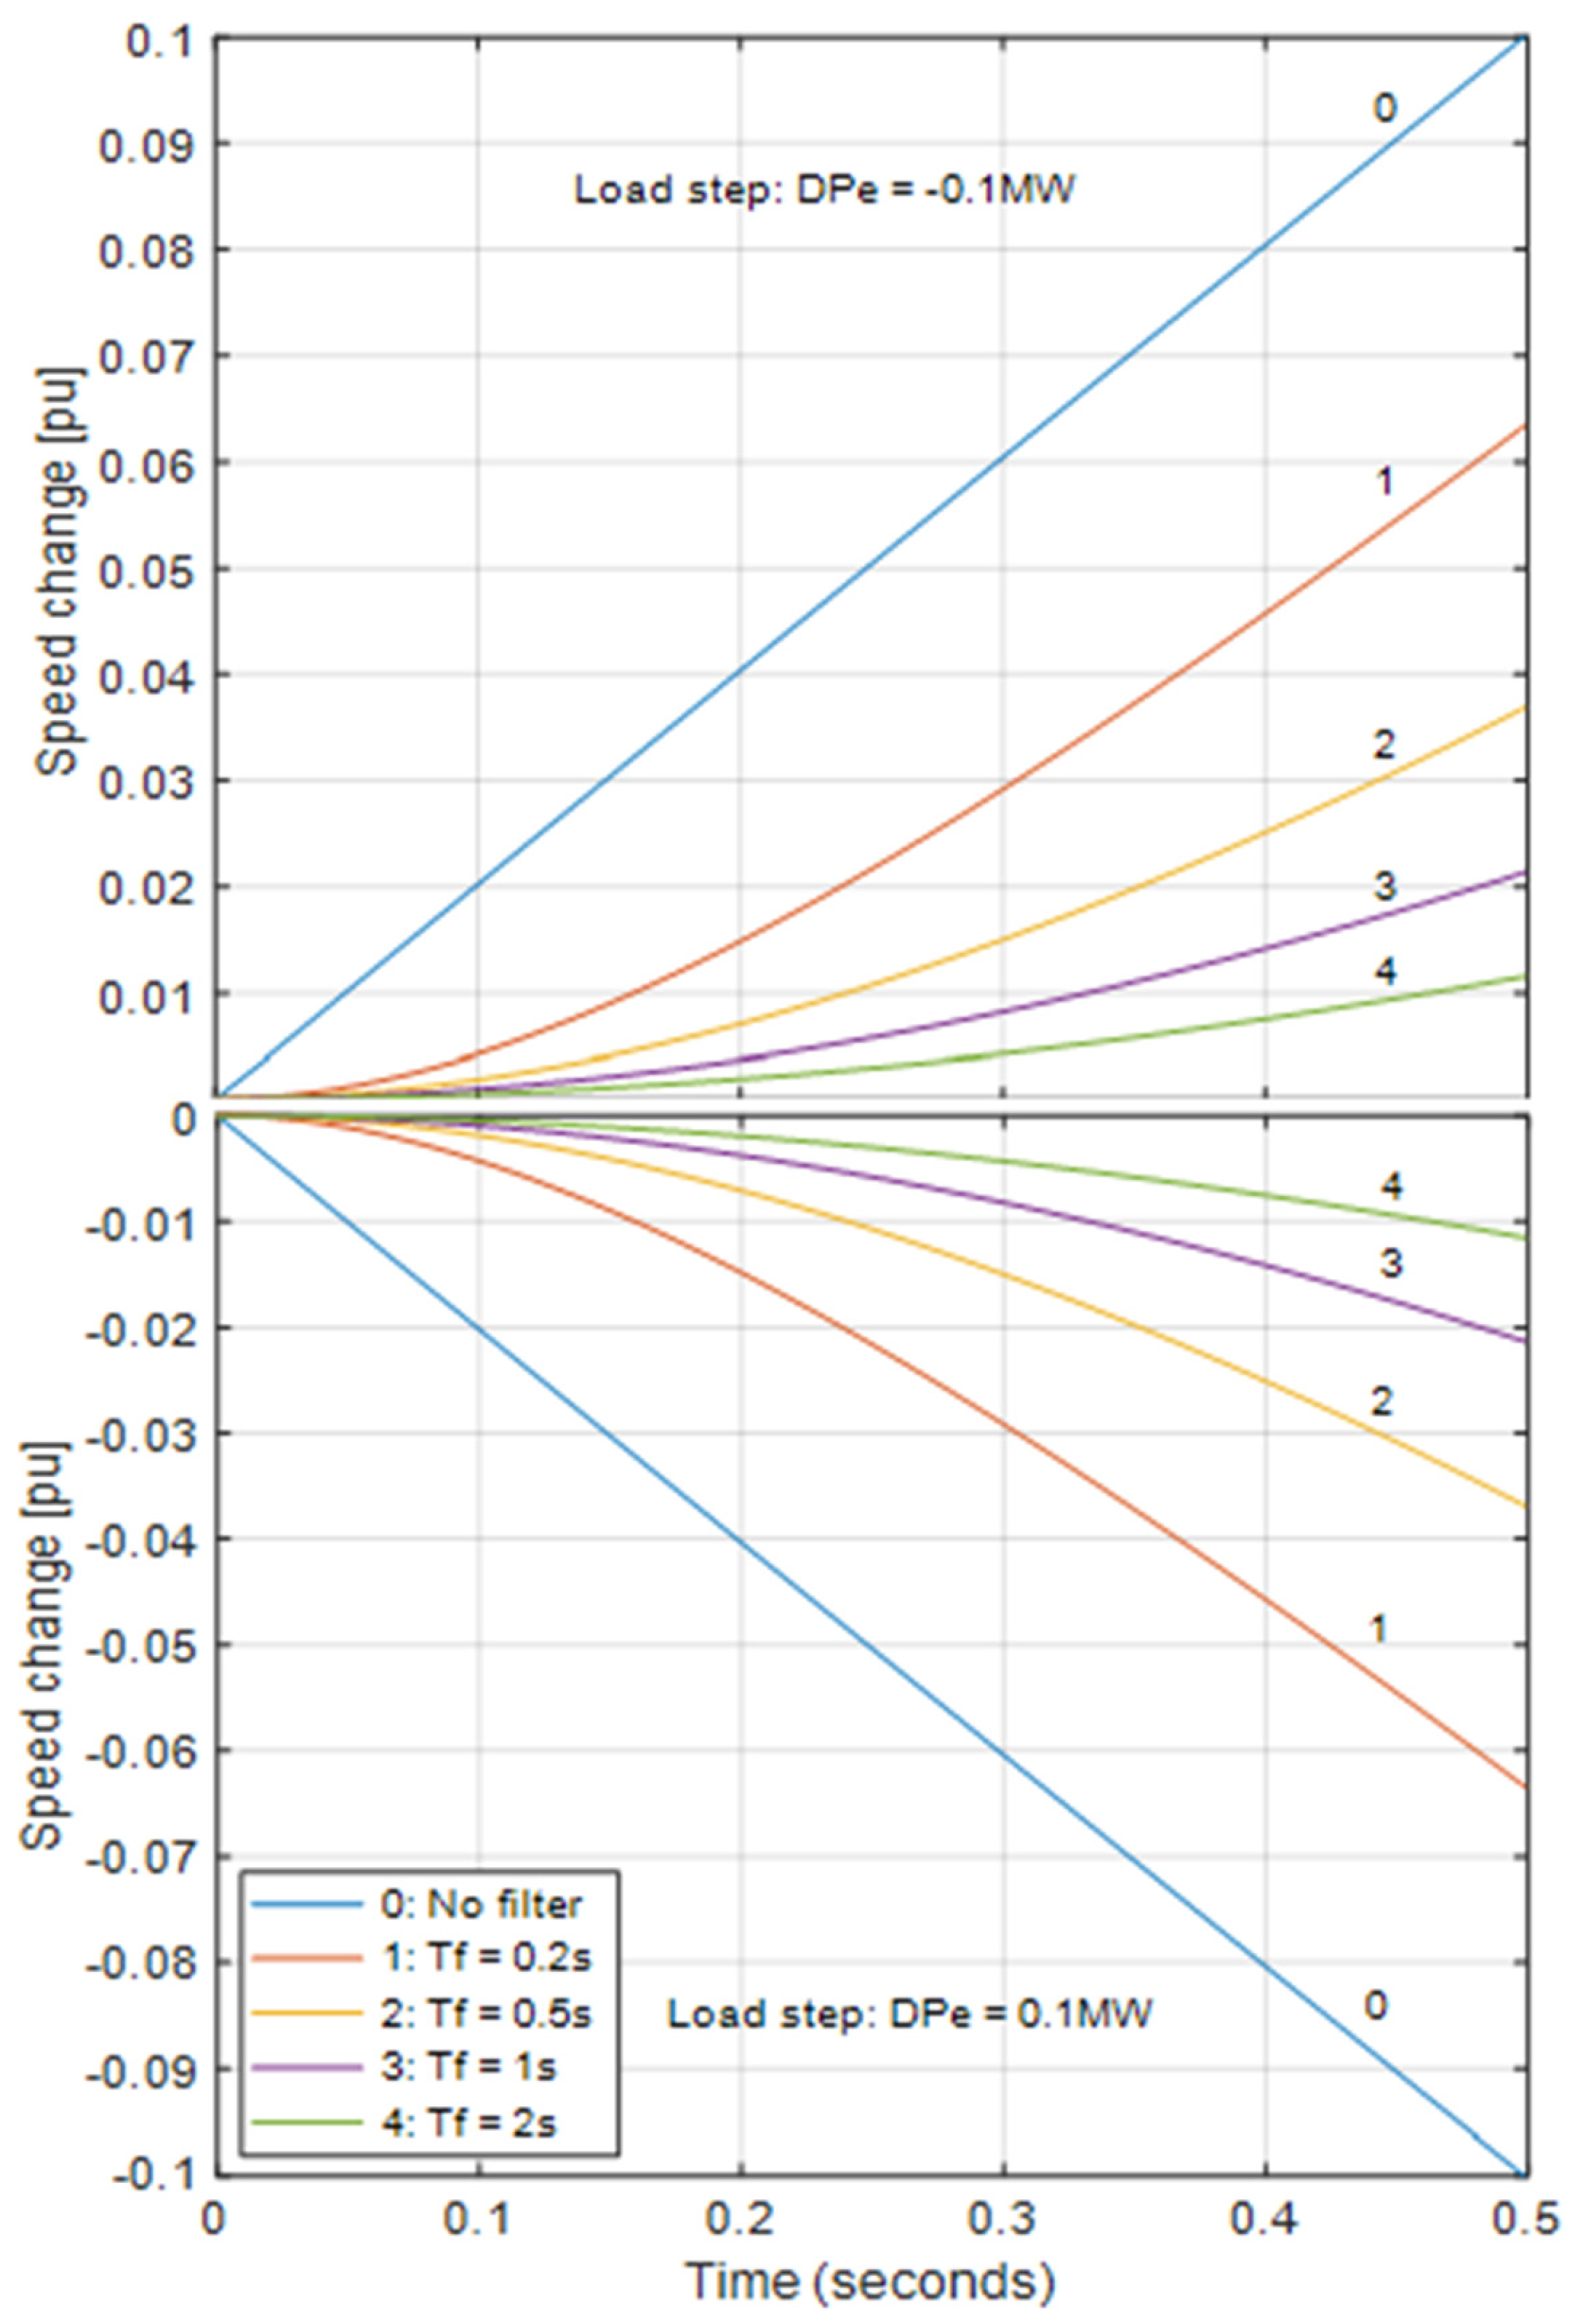
A numerical solution to (28) for the filter time constant can be found for maximum P e , as a worst-case scenario, which limits DEG speed deviation to the allowed range within a period Δ t covering the delay of the DEG speed loop. From the expressions in (28) and (29), speed responses to a ±0.1 MW AC-load step can be predicted at various values of the filter time constant T f , as illustrated via the curves in Figure 7, which can help with (29) in selecting the best value of T f according to specified design and optimisation criteria. It is evident that, the higher the value of the time constant, the lower the speed deviation that results at the period of transient AC-load.

7. System Simulation and Test Results

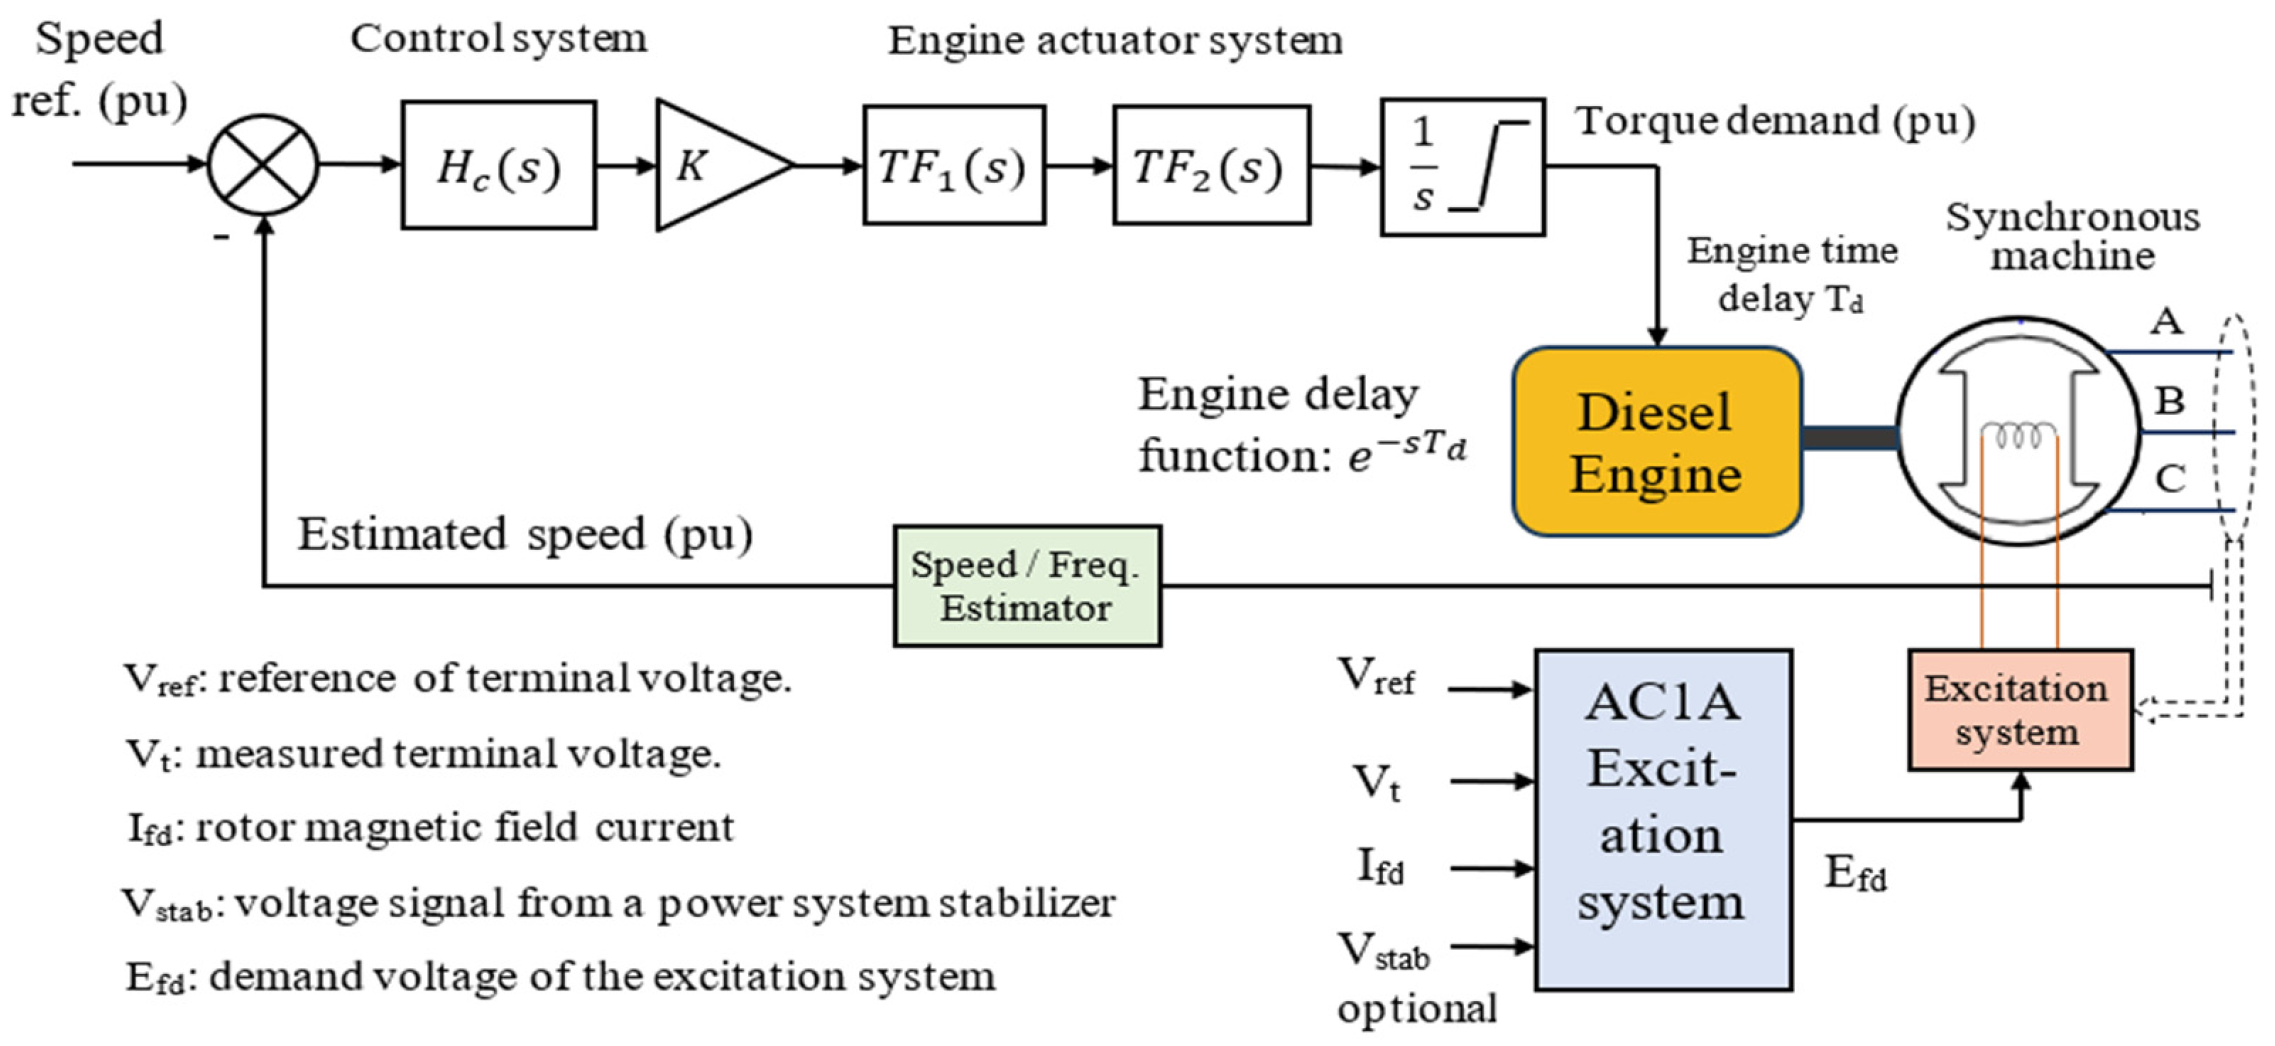
To assess the performance of the proposed VI methods versus those associated with other methods reported in the literature, the AC/DC microgrid depicted in Figure 1 was simulated in continuous time to represent the actual or physical system. The DEG control system considered in the simulated microgrid is illustrated in the block diagram shown in Figure 8, which includes both the DEG speed governor and magnetic-excitation control loops [41,42]. The VI methods, including the proposed ones, were then embedded within the power control unit of the VSC, which can provide a power response-time between 1 ms and 2 ms. Two methods reported in the literature were considered for comparison, namely the standard d f / d t VI method in [30,31], implemented in an external control loop, and the frequency-event VI method in which the VI power was generated using the standard method but applied only when the frequency/speed exceeds certain limits [31]. The block diagram in Figure 9 shows the main elements of these VI methods as embedded within the external control loop of the VSC power controller. The dead-band box shown within the diagram was only utilised for the frequency-event method to detect when frequency/speed hits the pre-determined lower or higher frequency limits, allowing VI provision only outside these limits.
Before performing the tests to obtain the VI results, the functionality of the AC/DC microgrid and its components, including the VSCs and their power controllers, were checked. The structure and specifications given in Section 2 and in Appendix A were considered for obtaining the functionality test results, which are illustrated in Figure 10. The traces in graph (a) represent the microgrid three-phase voltages and their magnitude during VI provision using the standard d f / d t method, whereas graph (b) illustrates the corresponding VSCs’ currents in response to 0.1 pu change in the microgrid load. In graph (c), longer time records of the VSCs’ currents are shown to demonstrate the decaying nature of the produced VI power by the VSCs for mitigating the deviation in the microgrid frequency or DEG speed.
As the model-based and filter-based VI methods rely also on AC-load power measurement, as illustrated in Figure 5 and Figure 6, they were embedded directly within the power control loop of the VSC system, whilst the other VI methods from the literature were inserted in an external speed control loop, as they only rely on speed measurement. When testing all the VI methods, the AC side of the microgrid was subjected to a ±0.1 pu load step of the two DEGs’ nominal power (i.e., ±0.1 MW), and this condition was applied with the same timing sequence for testing each method independently.
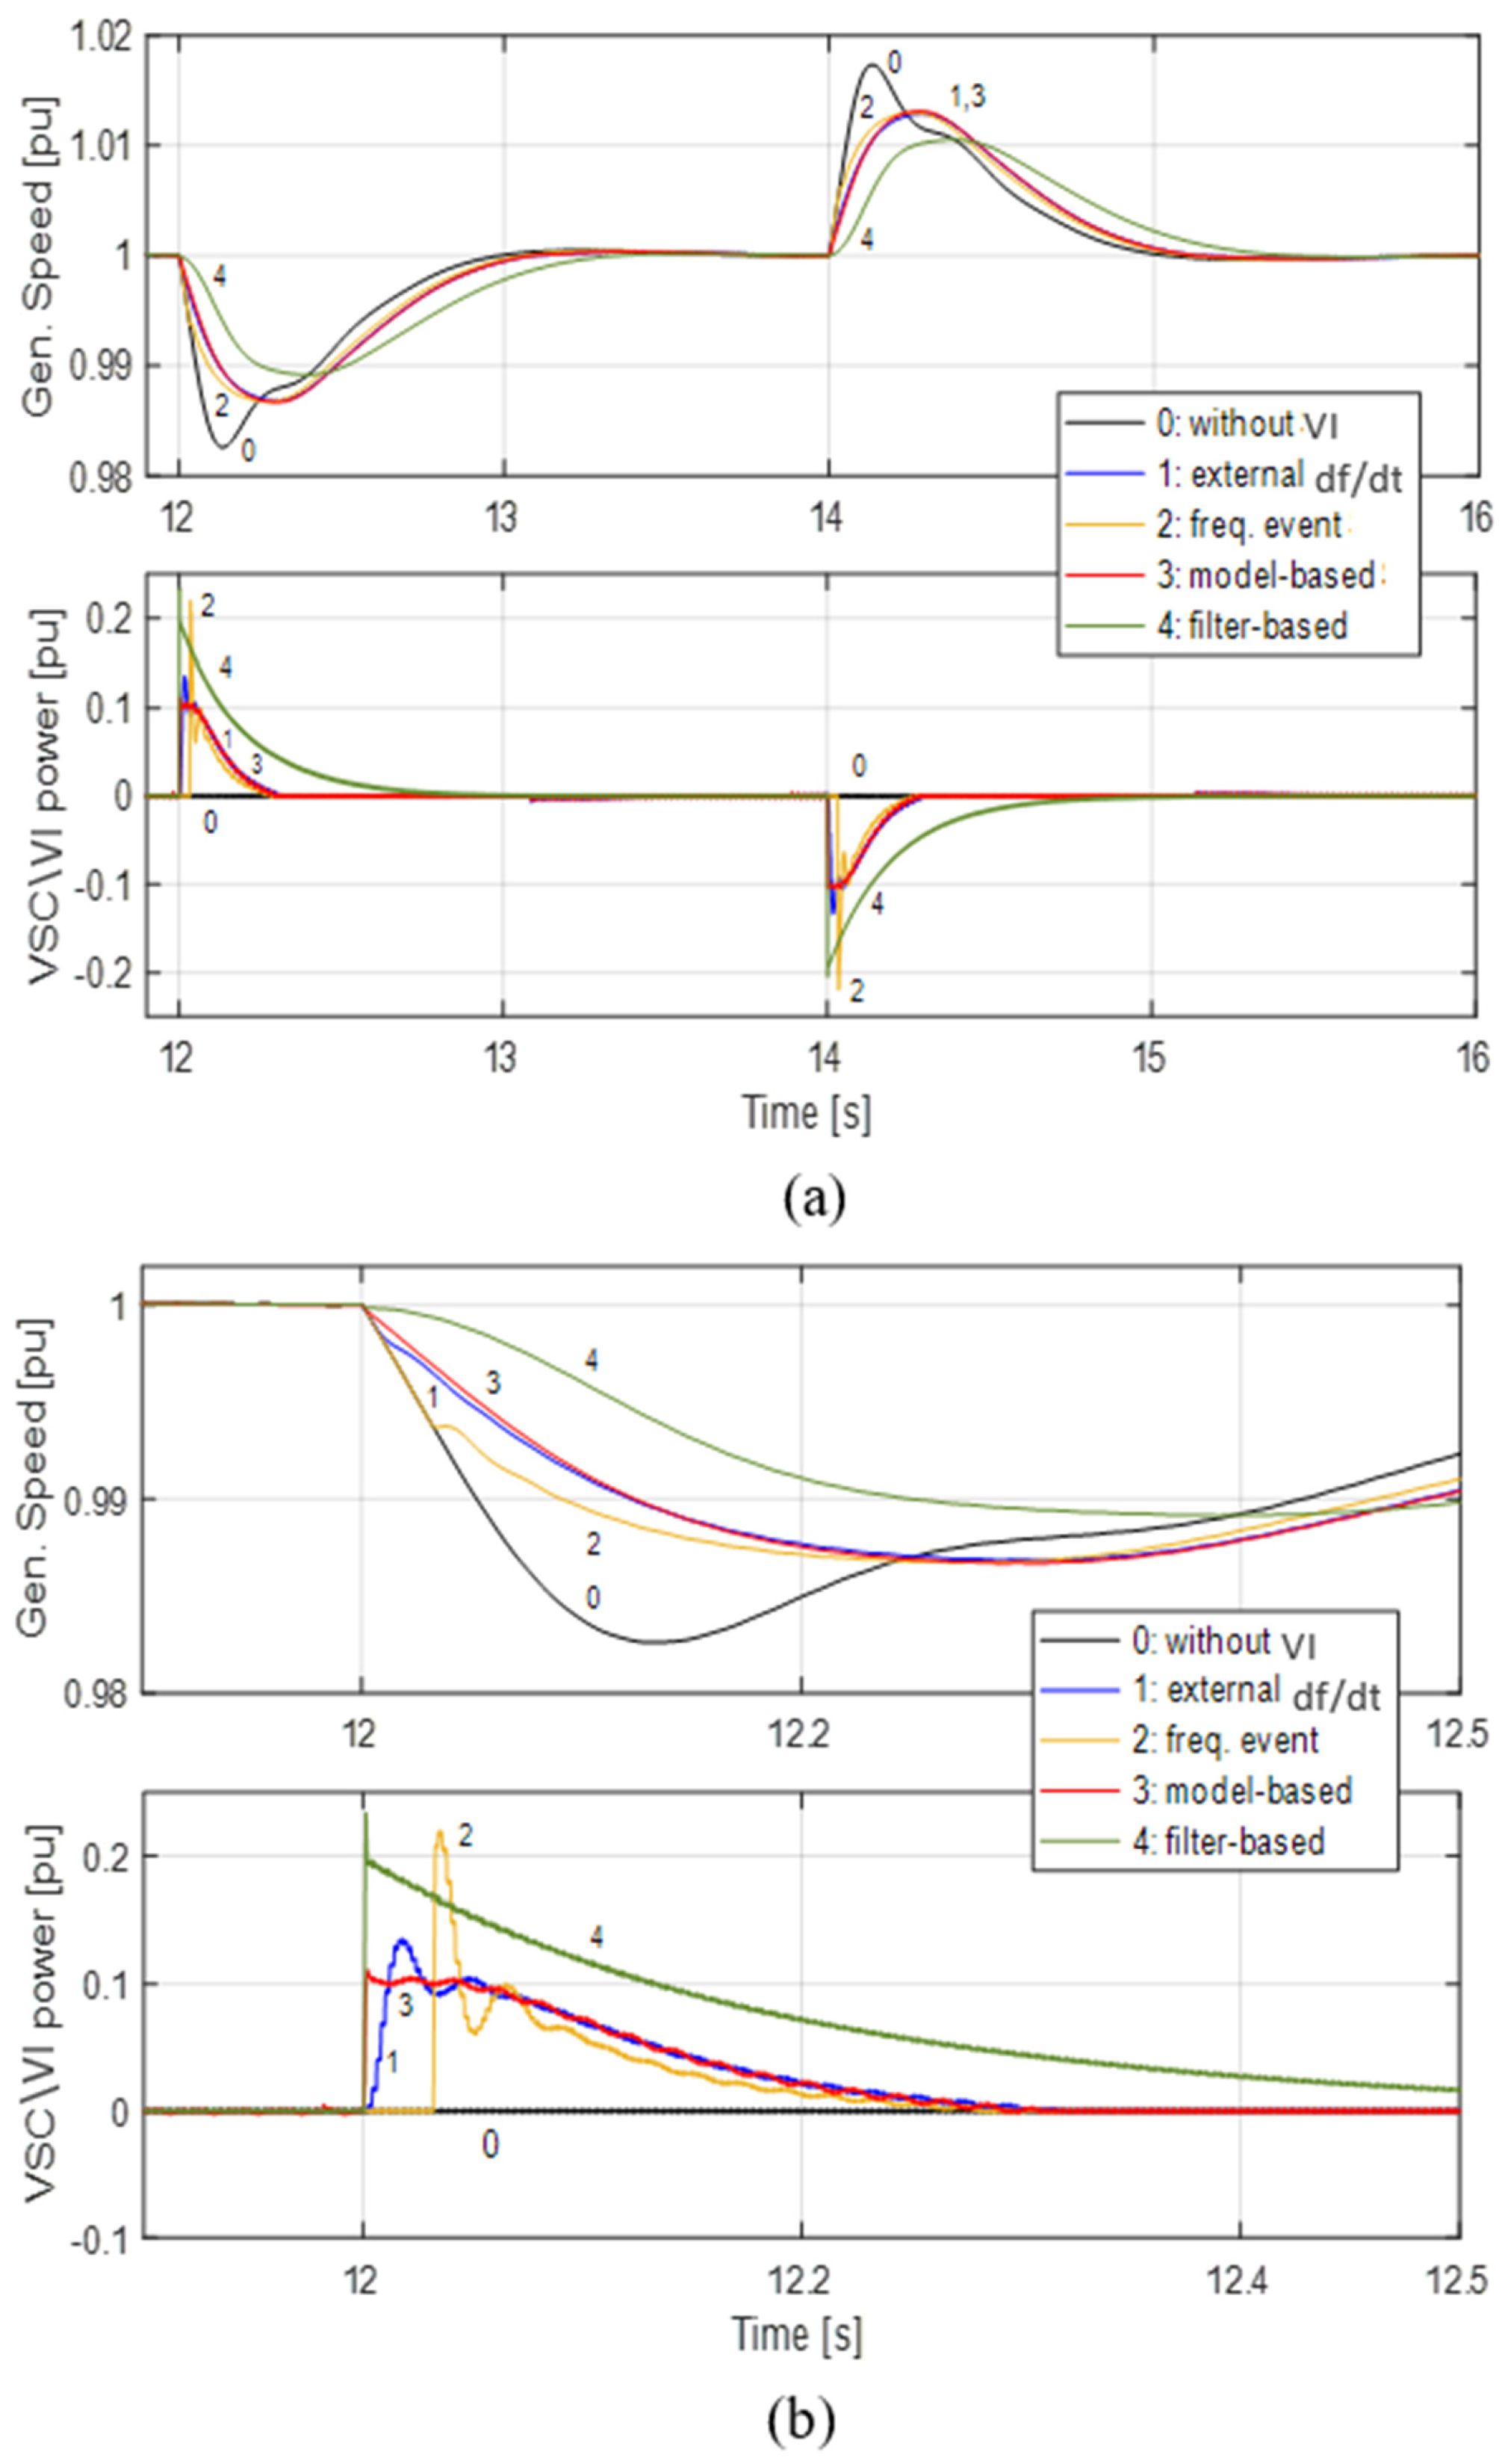
The graphs in Figure 11a show the speed response results and the corresponding VSC power over the timespan 12–16 s, obtained by running the system simulation for all the VI methods. As illustrated, all methods improved the generator’s speed response compared with the response without VI provision, bringing its nadirs and peaks closer to the nominal speed line when the load was stepped up and down by ±0.1 MW (or 0.2 pu of the VSC nominal power) at 12 s and 14 s. The lower two graphs in Figure 11b are expanded sections of the previous graphs and clearly demonstrate that the filter-based method provided the best speed response performance at T f = 0.2 s . However, with this method, the associated VSC power is the highest, which requires more energy to be sourced or stored through the DC-bus. The differences between the proposed model-based method and the other two methods are subtle. The trace representing the speed response without VI shows that the generator speed dropped to a level close to 98% of the nominal speed in response to the 0.1 pu load step. The model-based and standard external VI methods resulted in almost identical responses: the VSC power peak generated by the model-based VI method was limited to approximately ±0.05 pu, whilst the peak power produced by the external VI method reached a level of ±0.063 pu. Therefore, the model-based VI can save part of the VSC VA-power for other necessary demands. The event-based VI method does not compare favourably in this respect. As the VI in this method is activated at speed levels below 0.995 pu and above 1.005 pu, it generated a comparatively high VI power, exceeding 0.1 pu to recover the speed to its set point. Furthermore, this method did not contribute to any reduction in the RoCoF within the speed band from 0.995 to 1.005 pu.
The filter-based VI method (at T f = 0.2 s ) had a superior speed/frequency response compared to the other techniques, and even better results were obtained at higher time constants. This is clearly demonstrated through the simulation results obtained using different values of T f , as shown in Figure 12a. However, VI provision using this method required more drawn energy from the BESS for better speed-response performance at higher T f , which may be considered a disadvantage of the method unless a filter with a relatively low time constant is utilised. As such, the performance of the filter-based VI will be compromised in comparison with the model-based VI method. Figure 12b shows an expanded section of the graphs of Figure 12a. Table 2 details the energy provided through the VSC during the period from 12 s to 14 s when implementing each of the VI methods for comparison. In terms of performance with minimal VSC power and energy, the proposed model-based VI method seems to be a balanced choice for supporting the frequency of the microgrid.

8. Conclusions

This paper has proposed two virtual inertia (VI) methods to support frequency stabilisation for power systems through an AC/DC microgrid utilising a VSC and a battery energy storage system. Firstly, a new non-linear electromechanical model for connecting the VSC to the microgrid was derived and developed to its linearised form for analysing and designing a model-based VI method. A switching function to apply the generated VI power using the VSC, only when the generator’s speed is diverging away from its nominal speed, was introduced and utilised throughout the testing procedures reported in this paper. This function was adopted to prevent the VI power from competing with the action of the DEG governors, which are the main speed/frequency regulator.
An extended simulation of the microgrid and its power system was carried out, where all the proposed VI methods and functions were embedded within the VSC control system for testing and assessment. The performance of each proposed method was compared against other existing VI techniques, namely the standard d f / d t and the frequency-event methods. It was demonstrated through the design and the obtained results that, whilst the proposed filter-based method is easier to realise, with a wider degree of freedom to select the filter time constant for higher performance, the proposed model-based VI method can provide a sufficient performance for speed response, with minimal VI power required by the VSC.

Author Contributions

Conceptualisation, F.H.; methodology, F.H.; software, F.H.; validation, F.H.; R.N.; P.T.; formal analysis, F.H.; investigation, F.H.; resources, F.H. and R.N.; data curation, F.H.; writing—original draft preparation, F.H.; writing—review and editing, F.H. and R.N.; visualisation, F.H.; funding acquisition, F.H. All authors have read and agreed to the published version of the manuscript.

Funding

The first author was sponsored by Newcastle University when he was performing the research and studies reported in this article.

Data Availability Statement

No new data were created or analyzed in this study. Data sharing is not applicable to this article.

Acknowledgments

The research reported in this paper was supported in part by Newcastle University and the University of Birmingham in the UK.

Conflicts of Interest

The authors declare no conflicts of interest.

Nomenclature

BESSBattery energy storage system
DEGDiesel engine generator
DERDistributed energy resource
ESSEnergy storage system
IGBTIntegrated gate bipolar transistor
LPFLow pass filter
NPCNeutral point clamping
OPOperating point
PCCPoint of common coupling
PEPower electronic
PVPhotovoltaic
PWMPulse width modulation
RESRenewable energy source
SISynthetic inertia
VIVirtual inertia
VSCVoltage source converter
H Generator inertia constant [s]
J DEG moment of inertia [kg.m2]
L Connection circuit inductance [Henry]
L e q Equivalent VSC connection inductance [Henry]
N p DEG pole pair number
P VSC active power [W]
P a Generator accelerating power [W]
P e Load electrical power [W]
P l s Power losses of the generators [W]
P m Mechanical power of the generator engines [W]
Q VSC reactive power [VAr]
R Connection circuit resistance [Ohm]
R e q Equivalent VSC connection resistance [Ohm]
S Apparent total power vector of the VSCs [VA]
S m DEG rated power [VA]
T f Filter time constant [s]
V n Per-phase voltage magnitude at the PCC [V]
v d , v q d- and q-axis voltage components at the PCC [V]
τ e q Equivalent time constant of the connected VSCs [s]
ω e Microgrid/system angular frequency [rad/s]
ω m Speed of the DEG [rad/s]

Appendix A

  • The per-unit (PU) base system
  • Base diesel genset power: 1 MVA
  • Base VSC power: 500 kVA
  • Base DC-link voltage Vdc: 1 kV
  • Base network phase voltage: 240 V
  • Base network phase current: 1380 A
  • Base genset speed: 50·π rad/s
  • Voltage Source Converter (VSC)
  • Type: three-phase, three-level, neutral point clamping
  • DC voltage bus: 1000 V
  • Nominal line voltage: 415 V
  • Total nominal power: 0.5 MVA
  • Switching frequency Fc: 2250 Hz
  • Equivalent connection inductance L e q :   0.001 H
  • Equivalent connection resistance R e q :   0.005  
  • Diesel genset unit
  • Nominal line voltage: 415 V
  • Speed: 1500 rpm
  • Nominal frequency: 50 Hz
  • Nominal power: 0.5 MVA
  • Generator Inertia Constant H: 0.247 s
  • Mechanical moment of inertia J: 10 kg/m2
  • Considered average power losses Pls: 10 kW.
  • Generator constant K H :   4.05 × 10 6
  • Speed governor control functions and parameters:
  • H c s = 1 + 0.2 s 1 + 0.01 s + 0.0002 s 2 ,
  • K = 40 ,
  • T F 1 s = 1 + 0.25 s 1 + 0.009 s ,
  • T F 2 s = 1 1 + 0.0384 s ,
  • T d = 0.024 .

Appendix B

  • Calculation for RLC components of network single-tuned shunt-filter
  • Tuning frequency: f n = 1 2 π 1 L   C ,
  • Filter quality factor: Q = 2 π   f n L R ,
  • Filter frequency bandwidth: B = f n Q ,
  • Generated reactive power at fundamental (grid) frequency f 1 : Q c = 2 π   f 1 C   V 2 n 2 n 2 1 where n = f n / f 1 and V is the nominal applied voltage to the filter terminals.
  • Filter designed at f n equivalent to four times of the converter switching frequency F c :
  • Given per-phase V = 240   V (Y connected three-phase filter), f 1 = 50   H z , n = 180 , Q = 50 , and considering C = 1   μ F , gives: L = 0.3127   m H , R = 0.354   ; reduced impedance at a frequency equivalent to four times the converter switching frequency due to parallel connection of four interleaved converters.

References

  1. Hatziargyriou, N.; Asano, H.; Iravani, R.; Marnay, C. Microgrids. IEEE Power Energy Mag. 2007, 5, 78–94. [Google Scholar] [CrossRef]
  2. Hirsch, A.; Parag, Y.; Guerrero, J. Microgrids: A review of technologies, key drivers, and outstanding issues. Renew. Sustain. Energy Rev. 2018, 90, 402–411. [Google Scholar] [CrossRef]
  3. AbdelHady, R. Modeling and simulation of a micro grid-connected solar PV system. Water Sci. 2017, 31, 1–10. [Google Scholar] [CrossRef]
  4. Yukita, K. AC/DC microgrids. In Integration of Distributed Energy Resources in Power Systems: Implementation, Operation and Control; Funabashi, T., Ed.; Academic Press: Cambridge, MA, USA, 2016; pp. 236–260. [Google Scholar]
  5. Jiang, Q.; Xue, M.; Geng, G. Energy Management of Microgrid in Grid-Connected and Stand-Alone Modes. IEEE Trans Power Syst. 2013, 28, 3380–3389. [Google Scholar] [CrossRef]
  6. Ortiz, L.; Orizondo, R.; Águila, A.; González, J.W.; López, G.J.; Isaac, I. Hybrid AC/DC microgrid test system simulation: Grid-connected mode. Heliyon 2019, 5, e02862. [Google Scholar] [CrossRef] [PubMed]
  7. Navarro-Rodríguez, Á.; García, P.; Gómez-Aleixandre, C.; Blanco, C. Cooperative Primary Control of a Hybrid AC/DC Microgrid Based on AC/DC Virtual Generators. IEEE Trans. Energy Convers. 2022, 37, 2837–2850. [Google Scholar] [CrossRef]
  8. Hu, J.; Shan, Y.; Xu, Y.; Guerrero, J.M. A coordinated control of hybrid ac/dc microgrids with PV-wind-Battery under variable generation and load conditions. Int. J. Electr. Power Energy Syst. 2019, 104, 583–592. [Google Scholar] [CrossRef]
  9. Mahmoud, M. (Ed.) MICROGRID—Advanced Control Methods and Renewable Energy System Integration, 1st ed.; Butterworth-Heinemann: Oxford, UK, 2016; ISBN 9780081017531. [Google Scholar]
  10. Chen, Y.; Zhao, S.; Li, Z.; Wei, X.; Kang, Y. Modeling and Control of the Isolated DC–DC Modular Multilevel Converter for Electric Ship Medium Voltage Direct Current Power System. IEEE J. Emerg. Sel. Top. Power Electron. 2017, 5, 124–139. [Google Scholar] [CrossRef]
  11. Eajal, A.A.; Shaaban, M.F.; Ponnambalam, K.; El-Saadany, E.F. Stochastic Centralized Dispatch Scheme for AC/DC Hybrid Smart Distribution Systems. IEEE Trans. Sustain. Energy 2016, 7, 1046–1059. [Google Scholar] [CrossRef]
  12. Khatibi, M.; Ahmed, S. Impact of Distributed Energy Resources on Frequency Regulation of the Bulk Power System. In Proceedings of the IEEE Conference on Power Electronics and Renewable Energy (CPERE), Aswan, Egypt, 23–25 October 2019. [Google Scholar] [CrossRef]
  13. Bose, U.; Chattopadhyay, S.K.; Chakraborty, C.; Pal, B. A Novel Method of Frequency Regulation in Microgrid. IEEE Trans. Ind. Appl. 2019, 55, 111–121. [Google Scholar] [CrossRef]
  14. Zhang, Y.; Sun, Q.; Zhou, J.; Li, L.; Wang, P.; Guerrero, J.M. Coordinated Control of Networked AC/DC Microgrids With Adaptive Virtual Inertia and Governor-Gain for Stability Enhancement. IEEE Trans. Energy Convers. 2021, 36, 95–110. [Google Scholar] [CrossRef]
  15. Rapizza, M.R.; Canevese, S.M. Fast frequency regulation and synthetic inertia in a power system with high penetration of renewable energy sources: Optimal design of the required quantities. Sustain. Energy Grids Netw. 2020, 24, 100407. [Google Scholar] [CrossRef]
  16. Skiparev, V.; Machlev, R.; Chowdhury, N.R.; Levron, Y.; Petlenkov, E.; Belikov, J. Virtual Inertia Control Methods in Islanded Microgrids. Energies 2021, 14, 1562. [Google Scholar] [CrossRef]
  17. Mandal, R.; Chatterjee, K. Virtual inertia emulation and RoCoF control of a microgrid with high renewable power penetration. Electr. Power Syst. Res. 2021, 194, 107093. [Google Scholar] [CrossRef]
  18. Kerdphol, T.; Rahman, F.S.; Watanabe, M.; Mitani, Y. Robust Virtual Inertia Control of a Low Inertia Microgrid Considering Frequency Measurement Effects. IEEE Access 2019, 7, 57550–57560. [Google Scholar] [CrossRef]
  19. Ali, H.; Magdy, G.; Li, B.; Shabib, G.; Elbaset, A.A.; Xu, D.; Mitani, Y. A New Frequency Control Strategy in an Islanded Microgrid Using Virtual Inertia Control-Based Coefficient Diagram Method. IEEE Access 2019, 7, 16979–16990. [Google Scholar] [CrossRef]
  20. Fini, M.H.; Hamedani Golshan, M.E. Determining optimal virtual inertia and frequency control parameters to preserve the frequency stability in islanded microgrids with high penetration of renewables. Electr. Power Syst. Res. 2018, 154, 13–22. [Google Scholar] [CrossRef]
  21. Farmer, W.J.; Rix, A.J. Optimising Power System Frequency Stability Using Virtual Inertia from Inverter-based Renewable Energy Generation. IET Renew. Power Gener. 2020, 14, 2820–2829. [Google Scholar] [CrossRef]
  22. Michael, N.E.; Hasan, S.; Mishra, S. Virtual inertia provision through data centre and electric vehicle for ancillary services support in microgrid. IET Renew. Power Gener. 2020, 14, 3792–3801. [Google Scholar] [CrossRef]
  23. Marchgraber, J.; Alács, C.; Guo, Y.; Gawlik, W.; Anta, A.; Stimmer, A.; Lenz, M.; Froschauer, M.; Leonhardt, M. Comparison of Control Strategies to Realize Synthetic Inertia in Converters. Energies 2020, 13, 3491. [Google Scholar] [CrossRef]
  24. Zhang, Y.; Melin, A.M.; Djouadi, S.M.; Olama, M.M.; Tomsovic, K. Provision for Guaranteed Inertial Response in Diesel-Wind Systems via Model Reference Control. IEEE Trans. Power Syst. 2018, 33, 6557–6568. [Google Scholar] [CrossRef]
  25. Lerch, K.S.; Kerdphol, T.; Mitani, Y.; Turschner, D. Frequency Stability Assessment on Virtual Inertia Control Strategy in Connected and Islanded Multi-Area Power Systems. In Proceedings of the IEEE International Conference on Environment and Electrical Engineering and IEEE Industrial and Commercial Power Systems Europe (EEEIC/I&CPS Europe), Madrid, Spain, 9–12 June 2020. [Google Scholar] [CrossRef]
  26. Kerdphol, T.; Rahman, F.; Mitani, Y.; Hongesombut, K.; Küfeoğlu, S. Virtual Inertia Control-Based Model Predictive Control for Microgrid Frequency Stabilization Considering High Renewable Energy Integration. Sustainability 2017, 9, 773. [Google Scholar] [CrossRef]
  27. Wang, Y.; Wang, C.; Xu, L.; Meng, J.; Hei, Y. Adjustable Inertial Response from the Converter With Adaptive Droop Control in DC Grids. IEEE Trans. Smart Grid 2019, 10, 3198–3209. [Google Scholar] [CrossRef]
  28. Samanta, S.; Prakash Mishra, J.; Krishna Roy, B. Implementation of a virtual inertia control for inertia enhancement of a DC microgrid under both grid connected and isolated operation. Comput. Electr. Eng. 2019, 76, 283–298. [Google Scholar] [CrossRef]
  29. Brisebois, J.; Aubut, N. Wind Farm Inertia Emulation to Fulfil Hydro-Quebec’s Specific Need. In Proceedings of the 2011 IEEE Power and Energy Society General Meeting, Detroit, MI, USA, 24–28 July 2011. [Google Scholar] [CrossRef]
  30. Hardan, F.; Norman, R. Balancing loads of rotating generators utilizing VSC direct power controllers in a ship AC/DC smartgrid. Electr. Power Syst. Res. 2020, 182, 106200. [Google Scholar] [CrossRef]
  31. Duckwitz, D.; Fischer, B. Modeling and Design of df/dt-Based Inertia Control for Power Converters. IEEE J. Emerg. Sel. Top. Power Electron. 2017, 5, 1553–1564. [Google Scholar] [CrossRef]
  32. Liu, H.; Chen, Z. Contribution of VSC-HVDC to frequency regulation of power systems with offshore wind generation. IEEE Trans. Energy Convers. 2015, 30, 918–926. [Google Scholar] [CrossRef]
  33. Gloe, A.; Jauch, C.; Cracium, B.; Winkelmann, J. Continuous provision of synthetic inertia with wind turbines: Implications for the wind turbine and for the grid. IET Renew. Power Gener. 2019, 13, 668–675. [Google Scholar] [CrossRef]
  34. Rodriguez, J.; Lai, J.S.; Peng, F.Z. Multilevel inverters: A survey of topologies, controls, and applications. IEEE Trans. Ind. Electron. 2002, 49, 724–738. [Google Scholar] [CrossRef]
  35. Bloemink, J.M.; Green, T.C. Reducing passive filter sizes with tuned traps for distribution level power electronics. In Proceedings of the 14th European Conference on Power Electronics and Applications, Birmingham, UK, 30 August–1 September 2011. [Google Scholar]
  36. Rashid, M.H. Power Electronics: Devices, Circuits, and Applications, International Edition, 4th ed.; Pearson Education Limited: Essex, UK, 2014. [Google Scholar]
  37. Glover, J.D.; Sarma, M.S.; Overbye, T.J. Transient Stability. In Power System Analysis and Design, 5th ed.; Stamford, C.T., Ed.; Cengage Learning: Boston, MA, USA, 2012. [Google Scholar]
  38. Hardan, F.; Bleijs, J.A.M.; Jones, R.; Bromley, P. Bi-directional power control for flywheel energy storage system with vector-controlled induction machine drive. In Proceedings of the Seventh International Conference on Power Electronics and Variable Speed Drives (IEE Conf. Publ. No. 456), London, UK, 21–23 September 1998. [Google Scholar] [CrossRef]
  39. Jin, Z.; Meng, L.; Guerrero, J.M.; Han, R. Hierarchical Control Design for a Shipboard Power System with DC Distribution and Energy Storage Aboard Future More-Electric Ships. IEEE Trans. Ind. Inform. 2018, 14, 703–714. [Google Scholar] [CrossRef]
  40. Xiao, Z.; Li, H.; Fang, H.; Guan, Y.; Liu, T.; Hou, L.; Guerrero, J.M. Operation Control for Improving Energy Efficiency of Shipboard Microgrid Including Bow Thrusters and Hybrid Energy Storages. IEEE Trans. Transp. Electrif. 2020, 6, 856–868. [Google Scholar] [CrossRef]
  41. Song, Q.; Grigoriadis, K.M. Diesel engine speed regulation using linear parameter varying control. In Proceedings of the American Control Conference, Denver, CO, USA, 4–6 June 2003. [Google Scholar] [CrossRef]
  42. 421.5-2016; IEEE Recommended Practice for Excitation System Models for Power System Stability Studies. (Revision of IEEE 521.5-1992). IEEE Standard: Piscataway, NJ, USA, 2005; Volume 421.
Figure 1. The proposed structure of the studied AC/DC microgrid.
Electronics 14 00091 g001
Figure 2. (a) Structure of the utilised VSC, including its network interface equivalent circuit. (b) Representation of the VSCs as paralleled voltage sources. (c) Equivalent voltage source of the VSCs.
Electronics 14 00091 g002aElectronics 14 00091 g002b
Figure 3. (a) Frequency responses of the VSC active power deviation P using g 11 s and g 12 s , (b) the corresponding step responses with unit steps of inputs D v d and D v q .
Electronics 14 00091 g003
Figure 4. (a) Frequency responses of generator speed via g 31 s , g 32 s ,   a n d   g 33 s , (b) the corresponding step responses of the speed with unit steps of inputs D v d and D v q .
Electronics 14 00091 g004
Figure 5. Simplified block diagram of the proposed model-based VI method and its switching mechanism.
Electronics 14 00091 g005
Figure 6. Proposed structure of the filter-based VI method for generating a VI power demand.
Electronics 14 00091 g006
Figure 7. Predicted speed responses to P e = ± 0.1   M W AC-load step at various values of the filter time constant.
Electronics 14 00091 g007
Figure 8. Block diagram of the control system of the diesel engine generator considered for testing the VI methods.
Electronics 14 00091 g008
Figure 9. Block diagram of the standard external VI method, including frequency dead-band as an event detector, in addition to the switching function SW.
Electronics 14 00091 g009
Figure 10. (a) Microgrid three-phase voltages and their magnitude during VI provision using the standard d f / d t method, (b) corresponding VSCs’ current waveforms, and (c) the same VSCs’ current waveforms decaying over a longer timespan after a 0.1 pu change in the microgrid load.
Electronics 14 00091 g010
Figure 11. (a) Speed responses and their VSC power obtained for all VI methods (filter method at T f = 0.2 s ). (b) Expanded sections of graphs in (a).
Electronics 14 00091 g011
Figure 12. (a) Speed responses and their VSC power when using the filter-based VI method at various values of time-constant T f . (b) Expanded sections of graphs in (a).
Electronics 14 00091 g012
Table 1. Gain and phase margins of the system transfer functions.
FunctionGain MarginFreq. [rad/s]Phase MarginFreq. [rad/s]
g 11 s g 22 ( s ) inf. (1)n/a (2)90500 K
g 12 ( s ) inf.inf.0.1813 K
g 21 ( s ) 0.00060−18013 K
g 31 ( s ) inf.inf.inf.n/a
g 32 ( s ) 78314.894.50.51
g 33 ( s ) inf.n/ainf.n/a
(1) infinite, (2) not applicable.
Table 2. The energies in [MJ] provided by the VSC during the period from 12 s to 14 s for all the virtual VI methods.
T f [s]Filter-BasedModel-Based External   d f / d t Frequency Event
0.20.019530.0070.0070.005
0.50.04813
1.00.08508
2.00.12477
Disclaimer/Publisher’s Note: The statements, opinions and data contained in all publications are solely those of the individual author(s) and contributor(s) and not of MDPI and/or the editor(s). MDPI and/or the editor(s) disclaim responsibility for any injury to people or property resulting from any ideas, methods, instructions or products referred to in the content.