Article

An Objective Effect Evaluation Framework for Vectorization Models on Patent Semantic Similarity Measurement

1
Key Laboratory of Intelligent Information Processing, Institute of Computing Technology, Chinese Academy of Sciences, Beijing 100190, China
2
University of Chinese Academy of Sciences, Beijing 101408, China
3
National Science Library, Chinese Academy of Sciences, Beijing 100190, China
4
College of Computer Engineering, Jimei University, Xiamen 361021, China
*
Author to whom correspondence should be addressed.
Electronics 2025, 14(20), 4056; https://doi.org/10.3390/electronics14204056
Submission received: 18 September 2025 / Revised: 7 October 2025 / Accepted: 13 October 2025 / Published: 15 October 2025

Abstract

How to objectively evaluate the effect of different vectorization models in measuring similarity between patents is a fundamental issue, which can help to select high-performance vectorization models to support advanced patent services. Based on the rank consistency index and hypothesis testing approach, a framework for evaluating the effect of different vectorization models on patents’ similarity is proposed based on whether the model can accurately predict the similarity ranking of patents. Integrating the factors of time and technical field, an empirical study is conducted under the proposed framework to objectively evaluate the effect of six mainstream text vectorization models for assessing the semantic similarity of patents, which is evaluated based on Chinese patents (English Translation) from 2010 to 2024. The results show that the performance of Llama 2 is the best among six compared models in all years and in all technical fields. The proposed framework can objectively evaluate the similarity measurement effect of different vectorization models and provides a basis for the selection of the vectorization model for patent semantic similarity measurement for advanced patent services.

1. Introduction

Patent semantic similarity measurement can reveal the semantic relations between patents and is the basis for patent analysis such as patent search, patent classification and clustering, patent map drawing, and patent value assessment [1].
Existing patent text similarity measurement approaches can be classified into three categories: (1) approaches based on co-occurrence words [2,3], i.e., measure the similarity of texts through terms that co-occur in the texts based on their weight (e.g., word frequency); (2) approaches based on semantic tuples [3], i.e., measure the similarity of texts through analyzing the similarity of concepts, entities, and their relations (e.g., subject-verb–object tuples, verb–object tuples, and function–object–attribute tuples); and (3) approaches based on vectorization representation [4,5,6], i.e., by converting the text into a vector by a vectorization model, measuring the similarity of texts through the cosine similarity of their vectors. As the vectorization representation approach can more comprehensively characterize the semantics of text and has more advantages in large-scale data processing, it has been widely used in patent text analysis to measure patent semantic similarity recently.
Furthermore, the evaluation approaches of patent semantic similarity measurement can be divided into three categories, namely: (1) text classification tasks [7], i.e., better classification metrics (e.g., AUC) reflecting a better effect on text similarity measurement; (2) text clustering tasks [8], i.e., better clustering metrics (e.g., ARI) reflecting a better effect on text similarity measurement; and (3) query tasks [9], i.e., better metrics for evaluating the query results (e.g., MRR) reflecting a better effect on text similarity measurement. Existing approaches rely on the manual setting of thresholds and data annotations. For example, researchers subjectively regard two texts with a greater than 0.6 similarity as strongly similar according to their experience [10]. However, the manual threshold varies using different vectorization models and weakens the objectivity of the evaluation on patent semantic similarity.
To address this issue, this paper proposes an evaluation framework based on the rank consistency index (RCI) and hypothesis testing approach, which aims to comprehensively evaluate the effects of different vectorization models in patent text similarity measurement. It specifically consists of three steps: (1) construct a patent semantic similarity evaluation dataset based on the patents divided by years and technical fields. The dataset is automatically constructed with the idea that the patents with the same classification level (e.g., International Patent Classification, IPC) have higher text similarity. (2) Evaluate the effect of each vectorization model in patent similarity measurement based on the RCI on individual data (i.e., one target patent and its compared patents). The RCI measures the difference between the model predicted and gold standard patent rankings. (3) Evaluate the effect of different vectorization models based on the statistical hypothesis testing of their RCIs. A model is considered significantly better than others if a statistical test confirms that its RCI distribution is significantly higher than those of the other models.
The advantages of the proposed effect evaluation framework on patent similarity measurement are as follows: (1) More comprehensive comparisons of vectorization models, as the evaluation dataset is constructed by integrating the factors of time and technical field; (2) Better interpretability of evaluation, as the effects of different vectorization models are evaluated based on the interpretable RCI and statistical hypothesis testing; and (3) Improved objectivity of evaluation, as the framework forms the evaluation of similarity measurements into the ranking task, which does not require any manual thresholds or rules comparing with previous classification, clustering, or query tasks.

2. Related Works

2.1. Vectorization Approaches of Patent Text

The existing vectorization approaches of patent text for advanced patent information services are mainly divided into three categories: (1) the traditional model, (2) pre-trained language model (PLM), and (3) large language model (LLM).
Traditional models consist of the vector space model (VSM) and static word vector model. The VSM uses high-dimensional discrete vectors to represent patents, e.g., the TFIDF vector. Static word vector models (e.g., Word2Vec [11]) use continuous low-dimensional distributional vectors to represent words. The vector of a patent is represented by the average value of the word vectors of the words that appear in the patent. For example, one approach integrates the TFIDF vector and the static word vector model to form a new patent vector by treating the TFIDF value of each word as the weight of its corresponding word vector [12]. Some other approaches also use the Doc2Vec model to vectorize the patent [13].
PLMs rely on a transformer-based-architecture network trained in large-scale corpora to vectorize patent texts, which often use the output vector of the last layer as the semantic representation of the input text [14]. For example, some approaches use text convolutional neural networks (CNNs), bidirectional long short-term memory (Bi-LSTM) [15], Bert, RoBerta [16], and Sentence-Bert [17] to vectorize content of patents to measure the similarity of them.
An LLM expands the scale and complexity of the pre-training process to enhance the generalization and understanding capabilities of the PLM model, e.g., GPT3.5, GPT4, and Llama 2. Some attempts use LLMs (e.g., the text-embedding-ada-002 model [18] and fine-tuned Llama 2 model [19]) instead of PLMs to vectorize text to obtain more accurate text representation.

2.2. Approaches to Comparative Evaluation of Patent Semantic Similarity

For the comparative evaluation of patent semantic similarity, one way is to use the effects of different vectorization models on the classification task of distinguishing similar and non-similar patents to evaluate the patent semantic similarity measurement of the vectorization model. The model with better classification metrics (e.g., AUC, precision, recall, and F1-score) demonstrates a more accurate text similarity measurement. For example, one approach uses a self-built binary classification dataset based on USPTO data to compare the effects of TFIDF, LSI, and Doc2Vec models on patent text measurement based on the AUC metric [7]. The experimental results show that the TFIDF model performs well on short texts, but on long texts such as patents, the LSI and Doc2Vec models are better than the TFIDF model. However, this approach has the following shortcomings: (1) evaluating the vectorization model only through binary classification is not enough for advanced patent services, e.g., patent retrieval, as the granularity of positive/negative labels is too coarse to identify the order of similar patents; (2) the construction of the dataset relies on 102 rejection cases issued by the USPTO, where there is a doubt on whether the conclusions can be generalized to the patents on other technical fields; and (3) there is a lack of comparison of the PLM and LLM.
Except for the text classification task, some other approaches use the effect of different vectorization models on text clustering to evaluate their patent semantic similarity measurement. As the core of text clustering is text similarity measurement, a better vectorization model will lead to better vector representation to obtain a more accurate text similarity measurement, leading to better clustering results [20]. For example, one approach compares the effects of different vectorization models on text clustering based on a small scientific literature dataset, where GPT-3.5 outperforms all of the compared vectorization models include TFIDF, Bert, Llama 2, and Falcon [8]. However, TFIDF also performs better than the embedding-based models in some domains of patent texts [21]. An automatic framework for evaluating the effect of different vectorization models is needed.
In summary, most of the existing approaches focus on specific technical fields and do not consider the time factor. It remains to be explored whether the conclusions drawn in the specific technical field can be generalized to other technical domains or different time periods.
Different from existing evaluation approaches such as the binary classification task, this paper uses the IPC classification hierarchy of patent data, based on the idea that patent semantic similarities are higher under the same IPC classification level, and uses the patent similarity ranking task to replace the text classification task to comparatively evaluate the patent semantic similarity of different vectorization models. The proposed framework avoids the intervention of manually setting thresholds and enhances the objectivity of evaluation results. And in the empirical study, this paper integrates the factors of technical field and time, comprehensively verifying the similarity measurement effect of different vectorization models based on the proposed evaluation framework.

3. Framework

The overall framework for patent semantic similarity measurement effect evaluation is shown in Figure 1, which consists of the following three steps:
(1) Construction of evaluation dataset, which aims to construct an evaluation dataset for patent semantic similarity measurement from large-scale patent data, consisting of a set of target patents and its compared patents, denoted as x i i = 1 N , where x i = p i , p i j j = 1 m , p i is the target patent, and p i j j = 1 m is the compared patents of p i , which are sorted in ascending order of similarity to p i . The gold standard rankings of p i j j = 1 m are denoted as R p i , p i j j = 1 m and R p i , p i j = j , which is used to evaluate the effects of different vectorization models on patent similarity measurement.
(2) Rank consistency measurement aims to evaluate the effectiveness of the vectorization model in measuring the similarity of one evaluation pair (i.e., x i ). For each evaluation pair, the rank consistency index (RCI) quantifies the agreement between the model-predicted similarity ranking and the human-annotated (gold standard) ranking. A higher RCI indicates stronger consistency, and thus a better ability of the vectorization model to measure similarity. Specifically, for a target patent p i , the vectorization model M computes similarity scores with its m compared patents { p i 1 , p i 2 , , p i m } . Sorting these scores in ascending order (i.e., lower score = less similar) yields a predicted similarity ranking vector R p i , p i j i = 1 m = r 1 , r 2 , ,   r m . For example, if the similarities of a target patent and its three compared patents are predicted as 0.4 ,   0.6 ,   0.5 , then the transformed predicted similarity ranking is 1 ,   3 ,   2 , where rank 1 denotes the least similar. The rank consistency index S i M for this evaluation pair is then computed by comparing the predicted ranking R’ with the gold standard ranking G. Section 4.2 provides an L1-distance-based implementation to calculate RCI. The higher rank consistency of two rankings, the better the effect of the vectorization model.
(3) Model effectiveness evaluation based on statistical hypothesis testing, which aims to identify whether there are significant differences in the RCIs of different vectorization models based on one-side statistical hypothesis testing. For example, if RCIs of model M (denoted as D M = S i M i = 1 N ) are significantly higher (i.e., p-value ≤ 0.05) than RCIs of model M (denoted as D M = S i M i = 1 N ), it indicates that M outperforms M on patent text similarity measurement. For a set of vectorization models M a l l , the effect of M is defined as the number of models it significantly outperforms, denoted as S M = D M , D M | P v a l u e D M , D M 0.05 ,   M M a l l .

4. Empirical Study

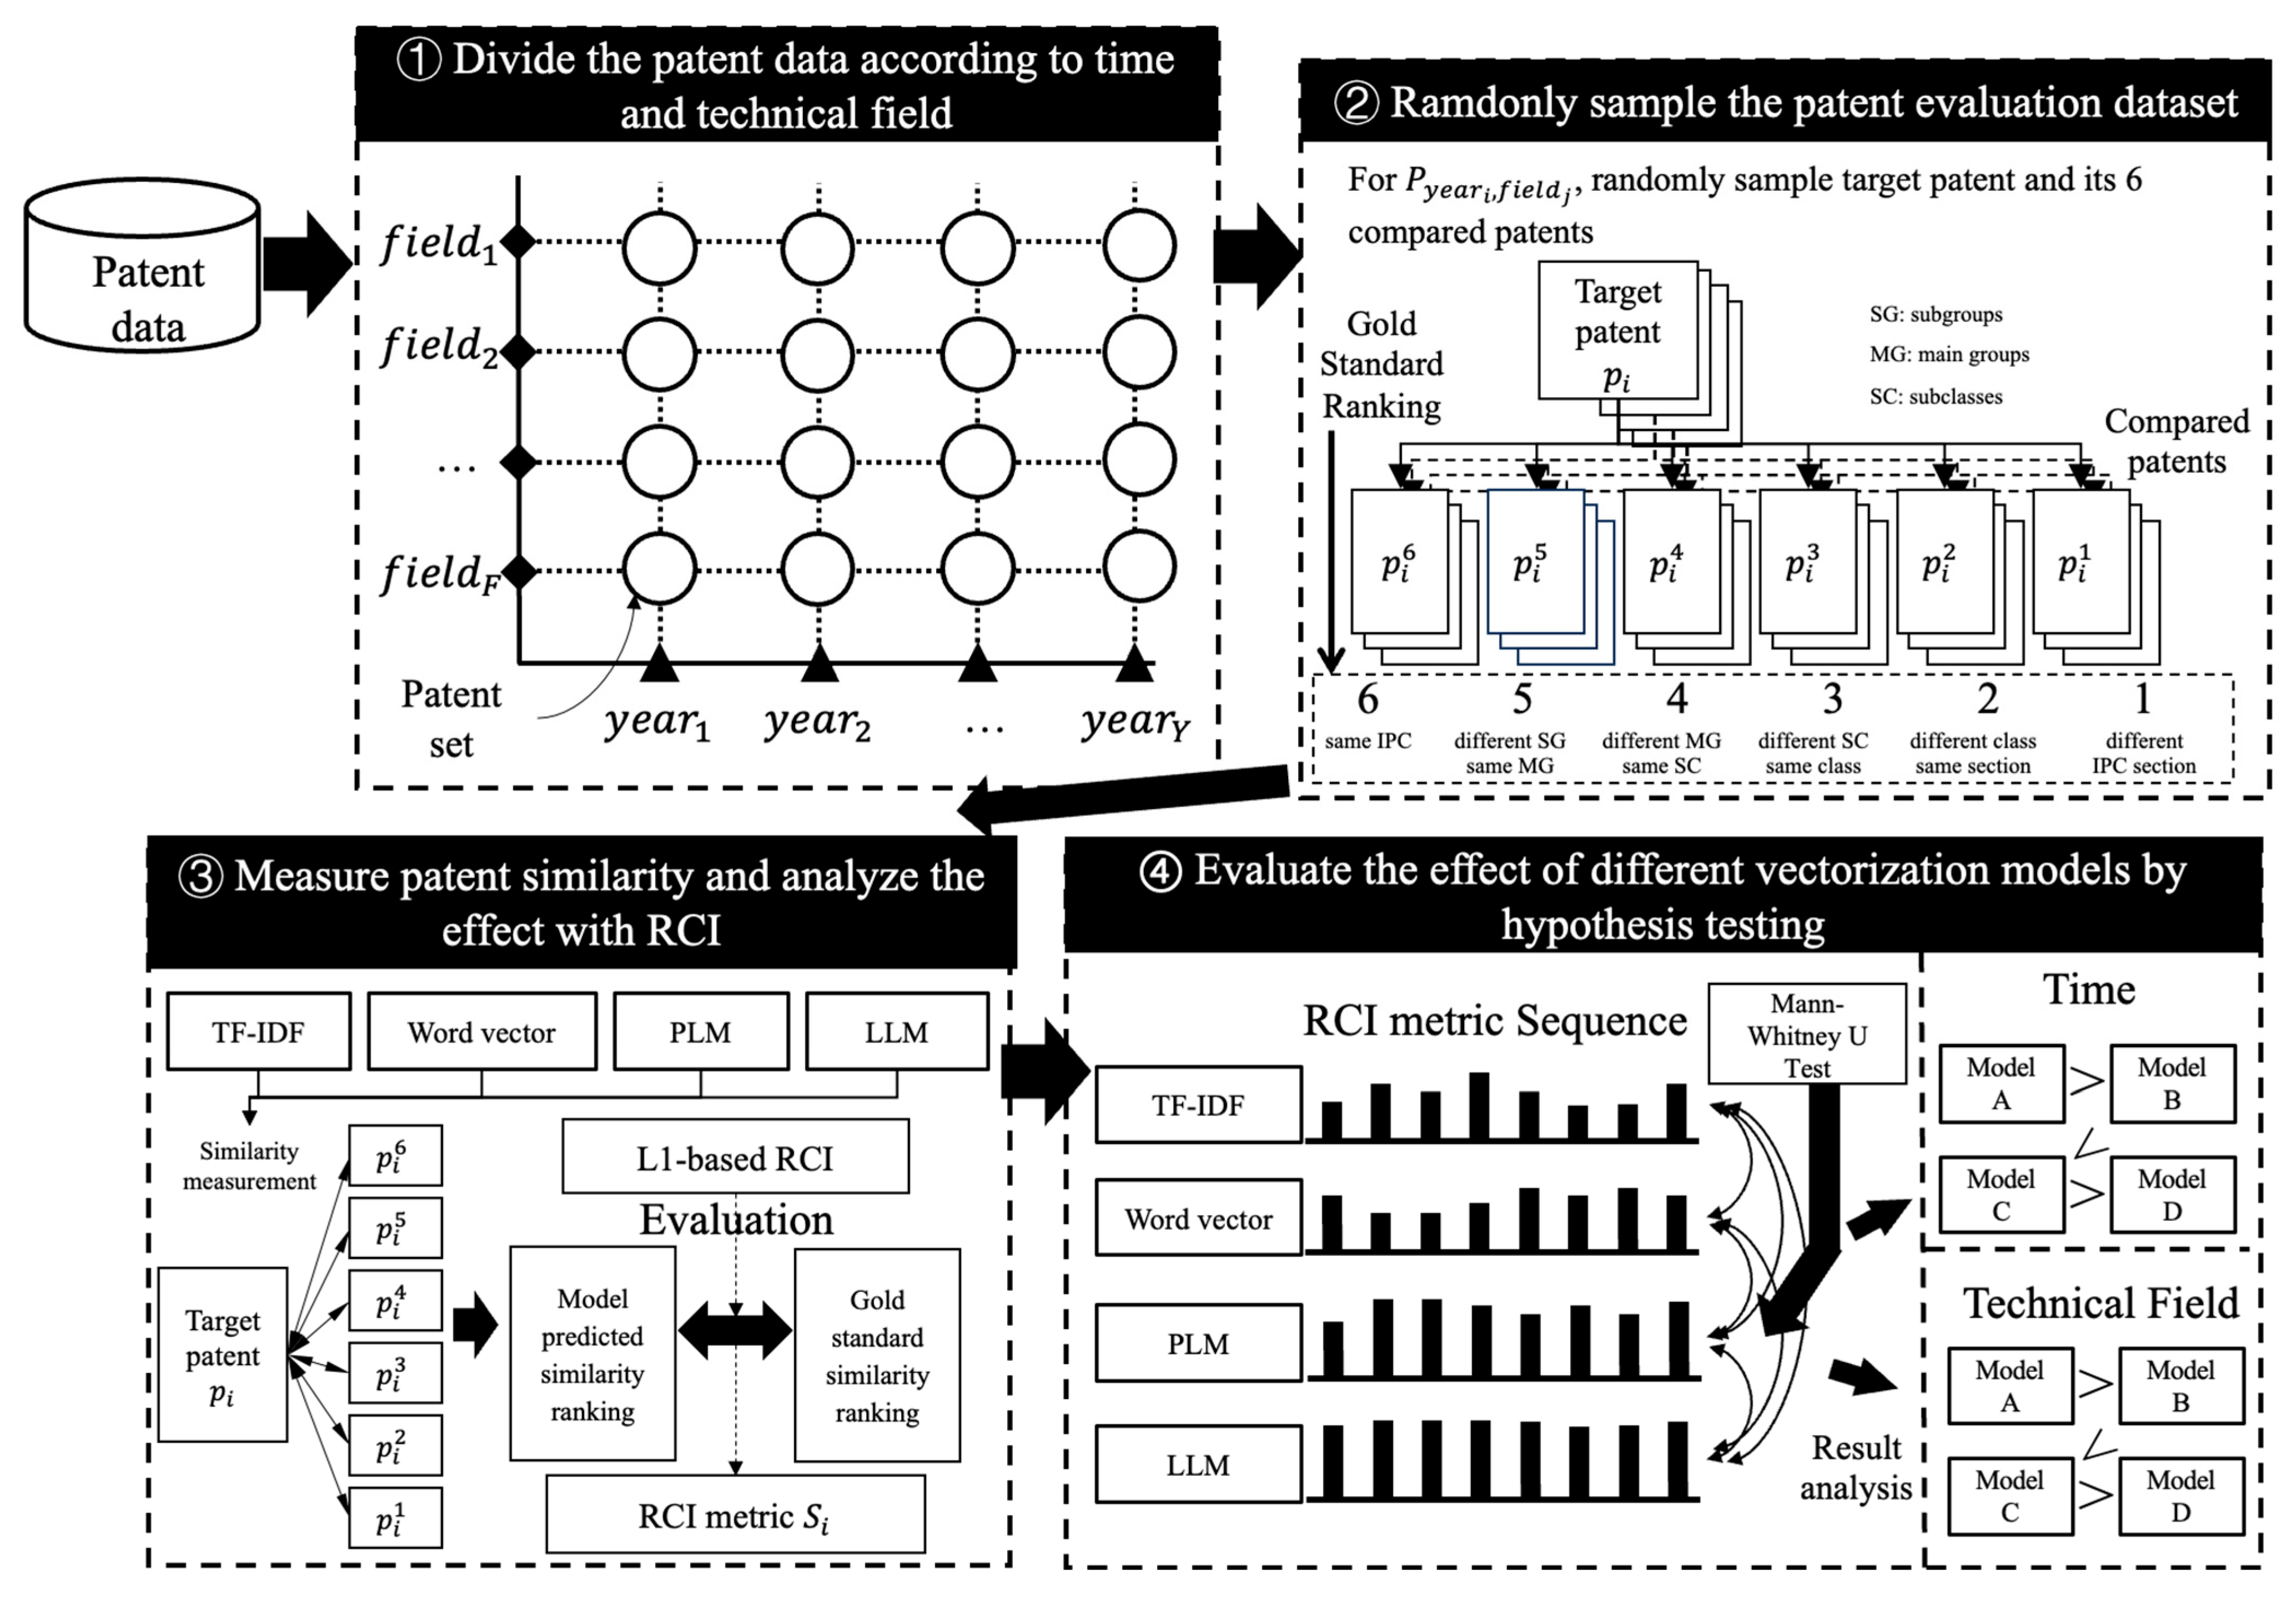
This paper conducts an empirical study on the evaluation framework based on the full amount of Chinese patent data from 2010 to 2024. The processes are shown in Figure 2, including four parts: (1) divide the patent dataset according to time and technical field; (2) randomly sample the patent evaluation dataset with the divided time and technical fields; (3) use different models to measure patent similarity and analyze their effect with RCI; (4) use hypothesis testing approaches to evaluate the effect of different vectorization models on patent similarity measurement with RCIs.

4.1. Automatic Construction of Evaluation Dataset

To evaluate the effect of different vectorization models in patent text similarity measurement, this paper collected a complete dataset of patent data from 2010 to 2024, totaling 5,343,200 patents. To provide a more comprehensive comparison of the effects of models, all the patent data were divided into 112 sets based on 14 years and eight technological fields (IPC section A–H), represented as P y e a r i , f i e l d j .
To construct the evaluation dataset efficiently and quickly, this paper designs a random sampling approach based on the characteristics of patent IPC code. The random sampling approach is based on the assumption that patents whose IPC codes shared a longer common prefix (i.e., section, class, subclass, main group, and subgroup) have higher semantic similarity than patents whose IPC codes shared a shorter common prefix. For the target patent p i and its corresponding set P y e a r i , f i e l d j , five compared patents are randomly selected from P y e a r i , f i e l d j based on the IPC, represented as p i 2 , p i 3 , p i 4 , p i 5 , p i 6 , where p i 6 and p i have the same IPC code, p i 5 and p i have different subgroups but the same main groups, p i 4 and p i have different main groups but the same subclasses, p i 3 and p i have the different subclasses but the same classes, p i 2 and p i have the different classes but the same sections. One compared patent is randomly selected from P y e a r i , f i e l d k (where k j ), represented as p i 1 , which has a different section IPC code from p i . The sequence of compared patents for the target patent p i is represented as p i j j = 1 6 , and the gold standard rankings of p i , p i j j = 1 6 is R p i , p i j = j , where j 1,6 and j N . For each patent set P y e a r i , f i e l d j , 100 target patents are randomly selected along with their corresponding compared patents, represented as p i , p i j j = 1 6 i = 1 100 .

4.2. Settings of Empirical Study

Selection of compared vectorization models. To provide a more comprehensive comparison of the effect of different vectorization models in patent text semantic similarity measurement, the compared models cover the three types of different models, consisting of traditional models, PLMs and LLMs:
(1) Traditional models: (a) TFIDF model. The patent vector is based on the vector space model where the value of each position is the TFIDF weight of the corresponding word. The dimension of the vector is the size of the vocabulary. The vocabulary is the most frequent 20k words within the patent datasets. (b) Word2Vec model. The patent vector is based on the mean of the word embeddings. The dimension of the vector is 300.
(2) PLMs. Bert model (https://huggingface.co/google-bert/bert-base-uncased (accessed on 12 October 2025)), Sentence-Bert model for patent (PSBert for short, https://github.com/AI-Growth-Lab/PatentSBERTa (accessed on 12 October 2025)) [17], and Bart model (https://huggingface.co/facebook/bart-base (accessed on 12 October 2025)). The patent vector is based on the mean of the embedding output by the last layer. The dimensions of the vectors vectorized by Bert, PSBert, and Bart are all 768.
(3) LLMs. BGE model (https://huggingface.co/BAAI/bge-base-en-v1.5 (accessed on 12 October 2025)) and Llama 2 (https://huggingface.co/meta-llama/Llama-2-7b-chat-hf (accessed on 12 October 2025)). The patent vector is based on the mean of the embedding output by the last layer. The dimension of the vector vectorized by BGE is 768 while the dimension of the vector vectorized by Llama 2 is 4096.
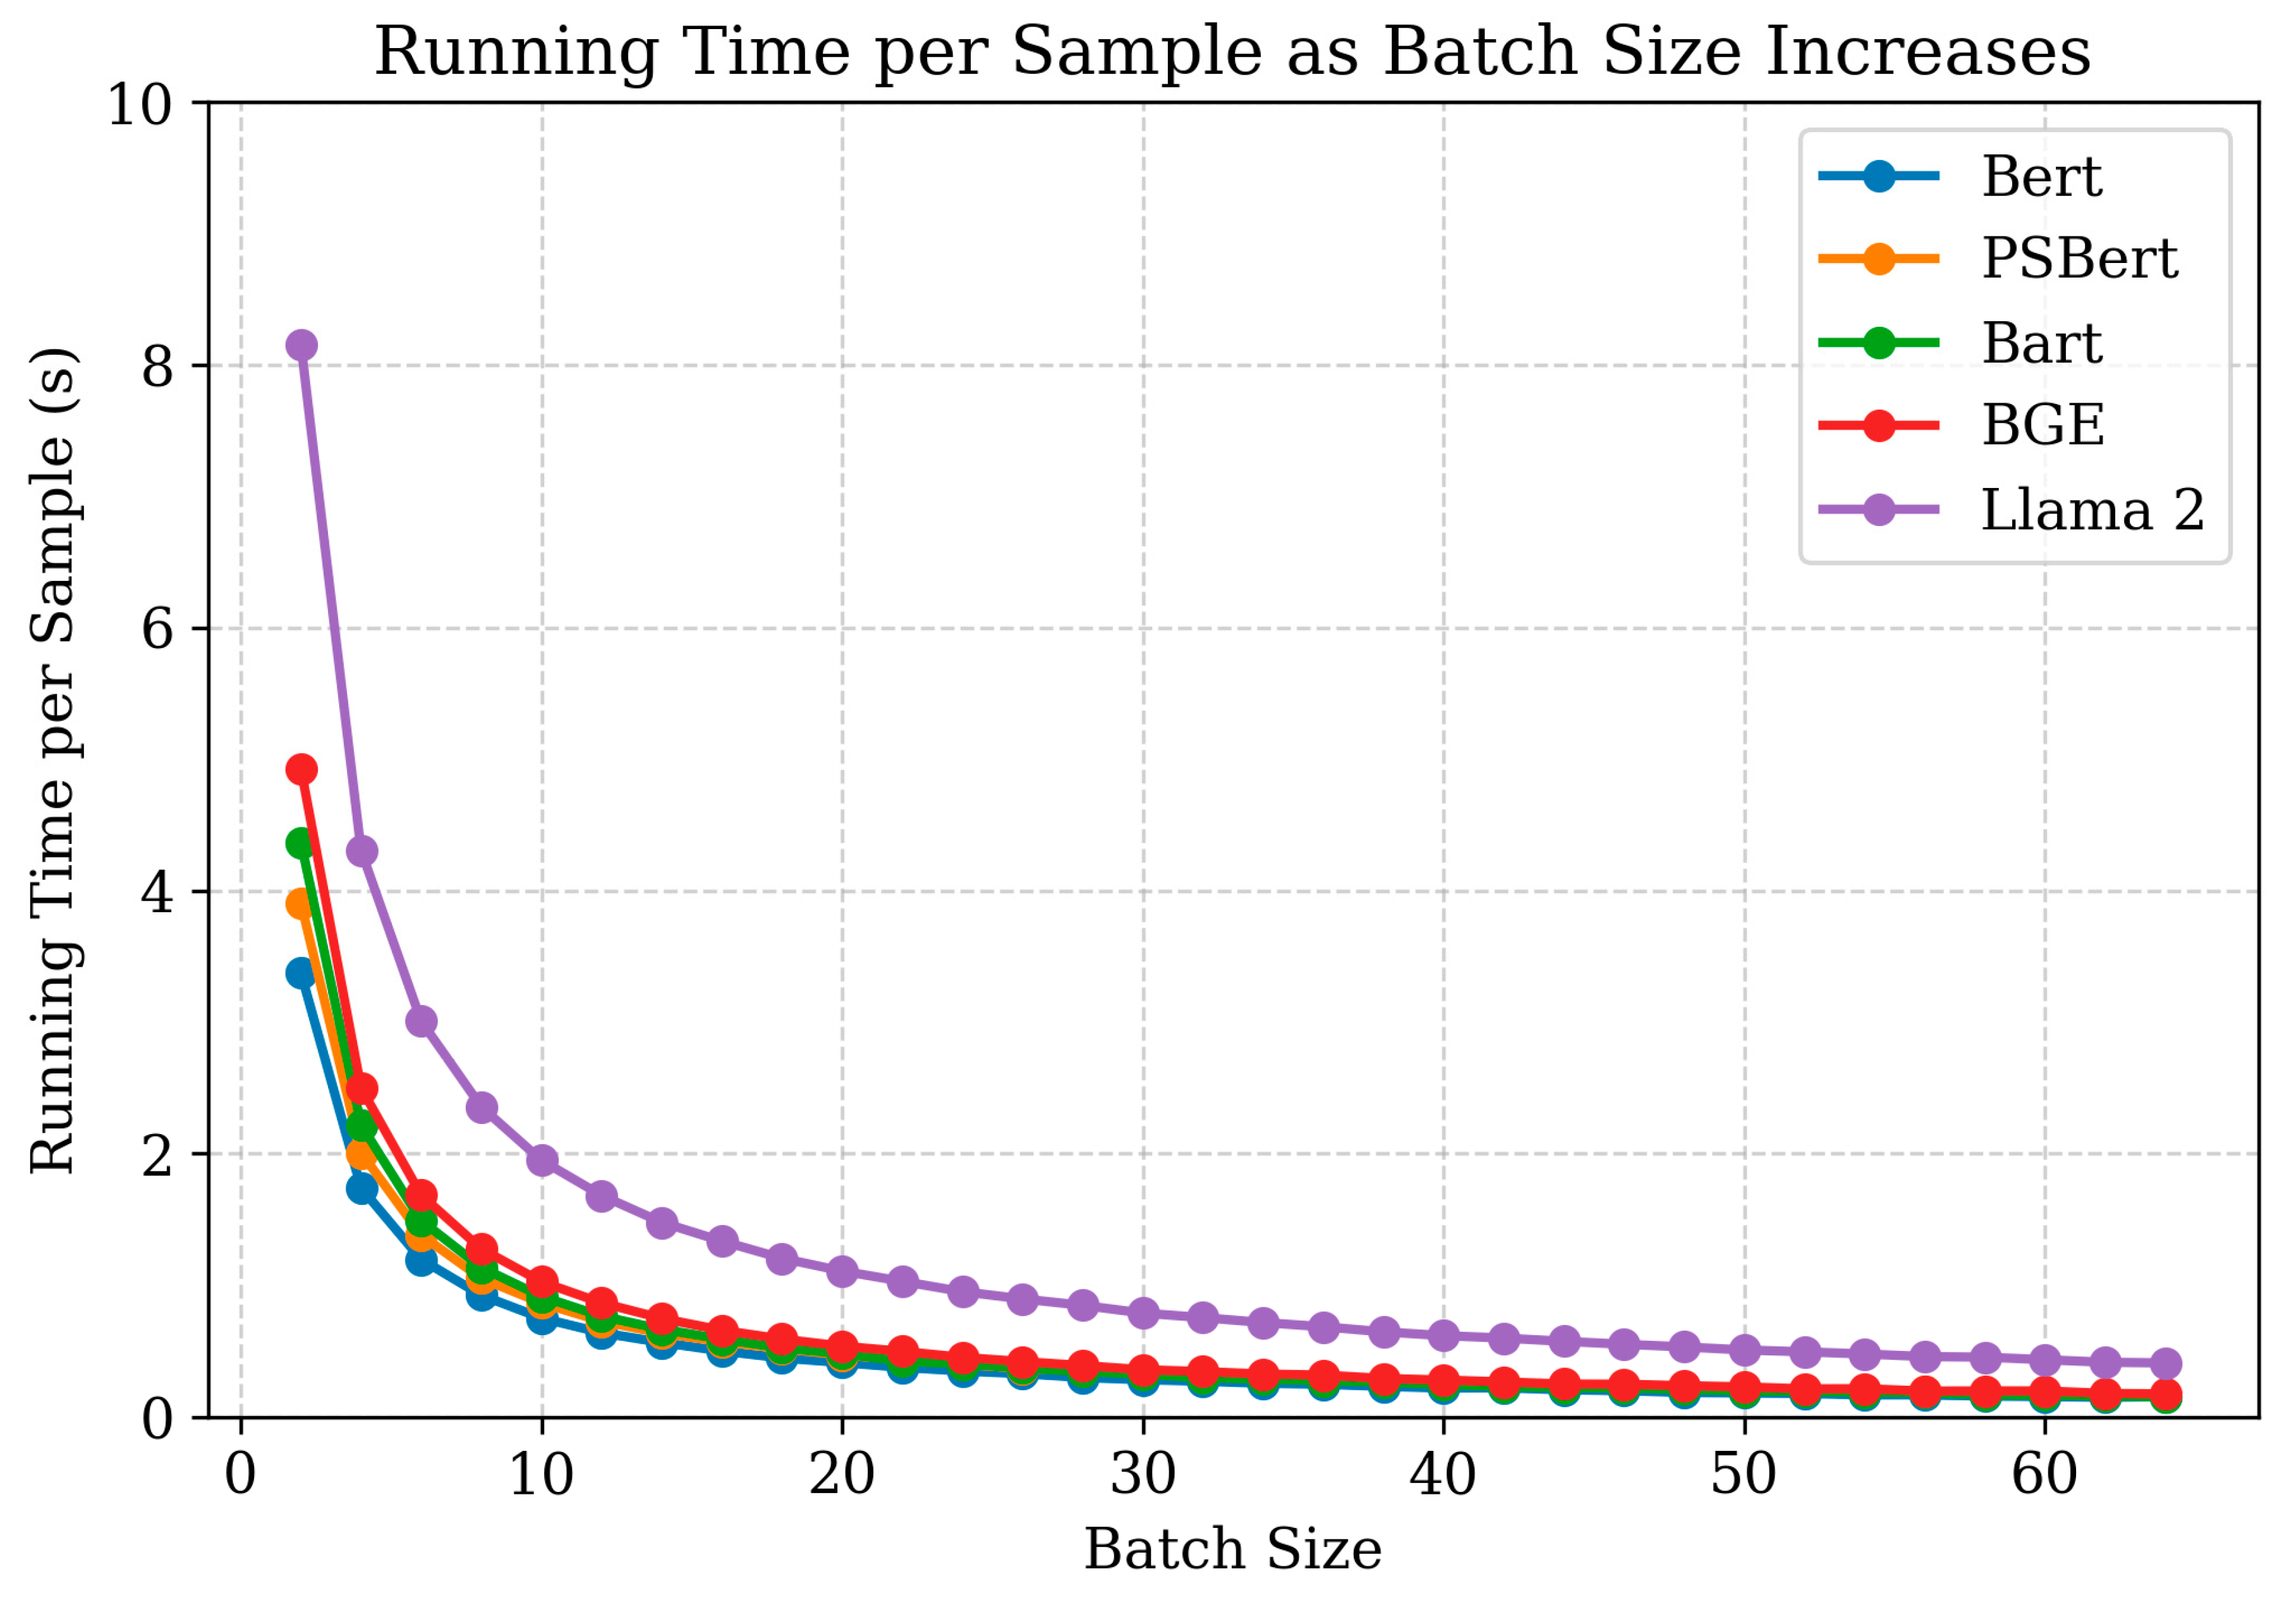
For each patent set, the computational complexity of the cosine calculation is O (N × j × d2), where N is the patent number, j is the compared patents, and d is the dimension number of vectors. In the settings of N = 100 and j = 5, the experiments are run using the CPU of an Intel i7-8700k and the GPU of an Nvidia A800 80 GB. Each model runs five times to calculate the average running time. The results of the running time that run on CPU and GPU are shown in Table 1 and Figure 3.
The result shows that TFIDF runs with the best efficiency with a higher dimension number. It demonstrates that the cosine calculation does not significantly influence the running time. The main factor is the efficiency of running the vectorization models to transform texts into vectors. This suggests that sparsity in the model is a key factor in CPU efficiency. It can be noticed that PLMs (Bert/PSBert/Bart) and LLMs benefit from GPU parallelism, as its actual runtime runs more efficiently than that of a CPU. Even for the high-dimensional Llama 2 (4096-dim), GPU inference remains below 0.2 s/sample at batch = 64. This significant reduction in runtime not only enables practical large-scale semantic computation but also supports real-time or interactive computation. The experimental results indicate that the computational efficiency of vectorization models varies significantly based on hardware and model type.
Preprocessing of patent. The title and abstract of a patent are concatenated as patent text. For TFIDF and word2vec models, their input is a list of words of patent text that are tokenized by the jieba tokenizer (https://github.com/fxsjy/jieba (accessed on 12 October 2025)). For the BERT, BART, BGE, and Llama 2 models, the patent text is directly input to the models for obtaining embeddings.
Selection of rank consistency index. The RCI identifies the difference between two rankings, which can be measured by two types of indicators: (1) distance-based indicators; (2) pair-based indicators.
Distance-based indicators interpret two rankings as vectors and measure their discrepancy by a distance metric, among which the Spearman footrule (L1) distance is most widely used. Given the gold ranking R p i , p i j i = 1 m and the model-predicted ranking R p i , p i j i = 1 m , their L1 discrepancy is as follows:
D = i = 1 m R p i , p i j R p i , p i j
Under the “rank 1 = least similar” convention, the theoretical maximum of this distance is Dmax, corresponding to a complete reversal between two rankings.
D m a x = m 2 2
The rank consistency index (RCI) SL1 ∈ [0, 1] for each evaluation pair is calculated as follows:
S L 1 = 1 D D m a x
The basic idea of pair-based indicators is to measure the consistency of two rankings by calculating the number of pairs with consistent/inconsistent ranks among two rankings. Kendall’s τ coefficient is a commonly used pair-based indicator, given two rankings R p i , p i j i = 1 m and R p i , p i j i = 1 m , their RCI S τ is formulated as follows:
S τ = P + P P + + P 2
The P + represents the number of pairs with consistent ranks and P represents the number of pairs with inconsistent ranks. The pair-based indicator is too strict in determining ranks and ignores the relative positions in the ranking. For example, for the target patent p i , the gold standard ranking of its compared patents is 1,2 , 3,4 , 5,6 . Supposing the similarity rankings predicted by two models are 2,3 , 4,5 , 6,1 and 6,5 , 4,3 , 2,1 , the pair-based indicator measures the consistency as −1 for both, as there are no consistent ranks for both two rankings with the gold standard ranking. However, the former correctly predicts the relative positions of p i 1 , p i 2 , p i 3 , p i 4 , and p i 5 , while the predicted ranking of the latter is completely opposite to the gold standard ranking. Therefore, the former should have a higher RCI than the latter. Thus, this paper chooses the L1 distance-based indicator as the RCI.
Selection of statistical hypothesis testing approach. The t-test and U-test are two commonly used hypothesis testing approaches in statistics to identify whether there is a significant difference between two distributions. The t-test identifies differences by examining whether the means of two distributions are equal. The U-test is a non-parametric test used to evaluate whether two independent data samples come from the same distribution. It converts the values of two independent samples into ranks within the combined sample and then tests the U-value calculated based on these ranks to evaluate whether there is a significant difference in the average ranks of the two groups. As the t-test is suitable for continuous variables with small sample sizes and requires the data to meet (1) normal distribution and (2) homogeneity of variances, while the U-test is suitable for ordinal variables and does not require the data to meet normal distribution, the U-test is selected to identify whether there is a significant difference between the two RCI rankings of D M and D M to distinguish the difference in the effects of M and M on the patent semantic similarity measure.
The function F M u = P X u is defined as the cumulative distribution function of D M , representing the probability that the random variable X is less than or equal to u . If the p-value is less than or equal to 0.05, it indicates that the distribution of D M is significantly greater than that of D M , i.e., F M u < F M u , and the null hypothesis is rejected. Otherwise, it indicates that the distribution of D M is not significantly greater than D M , i.e., F M u F M u .
Corollary: For three groups of RCI, D M ,   D M and D M , if hypothesis testing identifies that the distribution of D M is greater than that of D M , i.e., F M u < F M u , then the distribution of D M is greater than that of D M , i.e., F M u < F M u . Due to the transitivity of the partial order relation of cumulative functions, it can be inferred that the distribution of D M is greater than D M , i.e., F M u < F M u .
Based on the corollary, the effect of all models can be ranked based on the hypothesis testing results between partial models.

4.3. Results in Different Years

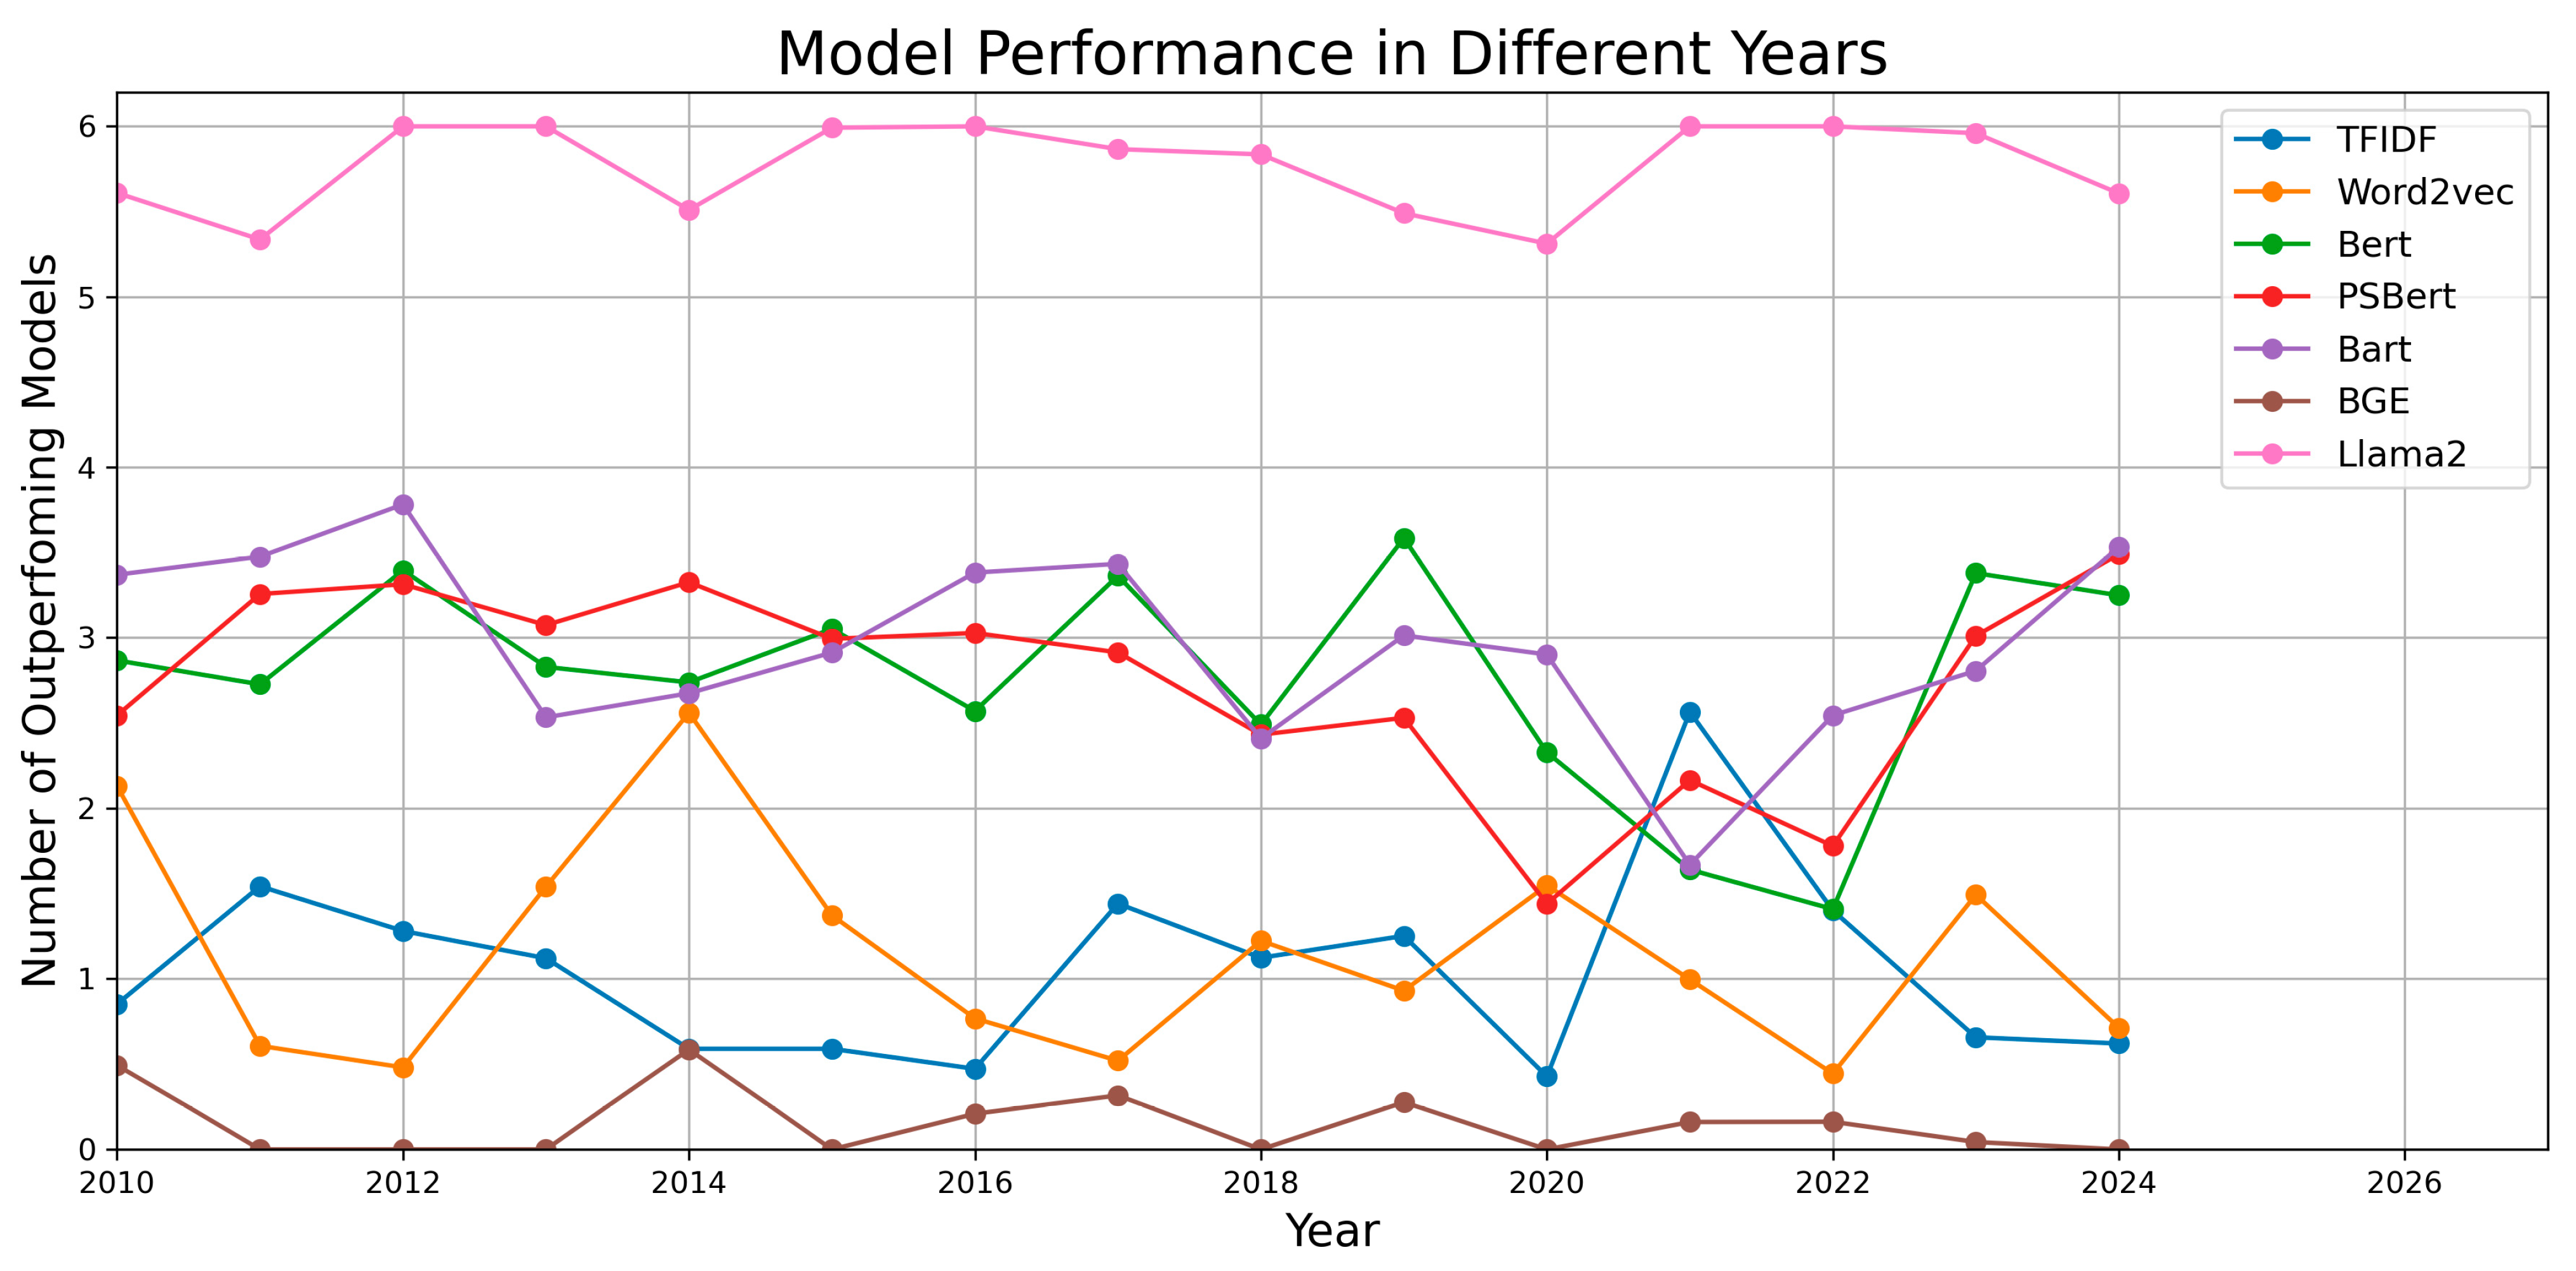
We randomly sampled 1000 patents for each year, and each patent set contains 5 compared patents. The results are shown in Figure 4, showing the rank consistency index of a model over years, where the value at each point indicates how many other models it outperformed in that year. For example, a value of 3 means that the model ranked higher than three other models in that year. A value of 0 implies that the model underperformed all others. Although BGE is optimized for sentence-level semantic retrieval, its training corpora and objectives are mostly based on natural conversational or factual QA-style text, while patent language is formulaic, enumerative, and terminology-heavy, where semantic similarity is often indicated by explicit technical expressions rather than paraphrased sentence equivalence. As a result, BGE tends to over-compress patent sentences into dense vectors that lack fine-grained lexical differentiation, leading to poor rank discrimination. In contrast, TFIDF, despite its simplicity, directly captures surface-level term co-occurrence, which remains highly informative in patent comparison tasks. Llama 2-based embeddings further benefit from token-level preservation and global contextual encoding, thus offering a more balanced representation between lexical precision and semantic abstraction.

4.4. Results in Different Technical Fields

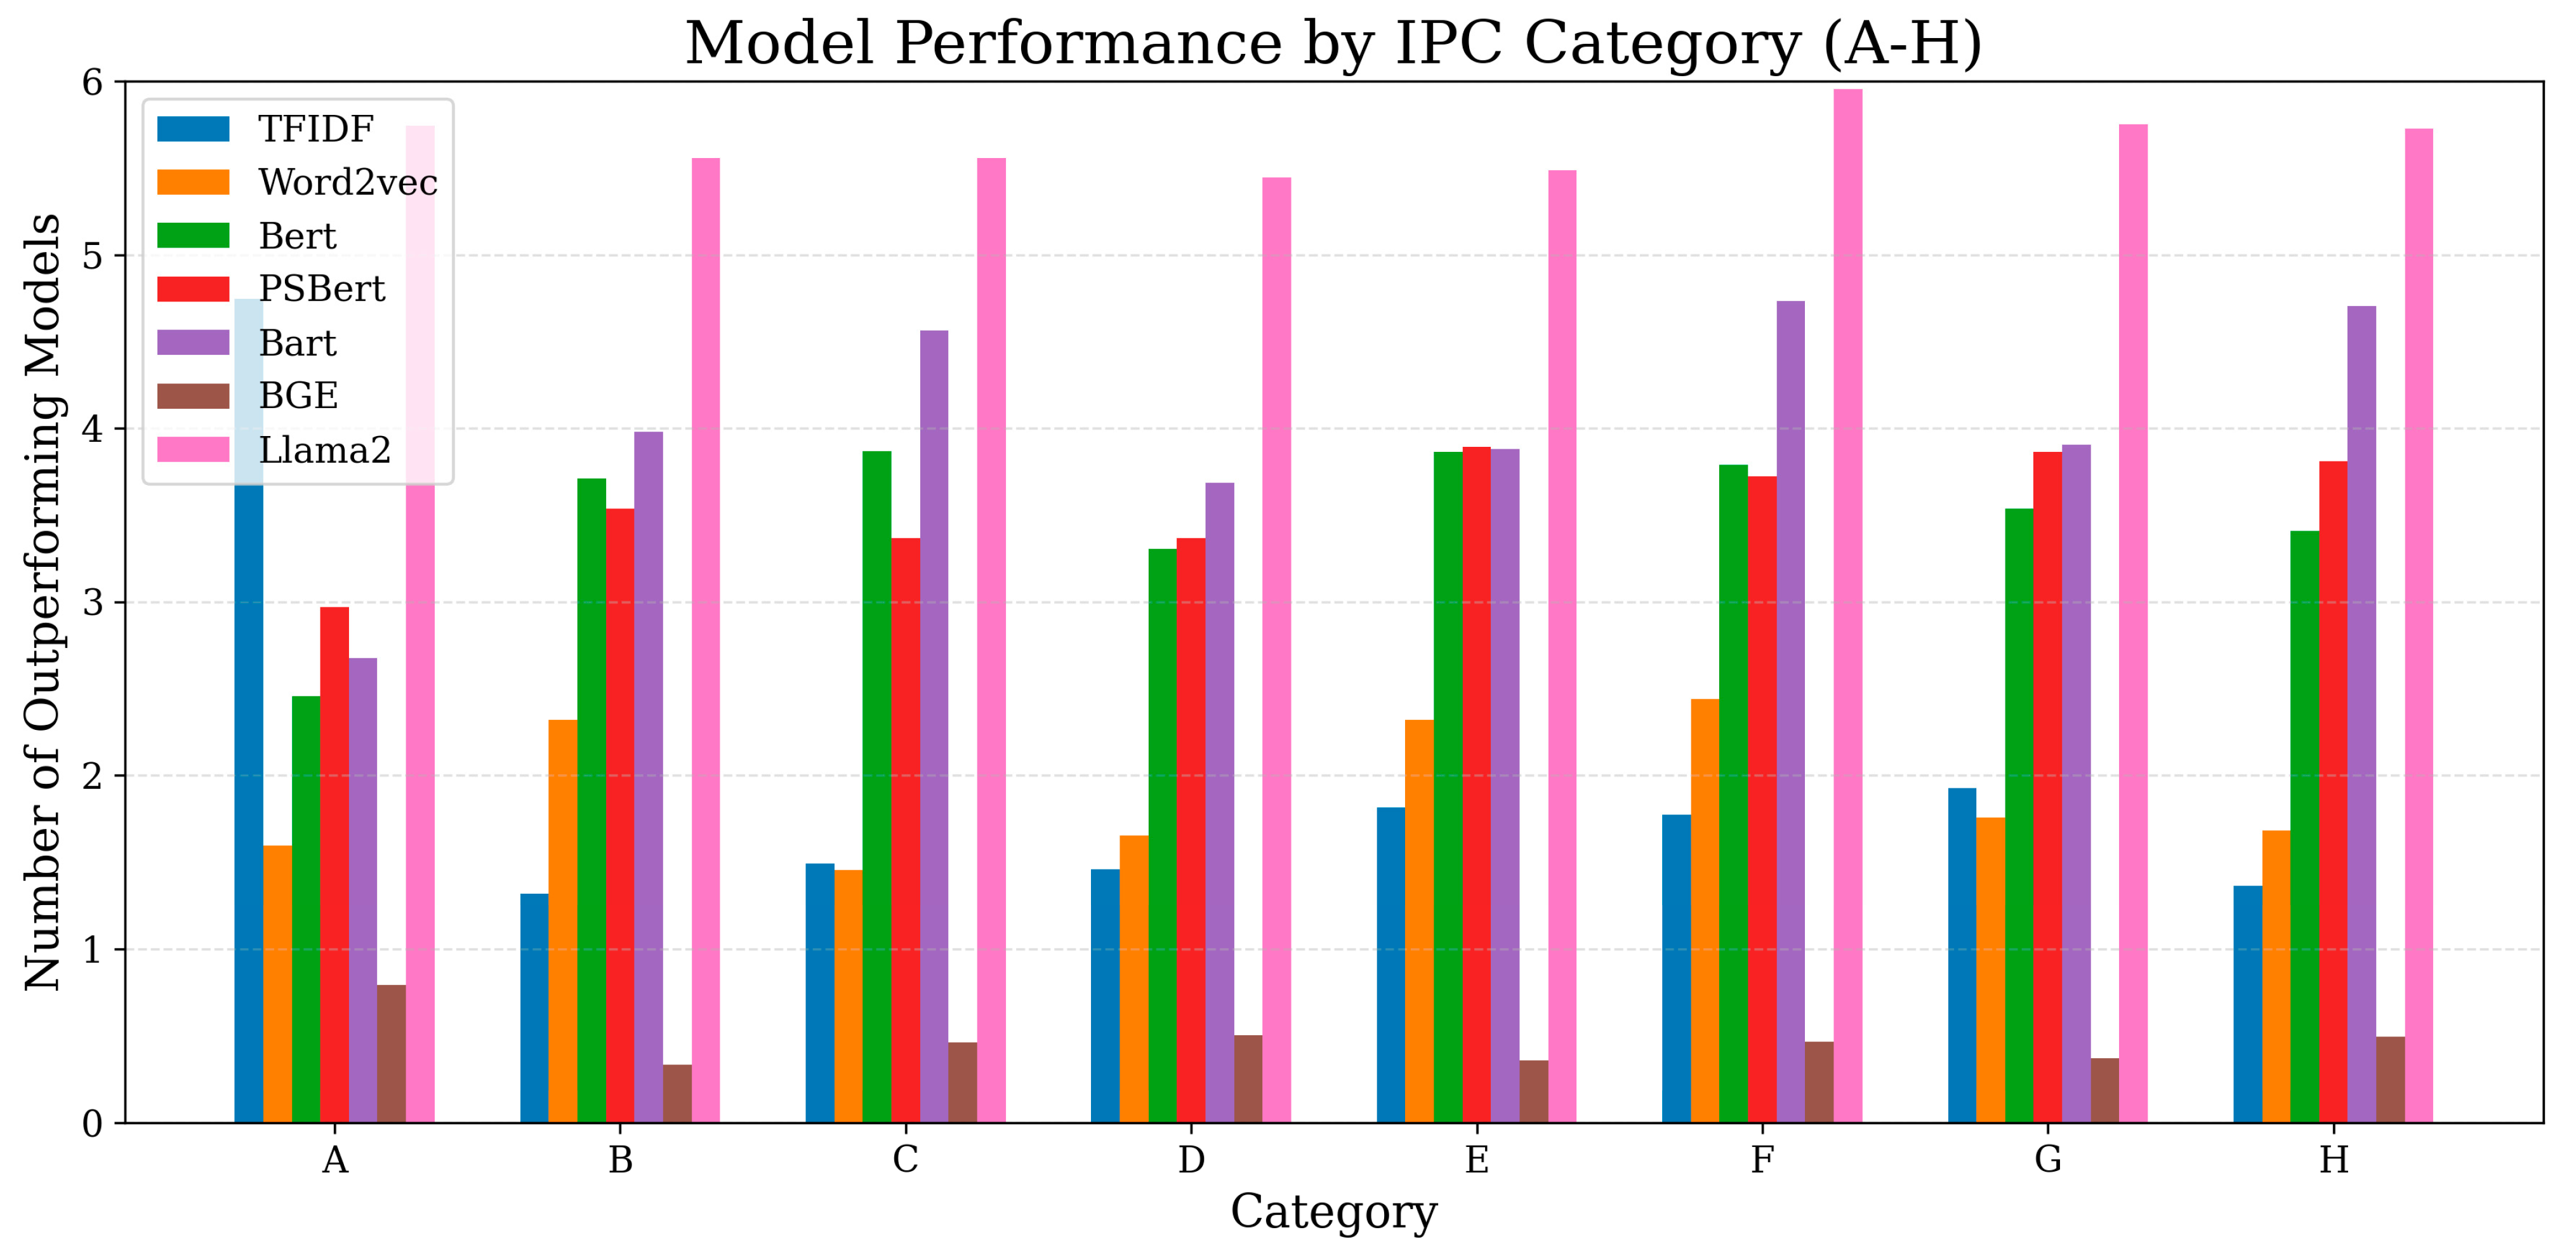
We randomly sampled 5000 patents for each category, and each patent set contains 5 compared patents. Figure 5 shows the performance comparison of various text-embedding models across different IPC technical categories (A−H). Similar to the temporal analysis in Figure 4, the overall ranking trend remains consistent across domains. For traditional models, TFIDF and Word2vec show nearly identical performance, indicating that simple lexical matching is insufficient for capturing domain-specific semantic variations. PLMs, Bert, PSBert, and Bart obtain clear improvements over traditional baselines, demonstrating stronger generalization across heterogeneous IPC domains. Their performance remains relatively stable, suggesting that contextualized embeddings are more robust to domain shifts. However, a more pronounced divergence appears among LLM-based embeddings. BGE exhibits the weakest performance, failing to surpass any other model in most IPC categories. In contrast, Llama 2 consistently dominates all technical domains, showing clear superiority in modeling cross-domain semantic relevance. Overall, these results suggest that while PLMs offer moderate gains over traditional methods, only advanced LLMs such as Llama 2 can achieve consistently reliable performance across diverse IPC categories.

4.5. Robustness Analysis

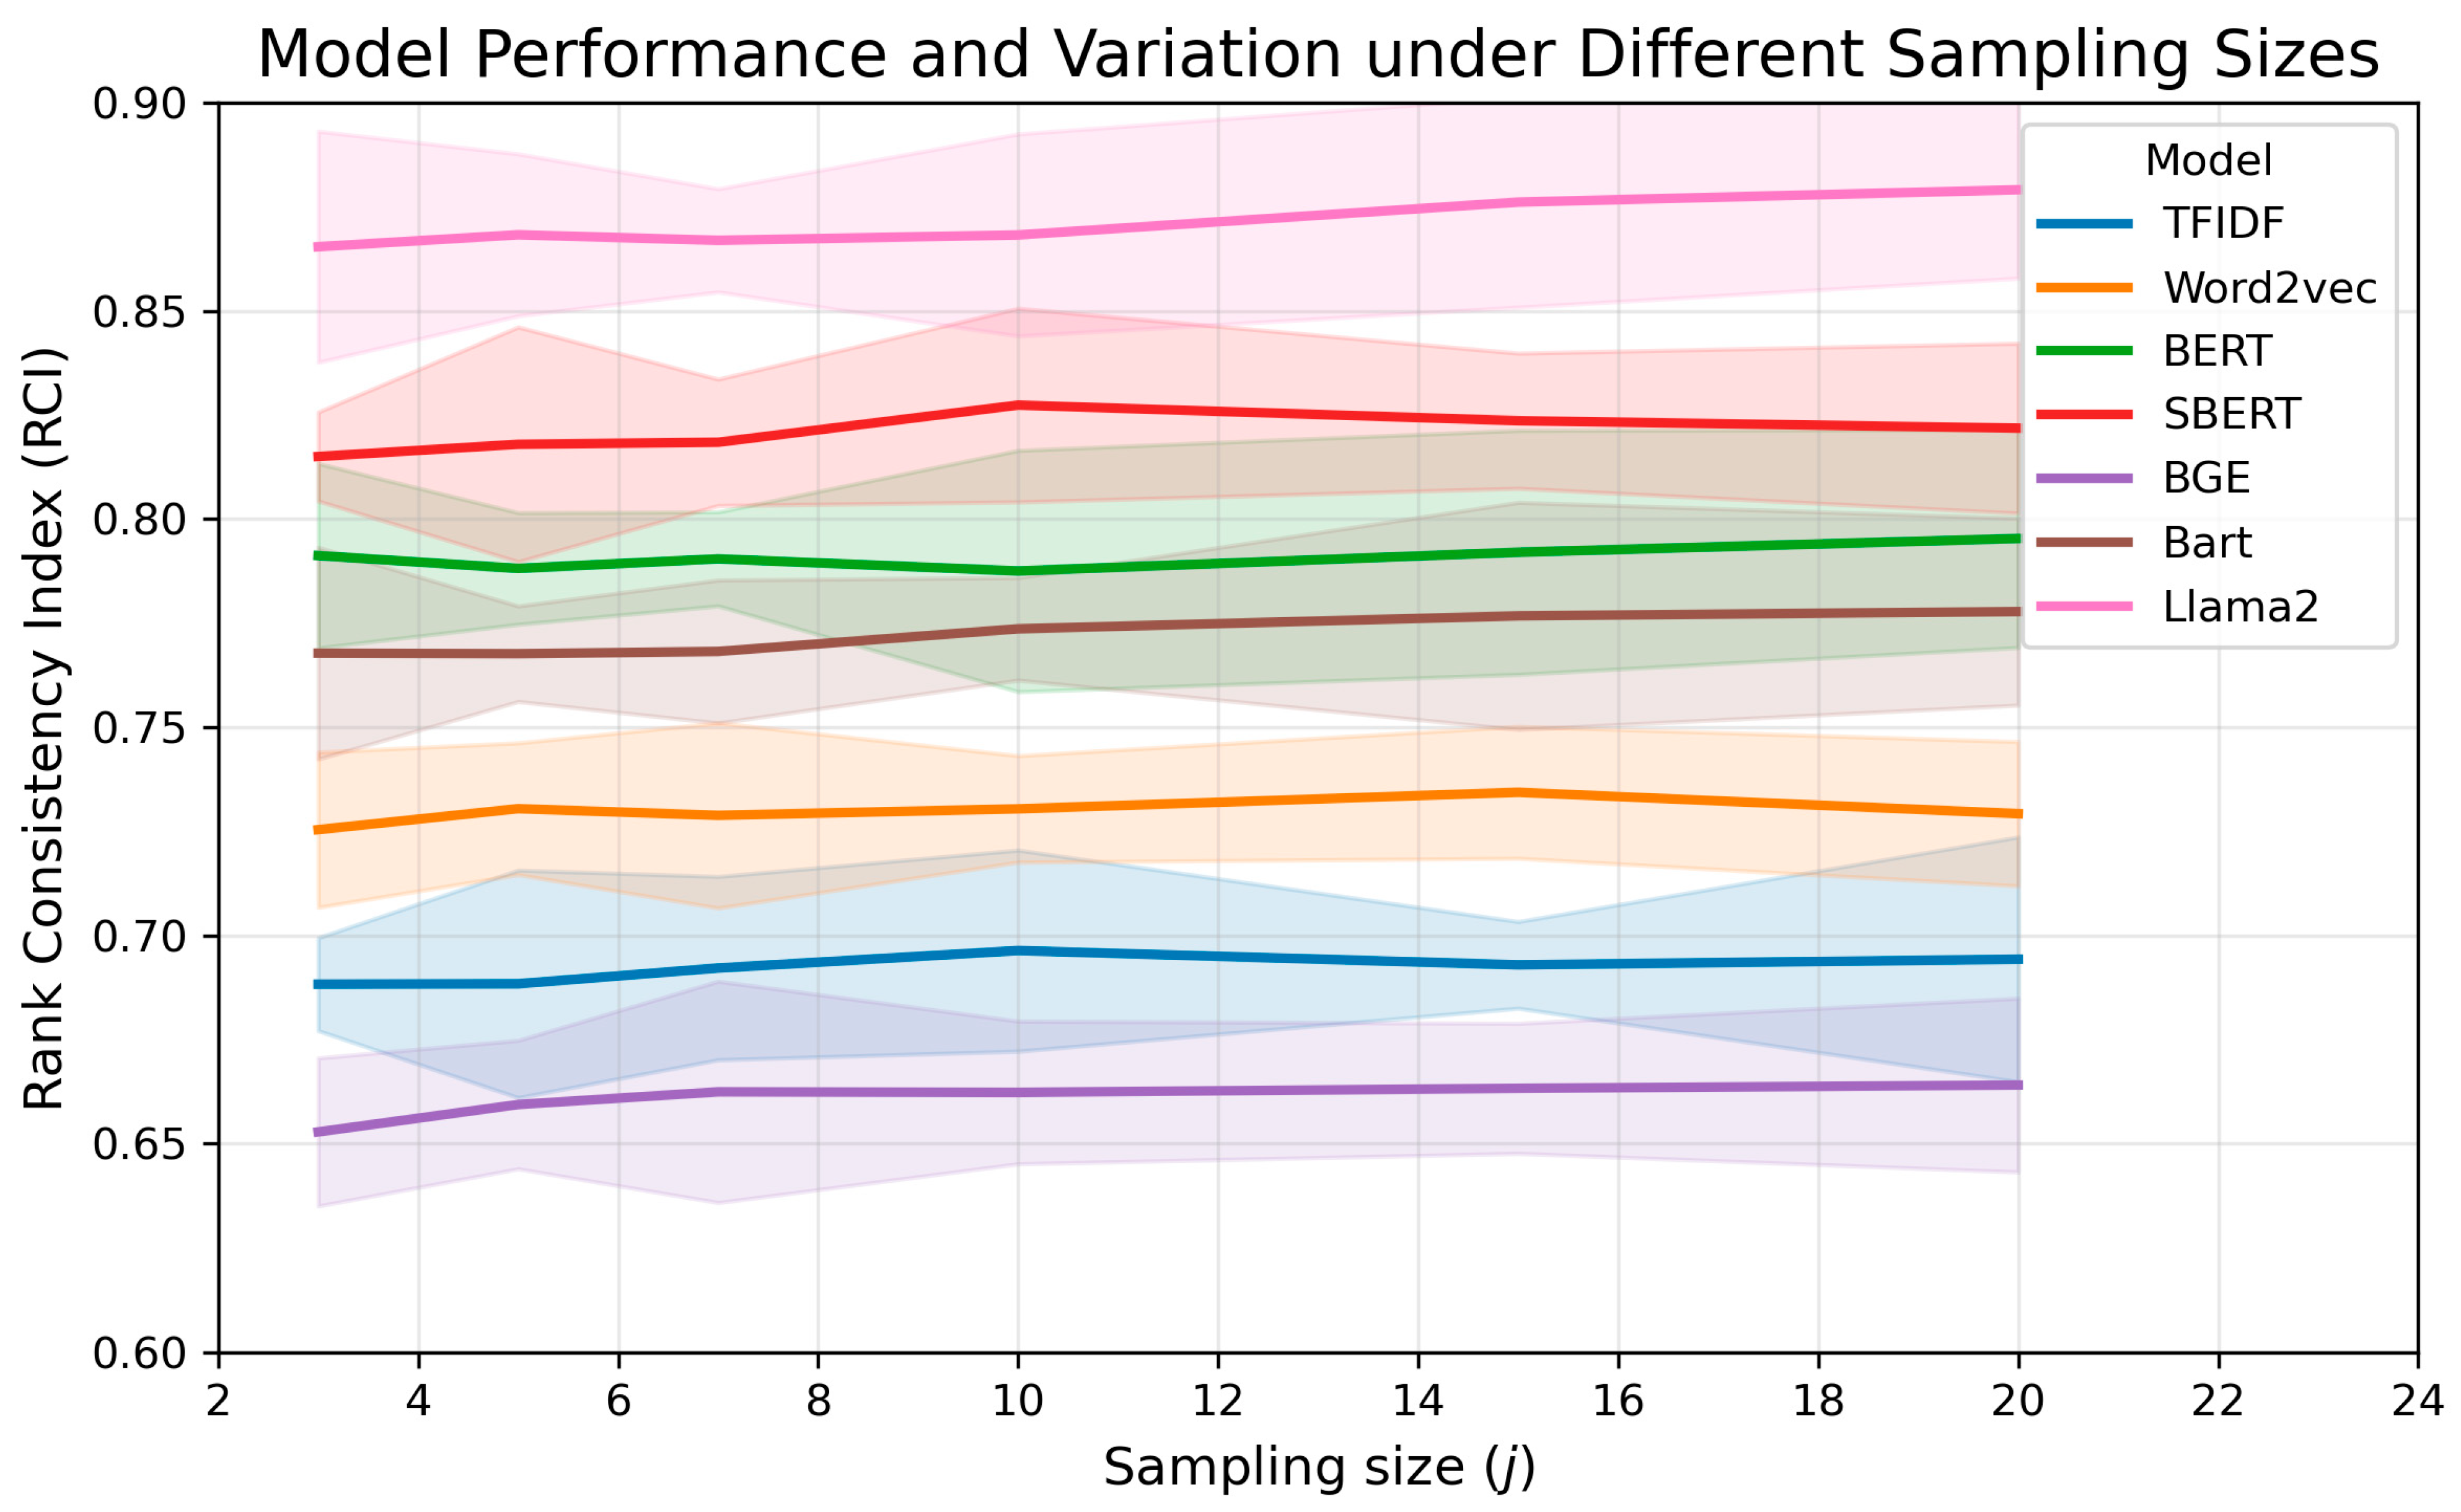
To evaluate the robustness of the proposed evaluation framework, additional experiments were conducted with varying numbers of compared patents (j = 3–20) and random sampling seeds. Figure 6 presents the average rank consistency index (RCI) and its variance across five random runs. The results indicate that the overall ranking of models remains consistent across different sampling scales, confirming the stability of the evaluation design. Specifically, Llama 2 exhibits the highest and most stable RCI, demonstrating superior semantic generalization and robustness. PSBert and Bert also maintain strong performance with small variance, while Bart shows moderate stability. Traditional models such as TFIDF and Word2vec remain stable but with lower RCI values, reflecting their limited capacity for fine-grained semantic differentiation. In contrast, BGE shows relatively high variance and the lowest overall RCI, indicating its limited suitability for hierarchical patent text similarity measurement. Overall, these results confirm that the evaluation framework is insensitive to the sampling parameter j, and the comparative ranking of models is statistically robust under different random seeds.

5. Discussion

The RCIs of each model in each year and each technical field are evaluated by the Shapiro–Wilk test and the Kolmogorov–Smirnov test to check the normality of the distribution. The results show that the distribution of RCI values of each model does not conform to normal distribution, which verifies the rationality of the U-test used in the empirical study.
The similarity distributions of different models vary greatly. Our framework ignores the specific similarity values and instead focuses on similarity rankings, using RCI to evaluate the performance of models on individual evaluation data. By converting similarity values into similarity rankings, vectorization models with different distributions can be directly compared. The mean, standard deviation, and skewness of the similarity distributions measured by different models reveal large differences in their distributions. For example, the TFIDF model has a mean similarity of only 0.11 and a skewness of 2.99, indicating a strong left skew (towards smaller similarity values). In contrast, the Llama 2 model has a mean similarity of 0.92 and a skewness of −4.36, indicating a strong right skew. Based on the sampling distribution of the TFIDF model, its 95% confidence interval is determined to be [0.09, 0.12]. Similarly, for the Llama 2 model, the 95% confidence interval is determined to be [0.91, 0.93]. PLMs like Bert and Bart, as well as Llama 2, exhibit similar distributions characterized by high means (all > 0.84), low standard deviations (all ≤ 0.08), and negative skewness (all < −4.3). In contrast, the similarity distribution of the embedding-focused BGE model differs from those of Bert, Bart, and Llama 2. The mean similarity of the BGE model is 0.59, and its distribution is nearly symmetrical (absolute skewness < 0.5).
It can be seen that the LLM-based vectorization models (BGE and Llama 2) exhibit the worst and the best performance in all experimental cases. A potential reason is that the training recipe of BGE is not adaptive for its small model size (109 M), because the weakness is not exposed to Llama 2 with 7B parameters. The results emphasize the objective evaluation of measuring text similarity: the intuition that latest-architecture and well-trained models perform better is not reliable. Moreover, the performance and running efficiency of vectorization models should be balanced in practical applications.
The evaluation framework on patent semantic similarity measurement proposed in this paper is difficult to validate through a predefined gold standard. The fundamental reason is that there is currently no benchmark in academia accepted by researchers for assessing the performance of similarity measurement models. If an authoritative gold standard existed, researchers could directly select suitable vectorization models based on it, without further exploring the evaluation of the similarity measurement effect of different vectorization models. Therefore, this paper proposes an interpretable evaluation framework on patent semantic similarity measurement that systematically evaluates the performance of different vectorization models, taking into account both year and technical field factors.
This approach provides a basis for effectively selecting the similarity measurement approach in patent analysis tasks. In future work, we plan to conduct experiments on more vectorization models, and extend our framework to adapt the graph-based and prompt-based models of text similarity measurement [22].

6. Conclusions

This paper addresses the issue of evaluating the effect of different vectorization models on patent semantic similarity measurement. It proposes an evaluation framework which consists of three steps: (1) automatically constructing the evaluation dataset based on the characteristic of IPC hierarchy, (2) using the RCI to measure the effect of vectorization models on individual evaluation data, and (3) using statistical hypothesis testing to evaluate the effects of different vectorization models. Using the dataset of patents from 2010 to 2024, an empirical study is conducted based on the proposed framework with an L1-based RCI and U-test, comprehensively comparing six English vectorization models in terms of ranking consistency, distributional characteristics, and computational efficiency. Quantitatively, the results show that Llama 2 achieves the highest-ranking stability, with an average RCI of 0.87, which is 36% higher than that of the weakest model (BGE, RCI = 0.64). PSbert and BERT maintain comparable performance levels (RCI = 0.82 and 0.79, respectively), with variances below 0.04, indicating consistent performance across domains. Traditional models such as TFIDF and Word2vec achieve moderate consistency (RCI ≈ 0.70), confirming their robustness despite limited semantic depth. From the perspective of efficiency, the framework also enables quantitative comparison across heterogeneous hardware environments. On GPU, Llama 2 (7B) achieves the highest accuracy but incurs higher computational cost (0.41 s/sample), whereas Bert and PSbert reduce inference time by ≈60% with less than 10% loss in RCI. In contrast, TFIDF, while the fastest (0.14 s/sample on CPU), shows a ~20% lower RCI compared to transformer-based models. This numerical comparison illustrates the framework’s capability to jointly assess accuracy–efficiency trade-offs in an interpretable and model-agnostic manner.
The advantages of the approach proposed in this paper are as follows: (1) Strong Interpretability: the evaluation framework is based on an L1-based RCI and U-test, which provide robust interpretability in a statistical sense. (2) Ranking-Based Objective Comparison: by adopting a ranking-based index, the framework enables direct performance comparison between models with vastly different similarity distributions. The entire process is totally automated, eliminating the need for additional manual annotation or arbitrary threshold settings, thereby enhancing the objectivity of comparisons. (3) Comprehensive Empirical Analysis: in the empirical study, the framework considers both year and technical field factors. Given the non-normal distribution characteristics of RCIs, the Mann–Whitney U-test is employed to conduct a thorough comparison of patent semantic similarity measurement performance among three types of vectorization models across different years and technical fields.
Regarding the limitation, although the proposed evaluation framework demonstrates strong interpretability, it lacks the validation through a gold standard. Furthermore, the empirical study only compared several classic vectorization models. Given the vast array of text vectorization models available, future work could incorporate a broader range of models for comparison, thereby providing more comprehensive references for relevant patent analysis tasks.

Author Contributions

Conceptualization, J.L. and J.Z.; methodology, J.Z.; software, J.Z.; validation, J.L. and J.Z.; formal analysis, M.C.; investigation, J.L. and J.Z.; resources, J.L.; data curation, J.L. and J.Z.; writing—original draft preparation, J.Z. and J.L.; writing—review and editing, J.L., J.Z., and M.C.; visualization, J.L. and J.Z.; supervision, J.Z. and M.C.; project administration, M.C.; funding acquisition, M.C. All authors have read and agreed to the published version of the manuscript.

Funding

This research was funded by the Natural Science Foundation of Fujian Province, China (Grant 2022J05157) and the Natural Science Foundation of Xiamen, China (Grant 3502Z20227049).

Institutional Review Board Statement

Not applicable.

Data Availability Statement

The used data are publicly available, and the links are provided in the paper.

Conflicts of Interest

The authors declare no conflicts of interest.

Abbreviations

The following abbreviations are used in this manuscript:
LLMLarge Language Model
RCIRank Consistency Index
TFIDFTerm Frequency Inverse Document Frequency
PLMPre-Trained Language Model
VSMVector Space Model
IPCInternational Patent Classification

References

  1. Arts, S.; Cassiman, B.; Gomez, J.C. Text matching to measure patent similarity. Strateg. Manag. J. 2018, 39, 62–84. [Google Scholar] [CrossRef]
  2. Ma, B.; Zhuge, H. Automatic construction of classification dimensions by clustering texts based on common words. Expert Syst. Appl. 2024, 238, 122292. [Google Scholar] [CrossRef]
  3. Block, C.; Wustmans, M.; Laibach, N.; Bröring, S. Semantic bridging of patents and scientific publications–The case of an emerging sustainability-oriented technology. Technol. Forecast. Soc. Change 2021, 167, 120689. [Google Scholar] [CrossRef]
  4. Trappey, A.; Trappey, C.V.; Hsieh, A. An intelligent patent recommender adopting machine learning approach for natural language processing: A case study for smart machinery technology mining. Technol. Forecast. Soc. Change 2021, 164, 120511. [Google Scholar] [CrossRef]
  5. Liu, W.; Li, S.; Cao, Y.; Wang, Y. Multi-task learning based high-value patent and standard-essential patent identification model. Inf. Process. Manag. 2023, 60, 103327. [Google Scholar] [CrossRef]
  6. He, X.; Meng, X.; Wu, Y.; Chan, C.S.; Pang, T. Semantic matching efficiency of supply and demand texts on online technology trading platforms: Taking the electronic information of three platforms as an example. Inf. Process. Manag. 2020, 57, 102258. [Google Scholar] [CrossRef]
  7. Shahmirzadi, O.; Lugowski, A.; Younge, K. Text similarity in vector space models: A comparative study. In Proceedings of the 2019 18th IEEE International Conference on Machine Learning and Applications (ICMLA), Boca Raton, FL, USA, 16–19 December 2019; IEEE: New York, NY, USA, 2019; pp. 659–666. [Google Scholar]
  8. Petukhova, A.; Matos-Carvalho, J.P.; Fachada, N. Text clustering with LLM embeddings. arXiv 2024, arXiv:2403.15112. [Google Scholar] [CrossRef]
  9. Lan, Y.; He, G.; Jiang, J.; Jiang, J.; Zhao, W.X.; Wen, J.-R. Complex knowledge base question answering: A survey. IEEE Trans. Knowl. Data Eng. 2022, 35, 11196–11215. [Google Scholar] [CrossRef]
  10. Wang, J.; Mudhiganti, S.K.R.; Sharma, M. Patentformer: A novel method to automate the generation of patent applications. In Proceedings of the 2024 Conference on Empirical Methods in Natural Language Processing: Industry Track, Miami, FL, USA, 12–16 November 2024; pp. 1361–1380. [Google Scholar]
  11. Mikolov, T.; Sutskever, I.; Chen, K.; Corrado, G.; Dean, J. Distributed representations of words and phrases and their compositionality. arXiv 2013, arXiv:1310.4546. [Google Scholar] [CrossRef]
  12. Yan, Y.; Lei, C.; Jinde, J.; Naixuan, Z. Measuring Patent Similarity with Word Embedding and Statistical Features. Data Anal. Knowl. Discov. 2019, 3, 53–59. [Google Scholar]
  13. Jeon, D.; Ahn, J.M.; Kim, J.; Lee, C. A doc2vec and local outlier factor approach to measuring the novelty of patents. Technol. Forecast. Soc. Change 2022, 174, 121294. [Google Scholar] [CrossRef]
  14. Devlin, J.; Chang, M.-W.; Lee, K.; Toutanova, K. Bert: Pre-training of deep bidirectional transformers for language understanding. In Proceedings of the 2019 Conference of the North American Chapter of the Association for Computational Linguistics, Minneapolis, MN, USA, 3–5 June 2019; Association for Computational Linguistics: Stroudsburg, PA, USA, 2019; pp. 4171–4186. [Google Scholar]
  15. Wang, J.; Wang, L.; Ji, N.; Ding, Q.; Zhang, F.; Long, Y.; Ye, X.; Chen, Y. Enhancing patent text classification with Bi-LSTM technique and alpine skiing optimization for improved diagnostic accuracy. Multimed. Tools Appl. 2025, 84, 9257–9286. [Google Scholar] [CrossRef]
  16. Haghighian Roudsari, A.; Afshar, J.; Lee, W.; Lee, S. PatentNet: Multi-label classification of patent documents using deep learning based language understanding. Scientometrics 2022, 127, 207–231. [Google Scholar] [CrossRef]
  17. Bekamiri, H.; Hain, D.S.; Jurowetzki, R. Patentsberta: A deep nlp based hybrid model for patent distance and classification using augmented sbert. Technol. Forecast. Soc. Change 2024, 206, 123536. [Google Scholar] [CrossRef]
  18. Kosonocky, C.W.; Wilke, C.O.; Marcotte, E.M.; Ellington, A.D. Mining patents with large language models elucidates the chemical function landscape. Digit. Discov. 2024, 3, 1150–1159. [Google Scholar] [CrossRef] [PubMed]
  19. Yeom, J.; Lee, H.; Byun, H.; Kim, Y.; Byun, J.; Choi, Y.; Kim, S.; Song, K. Tc-llama 2: Fine-tuning LLM for technology and commercialization applications. J. Big Data 2024, 11, 100. [Google Scholar] [CrossRef]
  20. Keraghel, I.; Morbieu, S.; Nadif, M. Beyond words: A comparative analysis of LLM embeddings for effective clustering. In Proceedings of the International Symposium on Intelligent Data Analysis, Stockholm, Sweden, 24–26 April 2024; Springer: Berlin/Heidelberg, Germany, 2024; pp. 205–216. [Google Scholar]
  21. Jiang, L.; Scherz, P.A.; Goetz, S. Towards Better Evaluation for Generated Patent Claims. arXiv 2025, arXiv:2505.11095. [Google Scholar] [CrossRef]
  22. Xiong, Q.; Xu, Z.; Liu, Z.; Wang, M.; Chen, Z.; Sun, Y.; Gu, Y.; Li, X.; Yu, G. Enhancing the Patent Matching Capability of Large Language Models via the Memory Graph. In Proceedings of the 48th International ACM SIGIR Conference on Research and Development in Information Retrieval, Padua, Italy, 13–18 July 2025; pp. 337–347. [Google Scholar]
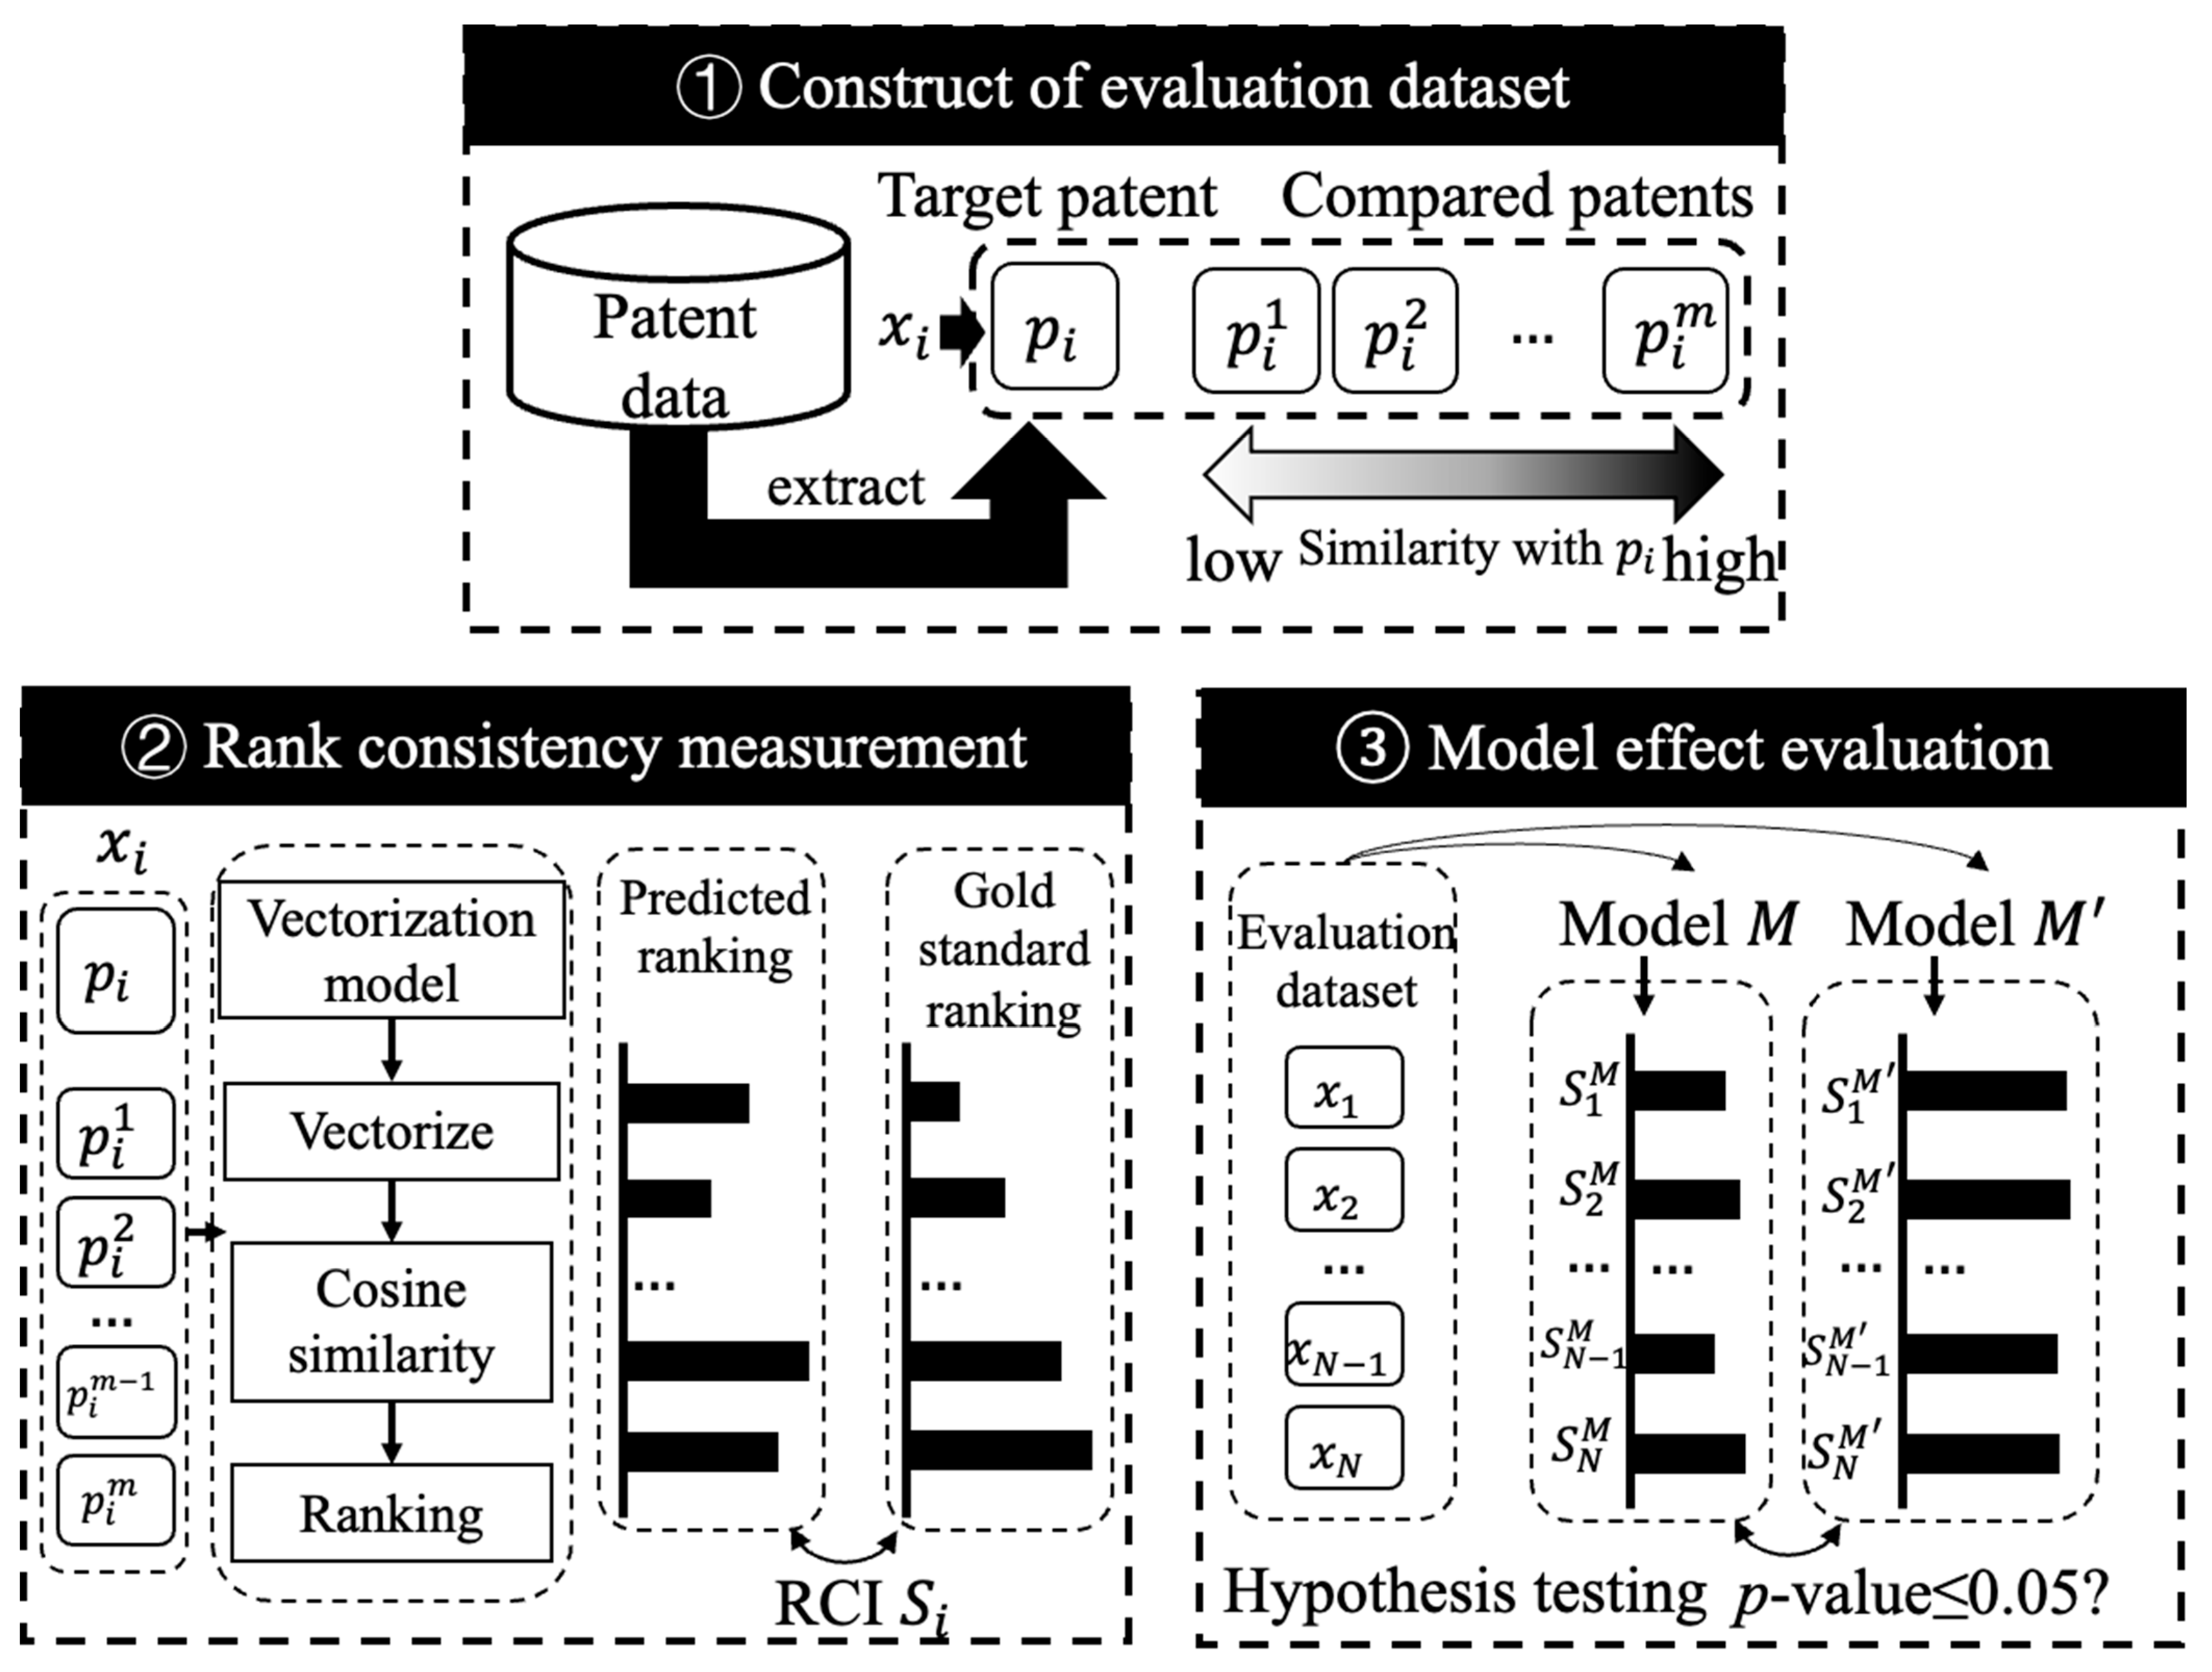
Figure 1. Framework of effect evaluation on patent semantic similarity measurement.
Electronics 14 04056 g001
Figure 2. Framework of empirical study on the effect evaluation of patent semantic similarity measurement.
Electronics 14 04056 g002
Figure 3. The reported running time per sample of the models that run on GPU.
Electronics 14 04056 g003
Figure 4. The performance of models in different years, where the value is the average number of a model outperforming other compared models.
Electronics 14 04056 g004
Figure 5. The performance comparison of models across IPC categories A−H.
Electronics 14 04056 g005
Figure 6. Model performance and robustness under different sampling sizes (j = 3–20). Average rank consistency index (RCI) values are reported with shaded regions representing one standard deviation across five random seeds.
Electronics 14 04056 g006
Table 1. The running time of vectorization models on CPU.
Model DimensionHardwareBatch SizeRunning Time
TFIDF20,000CPU10.14 s
Word2vec300CPU11.36 s
Bert768CPU132.5 s
PSBert768CPU129.3 s
BGE768CPU134.2 s
Disclaimer/Publisher’s Note: The statements, opinions and data contained in all publications are solely those of the individual author(s) and contributor(s) and not of MDPI and/or the editor(s). MDPI and/or the editor(s) disclaim responsibility for any injury to people or property resulting from any ideas, methods, instructions or products referred to in the content.