Abstract
There are well-known issues in conjunction with eliciting probabilities, utilities, and criteria weights in real-life decision analysis. This article explores various computationally efficient methods for generating weights in multi-criteria decision support systems. Therefore, it constitutes an aid for MCDA modellers and tool designers in selecting surrogate methods for criteria weights. Given the challenges in eliciting precise criteria weights from decision-makers, this study evaluates a range of techniques for automatically generating surrogate weights, focusing on both ordinal and cardinal ranking approaches. With a thorough inquiry methodology never before used, we examine automatic multi-criteria weight-generating algorithms in this article. The methods tested include traditional rank-based models such as rank sum (RS), rank reciprocal (RR), and rank order centroid (ROC), alongside newer approaches like the sum reciprocal (SR) and cardinal sum reciprocal (CSR). The results show that the SR approach for the ordinal case and the CSR method for the cardinal case perform better in terms of robustness than other methods, even including the promising new geometric class of methods. It is also shown that linear programming (LP) performs poorly when compared to surrogate weight models. Additionally, as expected, the cardinal models perform better than the ordinal models. Unexpectedly, though, the well-established LP model’s performance is worse than previously thought.
1. Introduction
Multi-criteria decision analysis (MCDA) constitutes a subfield of decision analysis. Within MCDA, multi-attribute value theory (MAVT), and its probabilistic counterpart multi-attribute utility theory (MAUT), stands as a principal methodology for quantifying outcomes [1]. Among the various models in MAVT, the additive model is the most prevalently employed [2], whereby the resultant (weighted) value is derived according to Equation (1). An alternative approach, though much less common, involves a multiplicative model, as outlined, for instance, in [3]. This research assesses the outcomes by applying the additive model, wherein the utility of each alternative is quantified using the equation
With this equation, the overall sum V(a) for each alternative can be determined by the sum of the products wi and vi over all indices i, i.e., the criteria weights and the attribute values. Finally, using this additive model, the alternative that results in the largest value is chosen.
The absence of quantitatively precise data regarding the weights of criteria in a decision-making context presents a challenge in evaluating numerous MCDA models, particularly when a larger set of criteria must be considered [3]. A variety of specialised models have been introduced in the literature, such as second-order techniques [4] and modifications to traditional decision rules [5,6]. Other models focus on ROC methods or preference intensities [7,8,9]. Decision-makers are typically unable to provide exact numerical values for the criteria weights, instead relying on ordinal information (a simple ranking) or preference intensity (a ranking with varying distances between elements). Several approaches have been developed to address these conditions. The first involves the use of automatically generated weights (commonly referred to as surrogate weights), and the second entails the application of dominance intensity measures. Moreover, various methods for eliciting criteria weights exist, including one based on point distribution theory and another grounded in the principle of direct rating, as detailed in Section 2. These two distinct methodologies yield criteria weights with differing levels of flexibility. The literature documents various model performances for surrogate weights, contingent on the degree of freedom allowed. This article focuses on surrogate weight methods and preference strength methods.
The current state of research in the area of weight elicitation methods is well described in [10]. In the literature, the performance of different weight generation methods has been compared before. The comparison of preference strength methods (described below) can be found, for example, in [11]. Newer methods have been developed for ordinal information in recent time, for example, IROC [12] or ROL [13]. A recent article on the selection of appropriate weighting methods is [14].
Also, in the case where more than only ordinal information is available, newer methods have been developed, for example, FUCOM [15], LBWA [16], and DIBR [17,18] methods. Each of these three methods consists of several steps. The first step is always an ordinal ranking of the criteria. Then, the next steps require more information from the user. However, since these additional steps either expand the ordinal approach or differ from the cardinal ranking approach as implemented in this study, we exclude them from this article. Nevertheless, a comparison using a more general framework seems interesting and possible in the future.
Furthermore, for weight elicitation, objective methods have been developed, for example, WENSLO [19], LOPCOW [20,21], CRITIC [22] and D-CRITIC [23]. These objective methods do not take individual preferences into account. On the contrary, the surrogate weight methods studied in this article take the subjective preference of the decision-maker into account, represented by using the assumption of true inner weights. This approach explicitly assumes the existence of individual preferences. In this study, we exclude the comparison with objective methods since the focus is on the comparison based on the true inner weights approach. However, a more general comparison of weight elicitation methods, taking objective methods into account, could offer new insights, especially if there are larger deviations between these different approaches.
To the authors’ knowledge, a comparison of this nature has never been carried out for linear programming (LP) models. In this study, robustness—the behaviour of models independent of various degrees of freedom—is also examined. To sum up, the article’s main contributions are as follows:
- ○
- A thorough investigation of the efficacy of the most commonly used surrogate weights, their advantages and disadvantages.
- ○
- The introduction and assessment of a new class of weight methods (geometric/multiplicative).
- ○
- Contrasting and measuring linear programming with surrogate weight methods
- ○
- Measurements of the effects of weight filters contra pure (original) weights on performance.
2. Methods
Decision-makers (DMs) often lack knowledge of the precise criteria weights or prefer not to use them directly. Several methods have been developed to address those scenarios. One such technique involves the use of automatically generated surrogate weights, which can be applied when only the ranking of criteria weights is known but their exact values are not. The outcome of the additive model can be determined through the application of these automatically produced weight approaches, which transform the imprecise information provided by the DM into surrogate weights that reflect the DM’s judgments regarding the decision context [24,25,26,27,28].
Ordinal ranking and preference-strength ranking are fundamental concepts within the domain of surrogate weights, with preference strength representing an advancement of the ordinal approach. In ordinal ranking, criteria weights are ordered based on their perceived importance to the DM, but the relative distances (or differences in importance) between the weights are not considered. The preference strength method, however, incorporates information regarding the relative importance of the criteria weights, complementing the ranking with an indication of the strength of preference, such as criterion 1 being considerably more important than criterion 2, criterion 2 being slightly more important than criterion 3, and so on.
In this article, the following classic automatic (surrogate) generation methods are considered: rank sum weights (RS) [29], rank reciprocal weights (RR) [29], and centroid (ROC) weights [30]. They are compared to the more modern sum reciprocal weights [11], from the same family of methods, to geometric methods, and, to the authors’ knowledge for the first time, to the class of LP methods.
2.1. Ordinal Ranking
Many different surrogate weight methods have been developed over time. Well-studied methods include the rank sum (RS), rank reciprocal (RR), and the rank order centroid (ROC). In the presentations, N stands for the number of weights where each weight variable wi is subject to Σwi = 1 and 0 ≤ wi.
For RS, the weights are given by Equation (2)
For RR, the weights are assigned based on Equation (3)
ROC is a function based on the average of the corners in the polytope defined by the simplex Sw = w1 > w2 > … > wN, Σwi = 1, and 0 ≤ wi, where wi are variables representing the criteria weights. The ROC weights are then given by Equation (4)
for the ranking number i among N items to rank [30]. The sum reciprocal (also known as sum rank) (SR) method was proposed in [11]. It is a linear combination of the RS and RR methods to reduce the extreme behaviours of both methods. The SR method allocates the weights according to the formula in Equation (5)
Additionally, we investigate the geometric sum (GS) method, which reflects the rank order multiplicatively in the numeric weights. As shown in its formula below, GS contains the parameter s. This article measures different levels of s and their performance. For the geometric sum method, the formula to assign the criteria weights is Equation (6)
In this article, we also study the behaviour for s > 1 since it has not been considered before, according to a literature study by the authors. We direct readers to [24,25,26,27,28,29,30] for a more thorough examination of the traditional ordinal approaches because much has already been written about them.
2.2. Cardinal Ranking
The idea of preference strength (cardinal ranking) is a refinement of ordinal ranking techniques. By this notion, it is used to provide more details about the reliability of the rankings between each criterion. The degree of preference can be seen by comparing the relative weights of the various criteria. Four alternative preference strengths, ranging from “equally important” to “much more important”, are used by [1]. Since the range of evaluations is continuous and a DM does not know its exact inner assessments, this research study takes a different method since the condition of “equally important” is less likely to occur.
Assigning preference strength information to a weight scale results in a total number Q of scale positions and position p(i) for each criterion i. Here, position 1 corresponds to the most important position (leftmost), and position Q corresponds to the least important position (rightmost). Using this approach, the ordinal methods RS, RR, ROC, SR, and GS are transformed into their cardinal counterparts, resulting in the CRS, Equation (7), CRR, Equation (8), CRC, Equation (9), CSR, Equation (10), and CGS, Equation (11), methods. The formulas for the methods are as follows:
where, as above, Q is the total number of scale positions and p(i) is the particular position of criterion i. Analogously to other ordinal methods, GS can be reframed as a cardinal method (CGS) using a similar approach. It should be noted that the definition of cardinal weights differs from that in [31]. In this article, the cardinal extension to ordinal methods is made by allowing the number of steps p(i) − p(i − 1) to be from one (the ordinal case) to many, while in [31], p(i) = p(i − 1) is also allowed.
2.3. LP for MCDA
Linear programming (LP) provides an alternative approach for identifying optima across various problems. Given that Equation (1) can be interpreted as a maximisation problem, it is worth investigating whether LP techniques are effective for managing such imprecise information. In LP, an objective function serves as the target to be maximised. This objective function contains variables, which, in this case, are the criteria weights. The ordinal ranking can be replicated by appropriately formulating the constraints of the LP problem.
The LP formulation for MCDA can be structured in a manner that makes it comparable to surrogate weight methods in terms of handling imprecise information. In this study, the R package lpSolve (version 5.6.23) was utilised to implement the LP methods via R scripts. In an LP-based MCDA approach, the weights are treated as the decision variables. Let w1, w2, …, wN be the weight variables, sorted in descending weight order. Then, the constraints of the LP problem can be rewritten as follows in Equation system (12):
Because well-behaved pseudo-random numbers with long periods are used in the procedure, sampling the same weights is highly unlikely. Hence, there is no practical difference in using either ≥ or >. Let j = 1, …, m be an alternative’s number. Then, for each alternative j, the objective function can be written as Equation (13)
Next, the maximum value of each alternative is determined, and the alternative with the highest maximum value is selected as the winning alternative. Finally, the hit ratios can be compared for both LP and the surrogate weight methods.
In order to try to improve the performance, an adjustment is also made to the minimum distances. Therefore, a large set of weight vector samples is generated for each generator. These weight vectors are ordered, and then the means of the ordered weights are calculated. This results in a vector of mean ordered weights. Based on these vectors, the average distance between the different ordered weights (e.g., the largest to the second largest, the second largest to the third largest, etc.) can be used as the minimum distance for the above-mentioned constraints, i.e., Equation system (14)
2.4. Weight Elicitation
Several methods exist for eliciting the weights. Two primary approaches employed in this article are point scoring and direct rating. The point allocation (PA) mechanism used in the scoring-points scenario is based on [32]. In PA, each criterion is assigned a specific number of points from a pre-determined total (such as 100 or 1000). Consequently, each criterion is allocated a point value, with higher values corresponding to greater weights. The total point sum represents the sum of all allocated points. The points for the final weight are determined by the points assigned to the preceding weights since the total point sum for N weights is fixed. Thus, the PA method provides N − 1 degrees of freedom (DoF). In contrast, direct rating (DR) allows each criterion to be assigned arbitrary points or other metrics. These points are subsequently normalised into weights by dividing each point total by the overall sum of points. As a result, DR affords N degrees of freedom, as the weights of all criteria sum to 1 and are independent. Experiments using various DoFs are compared in the tables in Section 3.
2.5. Modelling Workflow
In the following, the general modelling workflow is described. This workflow includes both surrogate weight methods and LP. In the beginning, the general simulation settings are determined: the seed, the number of runs, the number of criteria, the number of alternatives, the number of scenarios, and vectors containing parameters.
Two number generators are employed in the simulations:
- (a)
- This generator is used if only ordinal information is available. In order to simulate the weight for ordinal information, a mix of an N-generator and an N–1-generator is applied. The composition of the mix depends on the corresponding s vector’s value (evaluation via a for-loop). Therefore, for the N-generator, n independent values are sampled using a uniform distribution with normalisation of the generated independent values. On the other hand, a Dirichlet distribution is used for the N–1-generator. This is accomplished by using the rdirichlet function from the R gtools package (version 3.9.5).
- (b)
- This generator is employed when preference strength information is available. To simulate the weights for the preference strength data, the same procedure as in (a) is applied, but using Q criteria positions instead of N criteria, where Q > N. Subsequently, a ranked matrix is derived from the mix matrix, resulting in a matrix that assigns the Q weights to each row in descending order. A type matrix is then calculated from the ranked matrix. This type matrix categorises each value of the ranked matrix into one of two types. Either an entry is assigned the value wi or an entry is assigned the value pi. Both the first and last entries of each row are always wis; for the other wis, random sampling without replacement is applied. The coding is as follows: wis are mapped to 1, whereas pis are mapped to 0. After that, the ranked matrix is multiplied row-wise by the type of the matrix’s corresponding row.
In the final step, a normalisation is applied to the weights wi and the original ranks (with a range of 1 to Q) are recorded. Information on the original ranks is needed to calculate the surrogate weight.
The simulation is run a large number of times until the results converge. For each run, we compare whether each method has the same best alternative as the best alternative using the true weights. In case of a match, a hit (1) is recorded. If no match is obtained, then 0 is recorded as the result, meaning no hit. The hit ratio is calculated as the number of hits for each method divided by the overall number of simulations.
2.6. Filtering
Criticisms have been raised against unrestricted simulation methods, highlighting the occurrence of “unnatural” weight distributions within the weight vectors. This unnaturalness manifests when weights vary excessively from one another [31]. The primary solution proposed is to apply filters to weight vectors that appear unnatural in some way. In [33], a filter of 0.2 is implemented, meaning that if the difference between the largest and second-largest weights exceeds 0.2, the weight vector is resampled. The filter approach used in this study differs from that in [31], where weight vectors are discarded when a weight component falls outside predefined thresholds. In addition to the 0.2 filter from [33], filters of 0.1, 0.3, and 0.4 are applied in this study, in line with [34], which extends the work in [35].
2.7. Variations in Results
Often, in the literature, only one value per hit ratio is given. However, variations in the results occur depending on the chosen seed for the random number generation. We study the variations resulting from this effect for a selection of surrogate weight methods with different criteria/alternative combinations and different DoF. Thus, we use 10 different random seeds for this approach and calculate a mean hit ratio for each aforementioned combination. Additionally, we also studied the effect of filters on the variation in the results.
3. Results
In this study, the software used for the simulations was R, which is an open-source statistical software. This section presents the results from the simulations. It compares the performance of the studied surrogate weight techniques. The evaluation focuses on the robustness of these methods across different degrees of freedom (DoF), which represent natural variations in the decision-makers’ behaviours. The tables and graphs highlight how the methods perform under various conditions and provide insights into their reliability for a variety of usage scenarios. Throughout the article, the best-performing methods in each category are marked in green.
3.1. Determining the Parameter s for GS and CGS
Although the simulations were run for many combinations of criteria and alternatives, we show the representative combination of three, six, and nine criteria and three, six, and nine alternatives for these weight methods. Table 1, Table 2 and Table 3 compare the GS and CGS methods for different s parameters with the established methods SR and CSR. The DoF split columns show the mean of the hit ratios over different distributions of DoF. This gives information about the robustness of the studied methods. The higher the mean, the better the method is regarding robustness. A split of 1.0 means that only the N-generator was used, whereas a split of 0.0 corresponds to using only the N–1-generator.

Table 1.
Comparing the GS and CGS methods for 3 criteria and 3 alternatives.
Table 2.
Comparing the GS and CGS methods for 6 criteria and 6 alternatives.
Table 3.
Comparing the GS and CGS methods for 9 criteria and 9 alternatives.
GS performs best for s-values between 0.7 and 0.8 using ordinal information only. Also, taking preference strength information into account, CGS performs best for an s-value of 0.9. Up to an s-value of 0.7, the geometric sum method performs better for N–1 DoF. For larger values of s, the performance of the geometric sum method is better for N DoF. CGS performs better for N–1 DoF for all values for the parameter s. Again, values of 1 and larger for the parameter s clearly decrease the hit ratios. For further studies, a value of 0.75 was chosen for s. It has to be noted that this is supposed to be a representative choice for this study, but other values are not unreasonable to choose. Depending on the setting, other values might result in better hit ratios. However, 0.75 seems to be a good choice for general comparisons.
3.2. General Comparison of Methods
Having found the best numbers for the s parameter, we next compare GS and CGS to a larger set of well-known and well-performing methods. In Table 4, Table 5, Table 6 and Table 7, the DoF split columns show the mean of the hit ratios over the DoF split. The STDEV column additionally shows the standard deviations of the hit ratios over the N-/N–1-split (calculated for a range between 0 and 1 in steps of 0.1). Both measures provide information about the robustness of the studied methods. The higher the mean and the smaller the standard deviation, the better the method is in terms of robustness. As before, a split of 1.0 means that only the N-generator was used, while a split of 0.0 corresponds to using only the N–1-generator.
Table 4.
Comparing GS and CGS with established methods for 3 criteria and 3 alternatives.
Table 5.
Comparing GS and CGS with established methods for 6 criteria and 6 alternatives.
Table 6.
Comparing GS and CGS with established methods for 9 criteria and 9 alternatives.
Table 7.
Comparing GS and CGS with established methods for 12 criteria and 12 alternatives.
For ordinal methods, it can be seen that ROC performs best for a smaller number of criteria (three and six) and GS best for nine criteria. For preference strength methods and also overall, CSR shows the best robustness of all methods, measured by a high mean hit ratio over all DoF splits and a very low standard deviation over all DoF splits. Both high performance (mean) and robustness (standard deviations) are important to consider when evaluating various surrogate weight methods.
3.3. Comparison with LP
Next, we compare the LP approach with the same established methods. The information in Table 8, Table 9, Table 10 and Table 11 is the same as in the tables above. In order to evaluate the performance of LP, some ordinal methods are included for reference.
Table 8.
Comparing LP with established methods for 3 criteria and 3 alternatives.
Table 9.
Comparing LP with established methods for 6 criteria and 6 alternatives.
Table 10.
Comparing LP with established methods for 9 criteria and 9 alternatives.
Table 11.
Comparing LP with established methods for 12 criteria and 12 alternatives.
It can be seen that LP performs the worst of all methods by a wide margin. The disappointing performance of LP is due to the fact that the criteria weights of the DM determine the maximum utility, together with the alternative values. In this situation, the pure ordinal constraints on the criteria weights do not map favourably. Further study is needed to determine whether this disadvantage can be circumvented.
Next, the differences in the mean ordered weights are applied to the constraints (Table 12, Table 13 and Table 14). Therefore, the mean ordered weight vectors are determined. Using 1 million samples results in the following vectors.
Table 12.
Mean ordered weight vectors for 3, 6, and 9 criteria.
Table 13.
Differences between mean ordered weight vectors for 3, 6, and 9 criteria.
Table 14.
Comparing distance-adjusted LP with established methods for 3 criteria and 3 alternatives.
This is in accordance with [11], showing that the mean ordered weight vectors resulting from an N–1-generator are more extreme than those from an N-generator. We can also see that the differences between the mean ordered weights are quite similar for N DoF.
We studied the 3/3, 6/6, and 9/9 combinations. However, we were not able to increase the performance of the LP method systematically. The changes are so small that it is unclear whether they are due to method changes or random variations. In Table 14, there are some variations for all methods compared to Table 8. We discuss the general influence of variation in the random seeds in Section 3.5.
Nevertheless, calculating the mean ordered weights gave useful insights for an approximation for the alternative maximum hit ratio, introduced by [34]. There, after running many simulations with stepwise changes in the surrogate weights, the mean ordered weights were often close to the winning weight vectors.
3.4. Applying Filters
Again, the terminology in Table 15, Table 16, Table 17 and Table 18 is the same as before. The ordinal methods are in the upper part of the tables, whereas the preference strength methods are in the lower part.
Table 15.
Applying filters to the simulations for 3 criteria and 3 alternatives.
Table 16.
Applying filters to the simulations for 6 criteria and 6 alternatives.
Table 17.
Applying filters to the simulations for 9 criteria and 9 alternatives.
Table 18.
Applying filters to the simulations for 12 criteria and 12 alternatives.
As in the general comparison, ROC performs best for the ordinal methods with a lower number of criteria, whereas SR generally performs best with an increasing number of criteria. For preference strength methods, CSR clearly performs best, with some other methods being equally good in certain instances but not systematically. Generally, it is understandable that CSR, as the best preference strength method, outperforms the ordinal methods since more information is incorporated into this method. Nevertheless, it is interesting to note that some preference strength methods sometimes perform worse than their ordinal counterparts. Thus, it can be seen that more information does not necessarily always yield better results.
3.5. Studying the Variation in Hit Ratios
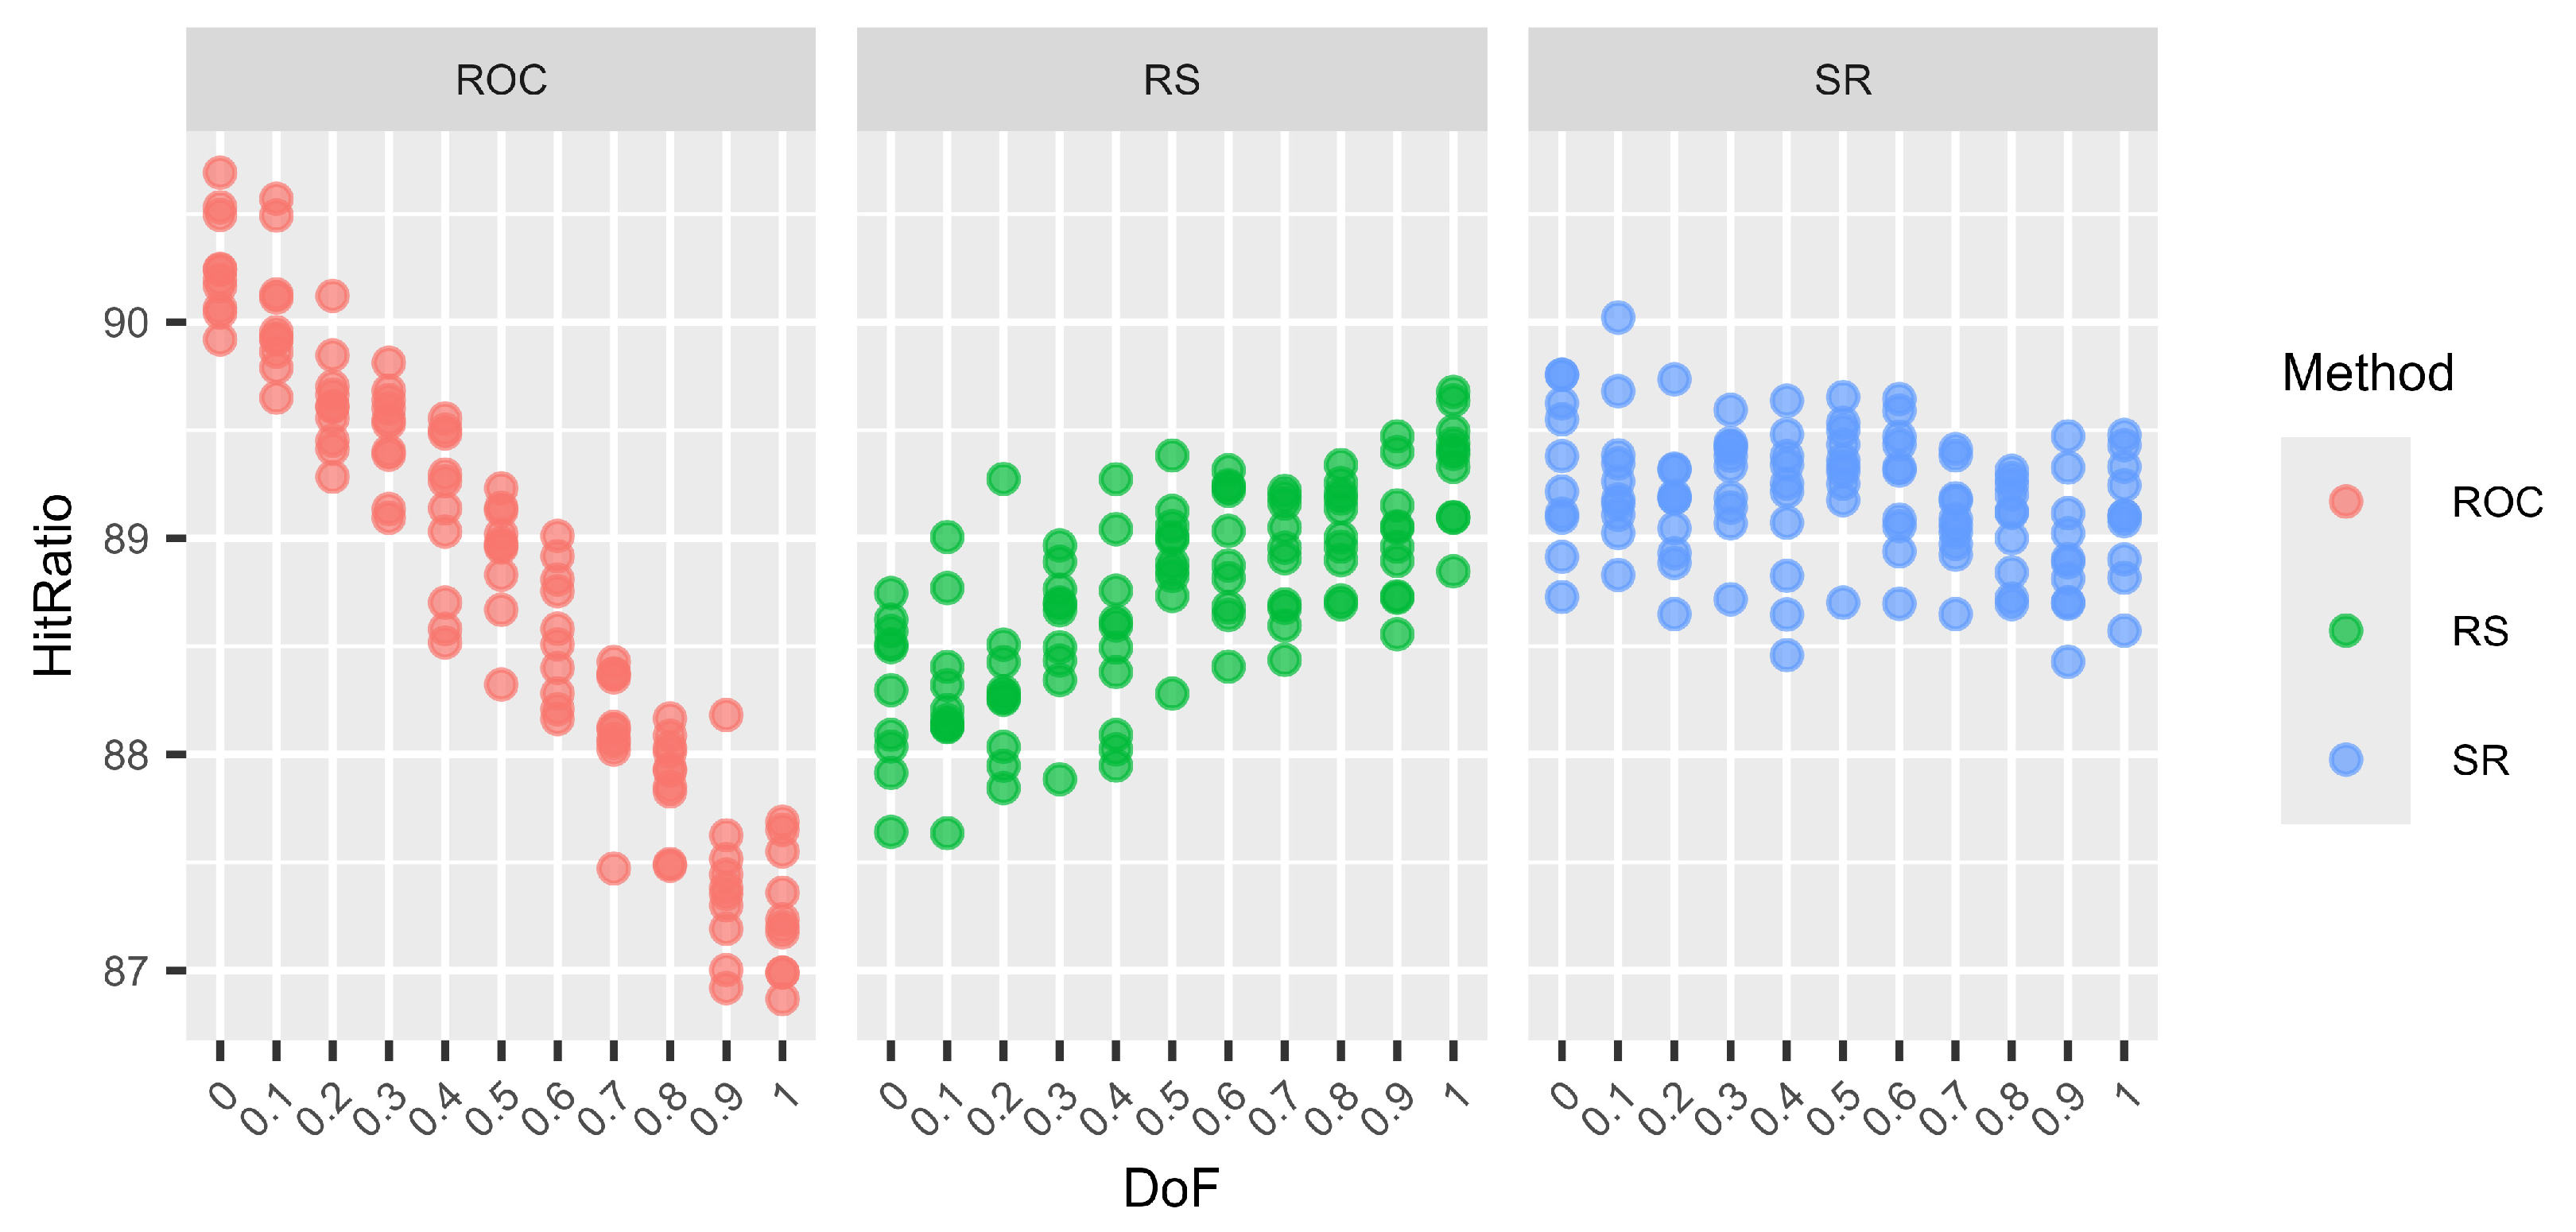
Next, we examine the variation in hit ratios for surrogate weights. To that end, we use the following three well-established distributions: ROC, SR, and RS. The reasoning behind selecting these three methods is that ROC performs very well for N–1 DoF and RS for N DoF, while SR generally performs well regardless of the DoF. In order to study the variation, we used 10 different random seeds for each setting. Hence, instead of calculating only one hit ratio from 100,000 decision situations as before, we now calculate 10 hit ratios for a total of 1,000,000 decision situations and display them as separate dots.
A plot (Figure 1, Figure 2, Figure 3 and Figure 4) and a table (Table 19, Table 20, Table 21 and Table 22) are shown for each number of criteria and number of alternative combinations. Each plot is divided into three subplots, one for each studied surrogate weight method. On the X-axis, the different DoF mixes are shown; on the Y-axis, the mean hit ratios of each of the 10 batches are shown. The tables are divided into parts showing the means (upper half) and the standard deviations of the means (lower half) of the 10 batches for each DoF mix. To the right, a column summarising the overall means and standard deviations, regardless of the DoF, for each method is shown.
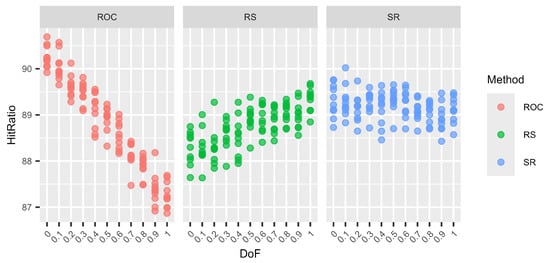
Figure 1.
Variations in the hit ratio for 3 criteria and 3 alternatives for different DoF.
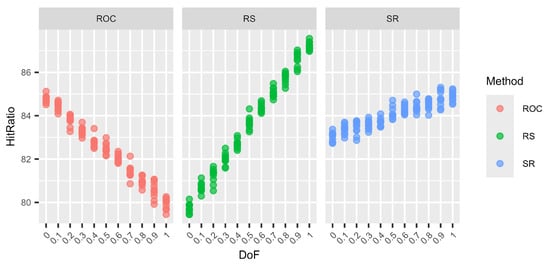
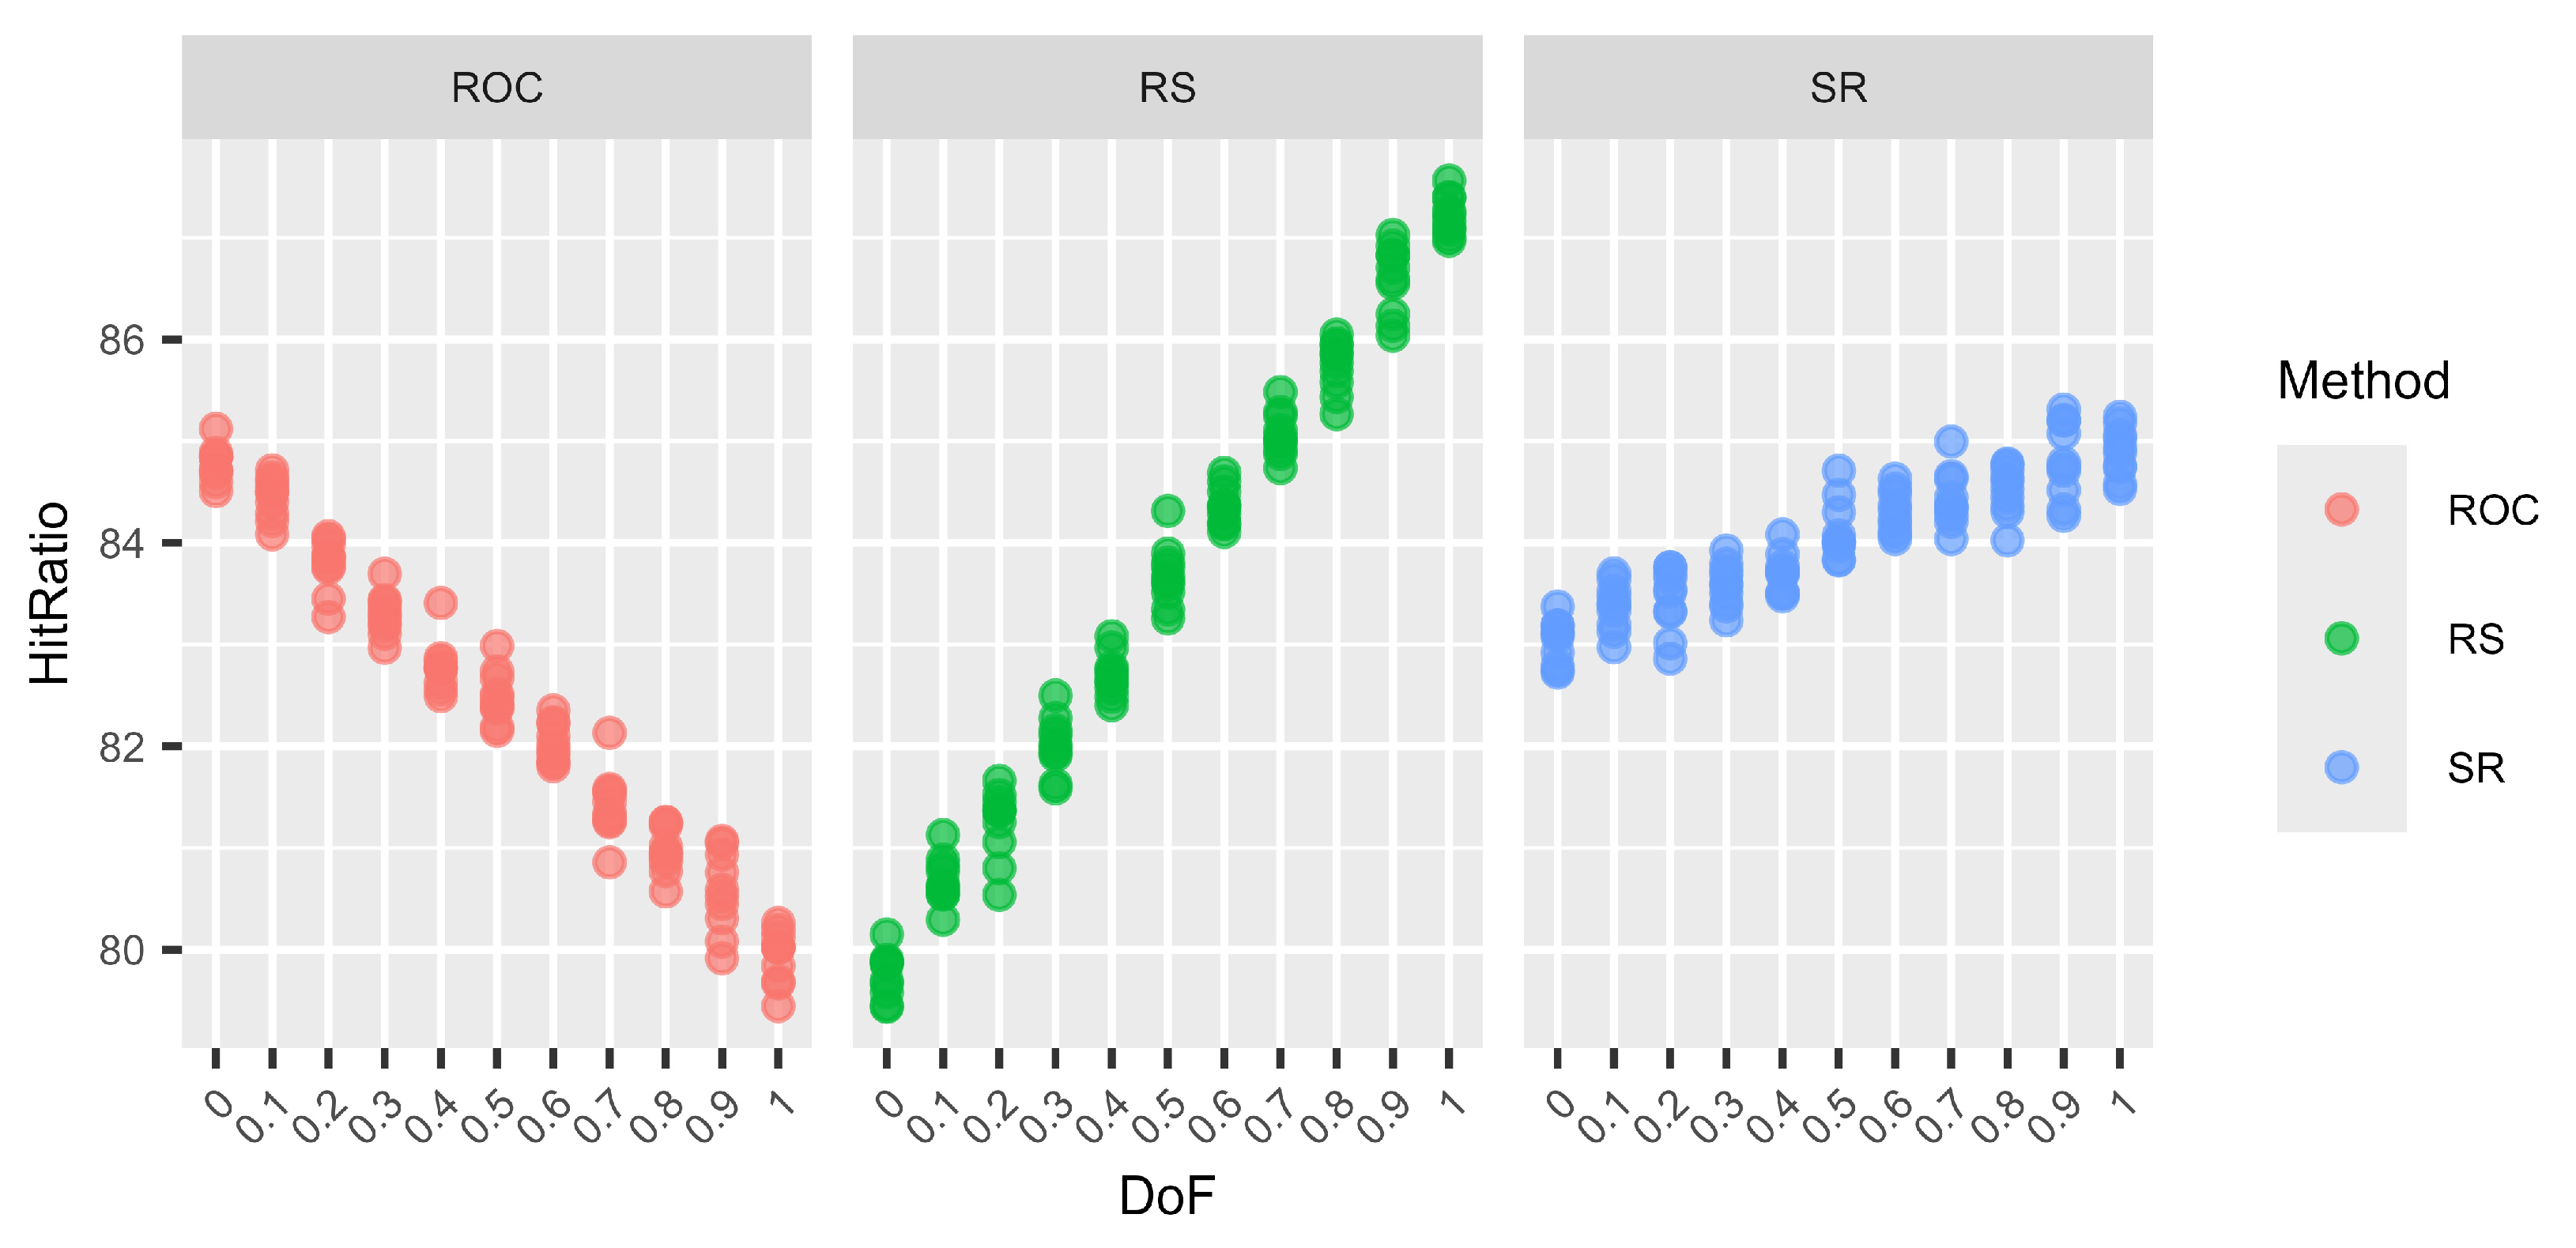
Figure 2.
Variations in the hit ratio for 6 criteria and 6 alternatives for different DoF.
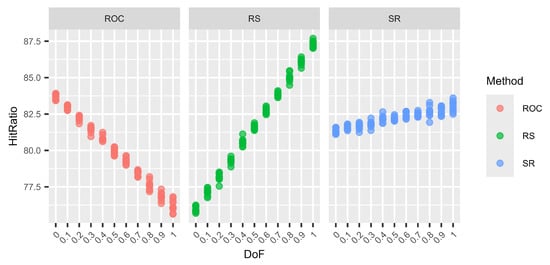
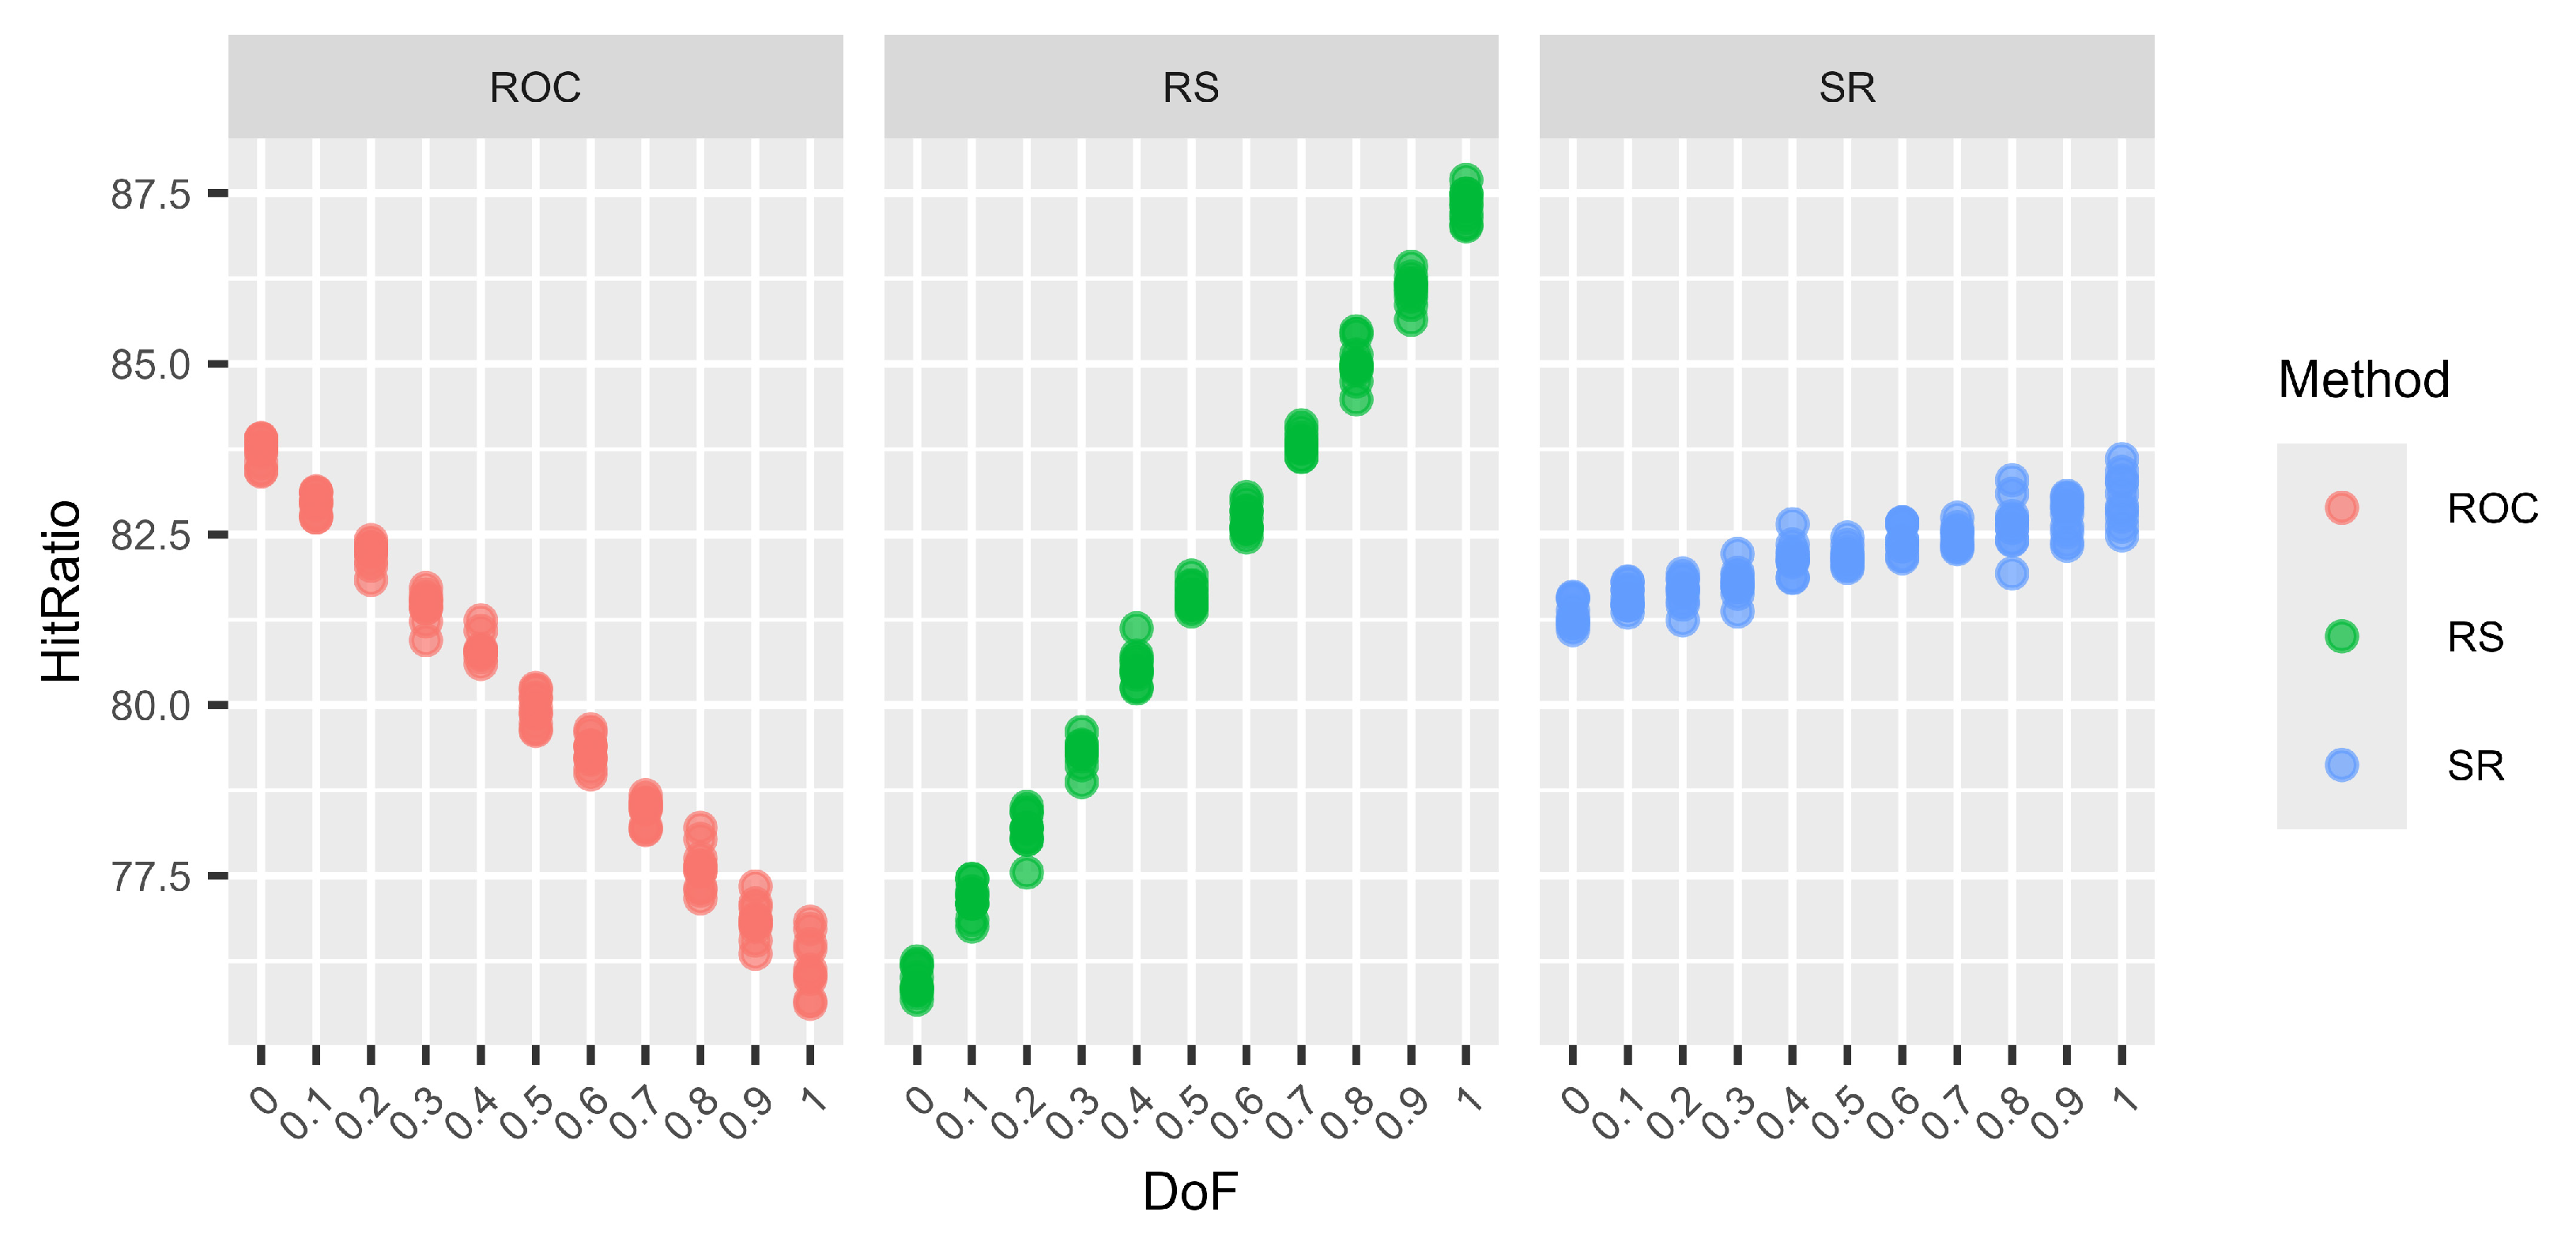
Figure 3.
Variations in the hit ratio for 9 criteria and 9 alternatives for different DoF.
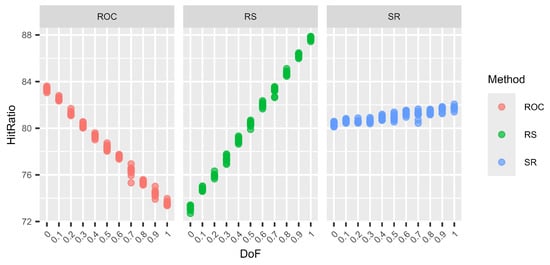
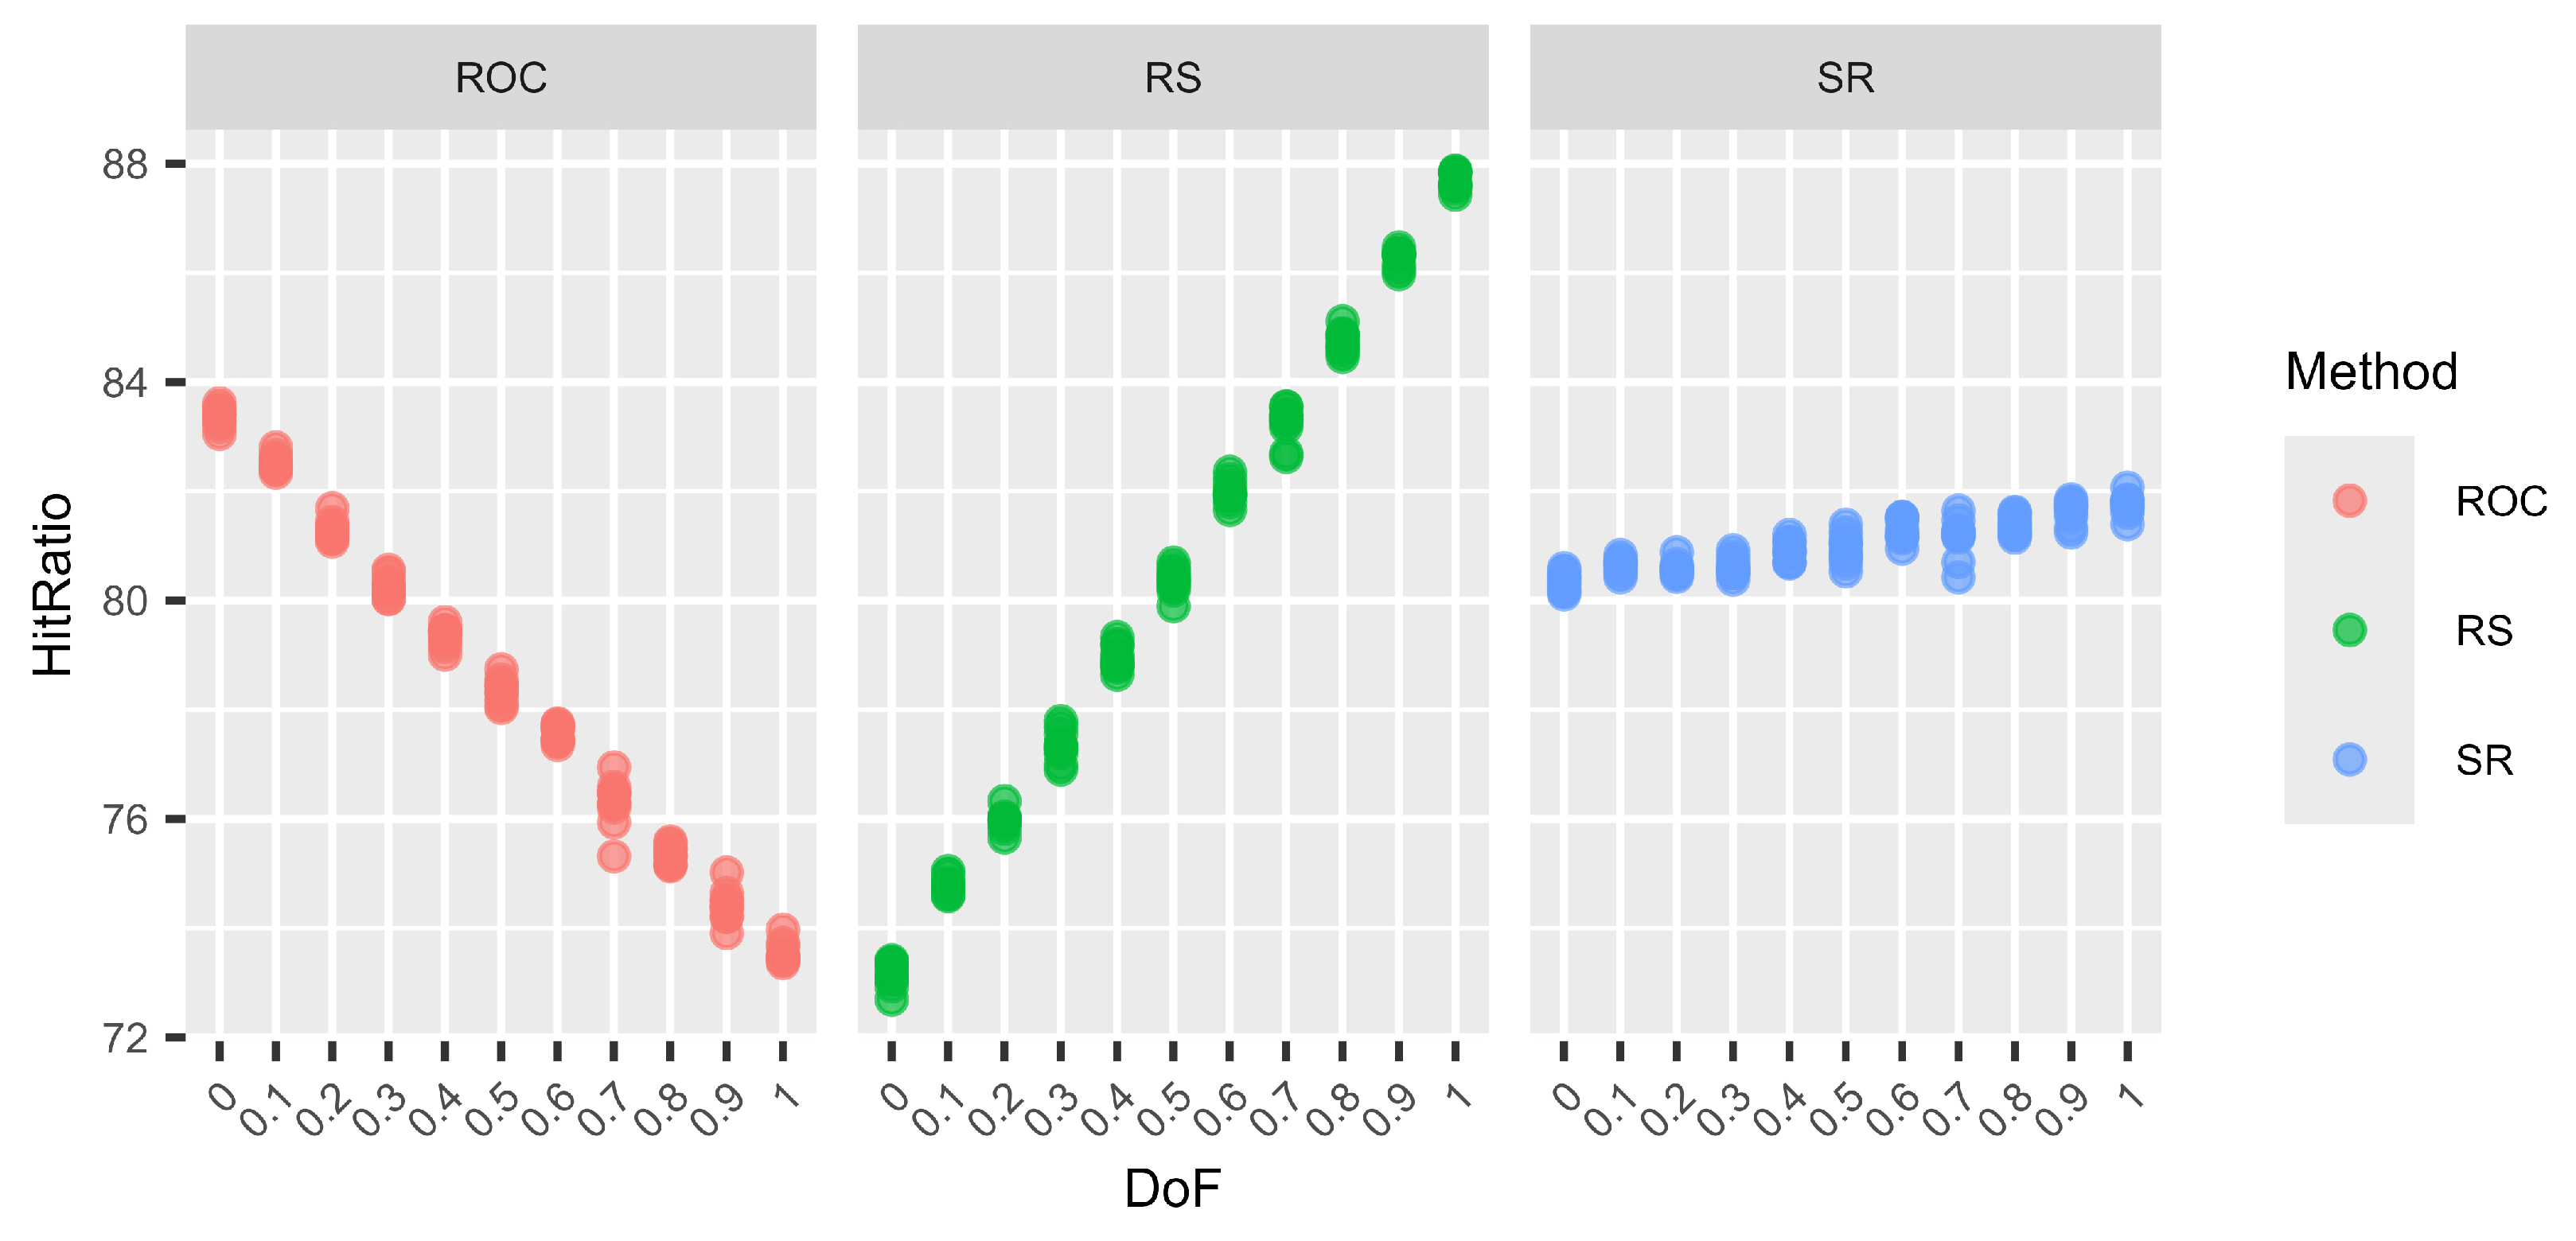
Figure 4.
Variations in the hit ratio for 12 criteria and 12 alternatives for different DoF.
Table 19.
Variations in the hit ratio for 3 criteria and 3 alternatives for different DoF.
Table 20.
Variations in the hit ratio for 6 criteria and 6 alternatives for different DoF.
Table 21.
Variations in the hit ratio for 9 criteria and 9 alternatives for different DoF.
Table 22.
Variations in the hit ratio for 12 criteria and 12 alternatives for different DoF.
The graphs (Figure 1, Figure 2, Figure 3 and Figure 4) show no clear difference in the variation within each DoF mix for the different methods. However, it is clearly visible that the variation within each DoF mix for ROC and RS is smaller than the variation between different DoF mixes. The graphs clearly show that the SR method behaves very stably for different DoFs.
From Table 19, Table 20, Table 21 and Table 22, we can see that only for SR is the overall standard deviation similar to or only slightly higher than the standard deviation of the means for each DoF mix. For ROC and RS, the overall standard deviation is significantly higher than the standard deviation due to random seed variation within each DoF mix. Altogether, SR is a very robust method with only small variations, not only within each DoF mix but also overall, regardless of the chosen DoF generator.
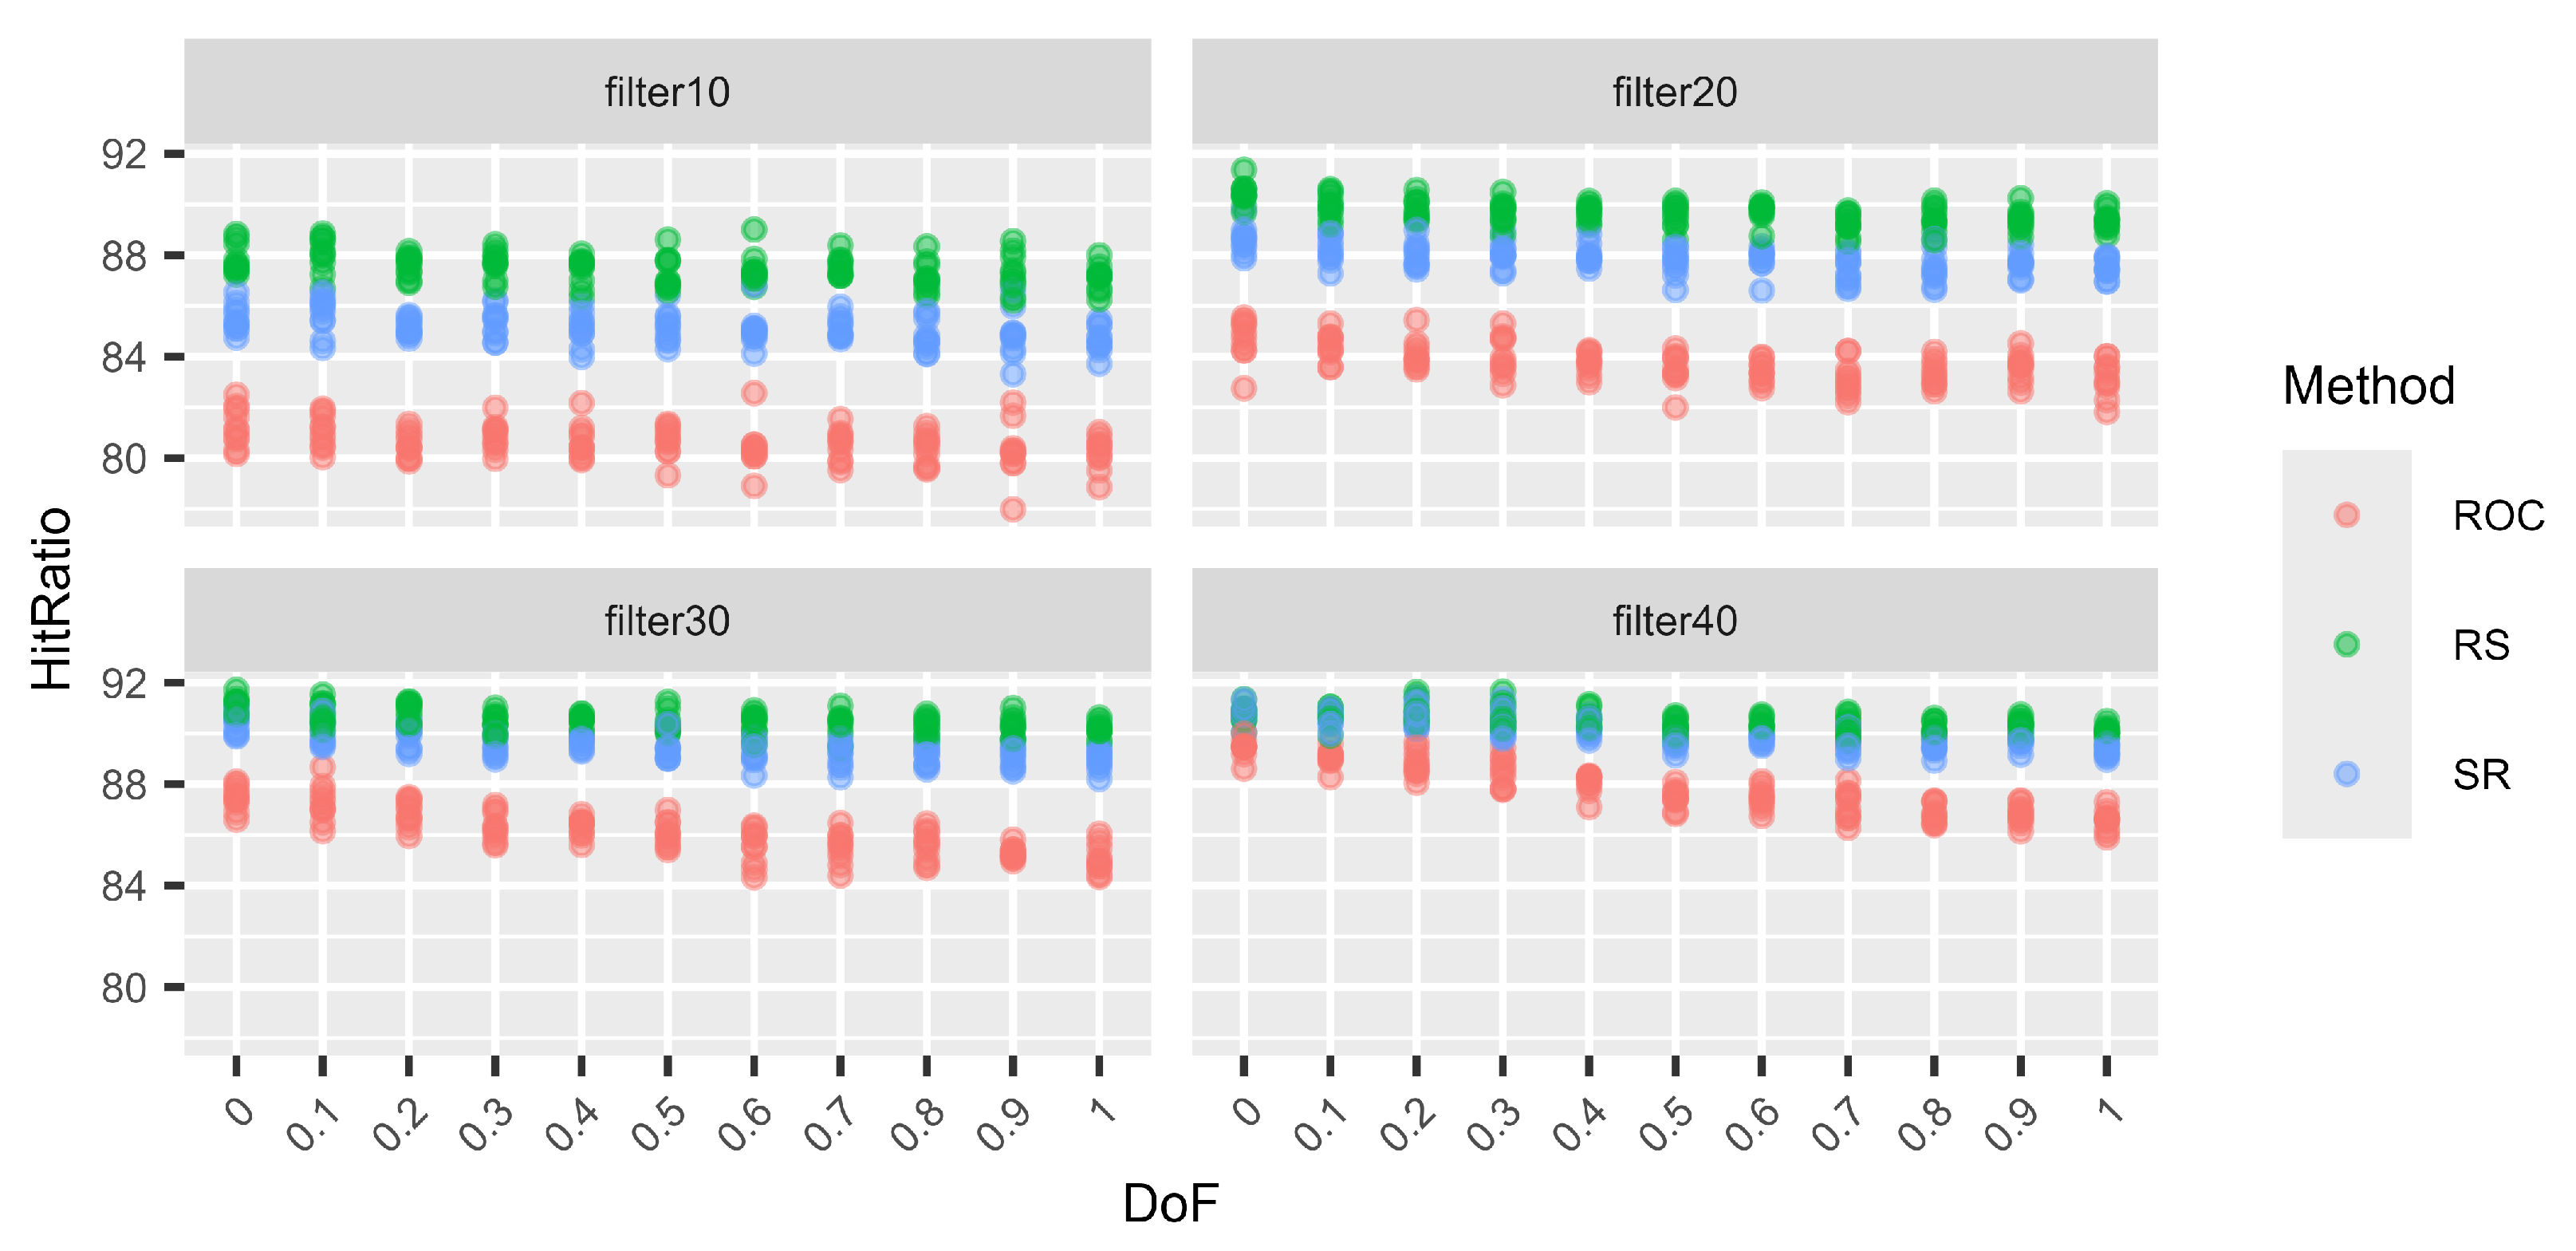
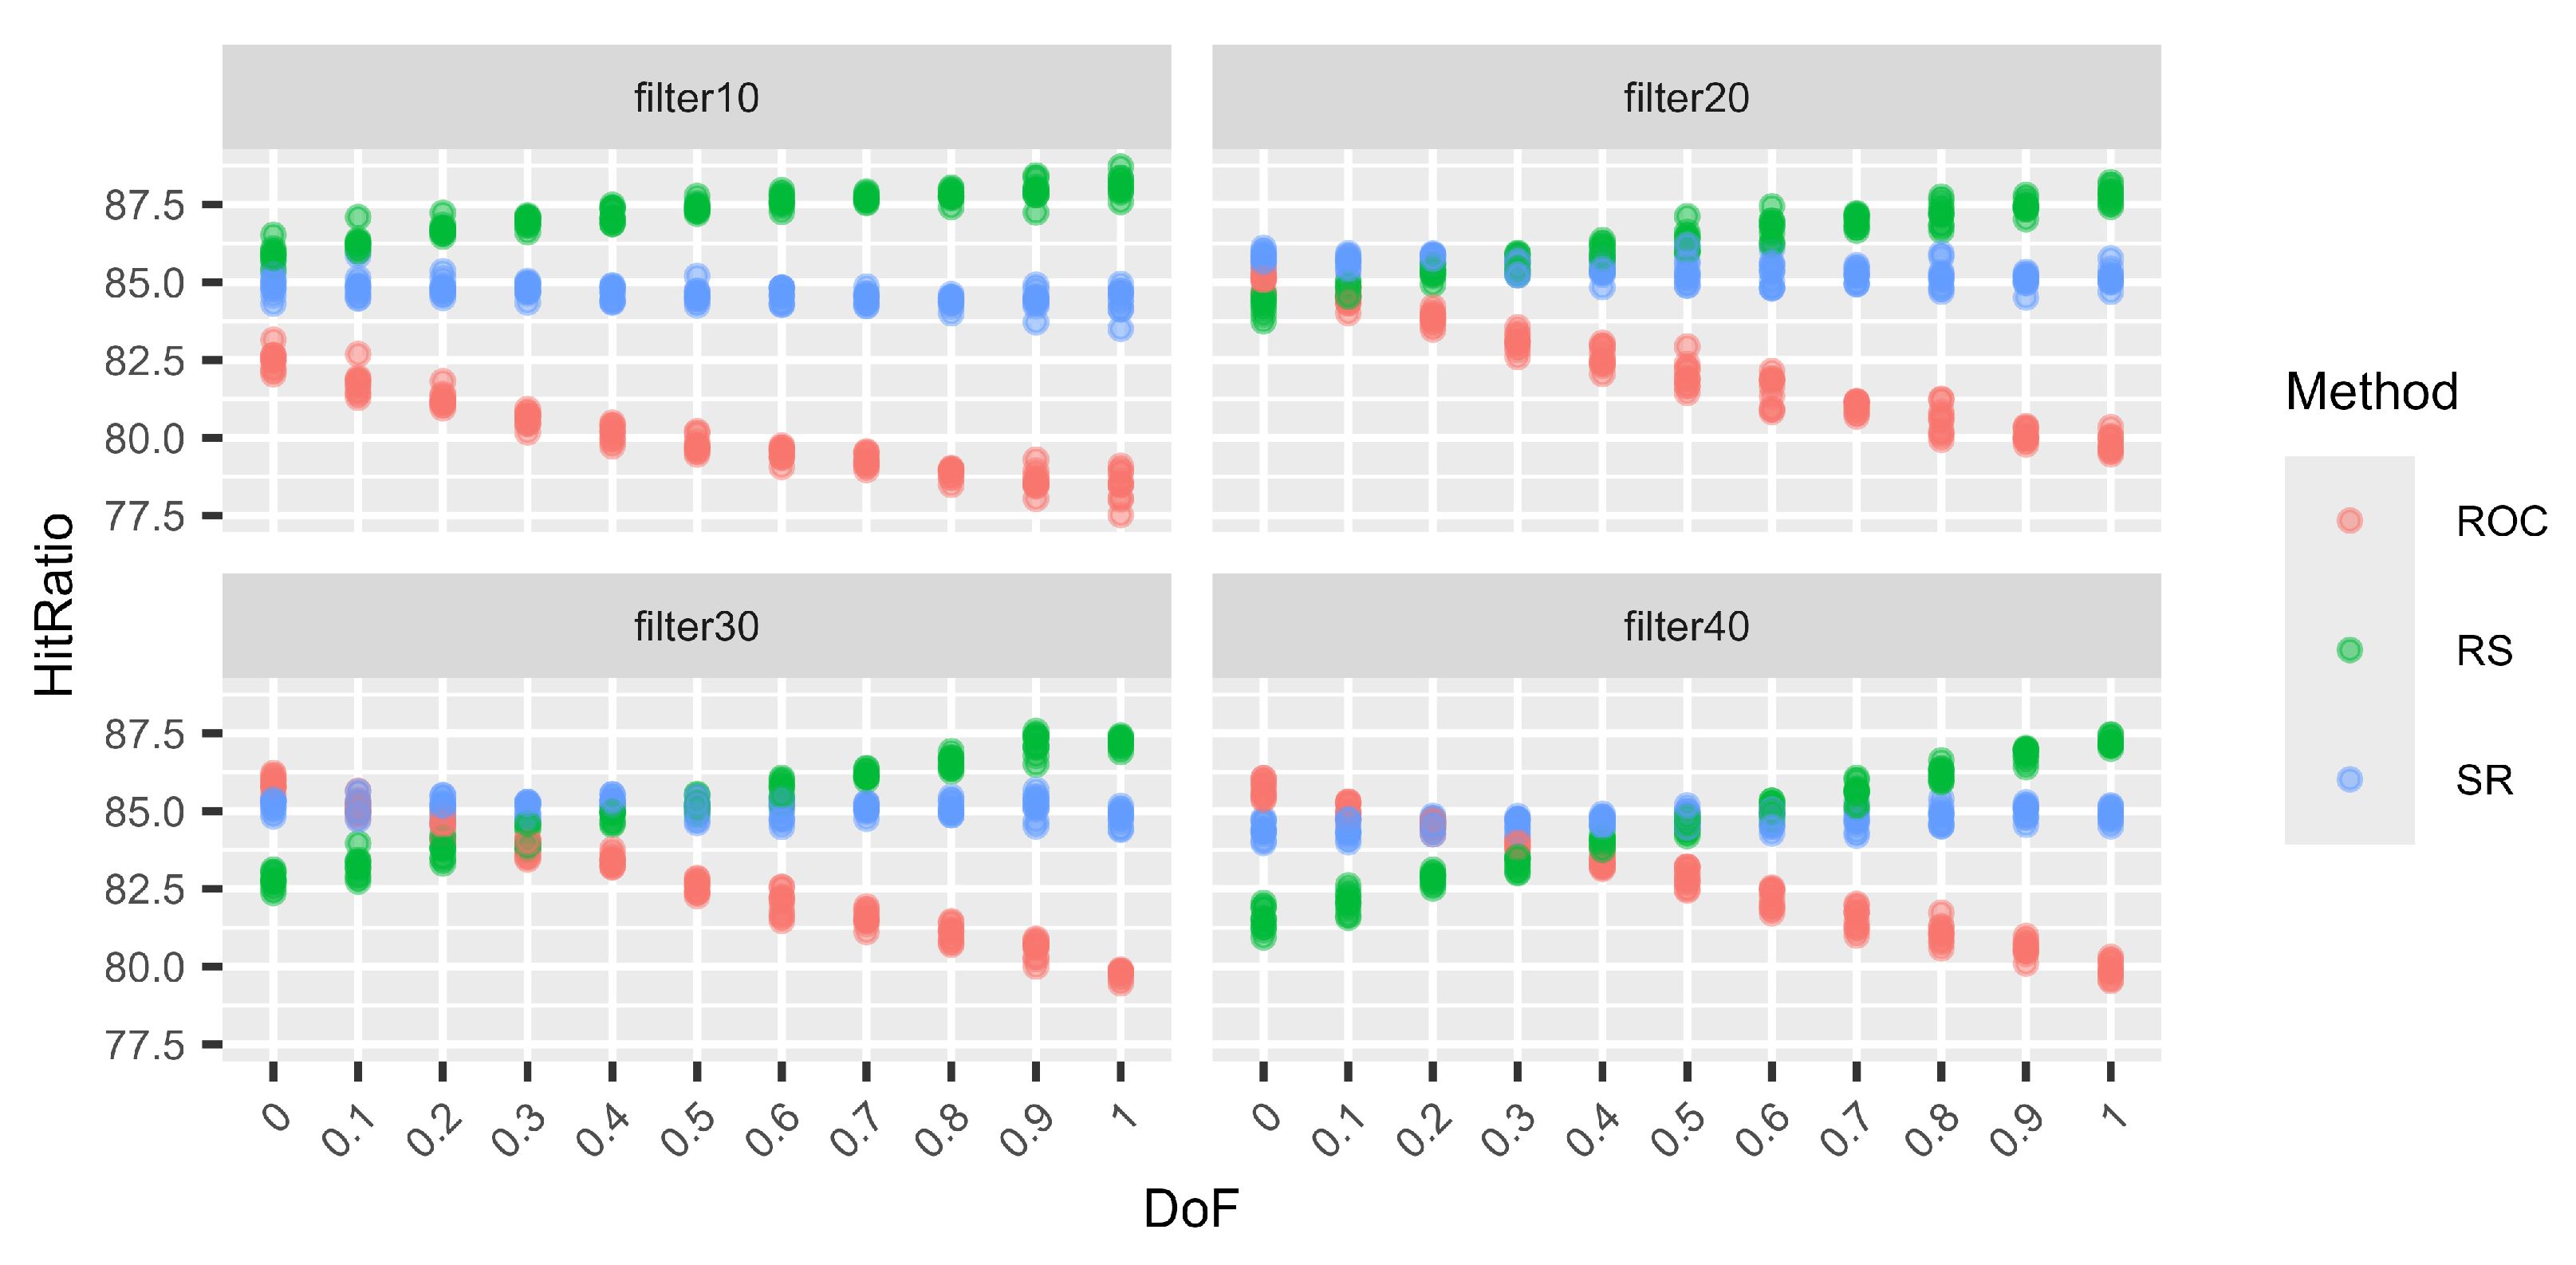
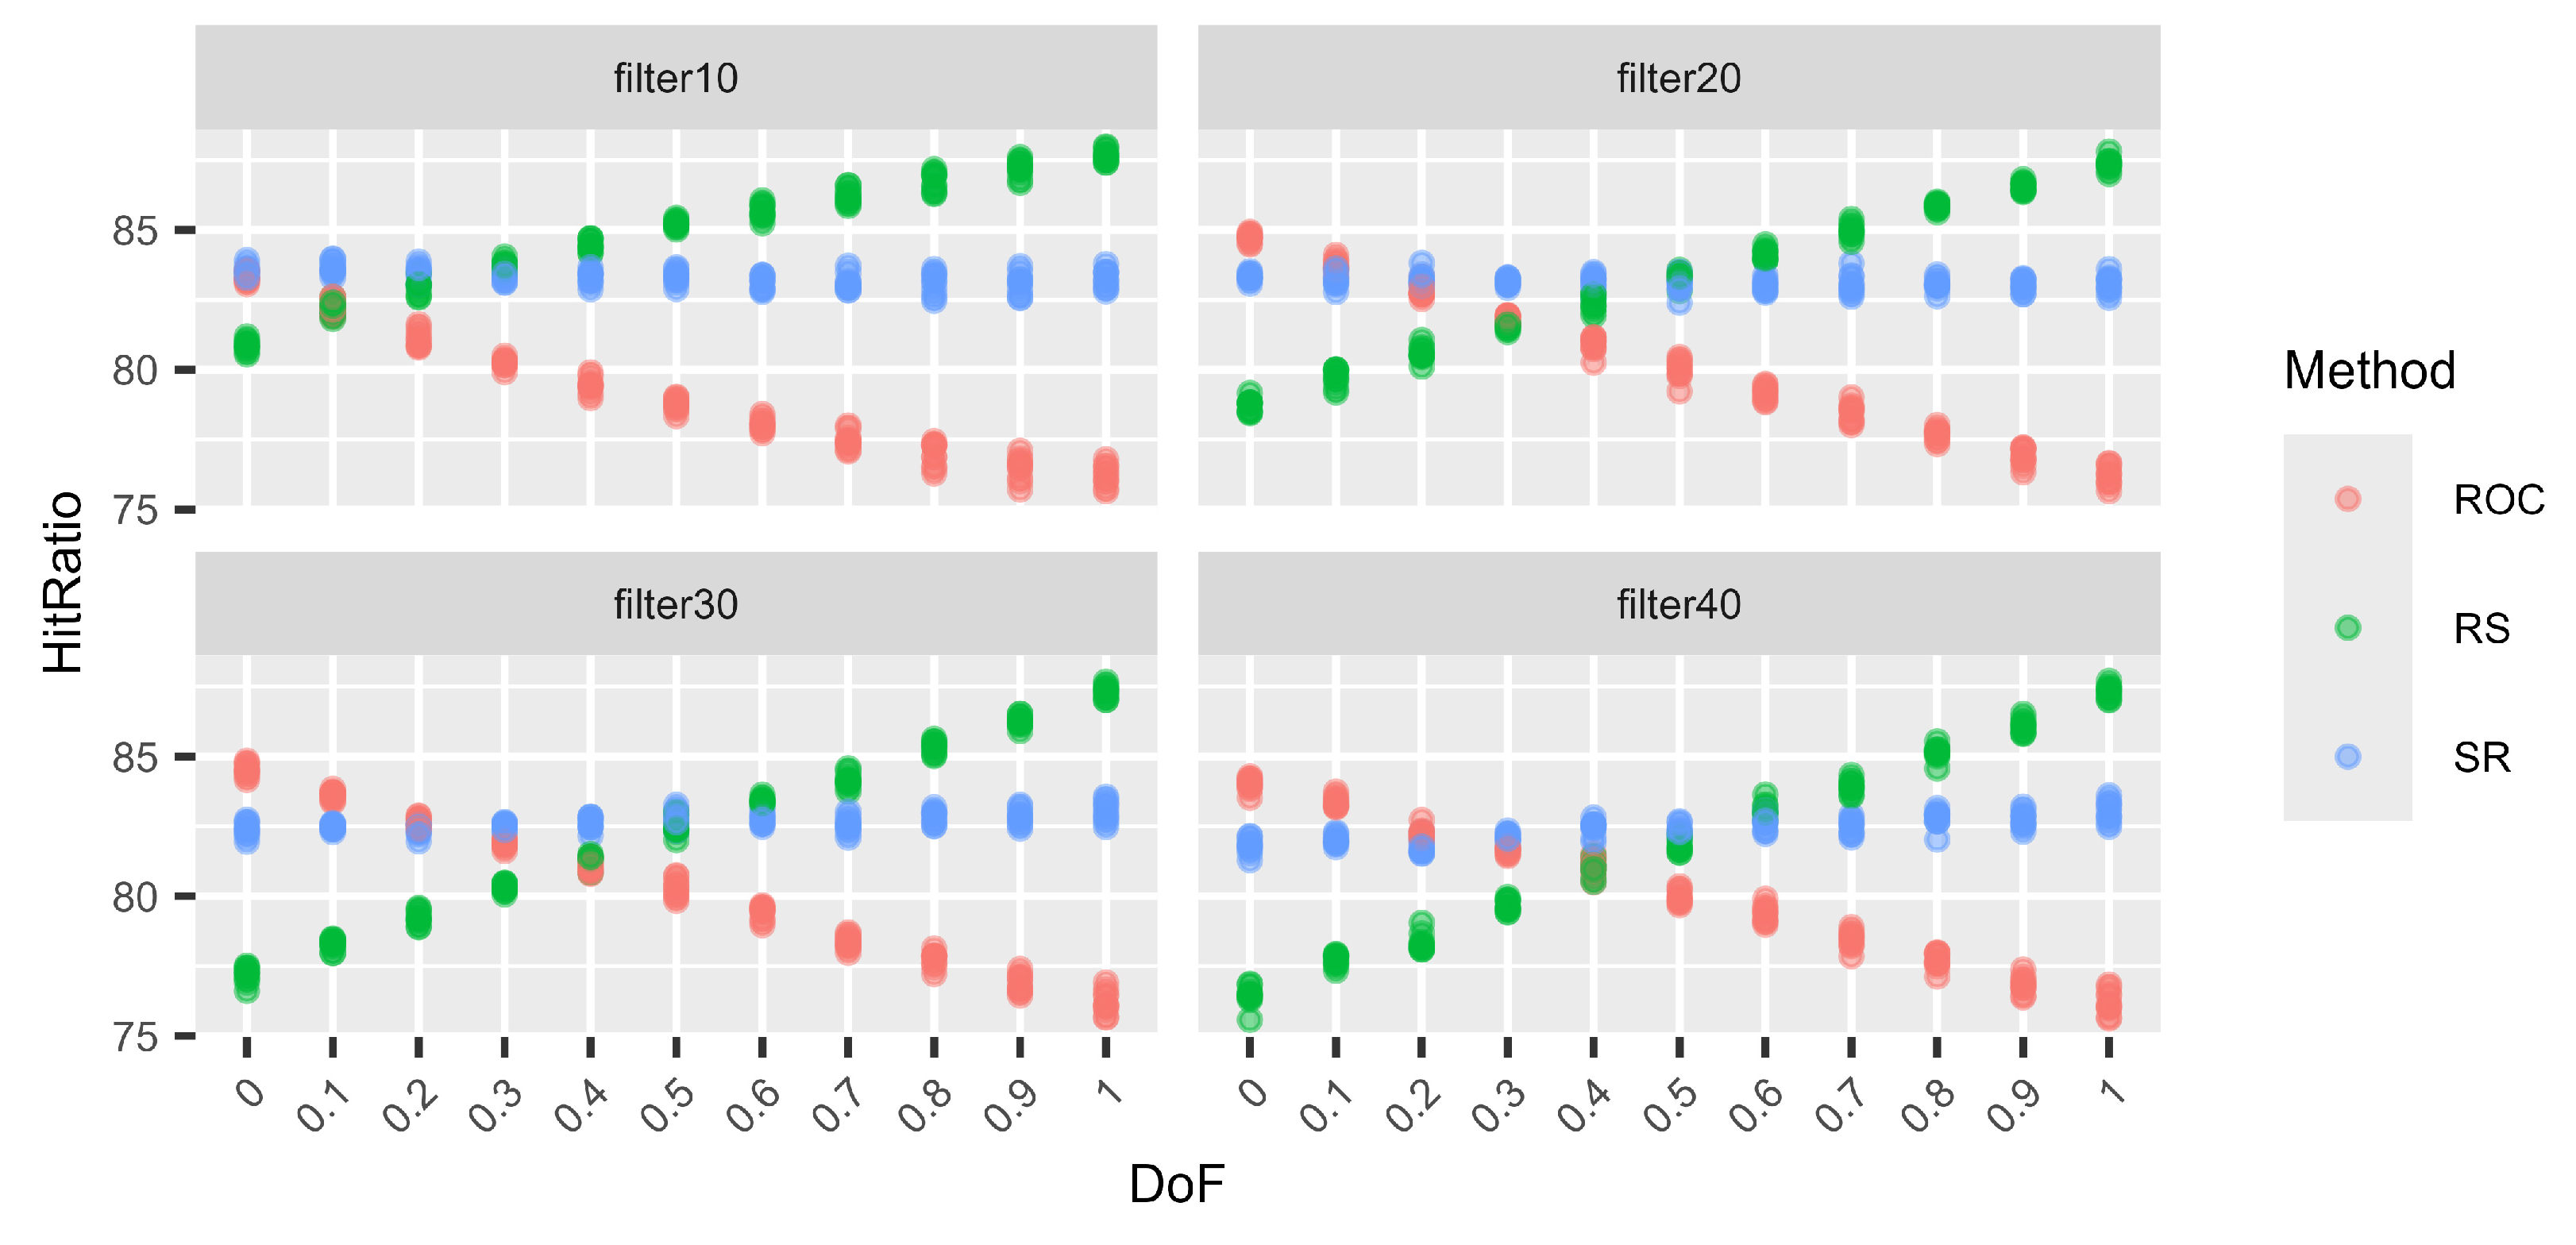
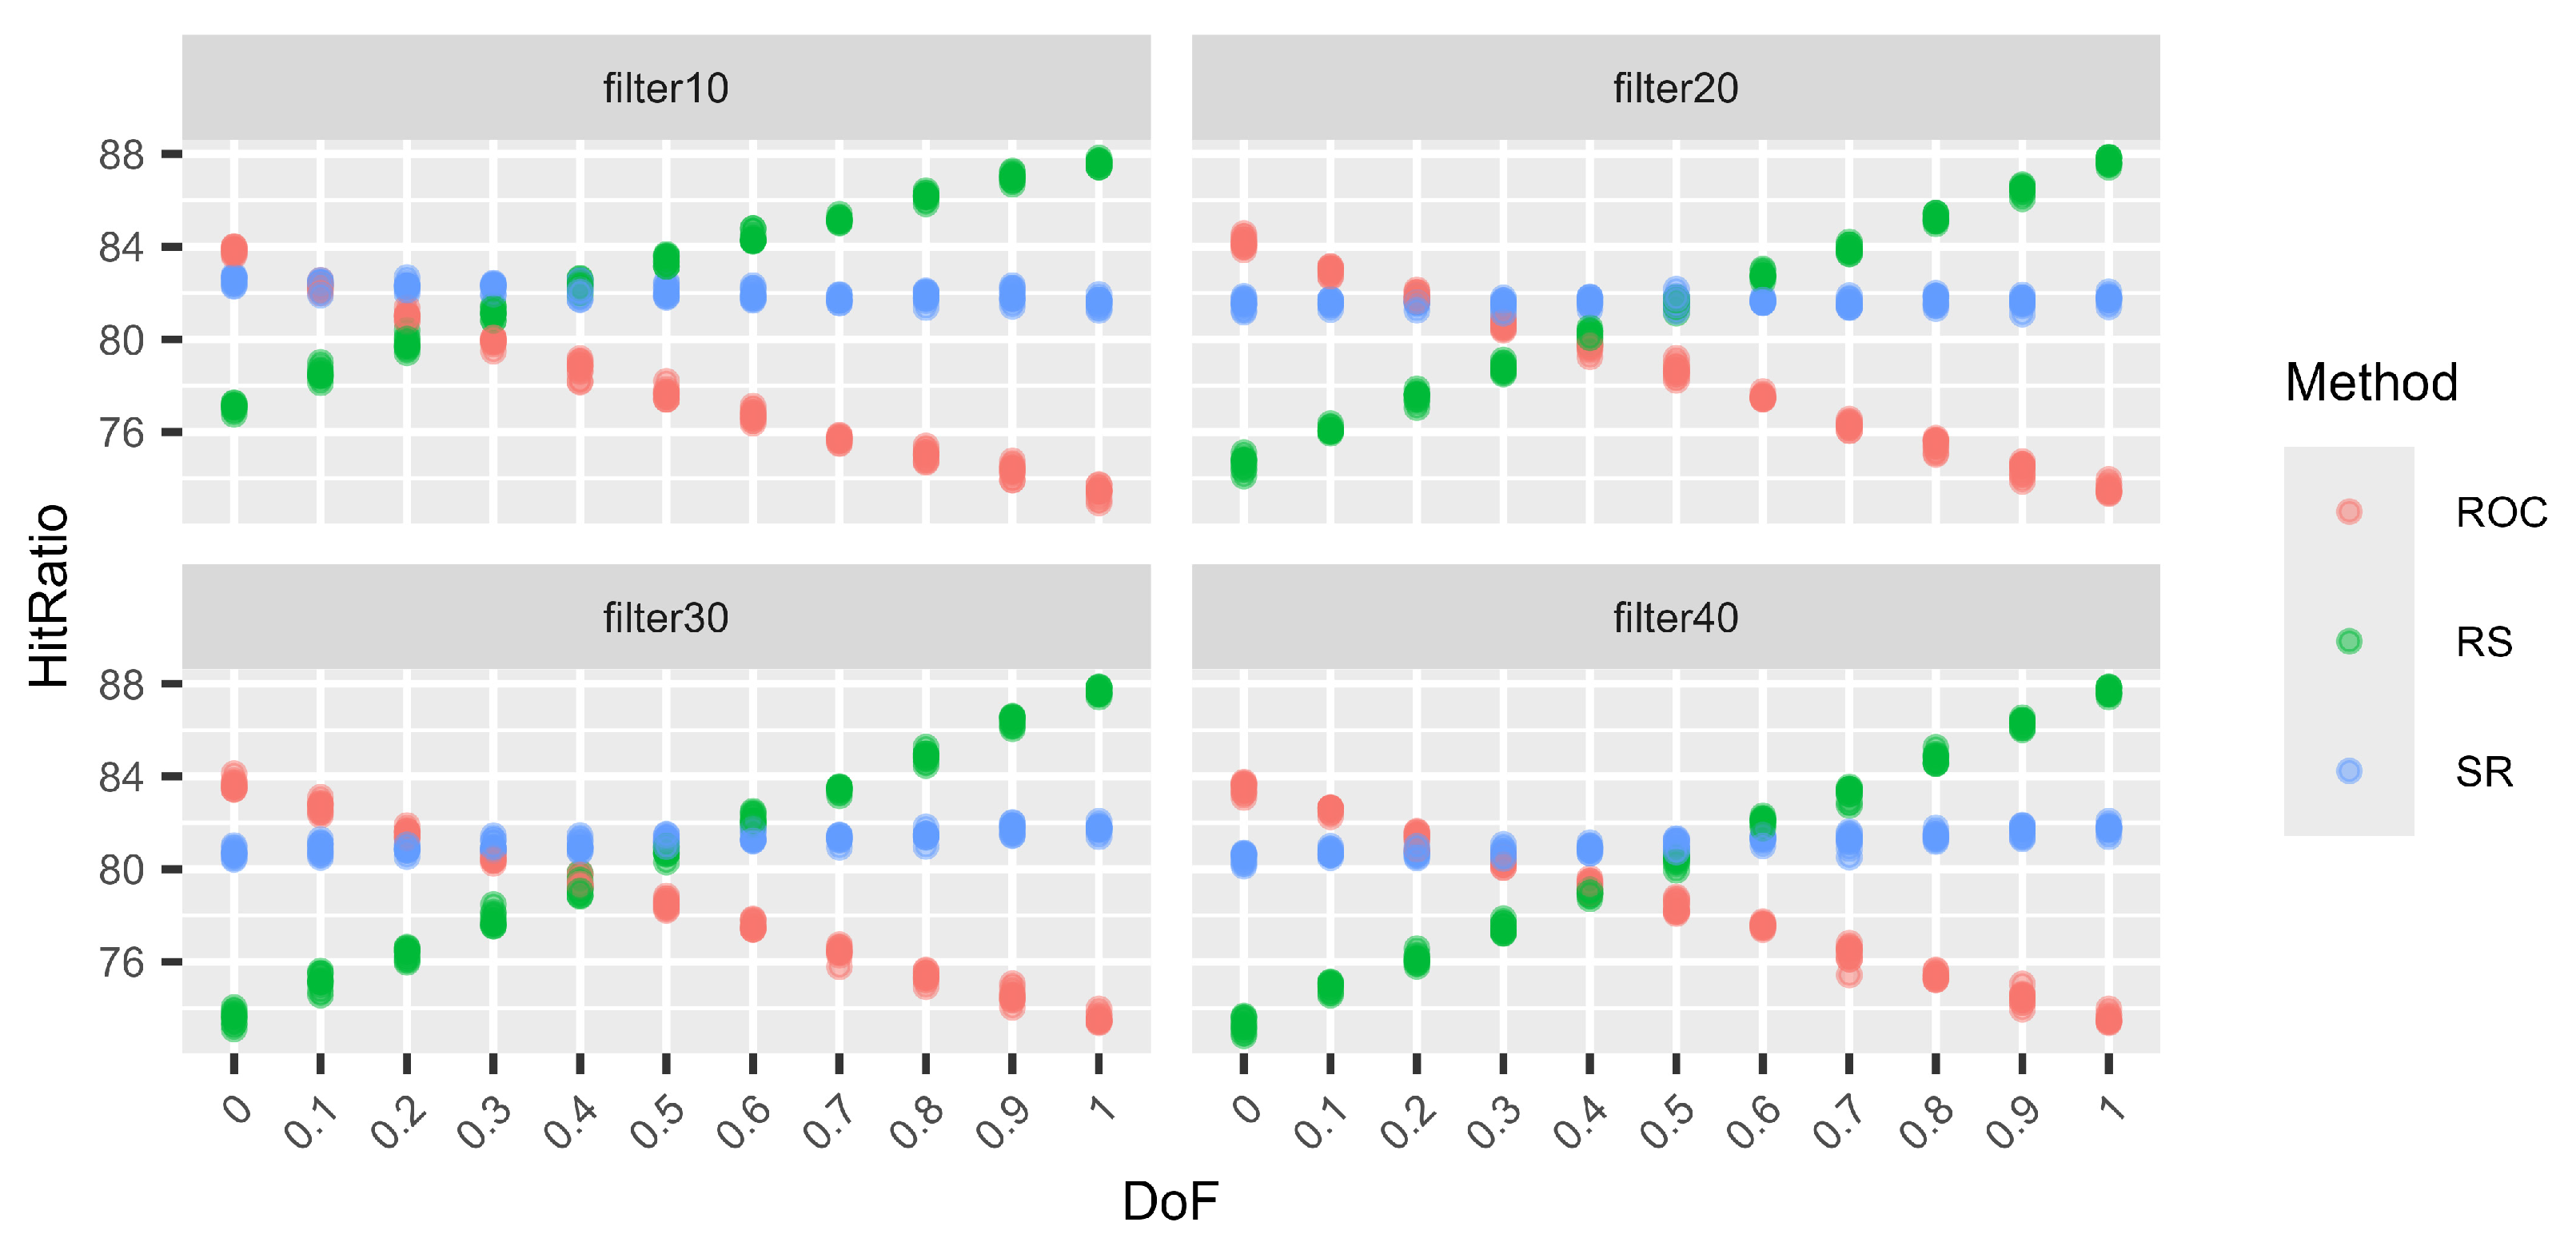
Next (Figure 5, Figure 6, Figure 7 and Figure 8), we consider different levels of filters for the weight vectors. Again, a filter of 0.1, for example, means that a weight vector is resampled if the distance between the two largest weights is larger than 0.1. Hence, for a filter of 0.1, the two largest weights are quite close. On the other hand, using a filter of 0.4 does not prohibit the two largest weights from being very close, but the distance cannot be larger than 0.4. Again, for each DoF mix, 10 different simulation sets each of 100,000 decision situations are simulated. Hence, on the vertical axis, the variation in the hit ratios of the different surrogate weight methods is visible. This is performed for the combinations of three criteria and three alternatives (Figure 5), six criteria and six alternatives (Figure 6), nine criteria and nine alternatives (Figure 7), and twelve criteria and twelve alternatives (Figure 8).
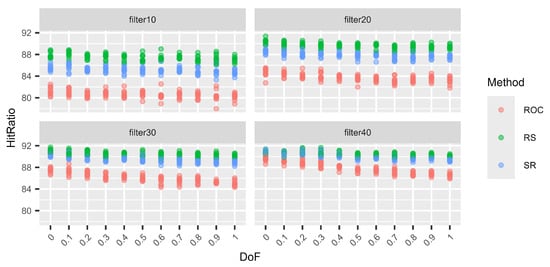
Figure 5.
Variations in the hit ratio for 3 criteria and 3 alternatives applying filters 10–40%.
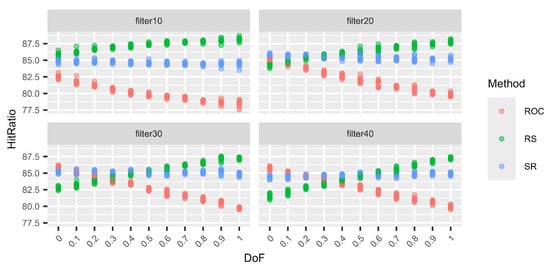
Figure 6.
Variations in the hit ratio for 6 criteria and 6 alternatives applying filters 10–40%.
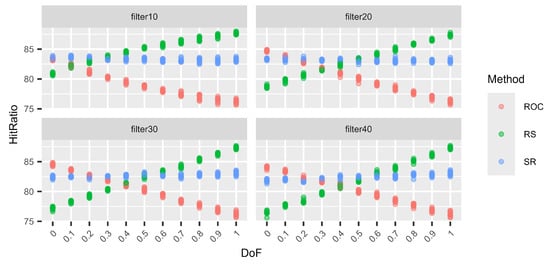
Figure 7.
Variations in the hit ratio for 9 criteria and 9 alternatives applying filters 10–40%.
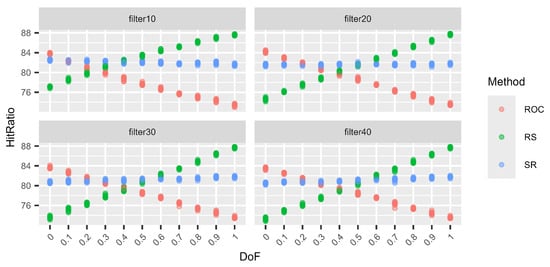
Figure 8.
Variations in the hit ratio for 12 criteria and 12 alternatives applying filters 10–40%.
We can see that the smaller the filter (more intrusive), the better RS performs and the worse ROC performs. However, this behaviour approaches the performance of no filters, as in Table 19, Table 20, Table 21 and Table 22, with increasing filter size. This behaviour is expected. With smaller filters, the more extreme weight vectors that can result from unfiltered N–1-generation are rejected, and hence, ROC cannot profit from its good performance for these more asymmetric weight vectors. On the other hand, RS benefits from small filters compared to the other two methods because it generally performs very well for N DoF, which normally results in more symmetric weight vectors. Finally, RS again shows its very stable performance, regardless of the filters or the DoF.
4. Discussion
This article is partly a substantial extension of [33], where most results are new. It investigates computationally efficient techniques for generating surrogate weights in MCDA, where decision-makers often struggle to provide precise weights for various criteria. This study focuses on methods for automatically generating these weights based on ordinal and cardinal ranking approaches, testing various models to evaluate their performance. The techniques explored include traditional rank-based methods such as RS, RR, and ROC and newer methods like SR and CSR, and we introduced a new CGS method, which is the preference strength counterpart of the GS method. The findings highlight that the SR and CSR methods outperform the others in terms of robustness. CSR is generally the best-performing method, and preference strength methods can take advantage of the additional information supplied more than ordinal methods can.
Furthermore, the article compares the performance of LP against surrogate weight models, demonstrating that LP fails to provide the same level of reliability and accuracy. The reason for the disappointing performance of LP seems to be the mismatch of the optimisation goal. Generally, it is recommended that the individual maximum utility be approximated as much as possible. This utility is strongly influenced, of course, by the DM’s weights. The optimisation, as implemented in this study using LP, tried to maximise the utility by considering the ordinal information of the weights as a constraint only, not as a fundamental part of the utility itself. Hence, you could say that LP tries to optimise the overall sum product of weights and attribute values. It sees the weights as a restriction. But the optimal alternative is determined by a combination of both alternative values and weights. Further, applying filters for the decision problem is a modification of the original decision problem. In the applied setting, it seems that the application of surrogate weight methods still supplies a reasonable benefit. The analysis of filter sizes showed that smaller filters tend to enhance the performance, emphasising the need for attention when applying them.
The use of the mean ordered weights did not have a large impact on the performance of the LP approach. Nevertheless, we identified the mean ordered weights as a possible reasonable measure to approximate the approximate maximum hit ratio, as described in [34]. This study also includes an analysis of filter sizes, revealing that smaller filter sizes typically lead to improved model performance. This insight is critical for selecting the optimal approach when dealing with varying levels of information and complexity in real-world decision problems. Entirely new for this article is the study of the variations in the hit ratios for different surrogate weight methods. We can clearly see that the variation between different DoFs has, for several methods, a far more substantial influence than the variation within the different DoFs.
To sum up, this article constitutes a basis for selecting an appropriate surrogate method for an analysis or for its inclusion in an MCDA tool. To handle the cases of N–1 and N DoF, as well as anything in between, an appropriate surrogate method needs to be reasonably invariant to various DoFs, not least since it cannot be known which DoF the mental model of a particular decision-maker is aligned to. Or it might even change between the start and the end of an MCDA process. This desideratum is only fulfilled by the SR method, and since it performs on par with the others or better across the measured decision situations, it is the preferred choice according to this study.
5. Conclusions
In conclusion, this study provides insights into the selection and performance of various methods for generating surrogate weights in MCDA. The findings underscore the importance of selecting appropriate weight generation techniques based on the complexity of the decision problem and the available information. The results from this study show that for both the GS and the CGS methods, parameter s is most suitable when it is smaller than 1. There seems to be no unique value for parameter s that fits every combination of the number of alternatives and the number of criteria. Nevertheless, the overall performance of both GS and CGS can be comparable to that of other ordinal and preference strength methods. If supplied with additional preference information, the preference strength methods, especially CSR, generally outperform the ordinal methods. This performance is not influenced by the use of a filter that discards decision situations that are too extreme. The study in this article is a large simulation study into the behaviours of various surrogate weight methods. As such, it constitutes a substantial contribution to the knowledge of such weights in general. However, the purpose of this article is not to demonstrate the usage of surrogate weights in real-world applications—that is the aim of many other studies in the field. For the interested reader, an open-source platform/library, UNEDA, implementing all these methods (and more) is bundled together with [36] and is freely available on GitHub (https://github.com/uneda-cda/UNEDA).
This study also highlighted the limitations of LP as a method for surrogate weight generation. Despite its widespread use in optimisation, LP was found to be less efficient than rank-based methods, especially in cases where decision-maker preferences were less precisely defined. This clearly indicates that surrogate weight models, particularly those incorporating ordinal ranking methods, offer superior performance for weight generation. This study shows that comparably simple constructed surrogate weight methods perform better than the more complex LP method. It is, however, an open question as to whether reframing the LP problem could increase the performance bottleneck of coping with ordinal information.
This study serves as guidelines for selecting surrogate methods, either for use in a particular modelling situation or for inclusion in a methodological framework as, for example, a component in a computer tool supporting decision-making. In all these cases, it is important to understand and appreciate the performance of the selected surrogate weight methods employed. For a methodology or tool directed to a general set of decision-makers, the CSR method offers the best versatility in combining high accuracy performance with large stability (i.e., low variation when encountering differing conditions).
Surrogate weight methods have their limitations. For example, some ordinal methods perform better or worse under certain assumptions. For example, the ROC method performs best when the distance between the two most important weights is quite large. This might be inappropriate in decision situations where the DM is almost indifferent regarding the two most important criteria. On the other hand, methods like the RS method perform worse in cases where the distance between the two most important weights is quite large. However, as shown in [34], we see an upper performance limit that can be approximated with surrogate weight methods. However, these methods will not be precise enough in some decision situations where a higher success rate is required. Additionally, these methods assume a fixed true inner weight. Nevertheless, preferences can be volatile and this can lead to different results depending on the point of time the decision situation is evaluated.
Overall, this study shows the efficacy of surrogate weight models in MCDA and provides directions for further research into the refinement of these methods. Future work could explore additional methods for incorporating preference strength and investigate the applicability of these approaches in a wider range of decision-making scenarios. Recent developments for both ordinal methods like IROC or ROL [12,13] and preference strength methods like FUCOM, LBWA, or DIBR [15,16,17,37] offer the possibility for a detailed comparison with respect to different measures of success or the robustness of these methods. For the preference strength methods, a unified approach is needed to make them comparable with respect to the amount of information as input. For example, cardinal ranking generally uses a limited number of steps between the weights, whereas other methods use ratios. It would be interesting to compare the newer methods FUCOM, LBWA, and DIBR to the established CSR—are they comparable and how? Also, it would be interesting to see how objective methods like WENSLO, LOPCOW, CRITIC, and D-CRITIC perform compared to the subjective methods described [19,20,21,22,23,38]. Hence, a study taking different assumptions regarding the availability of preferences into account offers possibilities for future research. Furthermore, surrogate weight methods offer a straightforward and comparatively computationally non-intensive way to facilitate decision support. It would be interesting to study the possibilities of incorporating these in more computationally intensive methods, like machine learning, to reduce the amount of complexity or computing resources. Finally, the problem of volatile preferences could be addressed in future studies, i.e., how do the methods perform if the preferences of the DM vary within some range?
Author Contributions
Conceptualisation, S.L. and M.D.; methodology, S.L. and M.D.; software, S.L.; formal analysis, S.L. and M.D.; writing—original draft preparation, S.L. and M.D.; writing—review and editing, S.L. and M.D.; visualisation, S.L.; supervision, M.D. All authors have read and agreed to the published version of the manuscript.
Funding
M.D. was partially funded by the European Commission research programme Horizon Europe, grant agreement number 101074075.
Data Availability Statement
Data are contained within the article.
Acknowledgments
This article is dedicated to our dear friend and esteemed colleague Professor Love Ekenberg, who passed away in September 2022 and who was a co-author of the conference paper on which this article is partly based.
Conflicts of Interest
The authors declare no conflicts of interest. The funder had no role in the design of the study; in the collection, analyses, or interpretation of data; in the writing of the manuscript; or in the decision to publish the results.
Abbreviations
The following abbreviations are used in this article:
| MCDA | Multi-criteria decision analysis |
| MAUT | Multi-attribute utility theory |
| MAVT | Multi-attribute value theory |
| LP | Linear programming |
| DM | Decision-maker |
| ROC | Rank order centroid |
| RR | Rank reciprocal |
| RS | Rank sum |
| SR | Sum reciprocal (also known as. Sum rank) |
| GS | Geometric sum |
| CRC | Cardinal rank order centroid |
| CRR | Cardinal rank reciprocal |
| CRS | Cardinal rank sum |
| CSR | Cardinal sum reciprocal (also known as. Cardinal sum rank) |
| CGC | Cardinal geometric sum |
References
- Danielson, M.; Ekenberg, L. A Robustness Study of State-of-the-Art Surrogate Weights for MCDM. Group Decis. Negot. 2016, 26, 677–691. [Google Scholar]
- Aguayo, E.A.; Mateos, A.; Jiménez, A. A New Dominance Intensity Method to Deal with Ordinal Information about a DM’s Preferences within MAVT. Knowl. Based Syst. 2014, 69, 159–169. [Google Scholar]
- Park, K.S. Mathematical Programming Models for Characterizing Dominance and Potential Optimality When Multicriteria Alternative Values and Weights are Simultaneously Incomplete. IEEE Trans. Syst. Man Cybern. Part A Syst. Hum. 2004, 34, 601–614. [Google Scholar] [CrossRef]
- Danielson, M.; Ekenberg, L. Computing Upper and Lower Bounds in Interval Decision Trees. Eur. J. Oper. Res. 2007, 181, 808–816. [Google Scholar]
- Ahn, B.S.; Park, K.S. Comparing Methods for Multiattribute Decision Making with Ordinal Weights. Comput. Oper. Res. 2008, 35, 1660–1670. [Google Scholar]
- Sarabando, P.; Dias, L. Multi-Attribute Choice with Ordinal Information: A Comparison of Different Decision Rules. IEEE Trans. Syst. Man Cybern. Part A 2009, 39, 545–554. [Google Scholar]
- Bana e Costa, C.A.; Correa, E.C.; De Corte, J.M.; Vansnick, J.C. Facilitating Bid Evaluation in Public Call for Tenders: A Socio-Technical Approach. Omega 2002, 30, 227–242. [Google Scholar]
- Sarabando, P.; Dias, L. Simple Procedures of Choice in Multicriteria Problems without Precise Information about the Alternatives’ Values. Comput. Oper. Res. 2010, 37, 2239–2247. [Google Scholar] [CrossRef]
- Figueira, J.; Roy, B. Determining the Weights of Criteria in the ELECTRE Type Methods with a Revised Simos’ Procedure. Eur. J. Oper. Res. 2002, 139, 317–326. [Google Scholar]
- Chergui, Z.; Jiménez-Martín, A. On Ordinal Information-Based Weighting Methods and Comparison Analyses. Information 2024, 15, 527. [Google Scholar] [CrossRef]
- Danielson, M.; Ekenberg, L. Rank Ordering Methods for Multi-Criteria Decisions. In Group Decision and Negotiation. A Process-Oriented View; Zaraté, P., Kersten, G.E., Hernández, J.E., Eds.; Lecture Notes in Business Information Processing; Springer: Cham, Switzerland, 2014; Volume 180, pp. 128–135. [Google Scholar]
- Hatefi, M.A. An Improved Rank Order Centroid Method (IROC) for Criteria Weight Estimation: An Application in the Engine/Vehicle Selection Problem. Informatica 2023, 34, 249–270. [Google Scholar] [CrossRef]
- Hatefi, M.A. A New Method for Weighting Decision Making Attributes: An Application in High-Tech Selection in the Oil and Gas Industry. Soft Comput. 2024, 28, 281–303. [Google Scholar] [CrossRef]
- Hatefi, M.A.; Razavi, S.A.; Abiri, V. A Novel Multi-attribute Model to Select Appropriate Weighting Method in Decision Making, an Empirical Application in the Petroleum Industry. Group Decis. Negot. 2023, 32, 1351–1390. [Google Scholar] [CrossRef]
- Pamucar, D.; Stević, Ž.; Sremac, S. A New Model for Determining Weight Coefficients of Criteria in MCDM Models: Full Consistency Method (FUCOM). Symmetry 2018, 10, 393. [Google Scholar] [CrossRef]
- Žižović, M.; Pamucar, D. New Model for Determining Criteria Weights: Level Based Weight Assessment (LBWA) Model. Decision Making: Appl. Manag. Eng. 2019, 2, 126–137. [Google Scholar] [CrossRef]
- Pamucar, D.; Deveci, M.; Gokasar, I.; Işık, M.; Zizovic, M. Circular Economy Concepts in Urban Mobility Alternatives Using Integrated DIBR Method and Fuzzy Dombi CoCoSo Model. J. Clean. Prod. 2021, 323, 129096. [Google Scholar] [CrossRef]
- Lukić, R. Application of DIBR and MAIRCA Methods in the Evaluation of the Economic Performance of the Economy of Bosnia and Herzegovina. Econ. Rev. 2023, 21, 53–64. [Google Scholar]
- Pamucar, D.; Ecer, F.; Gligorić, Z.; Gligorić, M.; Deveci, M. A Novel WENSLO and ALWAS Multicriteria Methodology and Its Application to Green Growth Performance Evaluation. IEEE Trans. Eng. Manag. 2024, 71, 9510–9525. [Google Scholar] [CrossRef]
- Diakoulaki, D.; Mavrotas, G.; Papayannakis, L. Determining Objective Weights in Multiple Criteria Problems: The CRITIC Method. Comput. Oper. Res. 1995, 22, 763–770. [Google Scholar] [CrossRef]
- Rong, Y.; Yu, L.; Liu, Y.; Simic, V.; Garg, H. The FMEA Model Based on LOPCOW-ARAS Methods with Interval-Valued Fermatean Fuzzy Information for Risk Assessment of R&D Projects in Industrial Robot Offline Programming Systems. Comput. Appl. Math. 2023, 43, 25. [Google Scholar]
- Ecer, F.; Pamucar, D. A Novel LOPCOW-DOBI Multi-Criteria Sustainability Performance Assessment Methodology: An Application in Developing Country Banking Sector. Omega 2022, 112, 102690. [Google Scholar] [CrossRef]
- Krishnan, A.R.; Kasim, M.M.; Hamid, R.; Ghazali, M.F. A Modified CRITIC Method to Estimate the Objective Weights of Decision Criteria. Symmetry 2021, 13, 973. [Google Scholar] [CrossRef]
- Arbel, A.; Vargas, L.G. Preference Simulation and Preference Programming: Robustness Issues in Priority Derivation. Eur. J. Oper. Res. 1993, 69, 200–209. [Google Scholar]
- Barron, F.; Barrett, B. The Efficacy of SMARTER: Simple Multi-Attribute Rating Technique Extended to Ranking. Acta Psych. 1996, 93, 23–36. [Google Scholar] [CrossRef]
- Barron, F.; Barrett, B. Decision Quality Using Ranked Attribute Weights. Manag. Sci. 1996, 42, 1515–1523. [Google Scholar] [CrossRef]
- Katsikopoulos, K.; Fasolo, B. New Tools for Decision Analysis. IEEE Trans. Syst. Man Cybern. Part A Syst. Hum. 2006, 36, 960–967. [Google Scholar] [CrossRef]
- Stewart, T.J. Use of Piecewise Linear Value Functions in Interactive Multicriteria Decision Support: A Monte Carlo Study. Manag. Sci. 1993, 39, 1369–1381. [Google Scholar]
- Stillwell, W.; Seaver, D.; Edwards, W. A Comparison of Weight Approximation Techniques in Multiattribute Utility Decision Making. Organ. Behav. Hum. Perf. 1981, 28, 62–77. [Google Scholar]
- Barron, F.H. Selecting a Best Multiattribute Alternative with Partial Information about Attribute Weights. Acta Psych. 1992, 80, 91–103. [Google Scholar]
- Danielson, M.; Ekenberg, L. The CAR Method for Using Preference Strength in Multi-Criteria Decision Making. Group Decis. Negot. 2016, 25, 775–797. [Google Scholar]
- Jia, J.; Fischer, G.W.; Dyer, J.S. Attribute Weighting Methods and Decision Quality in the Presence of Response Error: A Simulation Study. J. Behav. Decis. Mak. 1998, 11, 85–105. [Google Scholar]
- Lakmayer, S.; Danielson, M.; Ekenberg, L. Aspects of Ranking Algorithms in Multi-Criteria Decision Support Systems. In New Trends in Software Methodologies, Tools and Techniques; Fujita, H., Guizzi, G., Eds.; IOS Press: Amsterdam, The Netherlands, 2023; pp. 63–75. [Google Scholar]
- Lakmayer, S.; Danielson, M.; Ekenberg, L. Upper Performance Limits and Distribution Invariance for Surrogate Weights in MCDA. In Human-Centric Decision and Negotiation Support for Societal Transitions; Campos Ferreira, M., Wachowicz, T., Zaraté, P., Maemura, Y., Eds.; Springer Nature: Cham, Switzerland, 2024; pp. 89–101. [Google Scholar]
- Lakmayer, S.; Danielson, M.; Ekenberg, L. Automatically Generated Weight Methods for Human and Machine Decision-Making. In Advances and Trends in Artificial Intelligence. Theory and Applications. IEA/AIE 2023; Fujita, H., Wang, Y., Xiao, Y., Moonis, A., Eds.; Lecture Notes in Computer Science; Springer: Cham, Switzerland, 2023; Volume 13925, pp. 195–206. [Google Scholar]
- Danielson, M. Foundations of Computational Decision Analysis, 2nd ed.; Sine Metu: Stockholm, Sweden, 2025. [Google Scholar]
- Kizielewicz, B.; Sałabun, W. SITW Method: A New Approach to Re-identifying Multi-Criteria Weights in Complex Decision Analysis. Spectr. Mech. Eng. Oper. Res. 2024, 1, 215–226. [Google Scholar]
- Božanić, D.; Epler, I.; Puška, A.; Biswas, S.; Marinković, D.; Koprivica, S. Application of the DIBR II—Rough MABAC Decision-Making Model for Ranking Methods and Techniques of Lean Organization Systems Management in the Process of Technical Maintenance. Facta Univ. Ser. Mech. Eng. 2024, 22, 101–123. [Google Scholar]
Disclaimer/Publisher’s Note: The statements, opinions and data contained in all publications are solely those of the individual author(s) and contributor(s) and not of MDPI and/or the editor(s). MDPI and/or the editor(s) disclaim responsibility for any injury to people or property resulting from any ideas, methods, instructions or products referred to in the content. |
© 2025 by the authors. Licensee MDPI, Basel, Switzerland. This article is an open access article distributed under the terms and conditions of the Creative Commons Attribution (CC BY) license (https://creativecommons.org/licenses/by/4.0/).