
Integrated Approach for Landslide Risk Assessment Using Geoinformation Tools and Field Data in Hindukush Mountain Ranges, Northern Pakistan

Abstract
:1. Introduction
2. Study Area
3. Materials and Methods
3.1. Materials
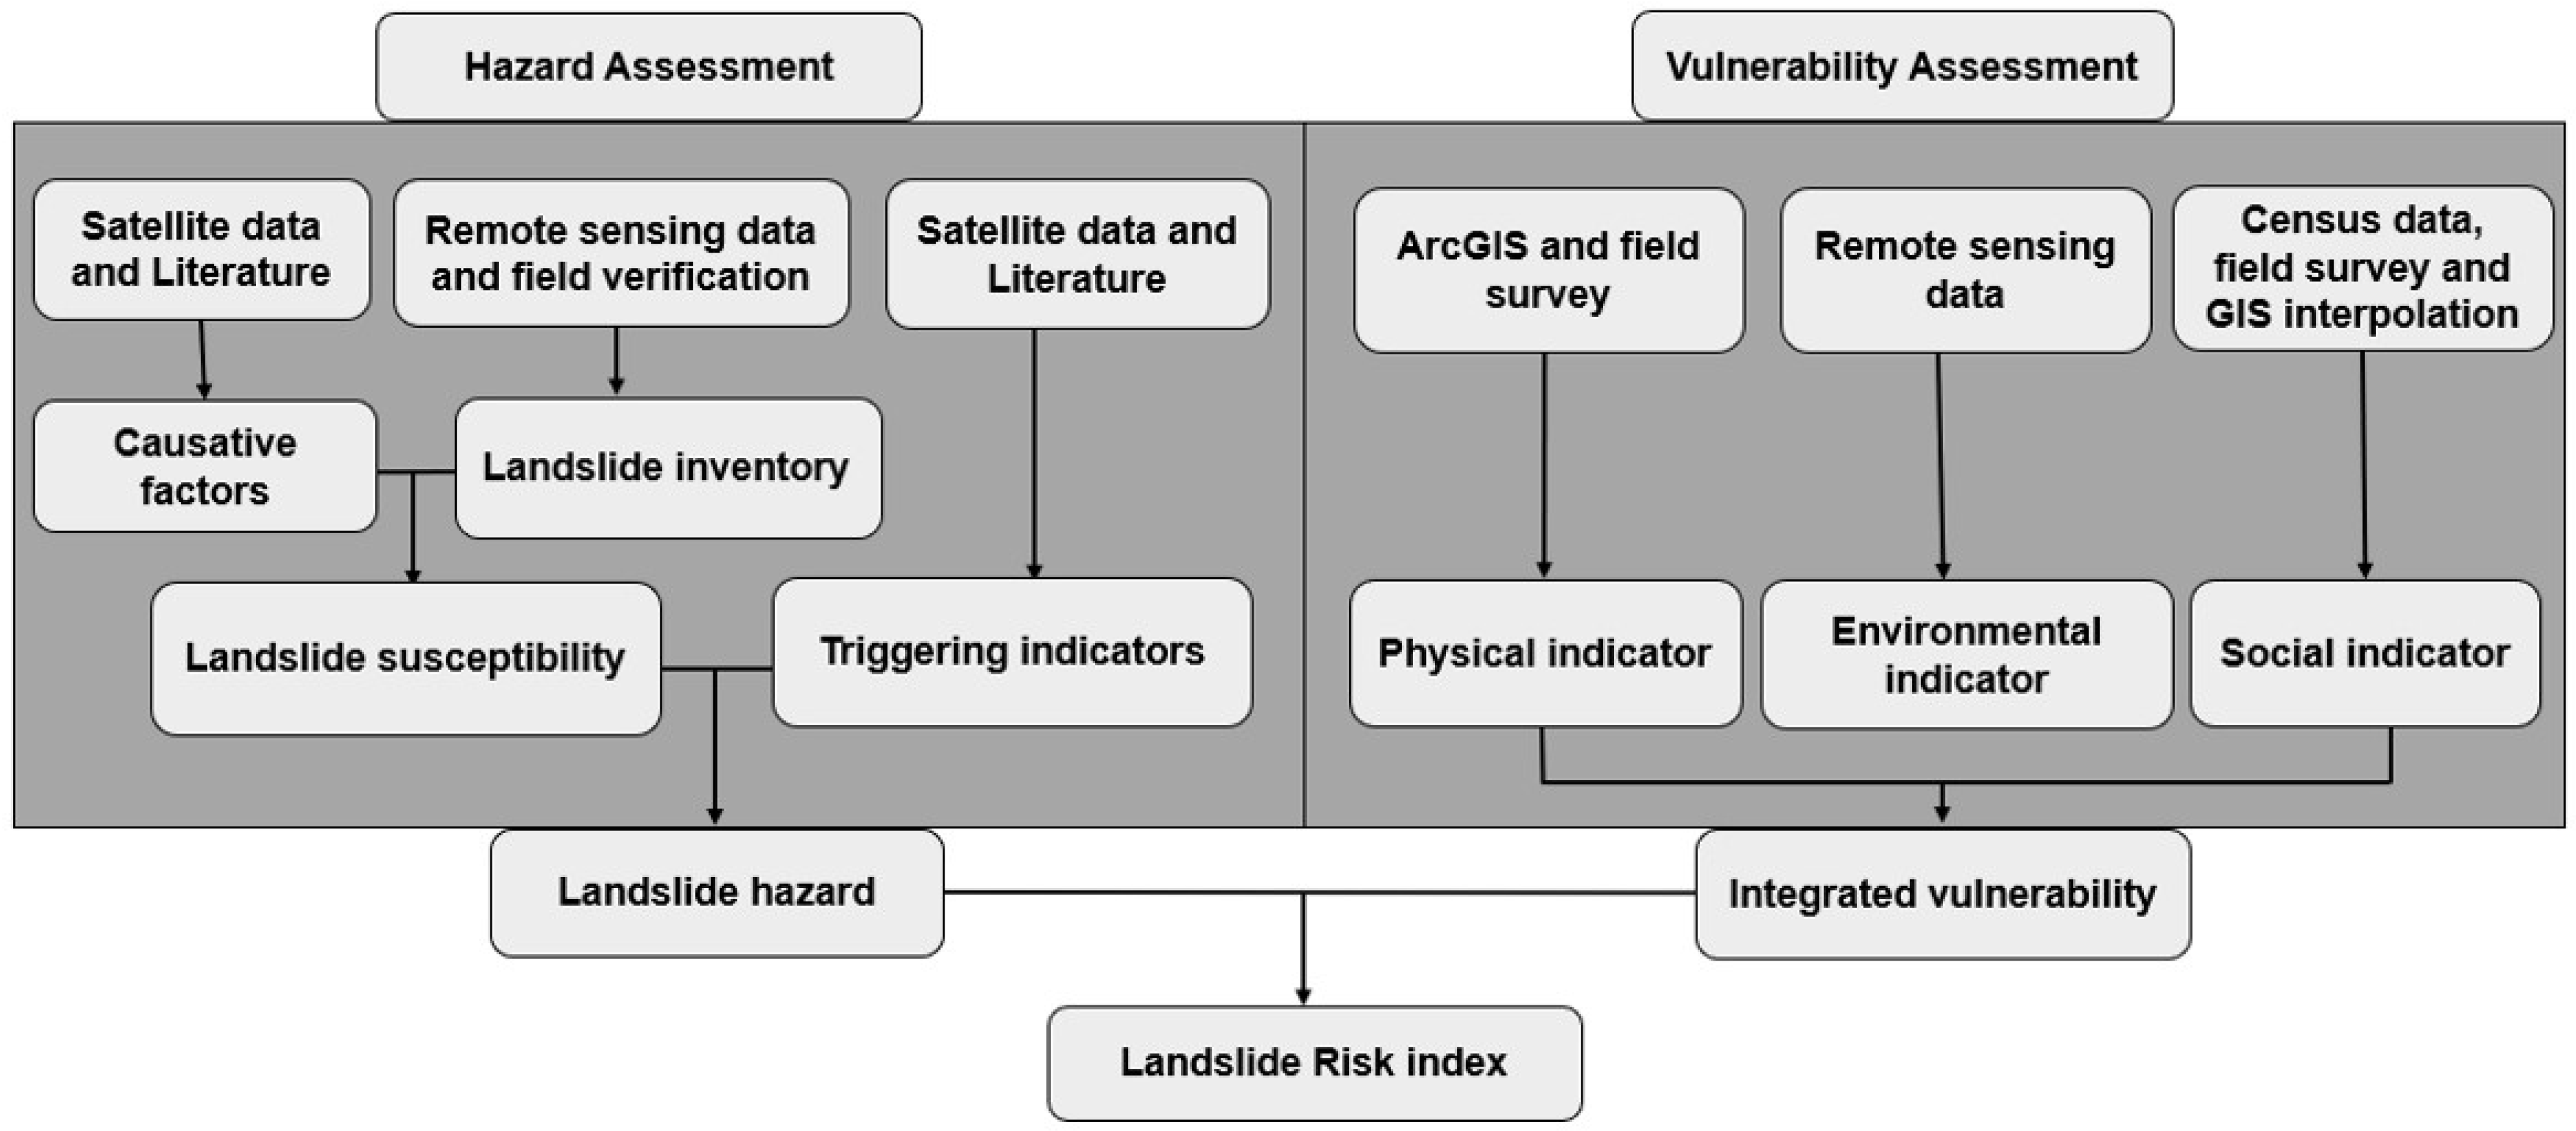
3.2. Methods
3.2.1. Landslide Susceptibility and Hazard Assessments
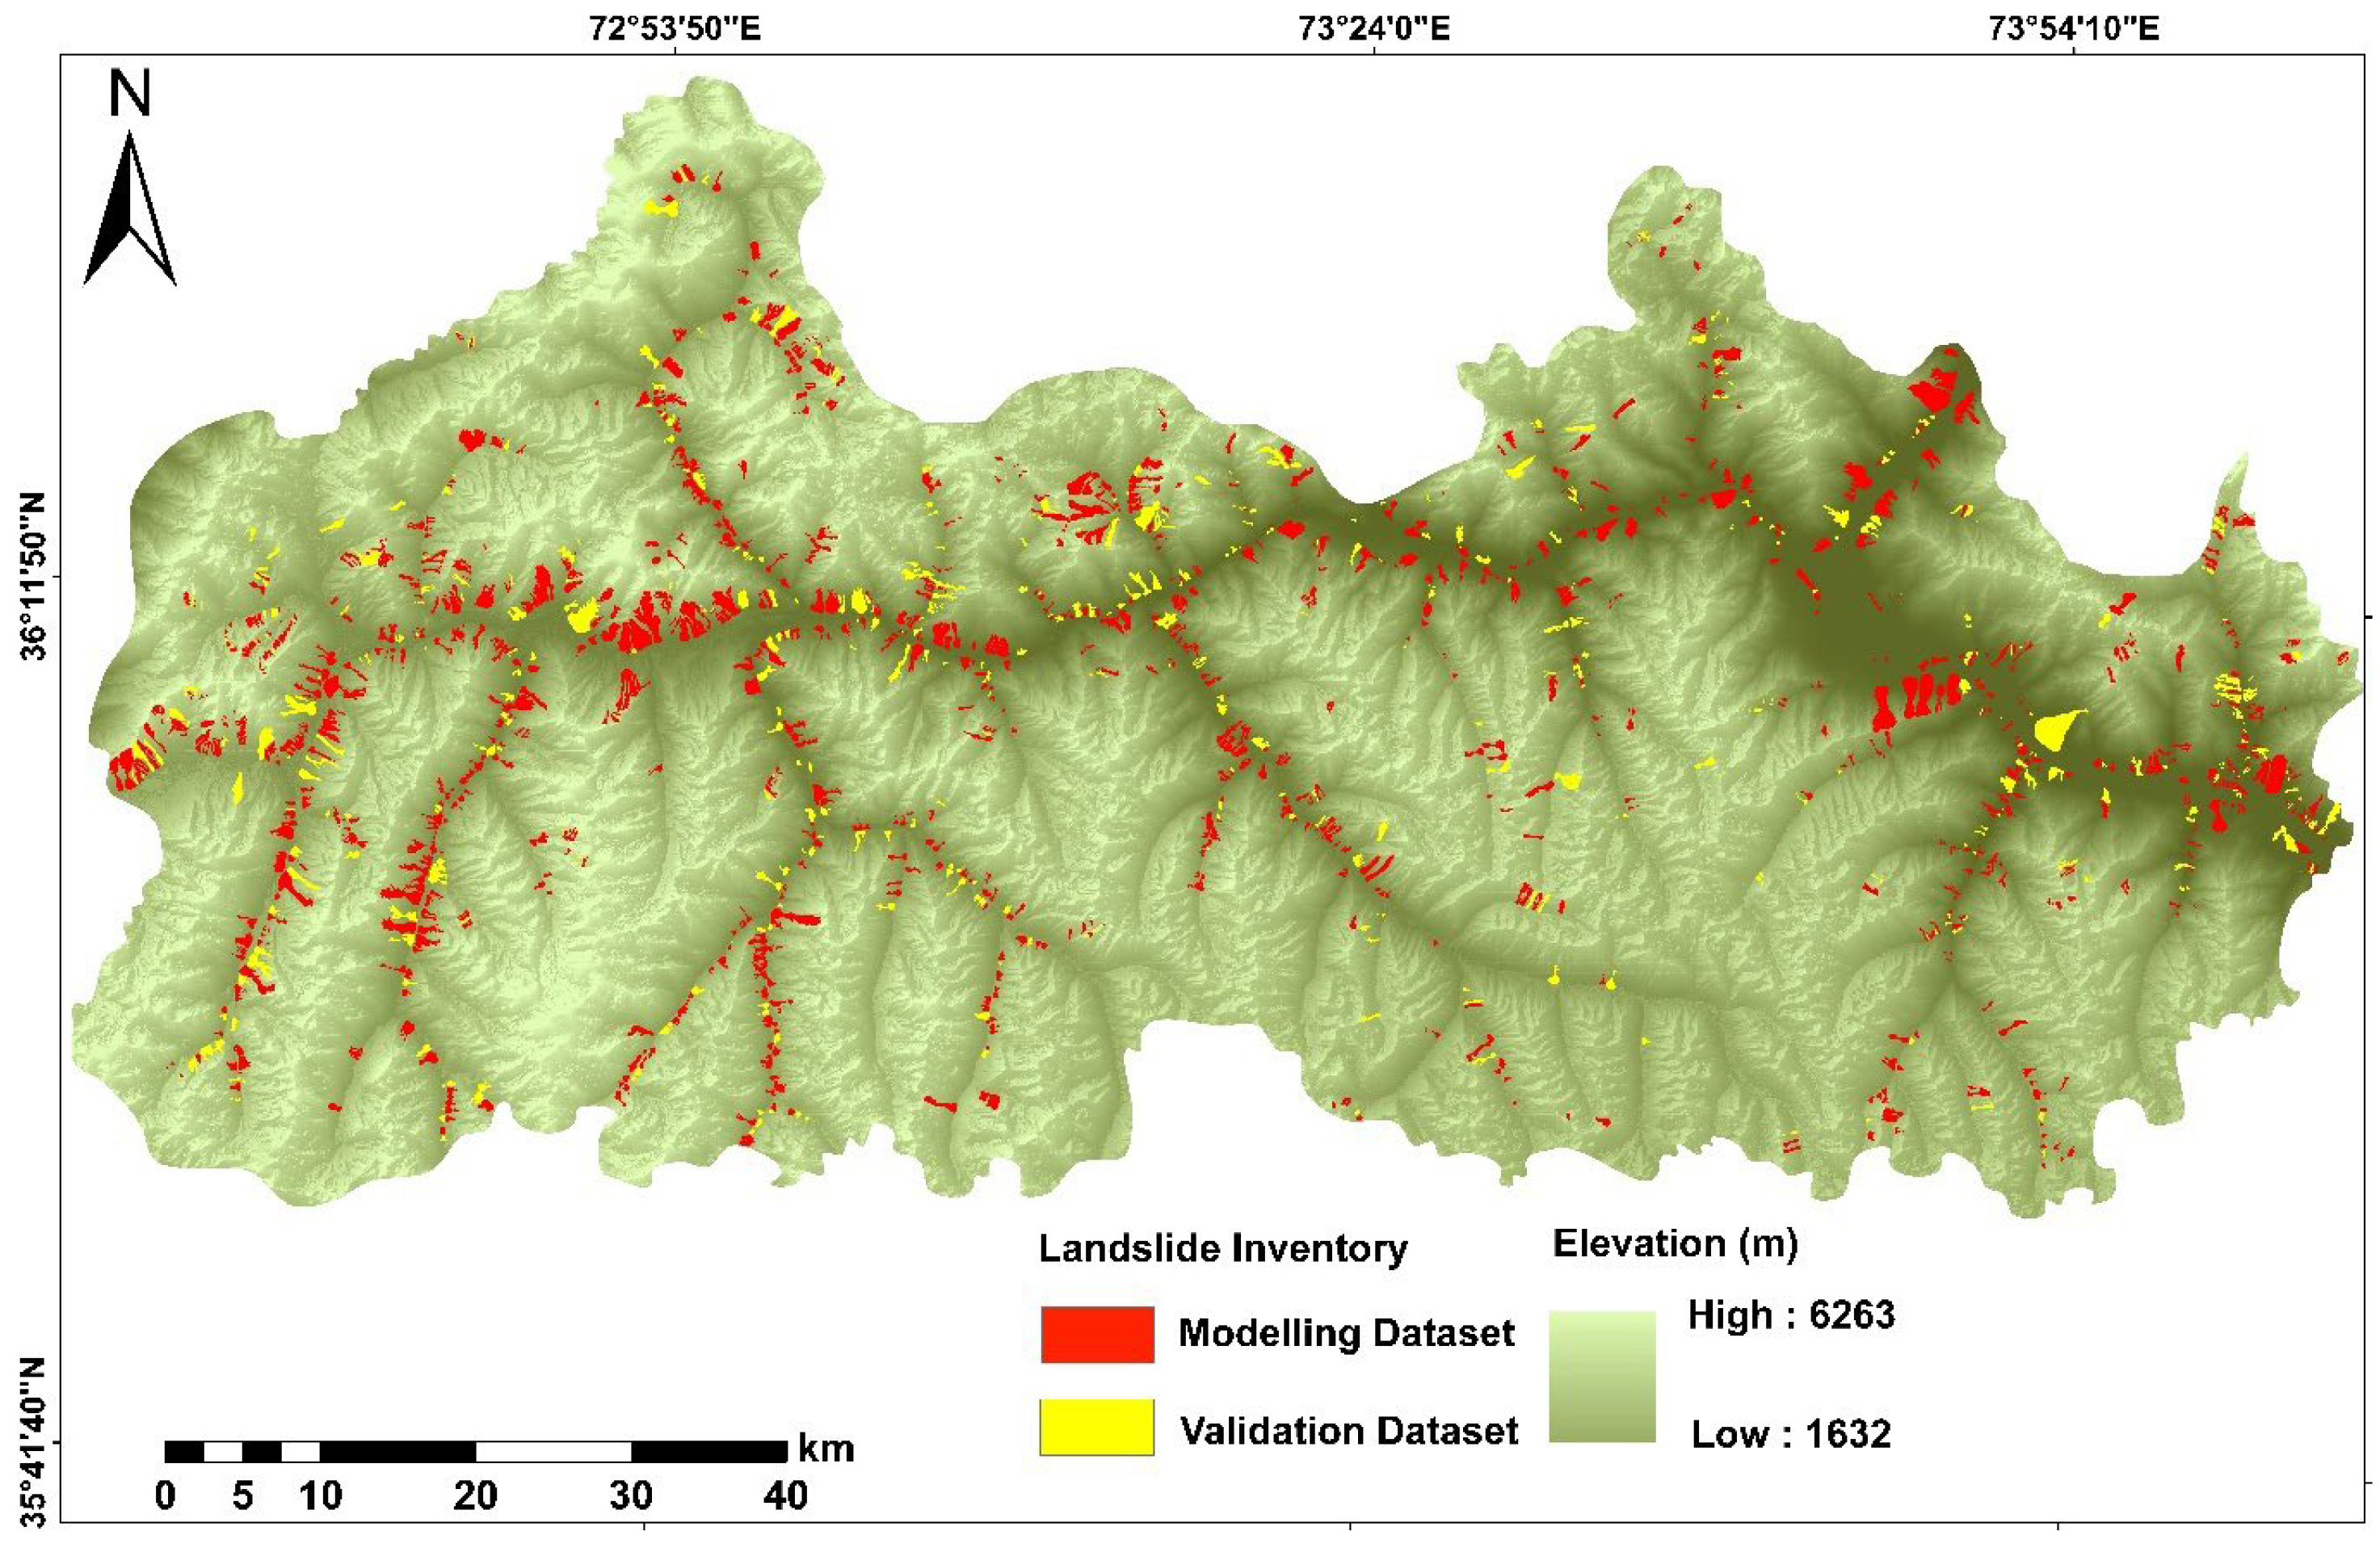
Landslide Inventory
Landslide Causative Factors and Susceptibility Assessment
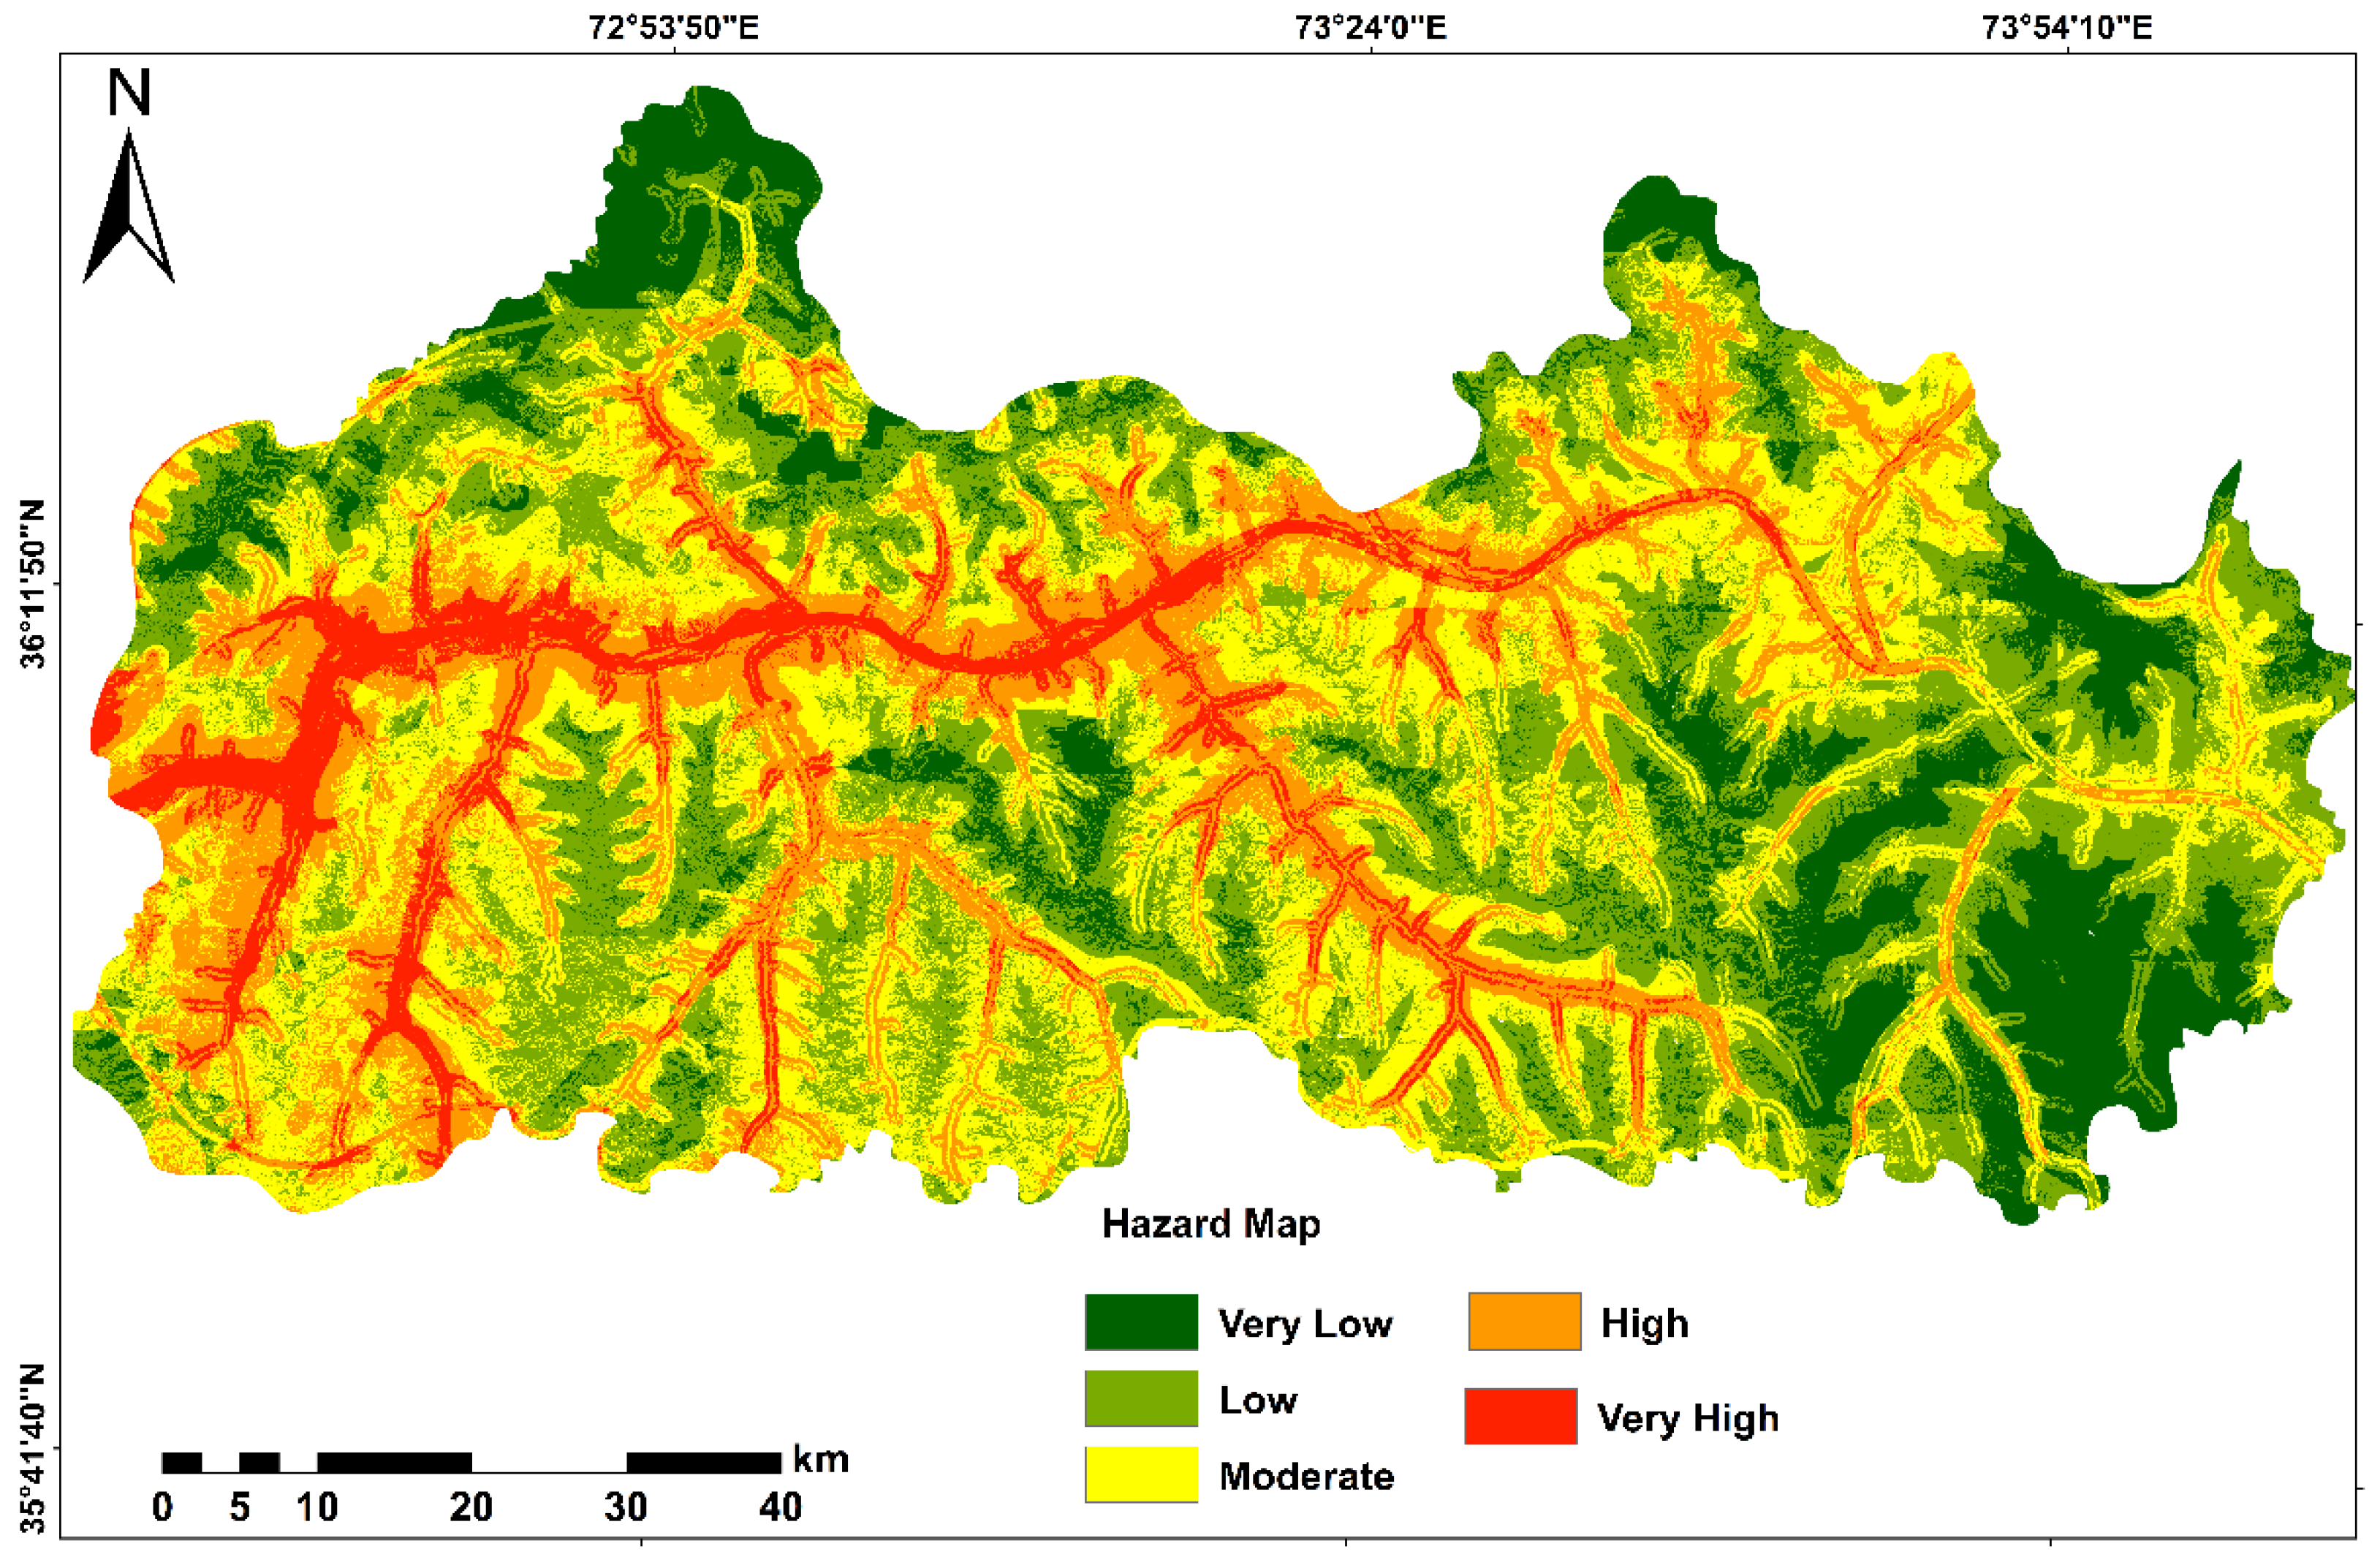
Landslide Triggers and Hazard Mapping
3.2.2. Landslide Vulnerability and Risk Assessment
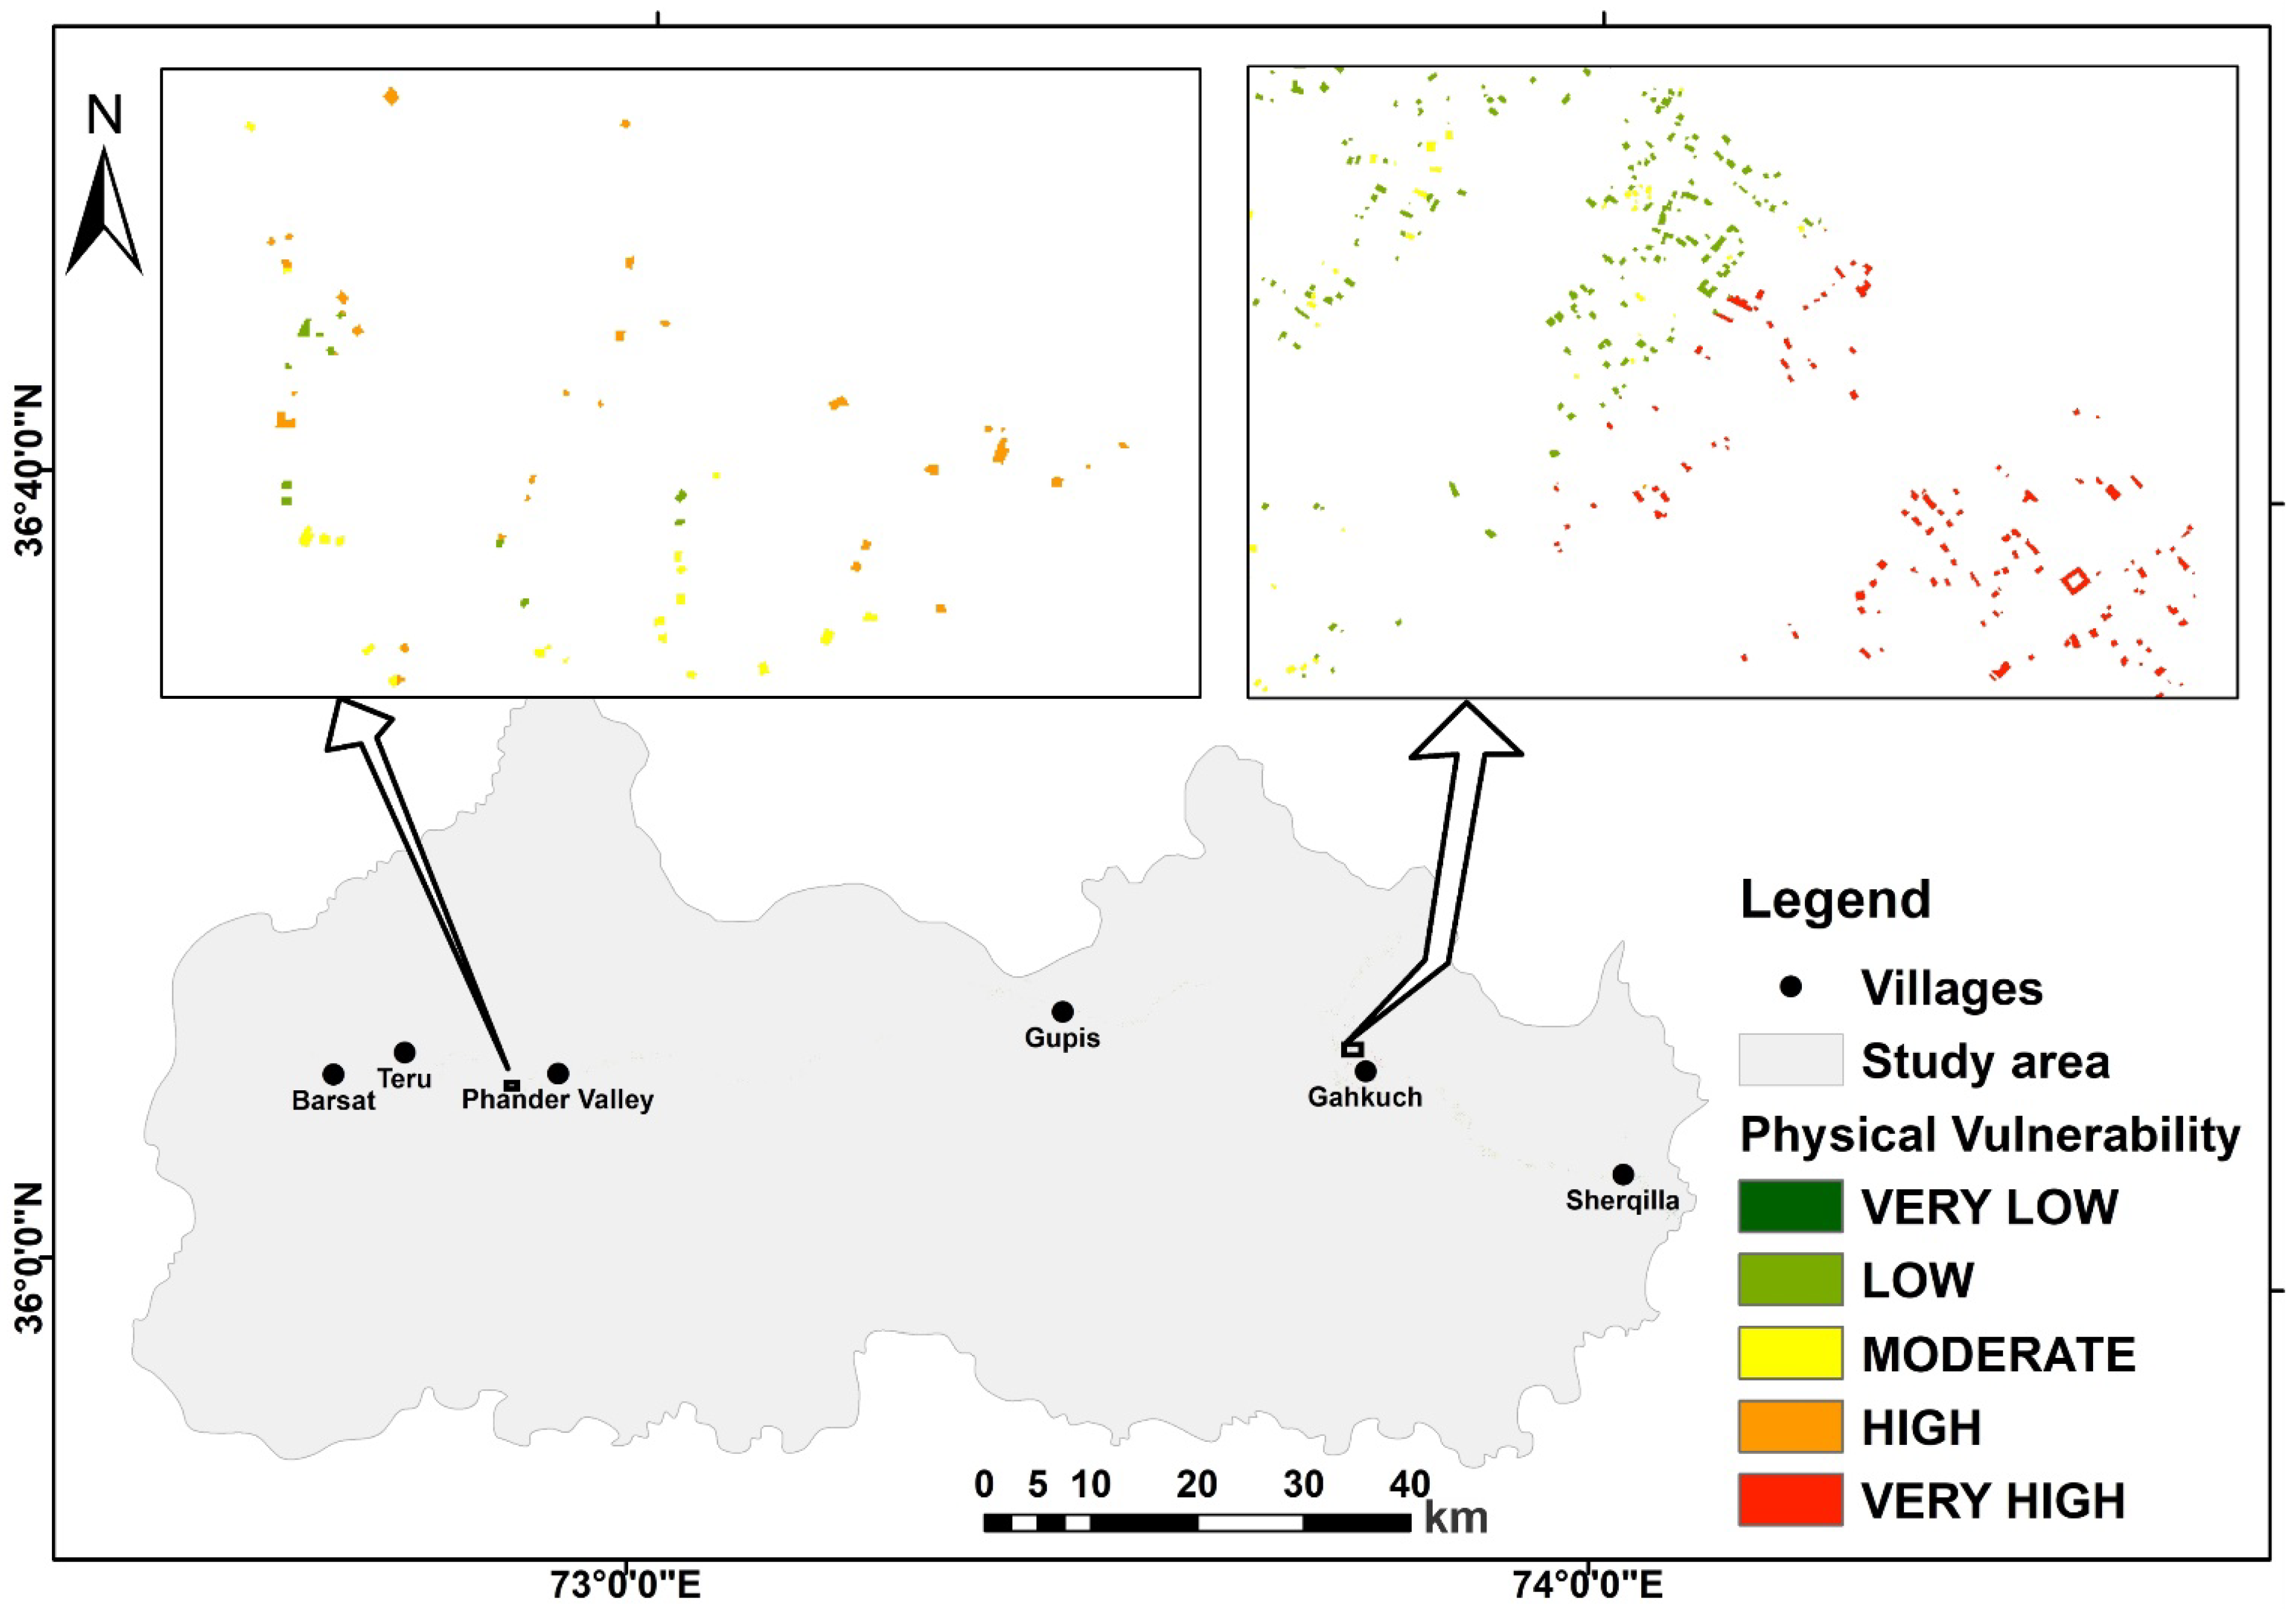
Physical Vulnerability
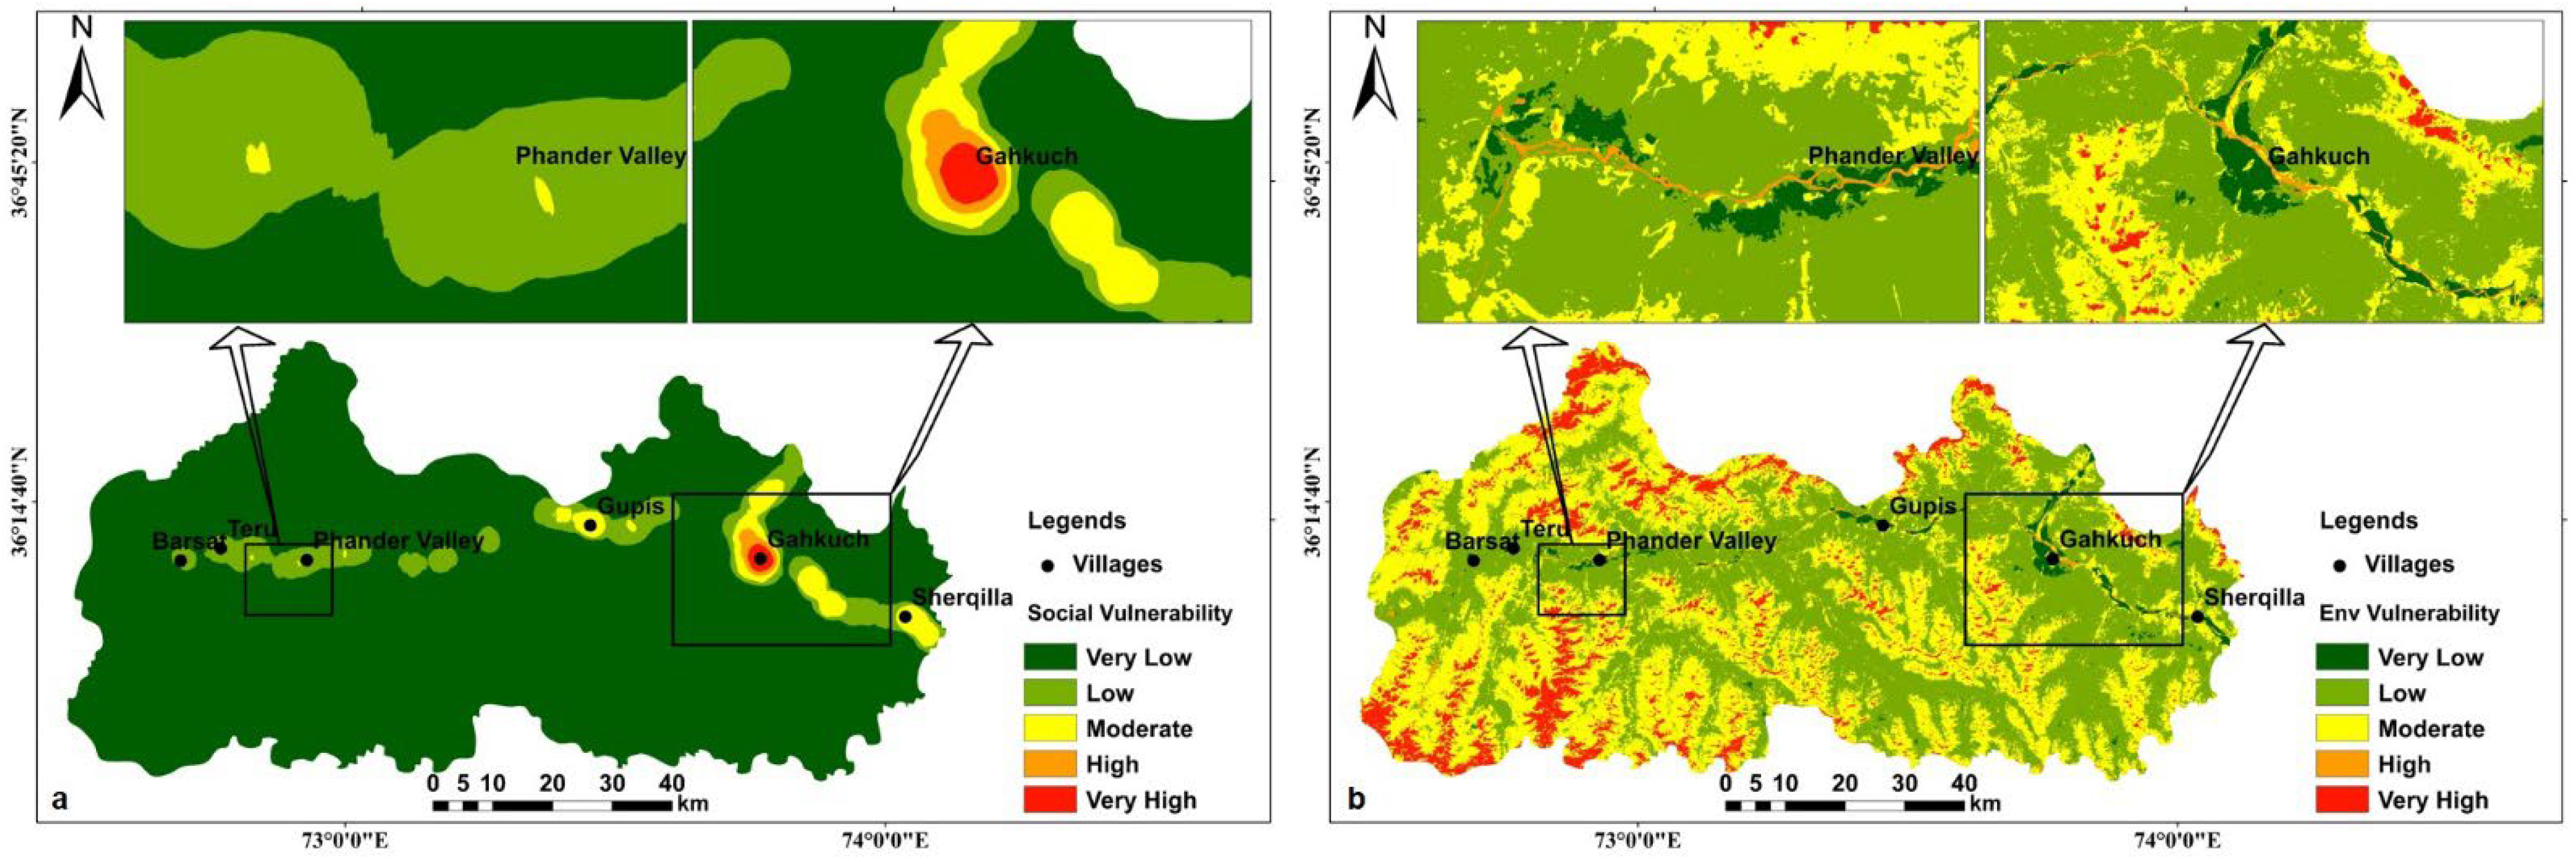
Social and Environmental Vulnerability
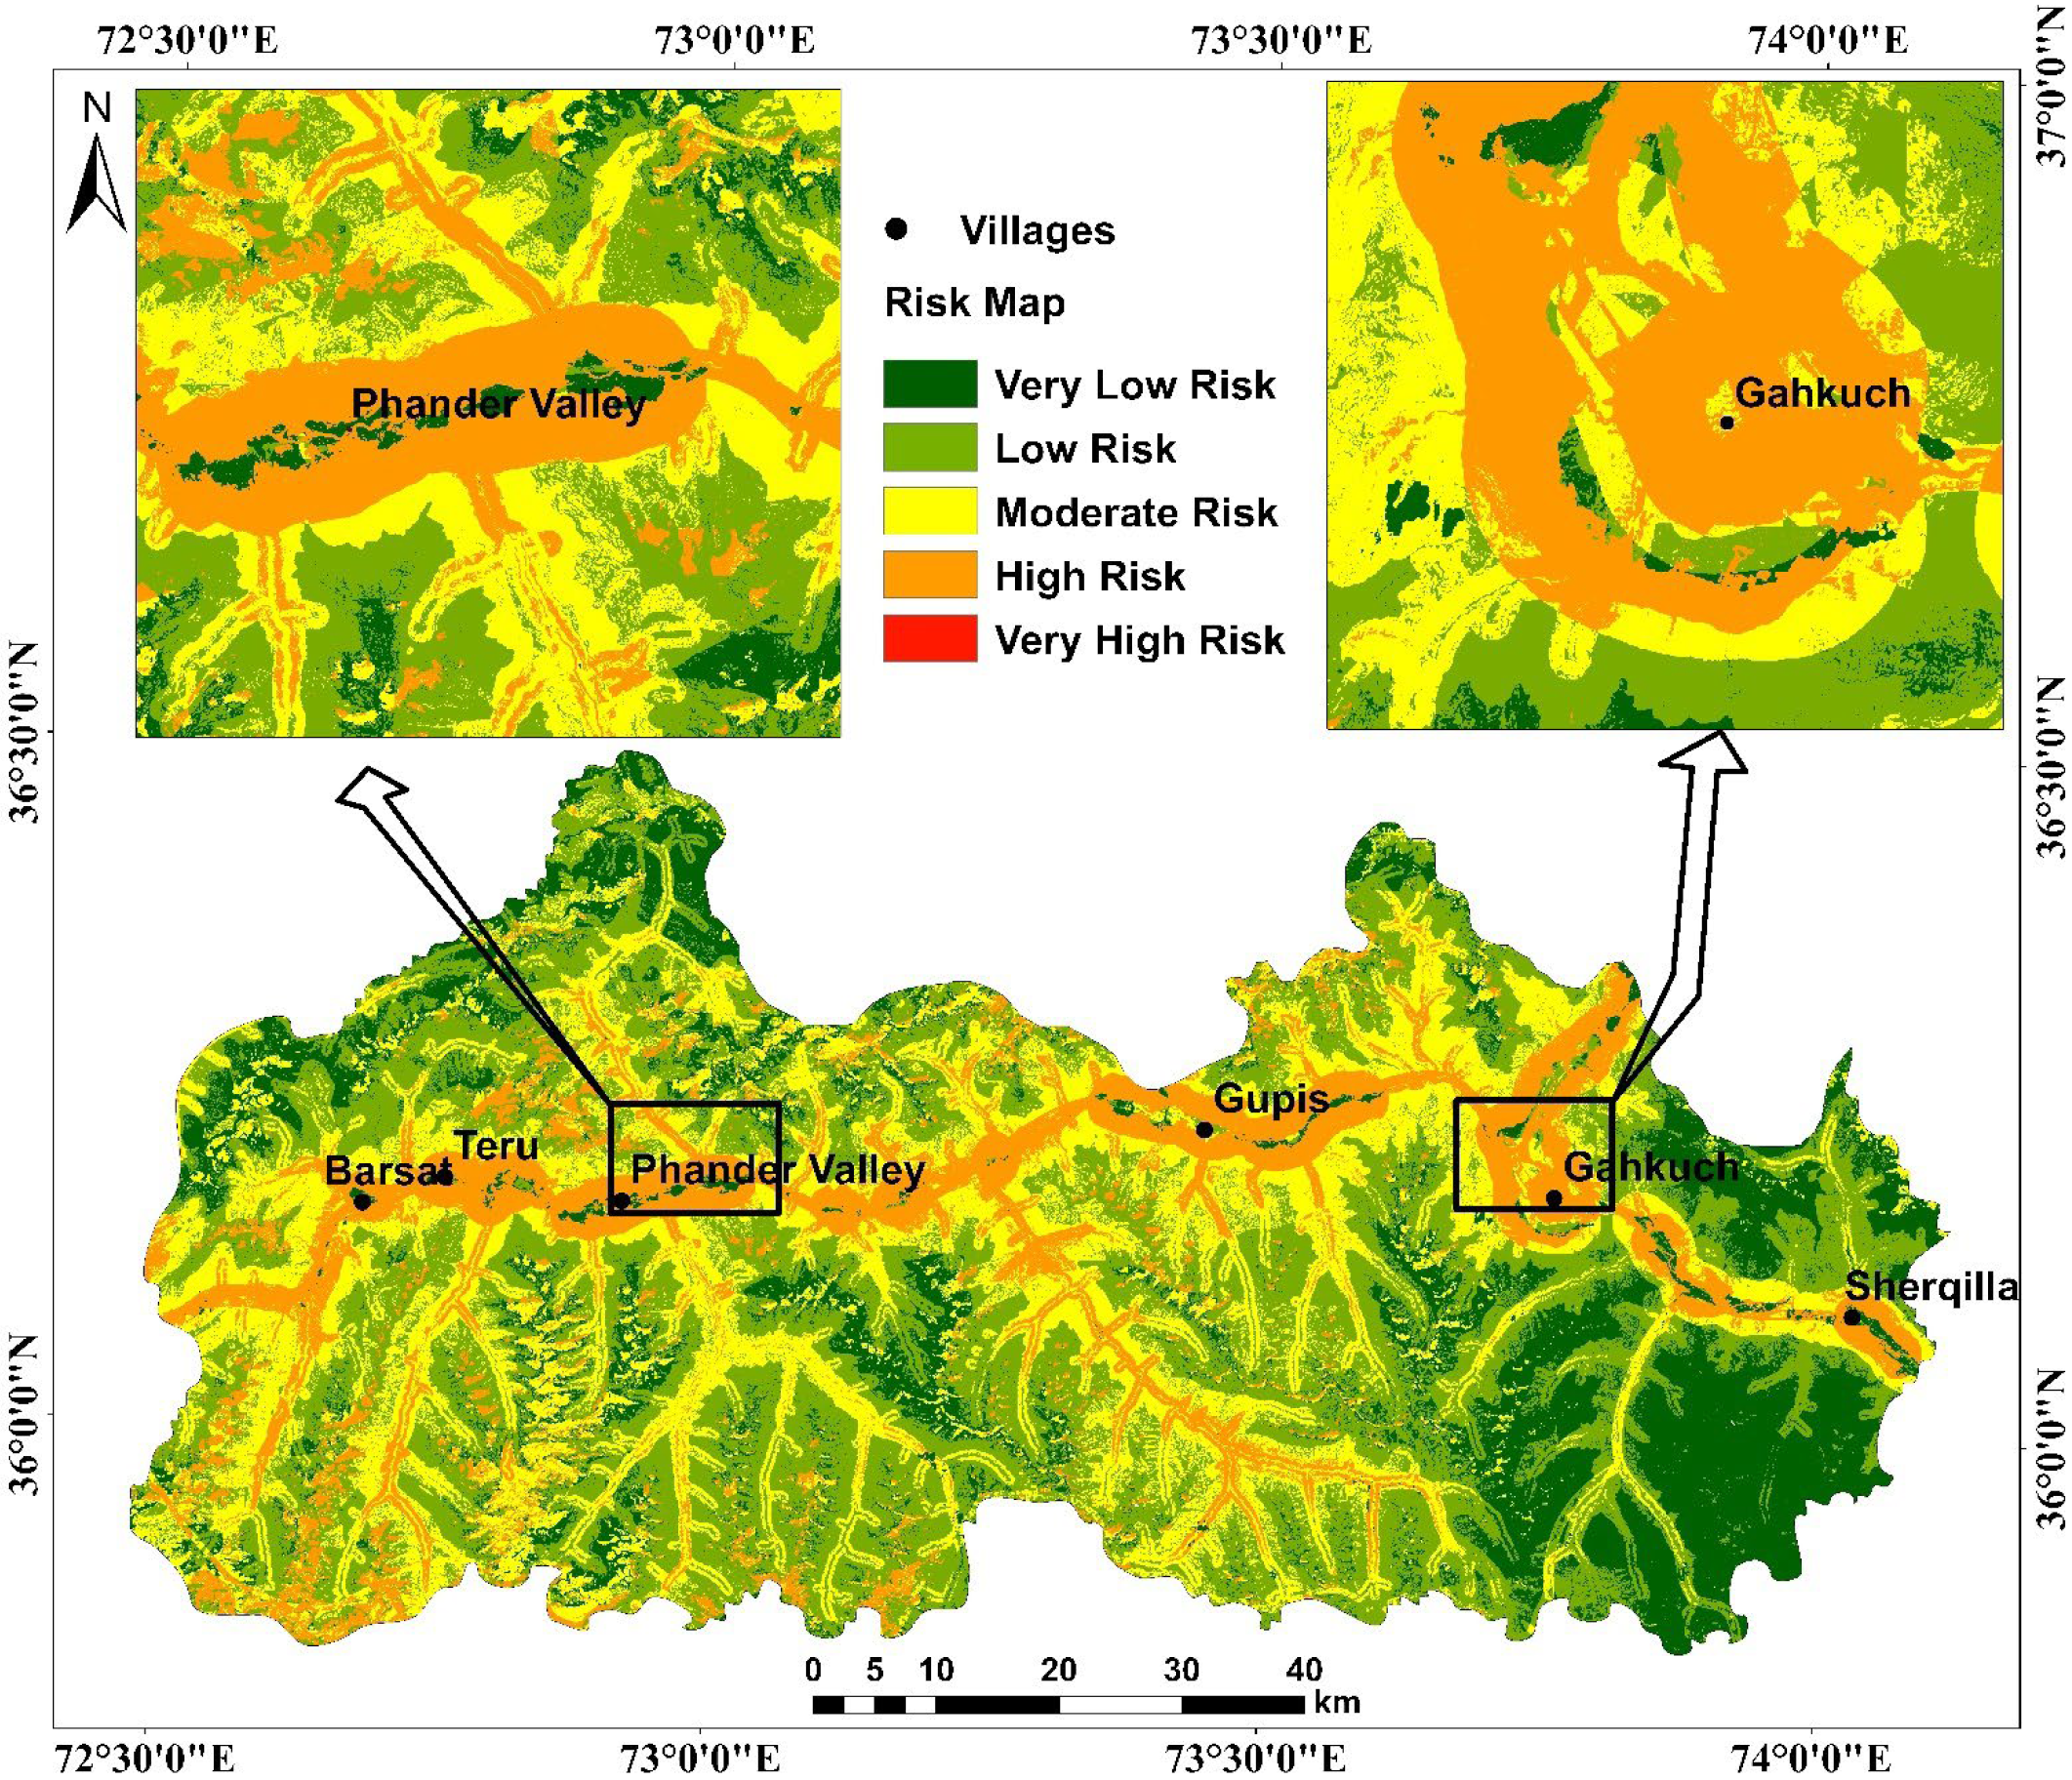
Landslide Risk Assessment
4. Results
4.1. Landslide Inventory
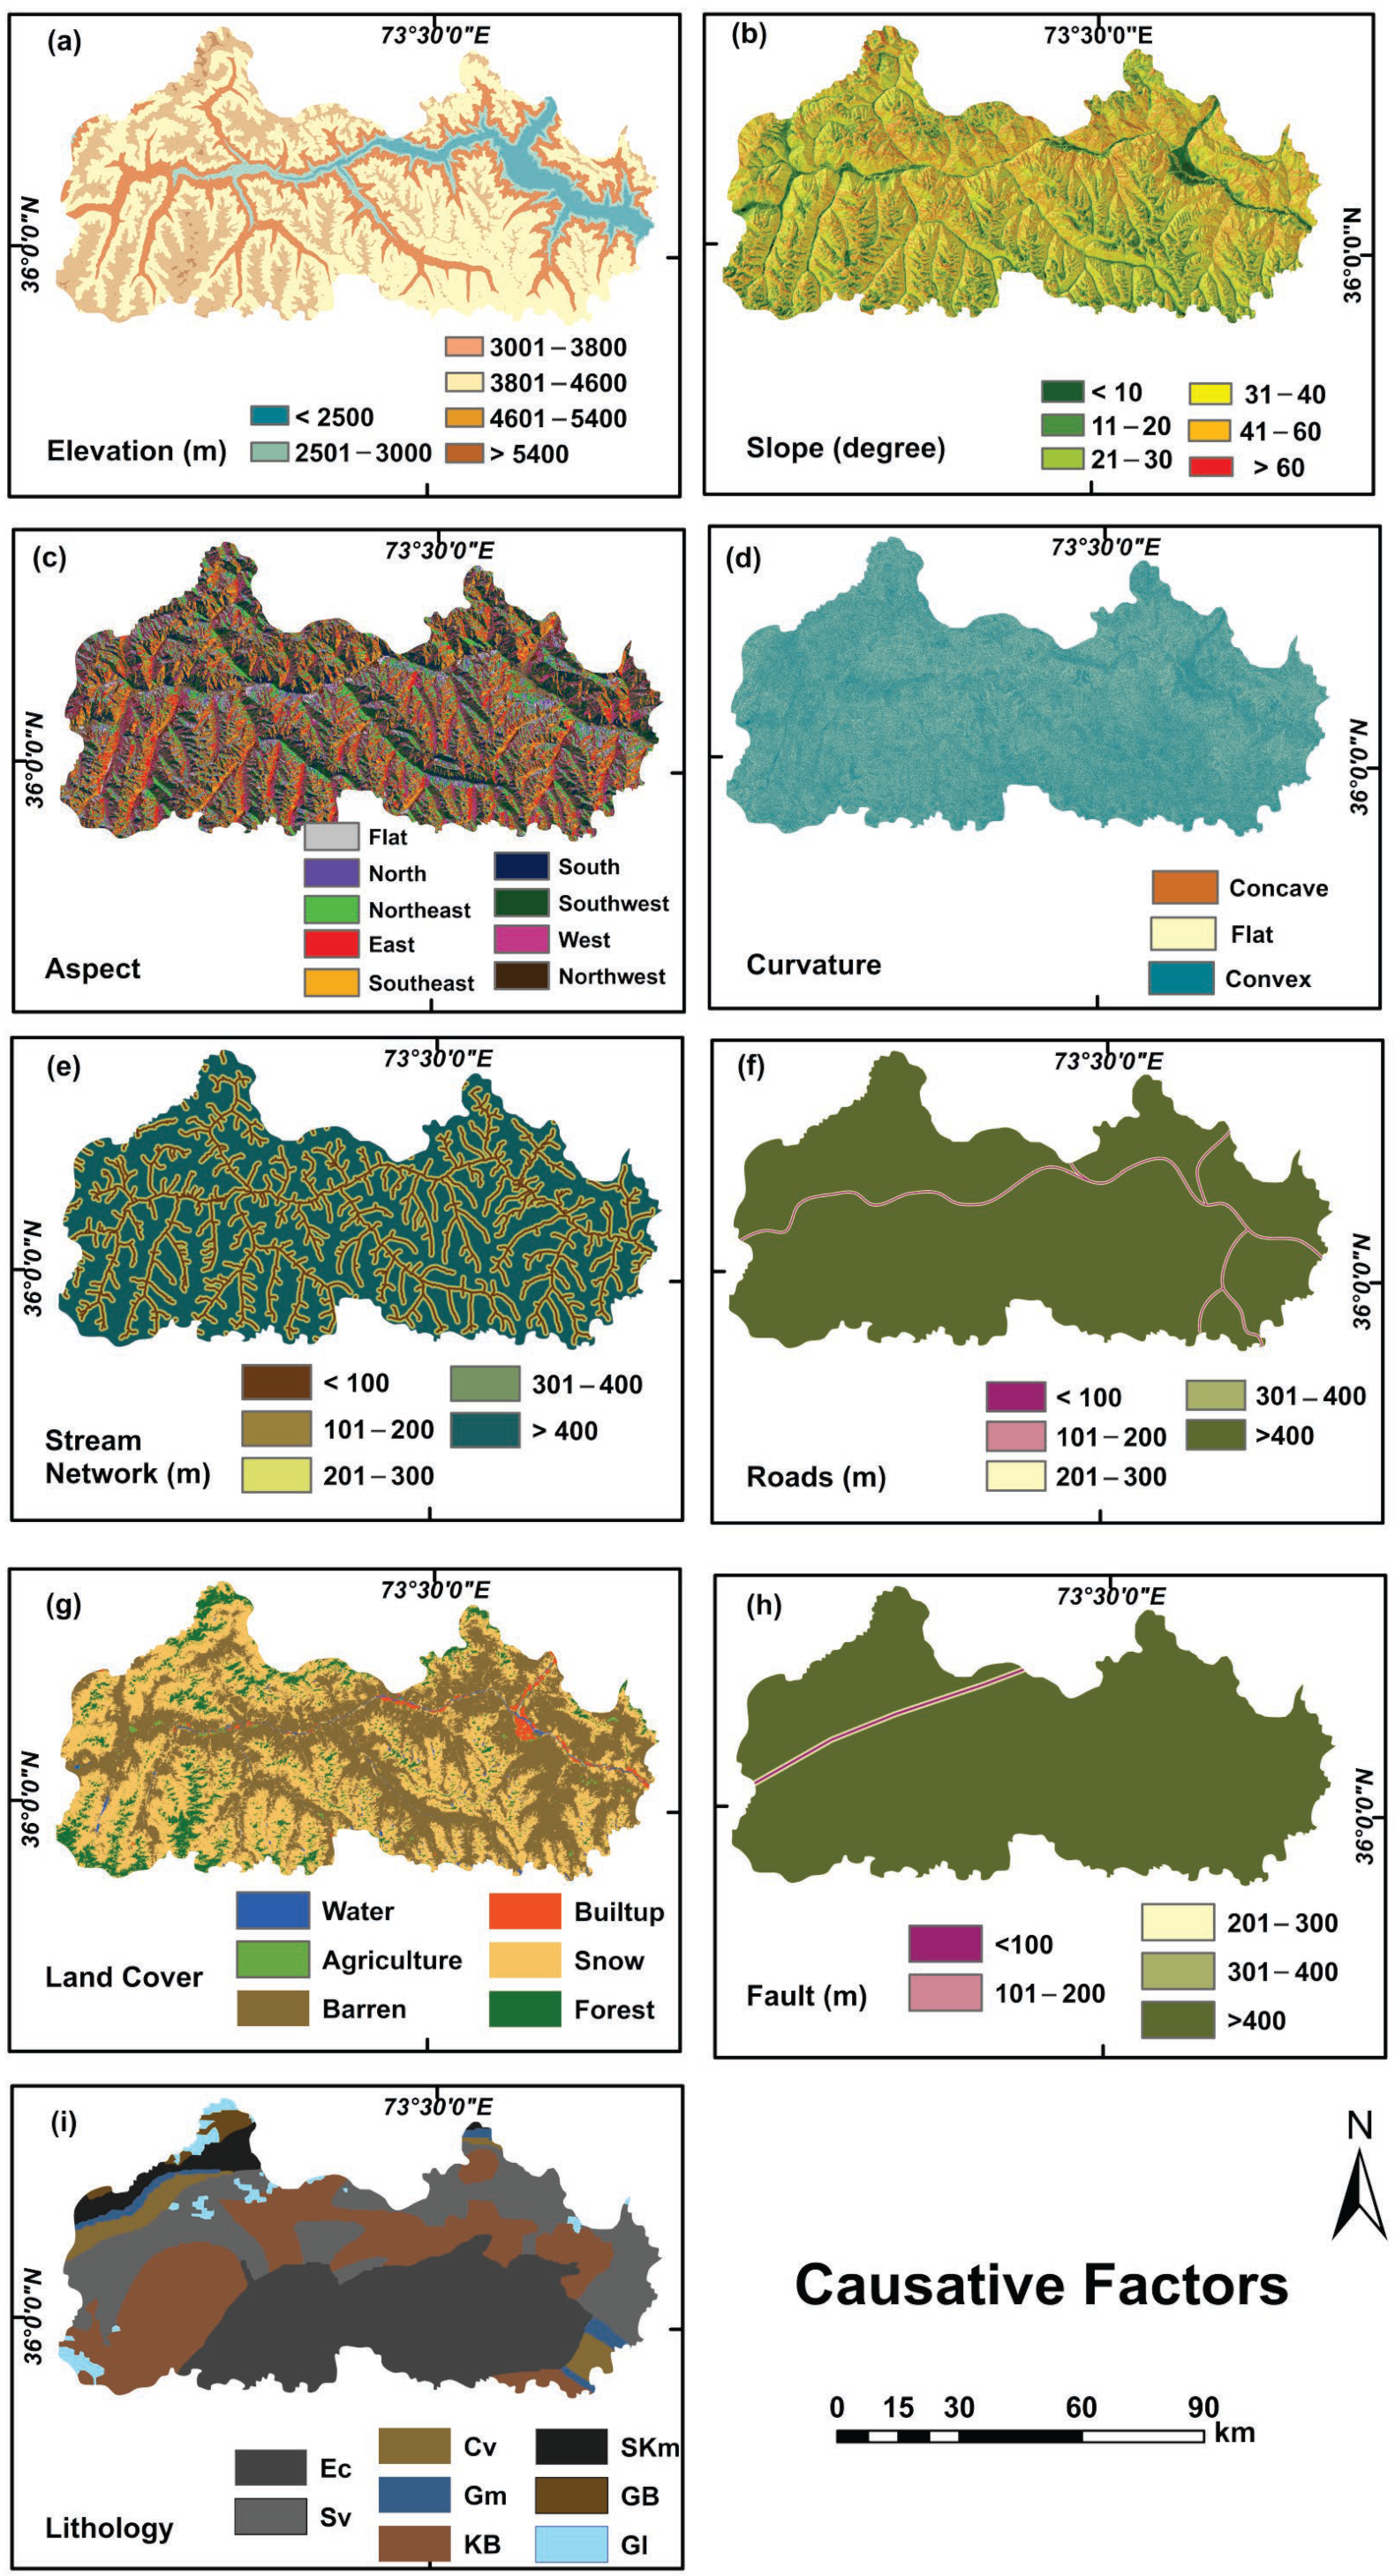
4.2. Landslide Causative Factors
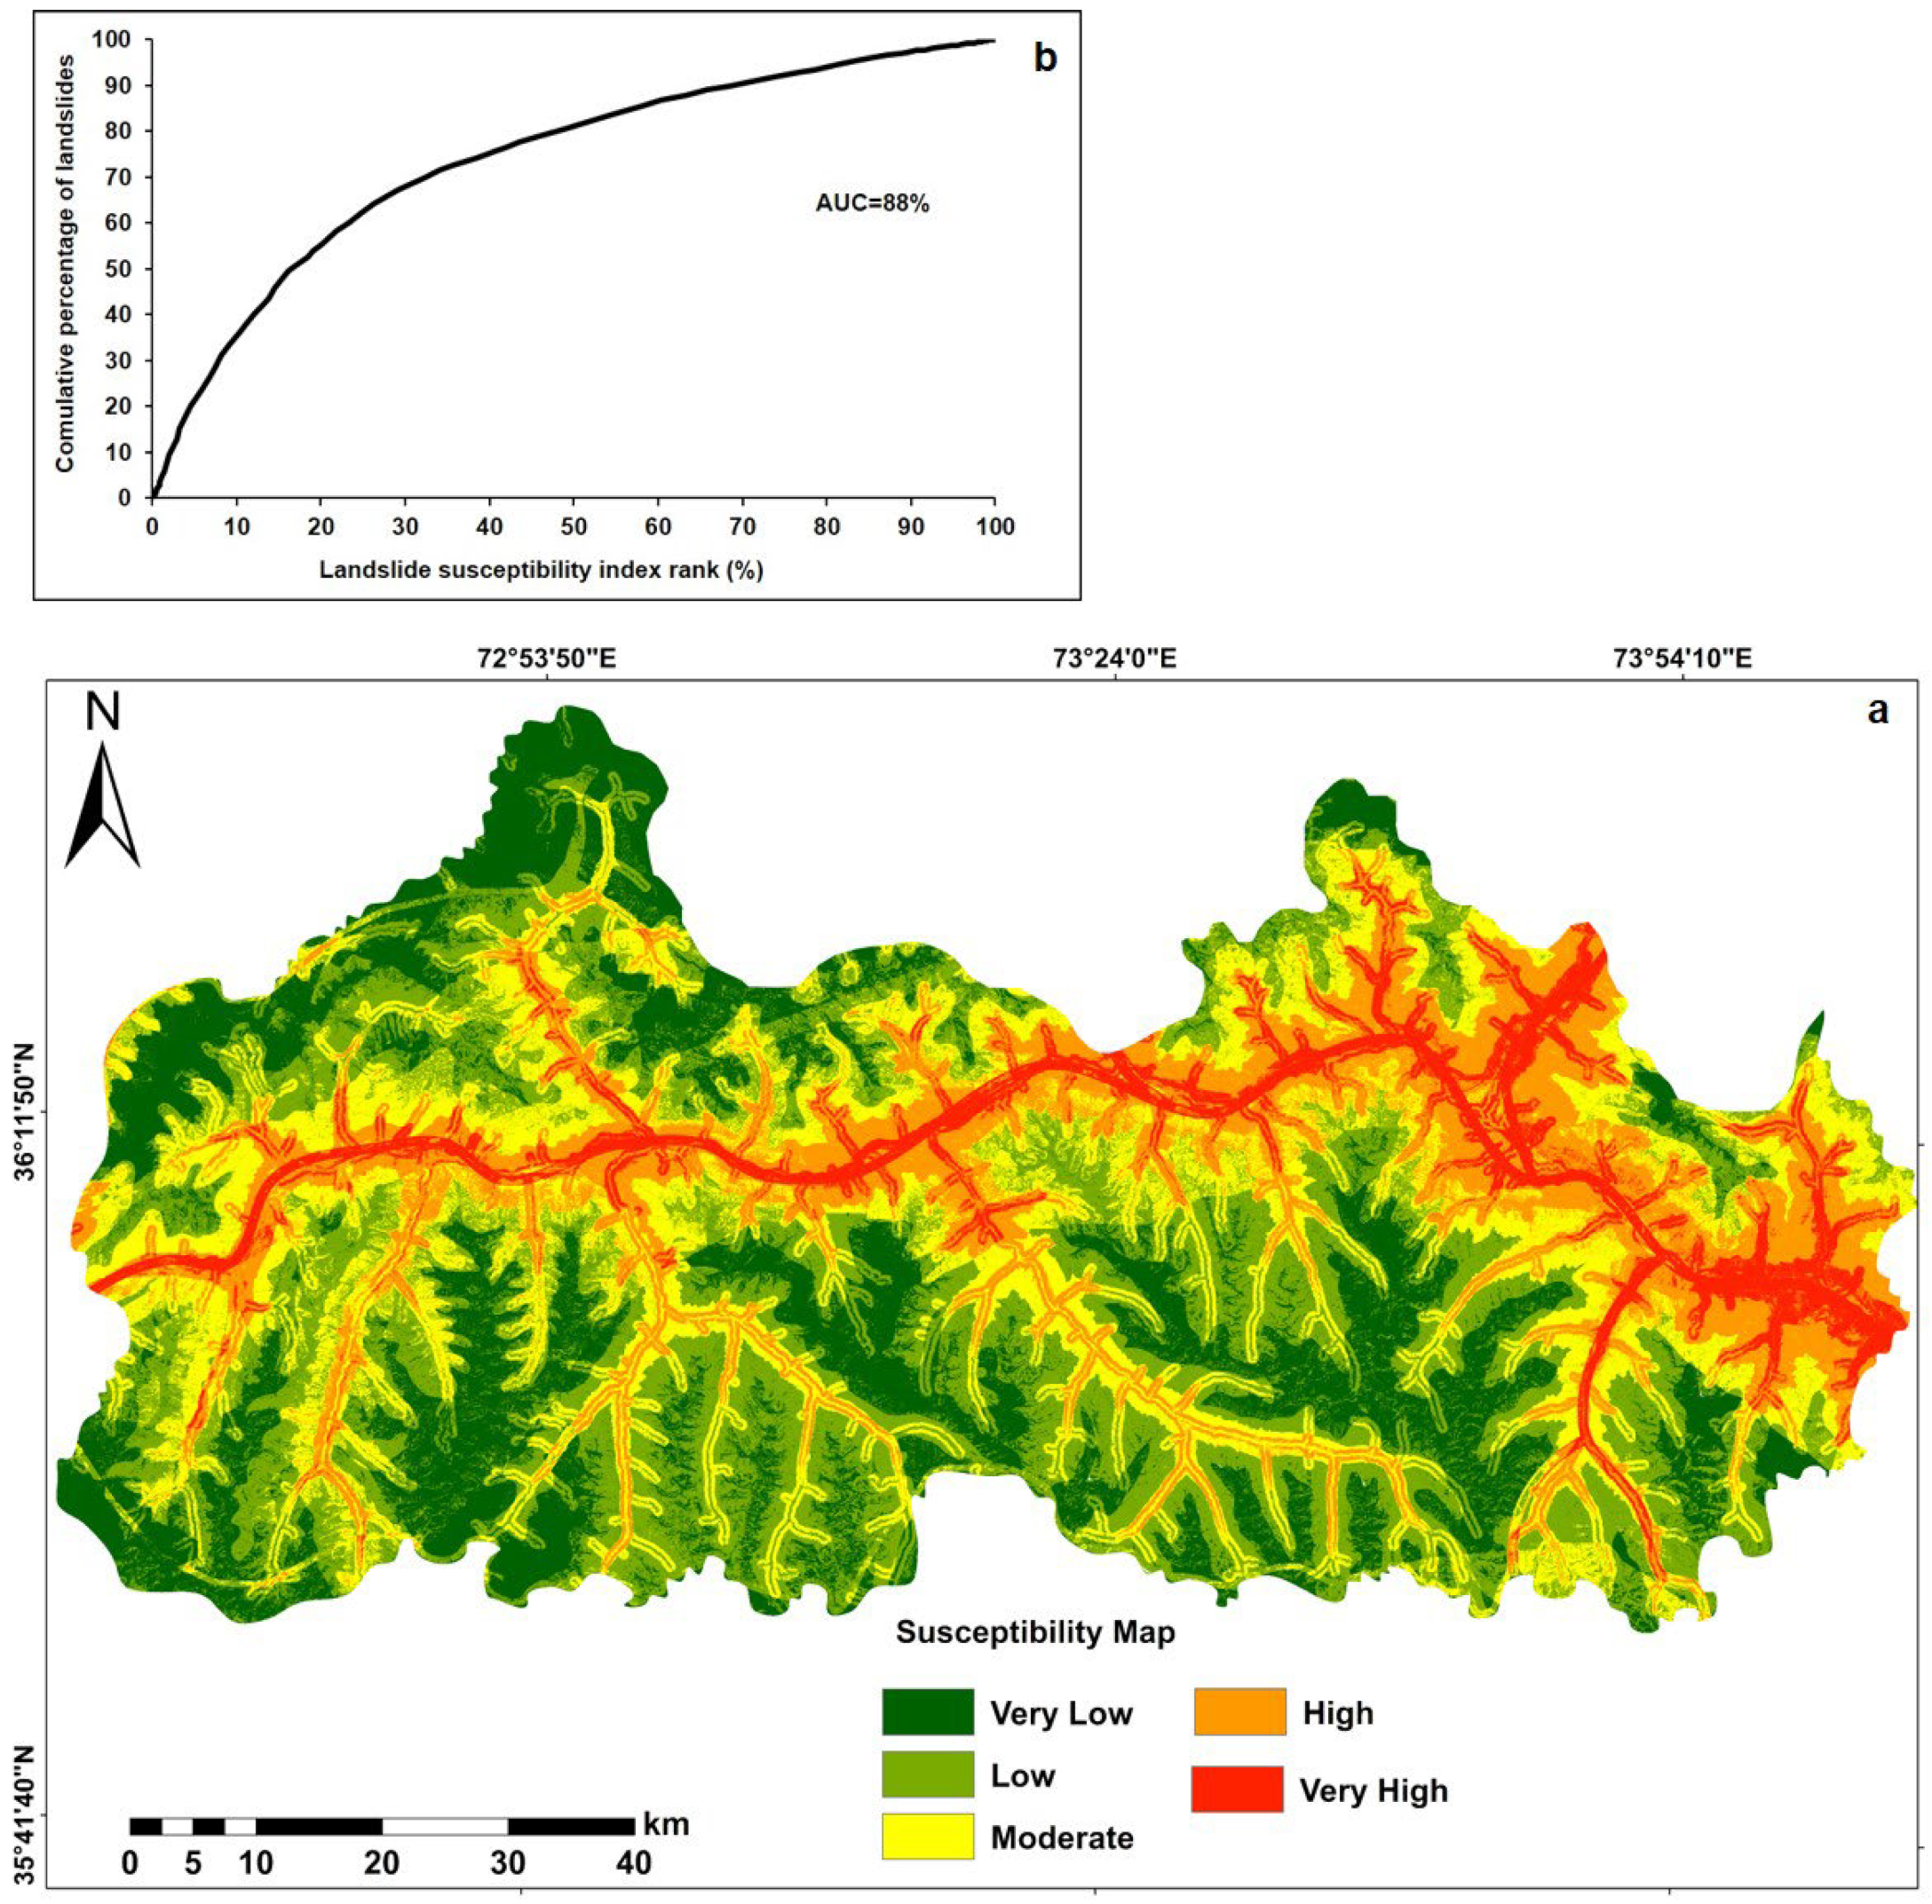
4.3. Landslide Susceptibility and Hazard Mapping
4.4. Landside Vulnerability Assessment
4.4.1. Physical Vulnerability
4.4.2. Social Vulnerability
4.4.3. Environmental Vulnerability
4.4.4. Landslide Risk Map
5. Discussion
6. Conclusions
Author Contributions
Funding
Institutional Review Board Statement
Informed Consent Statement
Data Availability Statement
Conflicts of Interest
References
- Carrara, A.; Crosta, G.; Frattini, P. Geomorphological and historical data in assessing landslide hazard. Earth Surf. Process. Landf. J. Br. Geomorphol. Res. Group 2003, 28, 1125–1142. [Google Scholar] [CrossRef]
- Lee, S.-Y. Structural Equation Modeling: A Bayesian Approach; John Wiley & Sons: Hoboken, NJ, USA, 2007. [Google Scholar]
- Schlögel, R.; Torgoev, I.; de Marneffe, C.; Havenith, H.B. Evidence of a changing size–frequency distribution of landslides in the Kyrgyz Tien Shan, Central Asia. Earth Surf. Process. Landf. 2011, 36, 1658–1669. [Google Scholar] [CrossRef]
- Dilley, M. Natural Disaster Hotspots: A Global Risk Analysis; World Bank Publications: Washington, DC, USA, 2005; Volume 5. [Google Scholar]
- Igwe, O.; Una, C.O. Landslide impacts and management in Nanka area, Southeast Nigeria. Geoenviron. Disasters 2019, 6, 5. [Google Scholar] [CrossRef]
- Zhong, C.; Liu, Y.; Gao, P.; Chen, W.; Li, H.; Hou, Y.; Nuremanguli, T.; Ma, H. Landslide mapping with remote sensing: Challenges and opportunities. Int. J. Remote Sens. 2020, 41, 1555–1581. [Google Scholar] [CrossRef]
- Liu, C. Genetic mechanism of landslide tragedy happened in Hong’ao dumping place in Shenzhen. China 2016, 27, 1–5. [Google Scholar]
- Psomiadis, E.; Charizopoulos, N.; Efthimiou, N.; Soulis, K.X.; Charalampopoulos, I. Earth observation and GIS-based analysis for landslide susceptibility and risk assessment. ISPRS Int. J. Geo-Inf. 2020, 9, 552. [Google Scholar] [CrossRef]
- Yalcin, A.; Reis, S.; Aydinoglu, A.; Yomralioglu, T. A GIS-based comparative study of frequency ratio, analytical hierarchy process, bivariate statistics and logistics regression methods for landslide susceptibility mapping in Trabzon, NE Turkey. Catena 2011, 85, 274–287. [Google Scholar] [CrossRef]
- Plank, S.; Twele, A.; Martinis, S. Landslide mapping in vegetated areas using change detection based on optical and polarimetric SAR data. Remote Sens. 2016, 8, 307. [Google Scholar] [CrossRef]
- Kayastha, P.; Dhital, M.R.; de Smedt, F. Application of the analytical hierarchy process (AHP) for landslide susceptibility mapping: A case study from the Tinau watershed, west Nepal. Comput. Geosci. 2013, 52, 398–408. [Google Scholar] [CrossRef]
- Brabb, E.E. The world landslide problem. Epis. J. Int. Geosci. 1991, 14, 52–61. [Google Scholar] [CrossRef]
- VanDine, D.; Moore, G.; Wise, M. A comparison of landslide risk terminology. In Landslide Risk Management; CRC Press: Boca Raton, FL, USA, 2005; pp. 567–572. [Google Scholar]
- Shafique, M.; van der Meijde, M.; Khan, M.A. A review of the 2005 Kashmir earthquake-induced landslides; from a remote sensing prospective. J. Asian Earth Sci. 2016, 118, 68–80. [Google Scholar] [CrossRef]
- Guzzetti, F.; Mondini, A.C.; Cardinali, M.; Fiorucci, F.; Santangelo, M.; Chang, K.-T. Landslide inventory maps: New tools for an old problem. Earth-Sci. Rev. 2012, 112, 42–66. [Google Scholar] [CrossRef]
- Reichenbach, P.; Rossi, M.; Malamud, B.D.; Mihir, M.; Guzzetti, F. A review of statistically-based landslide susceptibility models. Earth-Sci. Rev. 2018, 180, 60–91. [Google Scholar] [CrossRef]
- Guzzetti, F.; Carrara, A.; Cardinali, M.; Reichenbach, P. Landslide hazard evaluation: A review of current techniques and their application in a multi-scale study, Central Italy. Geomorphology 1999, 31, 181–216. [Google Scholar] [CrossRef]
- Aleotti, P.; Chowdhury, R. Landslide hazard assessment: Summary review and new perspectives. Bull. Eng. Geol. Environ. 1999, 58, 21–44. [Google Scholar] [CrossRef]
- Arnone, M.P.; Small, R.V.; Chauncey, S.A.; McKenna, H.P. Curiosity, interest and engagement in technology-pervasive learning environments: A new research agenda. Educ. Technol. Res. Dev. 2011, 59, 181–198. [Google Scholar] [CrossRef]
- Longo, M.R.; Azañón, E.; Haggard, P. More than skin deep: Body representation beyond primary somatosensory cortex. Neuropsychologia 2010, 48, 655–668. [Google Scholar] [CrossRef]
- Glade, T.; Crozier, M.J. Hazard Impact. In Landslide Hazard and Risk; John Wiley & Sons: Hoboken, NJ, USA, 2005; p. 43. [Google Scholar]
- Glade, T. Vulnerability assessment in landslide risk analysis. Erde 2003, 134, 123–146. [Google Scholar]
- Cassidy, M.J.; Uzielli, M.; Lacasse, S. Probability risk assessment of landslides: A case study at Finneidfjord. Can. Geotech. J. 2008, 45, 1250–1267. [Google Scholar] [CrossRef]
- Bründl, M.; Romang, H.E.; Bischof, N.; Rheinberger, C.M. The risk concept and its application in natural hazard risk management in Switzerland. Nat. Hazards Earth Syst. Sci. 2009, 9, 801–813. [Google Scholar] [CrossRef]
- Fell, R.; Corominas, J.; Bonnard, C.; Cascini, L.; Leroi, E.; Savage, W.Z. Guidelines for landslide susceptibility, hazard and risk zoning for land-use planning. Eng. Geol. 2008, 102, 99–111. [Google Scholar] [CrossRef]
- Corominas, J.; van Westen, C.; Frattini, P.; Cascini, L.; Malet, J.-P.; Fotopoulou, S.; Catani, F.; van den Eeckhaut, M.; Mavrouli, O.; Agliardi, F. Recommendations for the quantitative analysis of landslide risk. Bull. Eng. Geol. Environ. 2014, 73, 209–263. [Google Scholar] [CrossRef] [Green Version]
- Papathoma-Köhle, M.; Neuhäuser, B.; Ratzinger, K.; Wenzel, H.; Dominey-Howes, D. Elements at risk as a framework for assessing the vulnerability of communities to landslides. Nat. Hazards Earth Syst. Sci. 2007, 7, 765–779. [Google Scholar] [CrossRef]
- Fell, R. Landslide risk assessment and acceptable risk. Can. Geotech. J. 1994, 31, 261–272. [Google Scholar] [CrossRef]
- Pazzi, V.; Morelli, S.; Fidolini, F.; Krymi, E.; Casagli, N.; Fanti, R. Testing cost-effective methodologies for flood and seismic vulnerability assessment in communities of developing countries (Dajç, northern Albania). Geomat. Nat. Hazards Risk 2016, 7, 971–999. [Google Scholar] [CrossRef]
- Opolot, E. Application of remote sensing and geographical information systems in flood management: A review. Res. J. Appl. Sci. Eng. Technol. 2013, 6, 1884–1894. [Google Scholar] [CrossRef]
- Erener, A.; Düzgün, H.B.S. A regional scale quantitative risk assessment for landslides: Case of Kumluca watershed in Bartin, Turkey. Landslides 2013, 10, 55–73. [Google Scholar] [CrossRef]
- Caleca, F.; Tofani, V.; Segoni, S.; Raspini, F.; Rosi, A.; Natali, M.; Catani, F.; Casagli, N. A methodological approach of QRA for slow-moving landslides at a regional scale. Landslides 2022, 19, 1539–1561. [Google Scholar] [CrossRef]
- Quesada-Román, A. Landslide risk index map at the municipal scale for Costa Rica. Int. J. Disaster Risk Reduct. 2021, 56, 102144. [Google Scholar] [CrossRef]
- Chang, M.; Cui, P.; Dou, X.; Su, F. Quantitative risk assessment of landslides over the China-Pakistan economic corridor. Int. J. Disaster Risk Reduct. 2021, 63, 102441. [Google Scholar] [CrossRef]
- Biçer, Ç.T.; Ercanoglu, M. A semi-quantitative landslide risk assessment of central Kahramanmaraş City in the Eastern Mediterranean region of Turkey. Arab. J. Geosci. 2020, 13, 732. [Google Scholar] [CrossRef]
- Wang, H.B.; Wu, S.R.; Shi, J.S.; Li, B. Qualitative hazard and risk assessment of landslides: A practical framework for a case study in China. Nat. Hazards 2011, 69, 1281–1294. [Google Scholar] [CrossRef]
- Achour, Y.; Boumezbeur, A.; Hadji, R.; Chouabbi, A.; Cavaleiro, V.; Bendaoud, E.A. Landslide susceptibility mapping using analytic hierarchy process and information value methods along a highway road section in Constantine, Algeria. Arab. J. Geosci. 2017, 10, 194. [Google Scholar] [CrossRef]
- Pereira, S.; Santos, P.; Zêzere, J.; Tavares, A.; Garcia, R.; Oliveira, S. A landslide risk index for municipal land use planning in Portugal. Sci. Total Environ. 2020, 735, 139463. [Google Scholar] [CrossRef]
- Segoni, S.; Caleca, F. Definition of environmental indicators for a fast estimation of landslide risk at national scale. Land 2021, 10, 621. [Google Scholar] [CrossRef]
- Crawford, M.M.; Dortch, J.M.; Koch, H.J.; Zhu, Y.; Haneberg, W.C.; Wang, Z.; Bryson, L.S. Landslide Risk Assessment in Eastern Kentucky, USA: Developing a Regional Scale, Limited Resource Approach. Remote Sens. 2022, 14, 6246. [Google Scholar] [CrossRef]
- Ali, S.; Biermanns, P.; Haider, R.; Reicherter, K. Landslide susceptibility mapping by using a geographic information system (GIS) along the China–Pakistan Economic Corridor (Karakoram Highway), Pakistan. Nat. Hazards Earth Syst. Sci. 2019, 19, 999–1022. [Google Scholar] [CrossRef]
- Rahman, G.; Rahman, A.U.; Bacha, A.S.; Mahmood, S.; Moazzam, M.F.U.; Lee, B.G. Assessment of landslide susceptibility using weight of evidence and frequency ratio model in Shahpur Valley, Eastern Hindu Kush. Nat. Hazards Earth Syst. Sci. Discuss. 2020, 2020, 1–19. [Google Scholar]
- Rahman, G.; Rahman, A.-U.; Ullah, S.; Miandad, M.; Collins, A.E. Spatial analysis of landslide susceptibility using failure rate approach in the Hindu Kush region, Pakistan. J. Earth Syst. Sci. 2019, 128, 59. [Google Scholar] [CrossRef]
- Ahmed, M.; Rogers, J.; Abu Bakar, M.Z. Hunza River Watershed Landslide and Related Features Inventory Mapping; Springer: Berlin/Heidelberg, Germany, 2016; Volume 75. [Google Scholar]
- Ahmed, M.F.; Rogers, J.D.; Ismail, E.H. A regional level preliminary landslide susceptibility study of the upper Indus river basin. Eur. J. Remote Sens. 2014, 47, 343–373. [Google Scholar] [CrossRef]
- Hussain, S.; Hongxing, S.; Ali, M.; Ali, M. PS-InSAR based validated landslide susceptibility modelling: A case study of Ghizer valley, Northern Pakistan. Geocarto Int. 2021, 37, 3941–3962. [Google Scholar] [CrossRef]
- Hussain, S.; Hongxing, S.; Ali, M.; Sajjad, M.M.; Ali, M.; Afzal, Z.; Ali, S. Optimized landslide susceptibility mapping and modelling using PS-InSAR technique: A case study of Chitral valley, Northern Pakistan. Geocarto Int. 2022, 37, 5227–5248. [Google Scholar] [CrossRef]
- Maqsoom, A.; Aslam, B.; Khalil, U.; Kazmi, Z.A.; Azam, S.; Mehmood, T.; Nawaz, A. Landslide susceptibility mapping along the China Pakistan Economic Corridor (CPEC) route using multi-criteria decision-making method. Model. Earth Syst. Environ. 2022, 8, 1519–1533. [Google Scholar] [CrossRef]
- Searle, M.; Khan, M. Geological Map of North Pakistan and Adjacent Areas of Northern Landmark and Western Tibet (Western Himalaya, Salt Ranges, Kohistan, Karakoram, Hindu Kush), 1: 650 000; Shell International Exploration and Production: The Hague, The Netherlands, 1996. [Google Scholar]
- Hewitt, K.; Gosse, J.; Clague, J.J. Rock avalanches and the pace of late Quaternary development of river valleys in the Karakoram Himalaya. Bulletin 2011, 123, 1836–1850. [Google Scholar] [CrossRef]
- Korup, O.; Densmore, A.L.; Schlunegger, F. The role of landslides in mountain range evolution. Geomorphology 2010, 120, 77–90. [Google Scholar] [CrossRef]
- Hewitt, K. Styles of rock-avalanche depositional complexes conditioned by very rugged terrain, Karakoram Himalaya, Pakistan. Rev. Eng. Geol. 2002, 15, 345–377. [Google Scholar]
- Shafique, M.; van der Meijde, M.; Kerle, N.; van der Meer, F. Impact of DEM source and resolution on topographic seismic amplification. Int. J. Appl. Earth Obs. Geoinf. 2011, 13, 420–427. [Google Scholar] [CrossRef]
- Tian, Y.; Xiao, C.; Liu, Y.; Wu, L. Effects of raster resolution on landslide susceptibility mapping: A case study of Shenzhen. Sci. China Ser. E Technol. Sci. 2008, 51, 188–198. [Google Scholar] [CrossRef]
- Rehman, K.; Burton, P.W.; Weatherill, G.A. Application of Gumbel I and Monte Carlo methods to assess seismic hazard in and around Pakistan. J. Seismol. 2018, 22, 575–588. [Google Scholar] [CrossRef]
- Pham, B.T.; Pradhan, B.; Bui, D.T.; Prakash, I.; Dholakia, M. A comparative study of different machine learning methods for landslide susceptibility assessment: A case study of Uttarakhand area (India). Environ. Model. Softw. 2016, 84, 240–250. [Google Scholar] [CrossRef]
- Hungr, O.; Leroueil, S.; Picarelli, L. The Varnes classification of landslide types, an update. Landslides 2014, 11, 167–194. [Google Scholar] [CrossRef]
- Shirzadi, A.; Soliamani, K.; Habibnejhad, M.; Kavian, A.; Chapi, K.; Shahabi, H.; Chen, W.; Khosravi, K.; Thai Pham, B.; Pradhan, B. Novel GIS based machine learning algorithms for shallow landslide susceptibility mapping. Sensors 2018, 18, 3777. [Google Scholar] [CrossRef]
- Pham, B.T.; Prakash, I.; Dou, J.; Singh, S.K.; Trinh, P.T.; Tran, H.T.; Le, T.M.; van Phong, T.; Khoi, D.K.; Shirzadi, A. A novel hybrid approach of landslide susceptibility modelling using rotation forest ensemble and different base classifiers. Geocarto Int. 2020, 35, 1267–1292. [Google Scholar] [CrossRef]
- Bui, D.T.; Lofman, O.; Revhaug, I.; Dick, O. Landslide susceptibility analysis in the Hoa Binh province of Vietnam using statistical index and logistic regression. Nat. Hazards 2011, 59, 1413–1444. [Google Scholar] [CrossRef]
- Dou, J.; Paudel, U.; Oguchi, T.; Uchiyama, S.; Hayakavva, Y.S. Shallow and Deep-Seated Landslide Differentiation Using Support Vector Machines: A Case Study of the Chuetsu Area, Japan. Terr. Atmos. Ocean. Sci. 2015, 26, 227. [Google Scholar] [CrossRef]
- Javier, D.; Kumar, L. Frequency Ratio Landslide Susceptibility Estimation in a Tropical Mountain Region. Int. Arch. Photogramm. Remote Sens. Spat. Inf. Sci. 2019, XLII-3/W8, 173–179. [Google Scholar] [CrossRef]
- Magliulo, P.; di Lisio, A.; Russo, F.; Zelano, A. Geomorphology and landslide susceptibility assessment using GIS and bivariate statistics: A case study in southern Italy. Nat. Hazards 2008, 47, 411–435. [Google Scholar] [CrossRef]
- García-Rodríguez, M.J.; Malpica, J.; Benito, B.; Díaz, M. Susceptibility assessment of earthquake-triggered landslides in El Salvador using logistic regression. Geomorphology 2008, 95, 172–191. [Google Scholar] [CrossRef]
- Dou, J.; Oguchi, T.; Hayakawa, Y.S.; Uchiyama, S.; Saito, H.; Paudel, U. GIS-based landslide susceptibility mapping using a certainty factor model and its validation in the Chuetsu Area, Central Japan. In Landslide Science for a Safer Geoenvironment; Springer: Berlin/Heidelberg, Germany, 2014; pp. 419–424. [Google Scholar]
- Tiwari, B.; Pradel, D.; Ajmera, B.; Yamashiro, B.; Khadka, D. Landslide movement at Lokanthali during the 2015 earthquake in Gorkha, Nepal. J. Geotech. Geoenvironmental Eng. 2018, 144, 05018001. [Google Scholar] [CrossRef]
- Gorum, T.; Fan, X.; van Westen, C.J.; Huang, R.Q.; Xu, Q.; Tang, C.; Wang, G. Distribution pattern of earthquake-induced landslides triggered by the 12 May 2008 Wenchuan earthquake. Geomorphology 2011, 133, 152–167. [Google Scholar] [CrossRef]
- Pradhan, S.; Toll, D.G.; Rosser, N.J.; Brain, M.J. An investigation of the combined effect of rainfall and road cut on landsliding. Eng. Geol. 2022, 307, 106787. [Google Scholar] [CrossRef]
- Kanwal, S.; Atif, S.; Shafiq, M. GIS based landslide susceptibility mapping of northern areas of Pakistan, a case study of Shigar and Shyok Basins. Geomat. Nat. Hazards Risk 2017, 8, 348–366. [Google Scholar] [CrossRef]
- Chen, W.; Chai, H.; Sun, X.; Wang, Q.; Ding, X.; Hong, H. A GIS-based comparative study of frequency ratio, statistical index and weights-of-evidence models in landslide susceptibility mapping. Arab. J. Geosci. 2016, 9, 204. [Google Scholar] [CrossRef]
- Yan, F.; Zhang, Q.; Ye, S.; Ren, B. A novel hybrid approach for landslide susceptibility mapping integrating analytical hierarchy process and normalized frequency ratio methods with the cloud model. Geomorphology 2019, 327, 170–187. [Google Scholar] [CrossRef]
- Solaimani, K.; Mousavi, S.Z.; Kavian, A. Landslide susceptibility mapping based on frequency ratio and logistic regression models. Arab. J. Geosci. 2013, 6, 2557–2569. [Google Scholar] [CrossRef]
- Wu, Y.; Li, W.; Wang, Q.; Liu, Q.; Yang, D.; Xing, M.; Pei, Y.; Yan, S. Landslide susceptibility assessment using frequency ratio, statistical index and certainty factor models for the Gangu County, China. Arab. J. Geosci. 2016, 9, 84. [Google Scholar] [CrossRef]
- Wang, Q.; Li, W. A GIS-based comparative evaluation of analytical hierarchy process and frequency ratio models for landslide susceptibility mapping. Phys. Geogr. 2017, 38, 318–337. [Google Scholar] [CrossRef]
- Akgun, A.; Dag, S.; Bulut, F. Landslide susceptibility mapping for a landslide-prone area (Findikli, NE of Turkey) by likelihood-frequency ratio and weighted linear combination models. Environ. Geol. 2007, 54, 1127–1143. [Google Scholar] [CrossRef]
- Lee, S.; Sambath, T. Landslide susceptibility mapping in the Damrei Romel area, Cambodia using frequency ratio and logistic regression models. Environ. Geol. 2006, 50, 847–855. [Google Scholar] [CrossRef]
- Panchal, S.; Shrivastava, A.K. A comparative study of frequency ratio, Shannon’s entropy and analytic hierarchy process (AHP) models for landslide susceptibility assessment. ISPRS Int. J. Geo-Inf. 2021, 10, 603. [Google Scholar] [CrossRef]
- Lissak, C.; Maquaire, O.; Davidson, R.; Malet, J.-P. Piezometric thresholds for triggering landslides along the Normandy coast, France. Géomorphologie Relief Process. Environ. 2014, 20, 145–158. [Google Scholar] [CrossRef]
- Kempler, S. Goddard Earth Sciences Data and Information Services Center. Disc. Sci. Gsfc. NASA Gov. 2013. Available online: https://disc.gsfc.nasa.gov/ (accessed on 27 August 2022).
- Akgun, A.; Kıncal, C.; Pradhan, B. Application of remote sensing data and GIS for landslide risk assessment as an environmental threat to Izmir city (west Turkey). Environ. Monit. Assess. 2012, 184, 5453–5470. [Google Scholar] [CrossRef]
- Nefeslioglu, H.A.; Gokceoglu, C.; Sonmez, H.; Gorum, T. Medium-scale hazard mapping for shallow landslide initiation: The Buyukkoy catchment area (Cayeli, Rize, Turkey). Landslides 2011, 8, 459–483. [Google Scholar] [CrossRef]
- Dai, F.; Lee, C.F.; Ngai, Y.Y. Landslide risk assessment and management: An overview. Eng. Geol. 2002, 64, 65–87. [Google Scholar] [CrossRef]
- Abella, E.; van Westen, C. Generation of a landslide risk index map for Cuba using spatial multi-criteria evaluation. Landslides 2007, 4, 311–325. [Google Scholar] [CrossRef]
- Leone, F.; Asté, J.; Leroi, E. Vulnerability assessment of elements exposed to mass-movement: Working toward a better risk perception. In Landslides-Glissements de Terrain; Balkema: Rotterdam, The Netherlands, 1996; pp. 263–270. [Google Scholar]
- Bednarik, M.; Yilmaz, I.; Marschalko, M. Landslide hazard and risk assessment: A case study from the Hlohovec–Sered’landslide area in south-west Slovakia. Nat. Hazards 2012, 64, 547–575. [Google Scholar] [CrossRef]
- Zêzere, J.; Garcia, R.; Oliveira, S.; Reis, E. Probabilistic landslide risk analysis considering direct costs in the area north of Lisbon (Portugal). Geomorphology 2008, 94, 467–495. [Google Scholar] [CrossRef]
- Saaty, T. The Analytic Hierarchy Process: Planning, Priority Setting, Resources Allocation; McGraw-Hill: New York, NY, USA, 1980. [Google Scholar]
- Priyono, K.D.; Saputra, A.; Fikriyah, V.N. Risk analysis of landslide impacts on settlements in Karanganyar, Central Java, Indonesia. Geomate J. 2020, 19, 100–107. [Google Scholar] [CrossRef]
- Uzielli, M.; Nadim, F.; Lacasse, S.; Kaynia, A.M. A conceptual framework for quantitative estimation of physical vulnerability to landslides. Eng. Geol. 2008, 102, 251–256. [Google Scholar] [CrossRef]
- Abdulwahid, W.M.; Pradhan, B. Landslide vulnerability and risk assessment for multi-hazard scenarios using airborne laser scanning data (LiDAR). Landslides 2017, 14, 1057–1076. [Google Scholar] [CrossRef]
- Dou, J.; Tien Bui, D.P.; Yunus, A.; Jia, K.; Song, X.; Revhaug, I.; Xia, H.; Zhu, Z. Optimization of causative factors for landslide susceptibility evaluation using remote sensing and GIS data in parts of Niigata, Japan. PLoS ONE 2015, 10, e0133262. [Google Scholar] [CrossRef] [PubMed]
- Bacha, A.S.; Shafique, M.; van der Werff, H.; van der Meijde, M.; Hussain, M.L.; Wahid, S. Spatio-temporal landslide inventory and susceptibility assessment using Sentinel-2 in the Himalayan mountainous region of Pakistan. Environ. Monit. Assess. 2022, 194, 845. [Google Scholar] [CrossRef] [PubMed]
- Khan, H.; Shafique, M.; Khan, M.A.; Bacha, M.A.; Shah, S.U.; Calligaris, C. Landslide susceptibility assessment using Frequency Ratio, a case study of northern Pakistan. Egypt. J. Remote Sens. Space Sci. 2018, 22, 11–24. [Google Scholar] [CrossRef]
- Hussain, M.L.; Shafique, M.; Bacha, A.S.; Chen, X.-Q.; Chen, H.-Y. Landslide inventory and susceptibility assessment using multiple statistical approaches along the Karakoram highway, northern Pakistan. J. Mt. Sci. 2021, 18, 583–598. [Google Scholar] [CrossRef]
- Ahmed, M.F.; Rogers, J. First-Approximation Landslide Inventory Maps for Northern Pakistan, Using ASTER DEM Data and Geomorphic Indicators. Environ. Eng. Geosci. 2014, 20, 67–83. [Google Scholar] [CrossRef]
- Bacha, A.S.; Shafique, M.; van der Werff, H. Landslide inventory and susceptibility modelling using geospatial tools, in Hunza-Nagar valley, northern Pakistan. J. Mt. Sci. 2018, 15, 1354–1370. [Google Scholar] [CrossRef]
- Farooq Ahmed, M.; David Rogers, J. Regional level landslide inventory maps of the Shyok River watershed, Northern Pakistan. Bull. Eng. Geol. Environ. 2016, 75, 563–574. [Google Scholar] [CrossRef]
- Rahim, I.; Ali, S.M.; Aslam, M. GIS Based landslide susceptibility mapping with application of analytical hierarchy process in District Ghizer, Gilgit Baltistan Pakistan. J. Geosci. Environ. Prot. 2018, 6, 34–49. [Google Scholar] [CrossRef]
- Ahmed, M.F.; Awan, U.; Rogers, J.D. Use of anomalous topographic features for landslide inventory mapping of Gilgit area, Gilgit-Baltistan, Pakistan. Arab. J. Geosci. 2021, 14, 2416. [Google Scholar] [CrossRef]
- Mikoš, M.; Četina, M.; Brilly, M. Hydrologic conditions responsible for triggering the Stože landslide, Slovenia. Eng. Geol. 2004, 73, 193–213. [Google Scholar] [CrossRef]
- Mikoš, M.; Majes, B. Delineation of risk area in Log pod Mangartom due to debris flows from the Stože landslide. Acta Geogr. Slov. 2007, 47, 171–198. [Google Scholar] [CrossRef]
- Van Westen, C.; van Asch, T.W.; Soeters, R. Landslide hazard and risk zonation—Why is it still so difficult? Bull. Eng. Geol. Environ. 2006, 65, 167–184. [Google Scholar] [CrossRef]
- Althuwaynee, O.F.; Pradhan, B.; Ahmad, N. Estimation of rainfall threshold and its use in landslide hazard mapping of Kuala Lumpur metropolitan and surrounding areas. Landslides 2015, 12, 861–875. [Google Scholar] [CrossRef]
- Agliardi, F.; Crosta, G.; Frattini, P. Integrating rockfall risk assessment and countermeasure design by 3D modelling techniques. Nat. Hazards Earth Syst. Sci. 2009, 9, 1059–1073. [Google Scholar] [CrossRef] [Green Version]
- Negulescu, C.; Foerster, E. Parametric studies and quantitative assessment of the vulnerability of a RC frame building exposed to differential settlements. Nat. Hazards Earth Syst. Sci. 2010, 10, 1781–1792. [Google Scholar] [CrossRef]
- Jakob, M.; Stein, D.; Ulmi, M. Vulnerability of buildings to debris flow impact. Nat. Hazards 2012, 60, 241–261. [Google Scholar] [CrossRef]
- Ko Ko, C.; Flentje, P.; Chowdhury, R. Landslides qualitative hazard and risk assessment method and its reliability. Bull. Eng. Geol. Environ. 2004, 63, 149–165. [Google Scholar] [CrossRef]
- Catani, F.; Casagli, N.; Ermini, L.; Righini, G.; Menduni, G. Landslide hazard and risk mapping at catchment scale in the Arno River basin. Landslides 2005, 2, 329–342. [Google Scholar] [CrossRef]
- Galli, M.; Guzzetti, F. Landslide vulnerability criteria: A case study from Umbria, Central Italy. Environ. Manag. 2007, 40, 649–665. [Google Scholar] [CrossRef]
- Wong, C.; Lee, C. Applications of quantitative landslide risk assessment in Hong Kong. In Slope Stability Engineering; Routledge: London, UK, 2021; pp. 1303–1307. [Google Scholar]
- Caleca, F.; Tofani, V.; Segoni, S.; Raspini, F.; Franceschini, R.; Rosi, A. How can landslide risk maps be validated? Potential solutions with open-source databases. Front. Earth Sci. 2022, 10, 998885. [Google Scholar] [CrossRef]


| Data | Factors Determined | Resolution | Data Source |
|---|---|---|---|
| DEM | Elevation, aspect, slope, curvature and stream network | 12.5 m | ALOS PALSAR |
| Google Earth Pro Images | Landslide inventory and road network | 2 m | Digital globe |
| Sentinel-2 | Land cover | 10 m | ESA (European Space Agency) |
| Average annual rainfall Precipitation | Precipitation map | 10 km | (NASA) National Aeronautics and Space Administration |
| GIS base Map | Building footprints | 2 m | Digital globe |
| Typology Parameters | Assigned Weights |
|---|---|
| Physical Condition | |
| No Structural Damage | 0.15 |
| Minor Cracks in the Walls | 0.35 |
| Major Cracks in the Walls/Roofs | 0.5 |
| Building Age (Years) | |
| = <10 | 0.1 |
| 11–20 | 0.15 |
| 21–30 | 0.2 |
| 31–40 | 0.25 |
| >40 | 0.3 |
| Wall Material | |
| Dry Stone Masonry | 0.4 |
| Dressed Stone Masonry | 0.2 |
| Cement Block Masonry | 0.3 |
| Reinforced Confined Masonry | 0.1 |
| Roof Material | |
| Horizontal Metal Sheet | 0.4 |
| Pitched Sloping Sheet | 0.3 |
| Wood Planks Covered by Mud | 0.2 |
| Reinforced Concrete Slab | 0.1 |
| Building Use | |
| Educational Institutes | 0.35 |
| Hospitals/Dispensaries/Clinics | 0.25 |
| Residential Houses | 0.2 |
| Shops/Hotels/ offices | 0.13 |
| Houses of Worship | 0.07 |
| Roads | |
| Main Roads | 0.7 |
| Linking Roads | 0.3 |
| Building Typology Data | Number | Percentage |
|---|---|---|
| Educational Institutes | 281 | 1.2 |
| Hospitals/Dispensaries/Clinics | 68 | 0.3 |
| Residential Houses | 20,942 | 89.2 |
| Shops/Hotels/Offices | 1956 | 8.3 |
| Houses of Worships | 209 | 1 |
| Wall Materials | ||
| Dry Stone Masonry | 9645 | 41 |
| Dressed Stone Masonry | 5741 | 24 |
| Cement Block Masonry | 7867 | 34 |
| Reinforced Confined Masonry | 203 | 1 |
| Roof Materials | ||
| Horizontal Metal Sheet | 6310 | 27 |
| Pitched Sloping Sheet | 9437 | 40 |
| Wood Planks Covered by Mud | 5709 | 24 |
| Reinforced Concrete Slab | 2055 | 9 |
| Building Age (Years) | ||
| <10 | 5537 | 24 |
| 11–20 | 3861 | 16 |
| 21–30 | 5931 | 25 |
| 31–40 | 4929 | 21 |
| >40 | 3198 | 14 |
| Physical Condition | ||
| No Structural Damage | 16,996 | 72 |
| Minor Cracks in the Walls | 4383 | 29 |
| Major Cracks in the Walls/Roofs | 2077 | 9 |
| Total | 23,456 | 100 |
Disclaimer/Publisher’s Note: The statements, opinions and data contained in all publications are solely those of the individual author(s) and contributor(s) and not of MDPI and/or the editor(s). MDPI and/or the editor(s) disclaim responsibility for any injury to people or property resulting from any ideas, methods, instructions or products referred to in the content. |
© 2023 by the authors. Licensee MDPI, Basel, Switzerland. This article is an open access article distributed under the terms and conditions of the Creative Commons Attribution (CC BY) license (https://creativecommons.org/licenses/by/4.0/).
Share and Cite
Shah, N.A.; Shafique, M.; Ishfaq, M.; Faisal, K.; Van der Meijde, M. Integrated Approach for Landslide Risk Assessment Using Geoinformation Tools and Field Data in Hindukush Mountain Ranges, Northern Pakistan. Sustainability 2023, 15, 3102. https://doi.org/10.3390/su15043102
Shah NA, Shafique M, Ishfaq M, Faisal K, Van der Meijde M. Integrated Approach for Landslide Risk Assessment Using Geoinformation Tools and Field Data in Hindukush Mountain Ranges, Northern Pakistan. Sustainability. 2023; 15(4):3102. https://doi.org/10.3390/su15043102
Chicago/Turabian StyleShah, Nisar Ali, Muhammad Shafique, Muhammad Ishfaq, Kamil Faisal, and Mark Van der Meijde. 2023. "Integrated Approach for Landslide Risk Assessment Using Geoinformation Tools and Field Data in Hindukush Mountain Ranges, Northern Pakistan" Sustainability 15, no. 4: 3102. https://doi.org/10.3390/su15043102