Article

Temperature and Thermal Stress Analysis of a Hot Blast Stove with an Internal Combustion Chamber

1
Department of Mechanical Engineering, Sogang University, Seoul 04107, Republic of Korea
2
Energy Research Group, Research Institute of Industrial Science and Engineering (RIST), Pohang 37673, Republic of Korea
*
Author to whom correspondence should be addressed.
Processes 2023, 11(3), 707; https://doi.org/10.3390/pr11030707
Submission received: 1 February 2023 / Revised: 18 February 2023 / Accepted: 23 February 2023 / Published: 27 February 2023
(This article belongs to the Special Issue Process Analysis and Simulation in Extractive Metallurgy)

Abstract

:
In this study, the temperature and thermal stress fields of an internal combustion hot blast stove were calculated and analysed. Turbulent, species transport, chemical reaction, radiation, and porous media models were implemented in a computational fluid dynamics model. Thermal boundary conditions on the structure of the hot blast stove were calculated based on the analytic adiabatic Y-plus method. A method to interpolate the thermal boundary conditions to a finite element mesh was developed, and the boundary conditions were mapped through the proposed method. In the on-gas period, the vortex was generated in the dome, and it made the variation of the temperature field in the checker chamber. The maximum temperature of the flue gas reached 1841 K in the on-gas period. In the on-blast period, the flow was considerably even compared to the on-gas period, and the average blast temperature reached 1345 K. The outer region of the checker chamber is shown to be continuously exposed to a higher temperature, which makes the region the main domain in managing the deterioration of the refractory linings. The shell temperature did not change during the operation due to the lower thermal diffusivity of the refractory linings, where the inner surface of the refractory had a maximum temperature change from 1441 K to 1659 K. The maximum temperature of the shell was 418.4 K at the conical region of the checker chamber side. The conical region had the higher maximum and middle principal thermal stresses due to the presence of a large temperature gradient around the conical region, where the largest maximum and middle principal stresses were 300.6 MPa and 192.0 MPa, respectively. The conical region was found to be a significant area of interest where it had a higher temperature and thermal stress.

1. Introduction

A hot blast stove, a facility that blows preheated air into a blast furnace, has a vital role in the ironmaking process. The types of hot blast stoves are separated as internal, external, and top combustion types in accordance with a location and shape of a combustion chamber. The internal combustion type has combustion and checker chambers separated by a partition wall in a single tower. The external type has combustion and checker chambers in each separated tower connected from their top. The top combustion type has the combustion and checker chambers in a single tower, but the combustion chamber locates in the dome. The operating cycle of the hot blast stove consists of on-gas and on-blast periods. In the on-gas period, fuel and air come into a burner and combust, and the generated flue gas is blown to the checker chamber to store the heat in the checker bricks. In the on-blast period, a cold blast is blown to the checker chamber, absorbs heat from the checker bricks, and passes to the blast furnace through the hot blast outlet. Due to this long-term periodic operation, the thermal gradient and stress are generated on the hot blast stove. In addition, the thermal stress causes stress corrosion cracking along with the corrosive atmosphere created by the flue gas. The stress corrosion cracking can be evaluated using non-destructive testing methods such as radiographic or ultrasonic tests [1]. However, it is impractical to inspect all regions since the scale of the hot blast stove is enormous. In this circumstance, it is crucial to limit the area to inspect by analysing which part would have the higher temperature and the higher tensile principal stress. In addition, the thermal stress analysis is important because there are reports of explosions due to the stress corrosion cracking in the hot blast stove applications [2,3].
The performance, fluid flow, and temperature of the hot blast stove have been studied in numerous studies. Zhang et al. [4] analysed the combustion, gas flow, and heat transfer processes for the huge-sized dome combustion hot blast stove, which was designed to have a blast temperature of 1300 °C. The process flow and layout were optimised through the numerical simulations, and the average blast temperature reached 1300 °C with single blast furnace gas (BFG) thanks to the developed numerical model. Rieger et al. [5] successfully modelled the fuelling and combustion process of blast furnace gas with the eddy dissipation concept model considering the reaction mechanism of CH4/air consisting of 41 elementary reactions. They found that the peak temperature within the dome was an important process control parameter to reduce pollutant formation. Guo et al. [6] studied the effect of the number of burner nozzles on the flow and temperature fields in the combustion chamber. It is shown that an adequate number of nozzles in the combustion chamber will give the best performance from their study. Qi et al. [7] utilised a 3D numerical model to optimise the structure of the annual cavity ring of the top combustion hot blast stove. The proposed structural design reduced an asymmetric swirling flow. It increased the resultant highest temperature by around 40 K. Zetterholm et al. [8] proposed a dynamic model for the hot blast stove operation and the concept of stove oxygen enrichment with flue gas recirculation (SOE-FGR) that operates the blast stove without any coke oven gas (COG). The dynamic model analysed the proposed concept, and the concept was shown to increase the blast temperature while improving the efficiency of the entire process. Zhang et al. [9] developed a 3D numerical model to simulate the fluid flow of the top combustion hot blast stove. The design of the neck was modified to resolve the attachment phenomenon of the fluid that occurred in the stove, and the effectiveness of the modified design was verified via numerical simulations.
The stress analysis is also one of the issues in the hot blast stove studies. Yan and Cheng [10] analysed the stress of the top combustion hot blast stove shell. Their numerical model assumed that the fluid’s pressure and the refractory lining’s thermal expansion are constant, making the analysis imprecise. Hwang and Lee [11] studied about temperature and thermal stress of the refractories of the external combustion hot blast stove. They computed thermal stress considering the mortar filled between the refractories and studied the change in the thermal stress according to the number of linings and the existence of the mortar. Gan et al. [12] analysed the temperature and thermal stress of the refractories and the shell of the external combustion hot blast stove. A 3D model was developed to calculate the temperature and velocity fields during the operation. Their model assumes that the surface temperature of the hot blast stove structure and the adjacent fluid temperature are identical.
The hot blast stove can be categorised as an industrial pressure vessel [13]. Understanding the impact of thermal stresses on pressure vessels is crucial, as it is closely linked to hot blast stoves. Several studies have used finite element analysis (FEA) to investigate thermal stresses in pressure vessels, focusing on various factors such as vessel material, geometry, and operating conditions. Rajić et al. [14] conducted a study to optimise a hot water fire-tube boiler using finite element analyses. The kriging response surface was constructed to determine the correlation between the stresses of the tube plate and its thickness. The thickness of the tube was found to be the most critical for the optimisation. Jaremkiewicz et al. [15] proposed a new design thermometer to measure transient fluid temperatures in thick-walled pressure vessels and a method to predict thermal stresses with a finite element model. The proposed design was able to measure the transient fluid temperature with adequate accuracy and be adapted to a wide range of objects. They showed that temperature measurement accuracy was crucial for stress calculations, especially for rapid temperature changes. Taler et al. [16] presented two methods for monitoring thermal stresses in thick-walled pressure components of steam boilers. The first method involves the inverse heat conduction problem to determine the inner surface temperature from the measured outer insulated surface temperature. It does not need the temperature of the fluid and the heat transfer coefficient. The second method uses a numerical-experimental method to determine the transient heat transfer coefficient with the 3D-inverse heat conduction problem. The methods were applied to the thick-walled horizontal steam header to validate the proposed methods. Hoseinzadeh and Heyns [17] analysed the thermo-structural fatigue lifetime of a heat exchange based on CFD and FEA with ASME VIII Boiler and Pressure Vessel Code. They showed that the tubes connected to the tube sheet were the critical points that have the shortest lifetime. The equivalent thermal stress was determined, and its corresponding lifetime was evaluated for each loading condition. Rajić et al. [18] presented experimental and numerical analyses of stress and strain of boiler tube plate. The numerical results were verified with the strain measurement by 3D digital image correlation, not only with the conventional strain measurement using strain gauges. Yıldırım et al. [19] presented a nonlinear model to calculate the thermal stress of functionally graded spherical pressure vessels. The Halpin–Tsai homogenisation scheme was adopted in their study to describe temperature-dependent material properties of the graded material. They combined Pseduspectral Chebyshev Method and the fixed-point method to analyse the thermal stress, and the result was compared and verified with a commercial finite element program. Jeong et al. [20] proposed simple prediction equations of the stress intensity factor via the thermal load under cool-down and heat-up conditions for reactor pressure vessels. They conducted 360 cases of finite element analyses for the different nozzle shapes and heating/cooling conditions. The stress intensity factor solutions were obtained using curve fitting of the finite element analyses solutions. The proposed equations showed good agreement with the finite element analysis solutions.
The thermal stress analysis has yet to be conducted for internal combustion hot blast stoves, while the thermal stresses of the dome and external combustion hot blast stoves have been studied. In addition, the studies on the fluid flow and temperature analyses mainly focused on the dome and external combustion hot blast stoves. In this study, to investigate the areas of interest for managing refractory linings and the shell, a numerical model was established to analyse the flow phenomenon, structure temperature, and thermal stress during an internal combustion hot blast stove operation. The fluid flow was analysed by means of the computational fluid dynamics (CFD) simulation. Turbulent, species transport, chemical reaction, radiation, and porous media models were implemented in the CFD model. Thermal boundary conditions on the structure of the hot blast stove were calculated with the CFD result based on the analytic adiabatic Y-plus method [21]. Calculated thermal boundary conditions were mapped through the developed mapping method, which can interpolate the value at a cell centre of the CFD grid to a finite element analysis (FEA) mesh node. Structure temperature and thermal stress were calculated by the finite element method (FEM). The flow characteristics and regions with high thermal stresses were investigated based on the numerical result. The significant areas of interest for refractory linings and the shell were pointed out from the investigations of the numerical result.

2. Numerical Modelling

The internal combustion hot blast stove has combustion and checker chambers and a dome, as shown in Figure 1a. The conical region is a part that has a conical shape that connects the dome and the tower. The hot blast stove has refractory linings, and it is encased in a metal shell. In the on-gas period, the air and fuel gases come through the air and gas inlets which are in the bottom of the combustion chamber, and the combusted hot flue gas store its heat into the checker bricks and goes out through the flue gas outlet, as shown in Figure 1b. In the on-blast period, cold air comes through the cold air inlet, which is the same as the flue gas outlet in the on-gas period, and the hot blast is generated by the cold air absorbing the heat from the checker bricks and goes out through the hot blast outlet, as shown in Figure 1c. The hot blast stove is heated due to the flue gas and the hot blast during the operation, which generates thermal stress on the shell.
A numerical model was developed to analyse the flow phenomenon, temperature, and thermal stress fields of the hot blast stove during the operation. The 3D fluid flow and temperature in the hot blast stove were analysed with the commercial software Ansys Fluent. The thermal boundary conditions on the structure are calculated based on the CFD results and mapped to the FEA mesh. The temperature and thermal stress fields of the structure were analysed by the finite element method with the commercial software Abaqus.

2.1. CFD Analysis of a Hot Blast Stove

2.1.1. Fluid Flow Model

In the fluid flow in the hot blast stove, the following assumptions are established: (a) the fluid is Newtonian fluid, and (b) it follows an incompressible ideal gas law, and (c) turbulent flow regime. The incompressible ideal gas model is known to be valid with a Mach number less than 0.3 [22]. Since the flow in the hot blast stove adopted in this study did not have a Mach number greater than 0.3, the incompressible ideal gas model was implemented, while a fully compressible model requires high computational cost. In addition, it has been implemented for various studies on the flow that involves a combustion process [23,24,25]. With the assumptions, the continuity, linear momentum, and energy equations are described as follows:
ρ t + ρ u i x i = 0
( ρ u i ) t + ( ρ u i u j ) x j = p x i + x j μ u i x j + u j x i ρ u i u j ¯ + ρ g i
( ρ c p T ) t + ( ρ c p u i T ) x i = x i λ T x i ρ c p u i T ¯
where t is time, ρ is the fluid density, u i is the velocity component, x i is the Cartesian coordinate component, p is the pressure, μ is the dynamic viscosity, g i is the gravity component, T is the fluid temperature, c p is the fluid specific capacity, and λ is the fluid thermal conductivity. The standard k- ε model was adopted to simulate the turbulent flow of the hot blast stove. Since the hot blast stove has no recirculation or swirling flows, the standard k- ε model was regarded as appropriate for turbulence modelling. It has been implemented in numerous similar applications [5,12,26,27]. The transport equations to compute the turbulent kinetic energy k and the turbulent kinetic energy dissipation ε are described as follows [28]:
( ρ k ) t + ( ρ k u i ) x i = x i μ + μ t σ k k x i + G k + G b ρ ε
( ρ ε ) t + ( ρ ε u i ) x i = x i μ + μ t σ ε ε x i + C 1 ε ε k ( G k + C 3 ε G b ) C 2 ε ρ ε 2 k
where C 1 ε , C 2 ε , and C 3 ε are the model constants. σ k and σ ε are the turbulent Prandtl numbers for k and ε . μ t is the turbulent viscosity, respectively. G k and G b are the generation of turbulent kinetic energy due to the mean velocity and buoyancy, respectively. C 3 ε is the constant that determines the effect of the buoyancy to ε . μ t , G k , G b and C 3 ε are defined as follows:
μ t = ρ C μ k 2 ε G k = ρ u i u j ¯ u j x i G b = g i μ t ρ Pr t ρ x i C 3 ε = tanh u g / u g p
where C μ is the model constant, and Pr t is the turbulent Prandtl number for energy. u g and u g p are the velocity components parallel and perpendicular to the gravitational vector, respectively. The k- ε model parameters were specified as follows: C 1 ε = 1.44 , C 2 ε = 1.92 , C μ = 0.09 , σ k = 1.0 , Pr t = 0.85 .

2.1.2. Species Transport and Chemical Reaction Models

The species transport model was adopted to analyse the mixing characteristics of the fuel gas and air. The local mass fraction of the species i, Y i , is computed by solving the following convection–diffusion equation [29]:
( ρ Y i ) t + · ρ u Y i = · J i + R i
where u is the velocity vector, J i is the diffusion flux, and R i is the net rate of production of species i. The diffusion flux is derived due to the gradients of concentration and temperature, and it can be written as Equation (8) using Fick’s law.
J i = ρ D i , m + μ t Sc t Y i D T , i T T
D i , m is the mass diffusion coefficient for species i in the mixture, D T , i is the thermal diffusion coefficient, and Sc t is the turbulent Schmidt number specified as 0.7 in this study.
The eddy-dissipation model [30] was employed to handle the combustion process. The eddy-dissipation model assumes that the combustion is mixing-limited, which means the rate of the chemical reactions is relatively more rapid than the rate of turbulent mixing. R i , r , the net rate of production of species i due to reaction r, is given by the smaller value of the values computed with Equations (9) and (10).
R i , r = v i , r M w , i A ρ ε k min R Y R v R , r M w , R
R i , r = v i , r M w , i A B ρ ε k P Y P j N v j , r M w , j
Y P is the mass fraction of product species P, Y R is the mass fraction of a particular reactant R, M w , i is the molecular weight of species i, v i , r is the stoichiometric coefficient for reactant i, and v i , r is the stoichiometric coefficient for a product i in reaction r. A and B are empirical constants equal to 4.0 and 5.0, respectively. The large eddy mixing time scale k / ε is a dominant factor of the chemical reaction in the model. The combustion occurs when turbulence is present ( k / ε > 0 ), and an ignition source is not required to initiate it.

2.1.3. Radiation Model

Radiation heat transfer has a significant role in heat exchange processes. The radiation was implemented with the discrete ordinates (DO) radiation model. The DO radiation model has been widely used for numerous engineering applications [31]. It provides a good compromise between accuracy and computational cost [32] and is applicable for complicated geometries [33,34]. The radiative transfer Equation (RTE) of the DO model is expressed as follows [35]:
· I ( r , s ) s + ( a + σ s ) I ( r , s ) = a n 2 σ T 4 π + σ s 4 π 0 4 π I ( r , s ) Φ ( s · s ) d Ω
where I is the radiation intensity that depends on the position r and direction s, s is the scattering direction vector, a is the absorption coefficient, n is the refractive index, σ s is the scattering coefficient, Φ is the phase function, Ω is the solid angle, and σ is Stefan-Boltzmann constant.

2.1.4. Porous Media Model

The checker bricks in the checker chamber were considered non-equilibrium porous media to simplify the model, and several studies were conducted based on this assumption [7,9,12]. For single-phase flow through a porous media, the volume-averaged mass and momentum conservation equations are described as follows [36]:
( γ ρ ) t + · ( γ ρ u ) = 0
( γ ρ u i ) t + ( γ ρ u i u j ) x j = ( γ p ) x i + x j γ μ u i x j + u j x i γ ρ u i u j ¯ + γ ρ g i γ 2 μ K + γ 3 C 2 2 ρ u u i
where γ is the porosity, K is the permeability, and C 2 is the inertial resistance factor. The energy equations of the fluid and solids are described as follows:
( γ ρ c p T ) t + γ ρ c p u i T x i = x i γ λ T x i γ ρ c p u i T ¯ + h β ( T s T )
[ ( 1 γ ) ρ s c p , s T s ] t = x i ( 1 γ ) λ s T s x i + h β ( T T s )
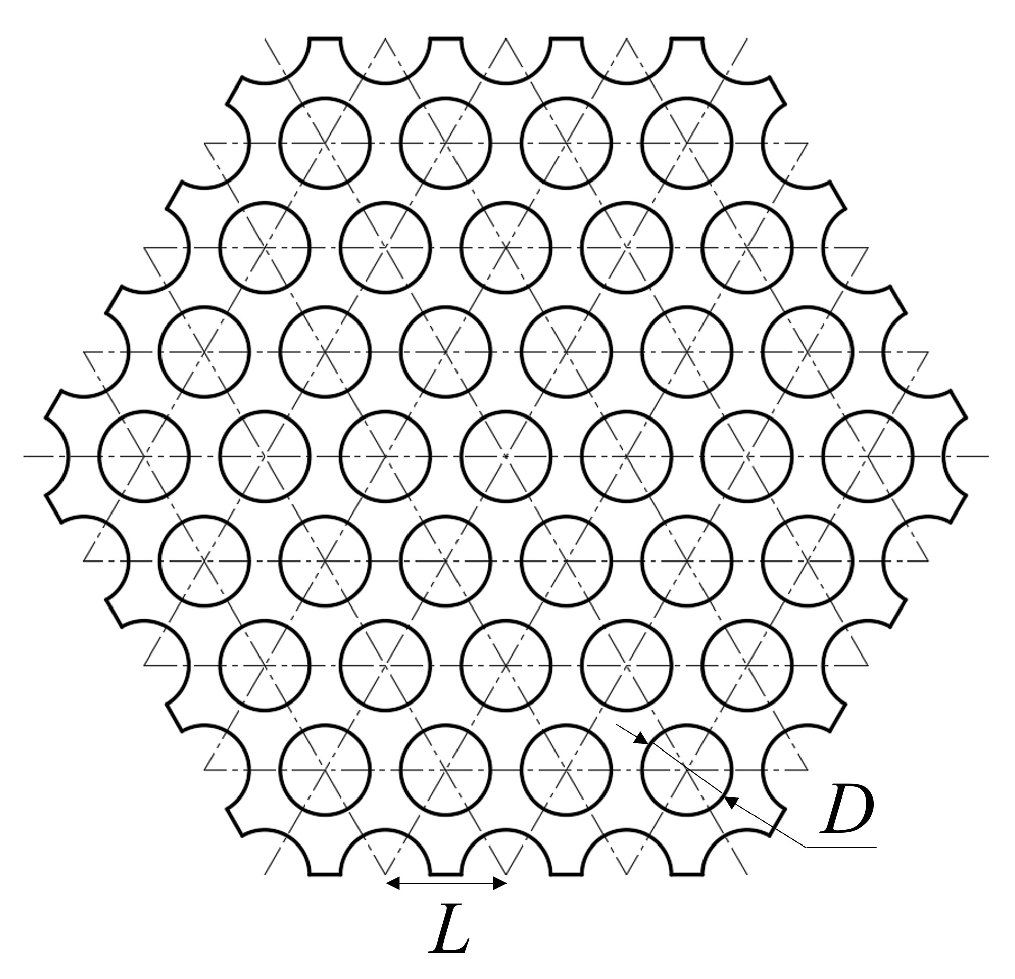
where subscript s denotes the solid, β is the surface area density, and h is the heat transfer coefficient for the interface between the fluid and the solid. The shape of the checker brick used in this study is represented in Figure 2. The hole diameter D is 52 mm, and the distance between the holes L is 78 mm. The porosity and the surface area density were calculated with the following equations.
γ = π 2 3 D 2 L 2 β = 4 γ D
The friction factor f was computed with the following Equation [37]:
f = 64 / Re D Re D 3000 1.8 log 10 ε r / D 3.7 1.11 + 6.9 Re D Re D > 3000
where Re D is the Reynolds number, and ε r is the roughness. The Nusselt number Nu D was calculated with the following Gnielinski correlation [38].
Nu D = 4.36 Re D 3000 ( f / 8 ) ( Re D 1000 ) Pr 1 + 12.7 f / 8 Pr 2 / 3 1 Re D > 3000
where Pr is the Prandtl number. The heat transfer coefficient in Equations (14) and (15) was estimated from the Nusselt number calculated in Equation (18).

2.1.5. Boundary Conditions

The on-gas and on-blast periods times were 80 and 100 min, respectively. In the on-gas period, the fuel gas was supplied with a flow rate of 13.0 × 10 4 Nm3/h at 423 K, and its composition is represented in Table 1. The air was supplied with a flow rate of 9.2 × 10 4 Nm3/h at 383 K. The excess air ratio for the combustion was 1.18. The flue gas outlet was set as a pressure boundary with a gauge pressure of 0 Pa. In the on-blast period, the air was supplied with a flow rate of 36.0 × 10 4 Nm3/h at 473 K. The hot blast outlet was set as a pressure boundary with a gauge pressure of 0 Pa. All surface walls were set as nonslip and adiabatic walls. The material properties of the checker bricks that are represented in Table 2 were calculated based on the rule of mixtures and the properties of each component reported by Carnigila and Barna [39].

2.2. Thermal Boundary Conditions of the Structure

During the operation of the hot blast stove, there is heat transfer on the interface between the surface of the structure and the fluids flowing. The types of this heat transfer are divided into convection and radiation. The heat transfer coefficients for both types of heat transfers were calculated from the CFD analysis result. They were provided to the FEA mesh using the user subroutine FILM in Abaqus.

2.2.1. Convective Heat Transfer

The convective heat transfer on the hot blast stove structure was considered with the analytic adiabatic Y-plus method [21]. The method is applicable to CFD calculations based on adiabatic wall boundary conditions. It is possible to analyse the temperature of the structure with conjugate heat transfer; however, it requires enormous computational efforts since numerous cycles have to be calculated to obtain a periodic steady-state solution. In this study, therefore, the temperature of the structure was calculated in an uncoupled scheme to reduce the computational cost with reasonable precision loss [40].
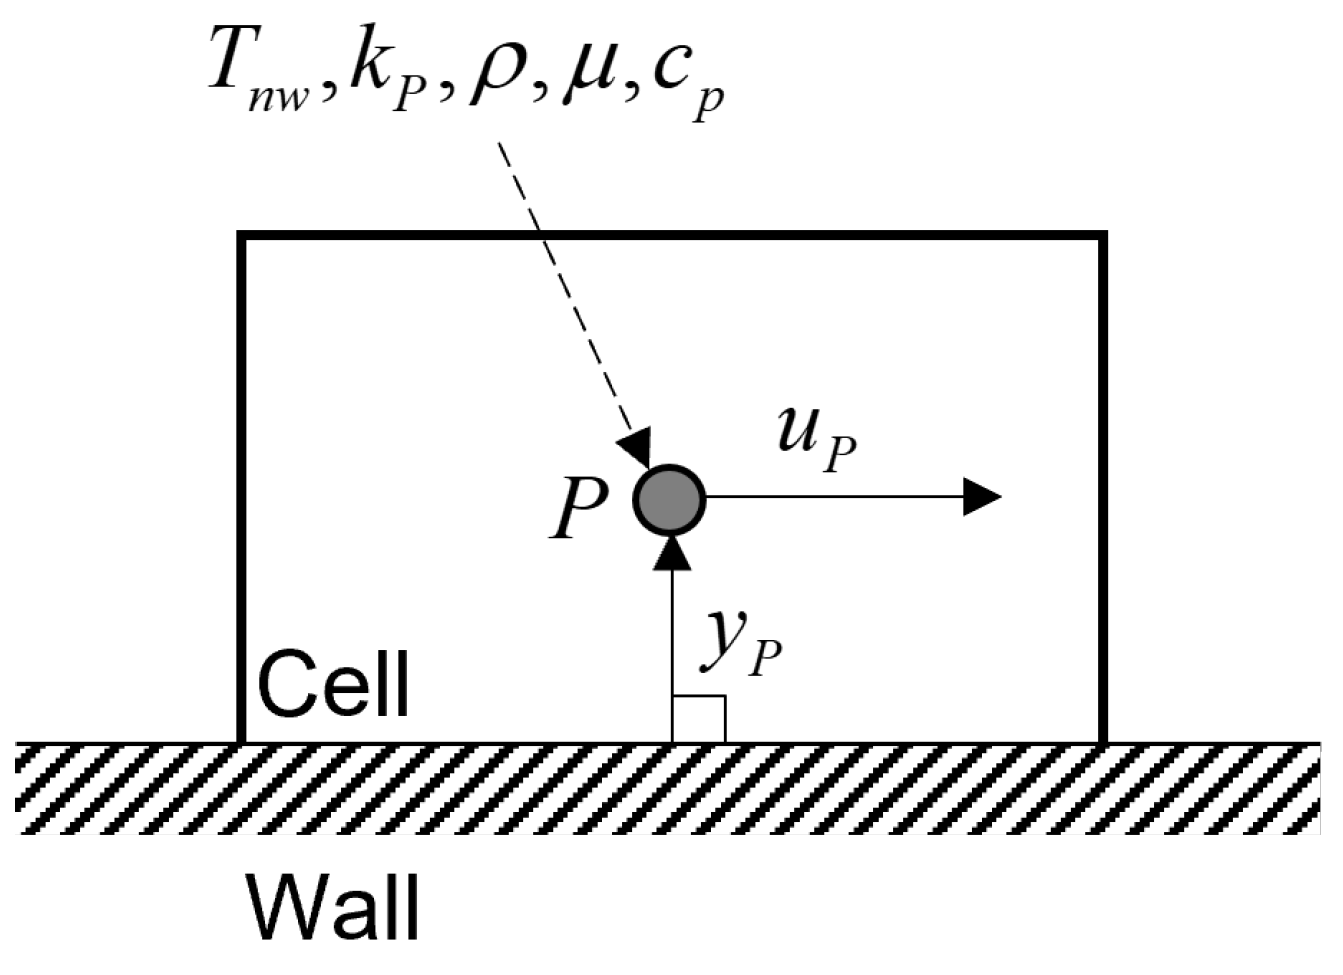
The calculated variables from the CFD were saved into the cell centre, as depicted in Figure 3. The saved variables were the material properties (density, viscosity, and specific heat), the turbulent kinetic energy of the cell centre, the magnitude of the velocity and the fluid temperature. In the standard wall function, the dimensionless cell-wall distance y * and dimensionless velocity u * are calculated as follows, respectively [41].
y * = ρ C μ 1 / 4 k P 1 / 2 y P μ
u * = 1 κ ln E y * y * 11.225 y * y * < 11.225
In Equations (19) and (20), the subscript P denotes the cell centre, y P is the distance between the cell centre and the wall, κ is the von Kármán constant that is defined as 0.4187, and E is the empirical constant that is defined as 9.793. From the dimensionless velocity u * , wall shear stress τ w and friction velocity u τ are calculated by the equations as follows:
τ w = ρ C μ 1 / 4 k P 1 / 2 u P u *
u τ = τ w / ρ
where u P is the magnitude of the velocity of the cell centre, which is perpendicular to the normal direction of the wall. From Kader [42], the temperature profile T + in the fully turbulent boundary layer is expressed as a function of the Prandtl number and dimensionless cell-wall distance of the fully turbulent boundary layer y + , which is defined as Equation (23).
y + = ρ u τ y P μ
The coefficients β and Γ that are required to calculate T + are defined as Equation (24) and Equation (25), respectively [42].
β = ( 3.85 Pr 1 / 3 1.3 ) 2 + 2.12 ln Pr
Γ = 10 2 Pr y + 4 1 + 5 Pr 3 y +
T + is calculated as Equation (26) [42].
T + y + , Pr = Pr y + + e Γ + 2.12 ln y + + β e 1 / Γ
The convective heat transfer coefficient h conv is defined as Equation (27), and the convective heat flux q ˙ conv is calculated as Equation (28), where T n w is the fluid temperature of the wall adjacent cell, and T w is the wall temperature [40].
h conv = ρ c p u τ T +
q ˙ conv = h conv ( T n w T w )

2.2.2. Radiation Heat Transfer

The heat flux between the surface of the structure and the fluid due to radiation q ˙ rad is calculated by Equation (29) as follows:
q ˙ rad = σ ε T n w 4 α T w 4 T n w T w
where α is the absorptivity of the grey gas. According to Kirchhoff’s law [43], the emissivity and absorptivity are equal for the opaque surface. Assuming that the surfaces of the refractory linings are opaque, the heat transfer coefficient due to radiation h rad can be written as Equation (30).
h rad = σ ε T n w 4 T w 4 T n w T w
The emissivity of H2O-CO2mix gas is calculated using the weighted sum of grey gases model (WSGGM) proposed by Bordbar et al. [44]. The total heat flux q ˙ on the wall is calculated as Equation (31).
q ˙ = ( h conv + h rad ) ( T n w T w )
In the user subroutine FILM, the total heat transfer coefficient h conv + h rad and T nw were provided as the heat transfer coefficient and the sink temperature, respectively.

2.3. Mapping of the Thermal Boundary Conditions

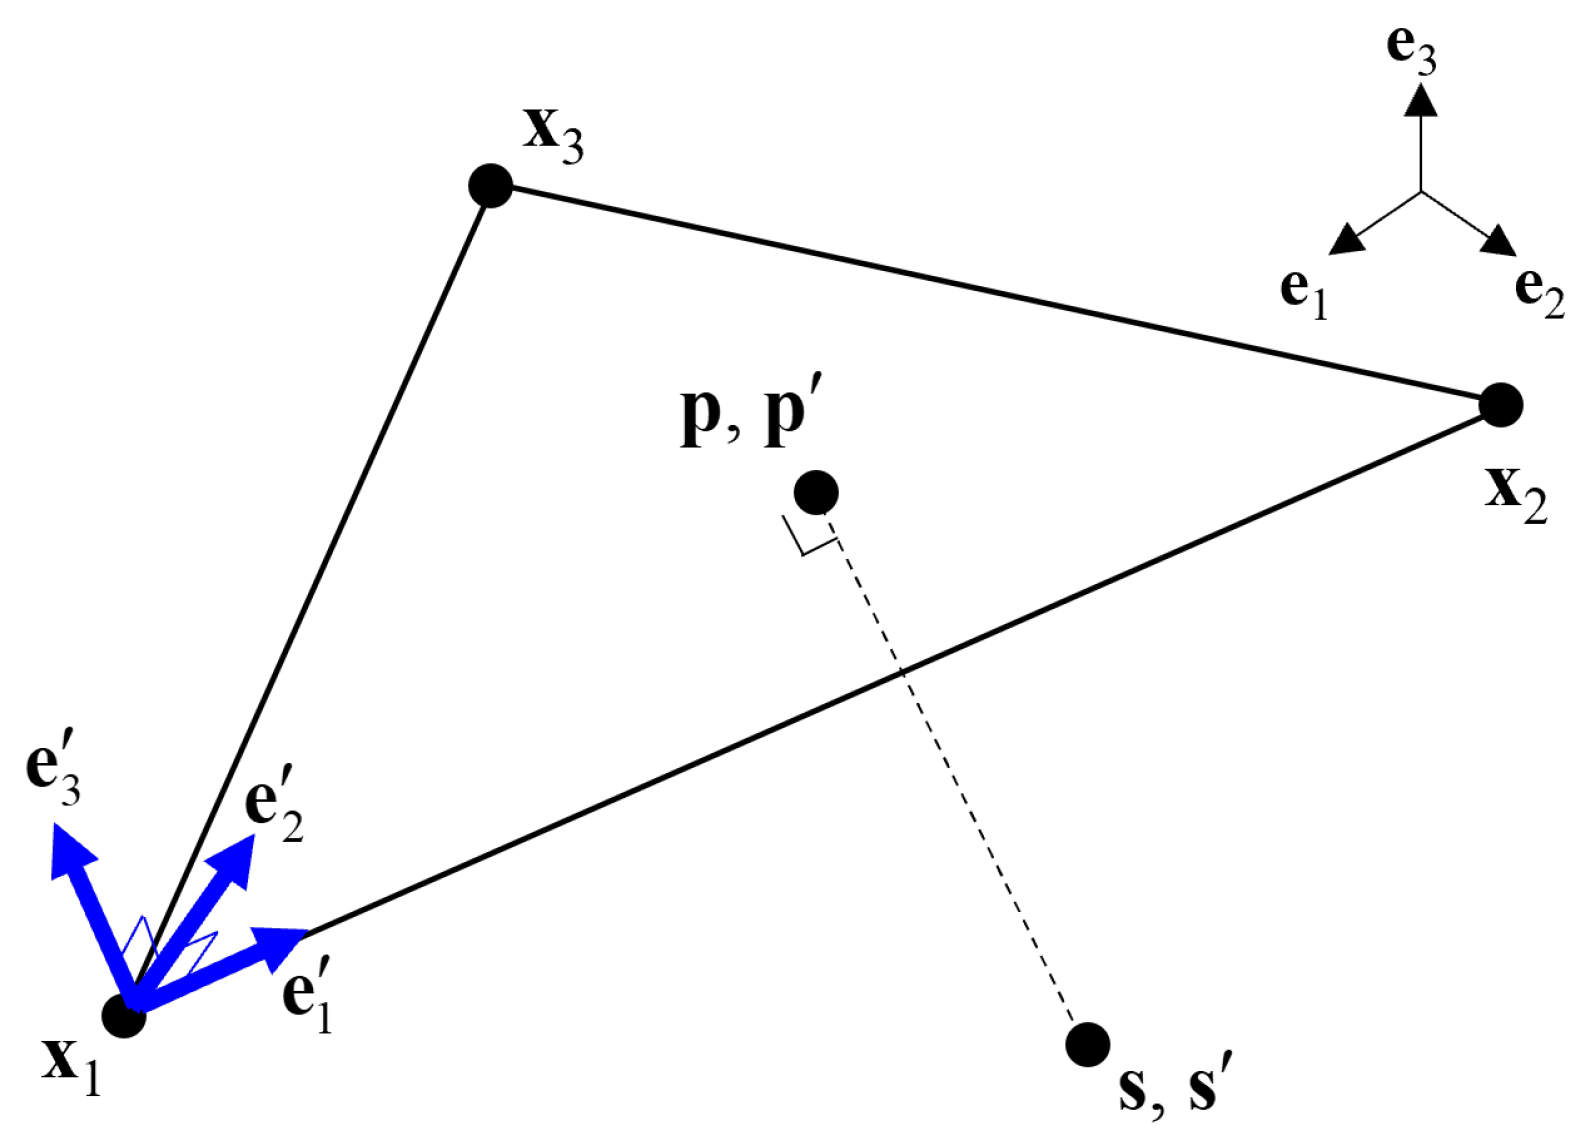
When the nodal positions of meshes used in CFD and FEA are different from each other, the CFD analysis results should be appropriately interpolated and mapped to the FEA mesh. As shown in Figure 4, consider the nodal position s of the mesh to be mapped and the three wall-adjacent cell centres x 1 , x 2 , and x 3 from the CFD mesh, which are closest from s. The selected cell centres form a plane. Let p is the projection of s onto the plane. All the coordinates of the points are represented in the global coordinate system ( e 1 , e 2 , e 3 ). A new coordinate system ( e 1 , e 2 , e 3 ) can be defined as Equation (32) using e 1 , which has the same direction as x 2 x 1 and the normal of plane e 3 .
e 1 = ( x 2 x 1 ) / x 2 x 1 e 3 = e 1 × ( x 3 x 1 ) / e 1 × ( x 3 x 1 ) e 2 = e 3 × e 1
In the new coordinate system, p s has the same direction as e 3 . Translating all the points so that x 1 becomes the origin and transforming the coordinate system to the new one, the third-axis coordinates of the cell centres become 0. Setting p = p 1 , p 2 , 0 T = s 1 , s 2 , 0 T , the transformed coordinates of x i as x i = x i , y i , 0 T , and a scalar to interpolate in i-th cell centre as ϕ i , the interpolated scalar value ϕ on p can be calculated using the interpolation function of a linear triangular element in finite element analysis as Equation (33).
ϕ p 1 , p 2 = 1 J x 2 y 3 x 3 y 2 + ( y 2 y 3 ) p 1 + ( x 3 x 2 ) p 2 ϕ 1 + x 3 y 1 x 1 y 3 + ( y 3 y 1 ) p 1 + ( x 1 x 3 ) p 2 ϕ 2 + x 1 y 2 x 2 y 1 + ( y 1 y 2 ) p 1 + ( x 2 x 1 ) p 2 ϕ 3
In Equation (33), J = x 2 y 3 x 3 y 2 + x 3 y 1 x 1 y 3 + x 1 y 2 x 2 y 1 . In this study, the interpolated values at p were used to give the thermal boundary condition on s.

2.4. Material Properties of the Refractory Linings and Shell

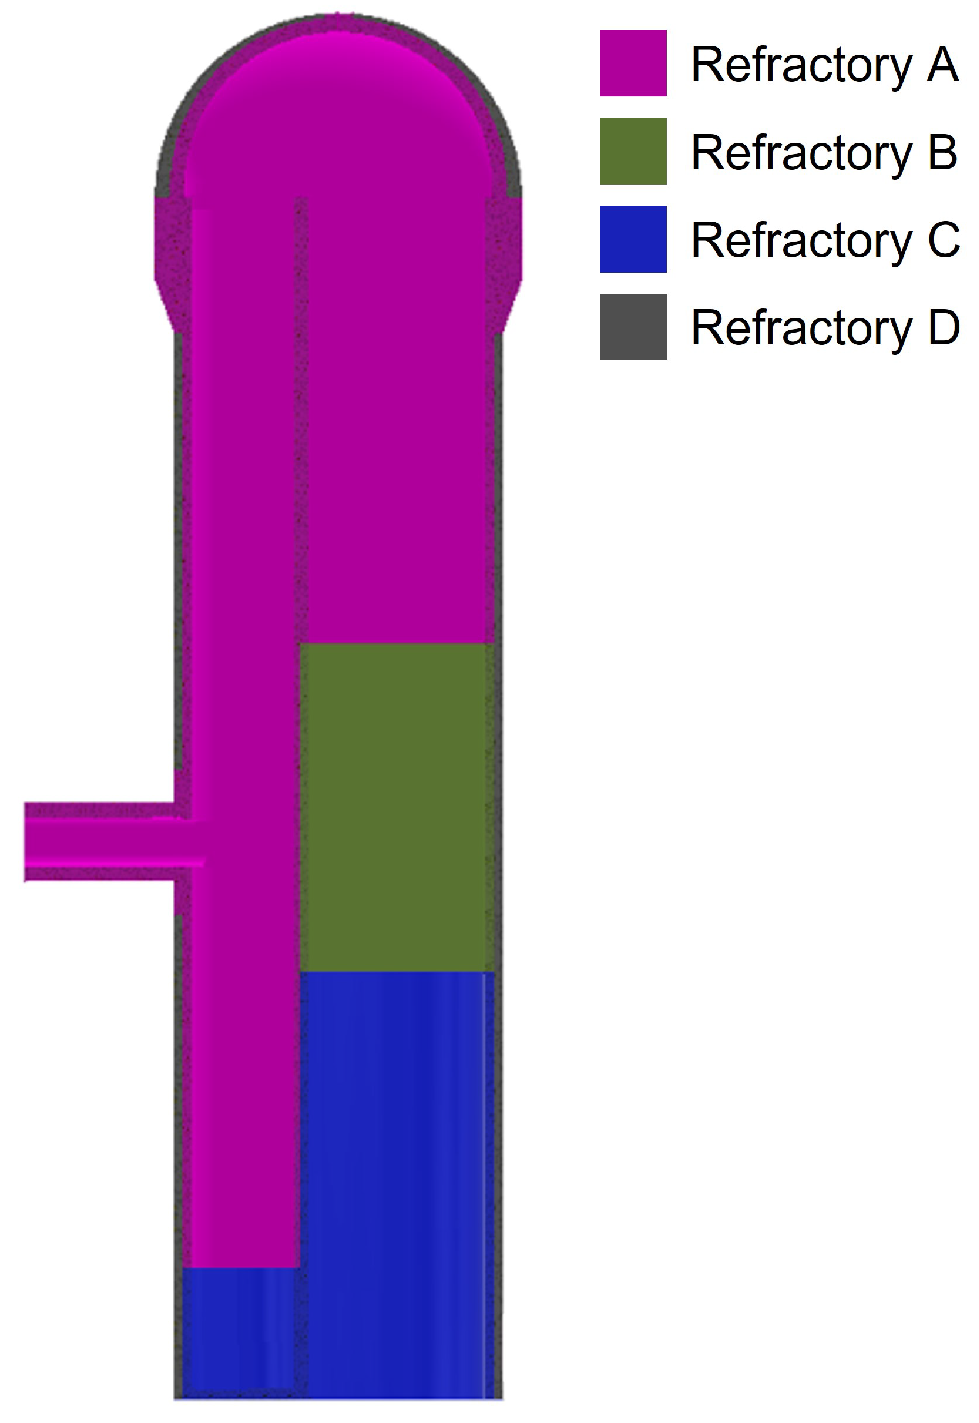
The types and applied areas of the refractory linings are described in Figure 5. The apparent density, thermal conductivity, and thermal expansion coefficient of each refractory are given in Table 3. The specific heat capacity of the alumina checker brick was used for Refractories A, B and C. For Refractory D, the specific heat capacity of fireclay checker brick was applied. The elastic modulus and Poisson’s ratio of the refractories were set as 4 GPa and 0.15 [45], respectively. The material properties of the refractories were found in the sources [39,45,46] and the catalogues from Chosun Refractories. The shell material was AISI 420 stainless steel with a thickness of 30 mm. Its material properties were obtained from Simufact MatILDa.

2.5. Computational Conditions

In CFD analysis, cyclic analyses were conducted to obtain a periodic steady-state solution for the operation of the hot blast stove. In the cyclic analyses, the state at the end of the on-blast period analysis was used as the initial condition in the on-gas period. The time step was set as 5 s. The velocity and energy were set to be converged if their absolute residuals became less than 10 3 and 10 5 , respectively. The periodic steady state was considered to be achieved when the temperature between the cycles became less than 1%.
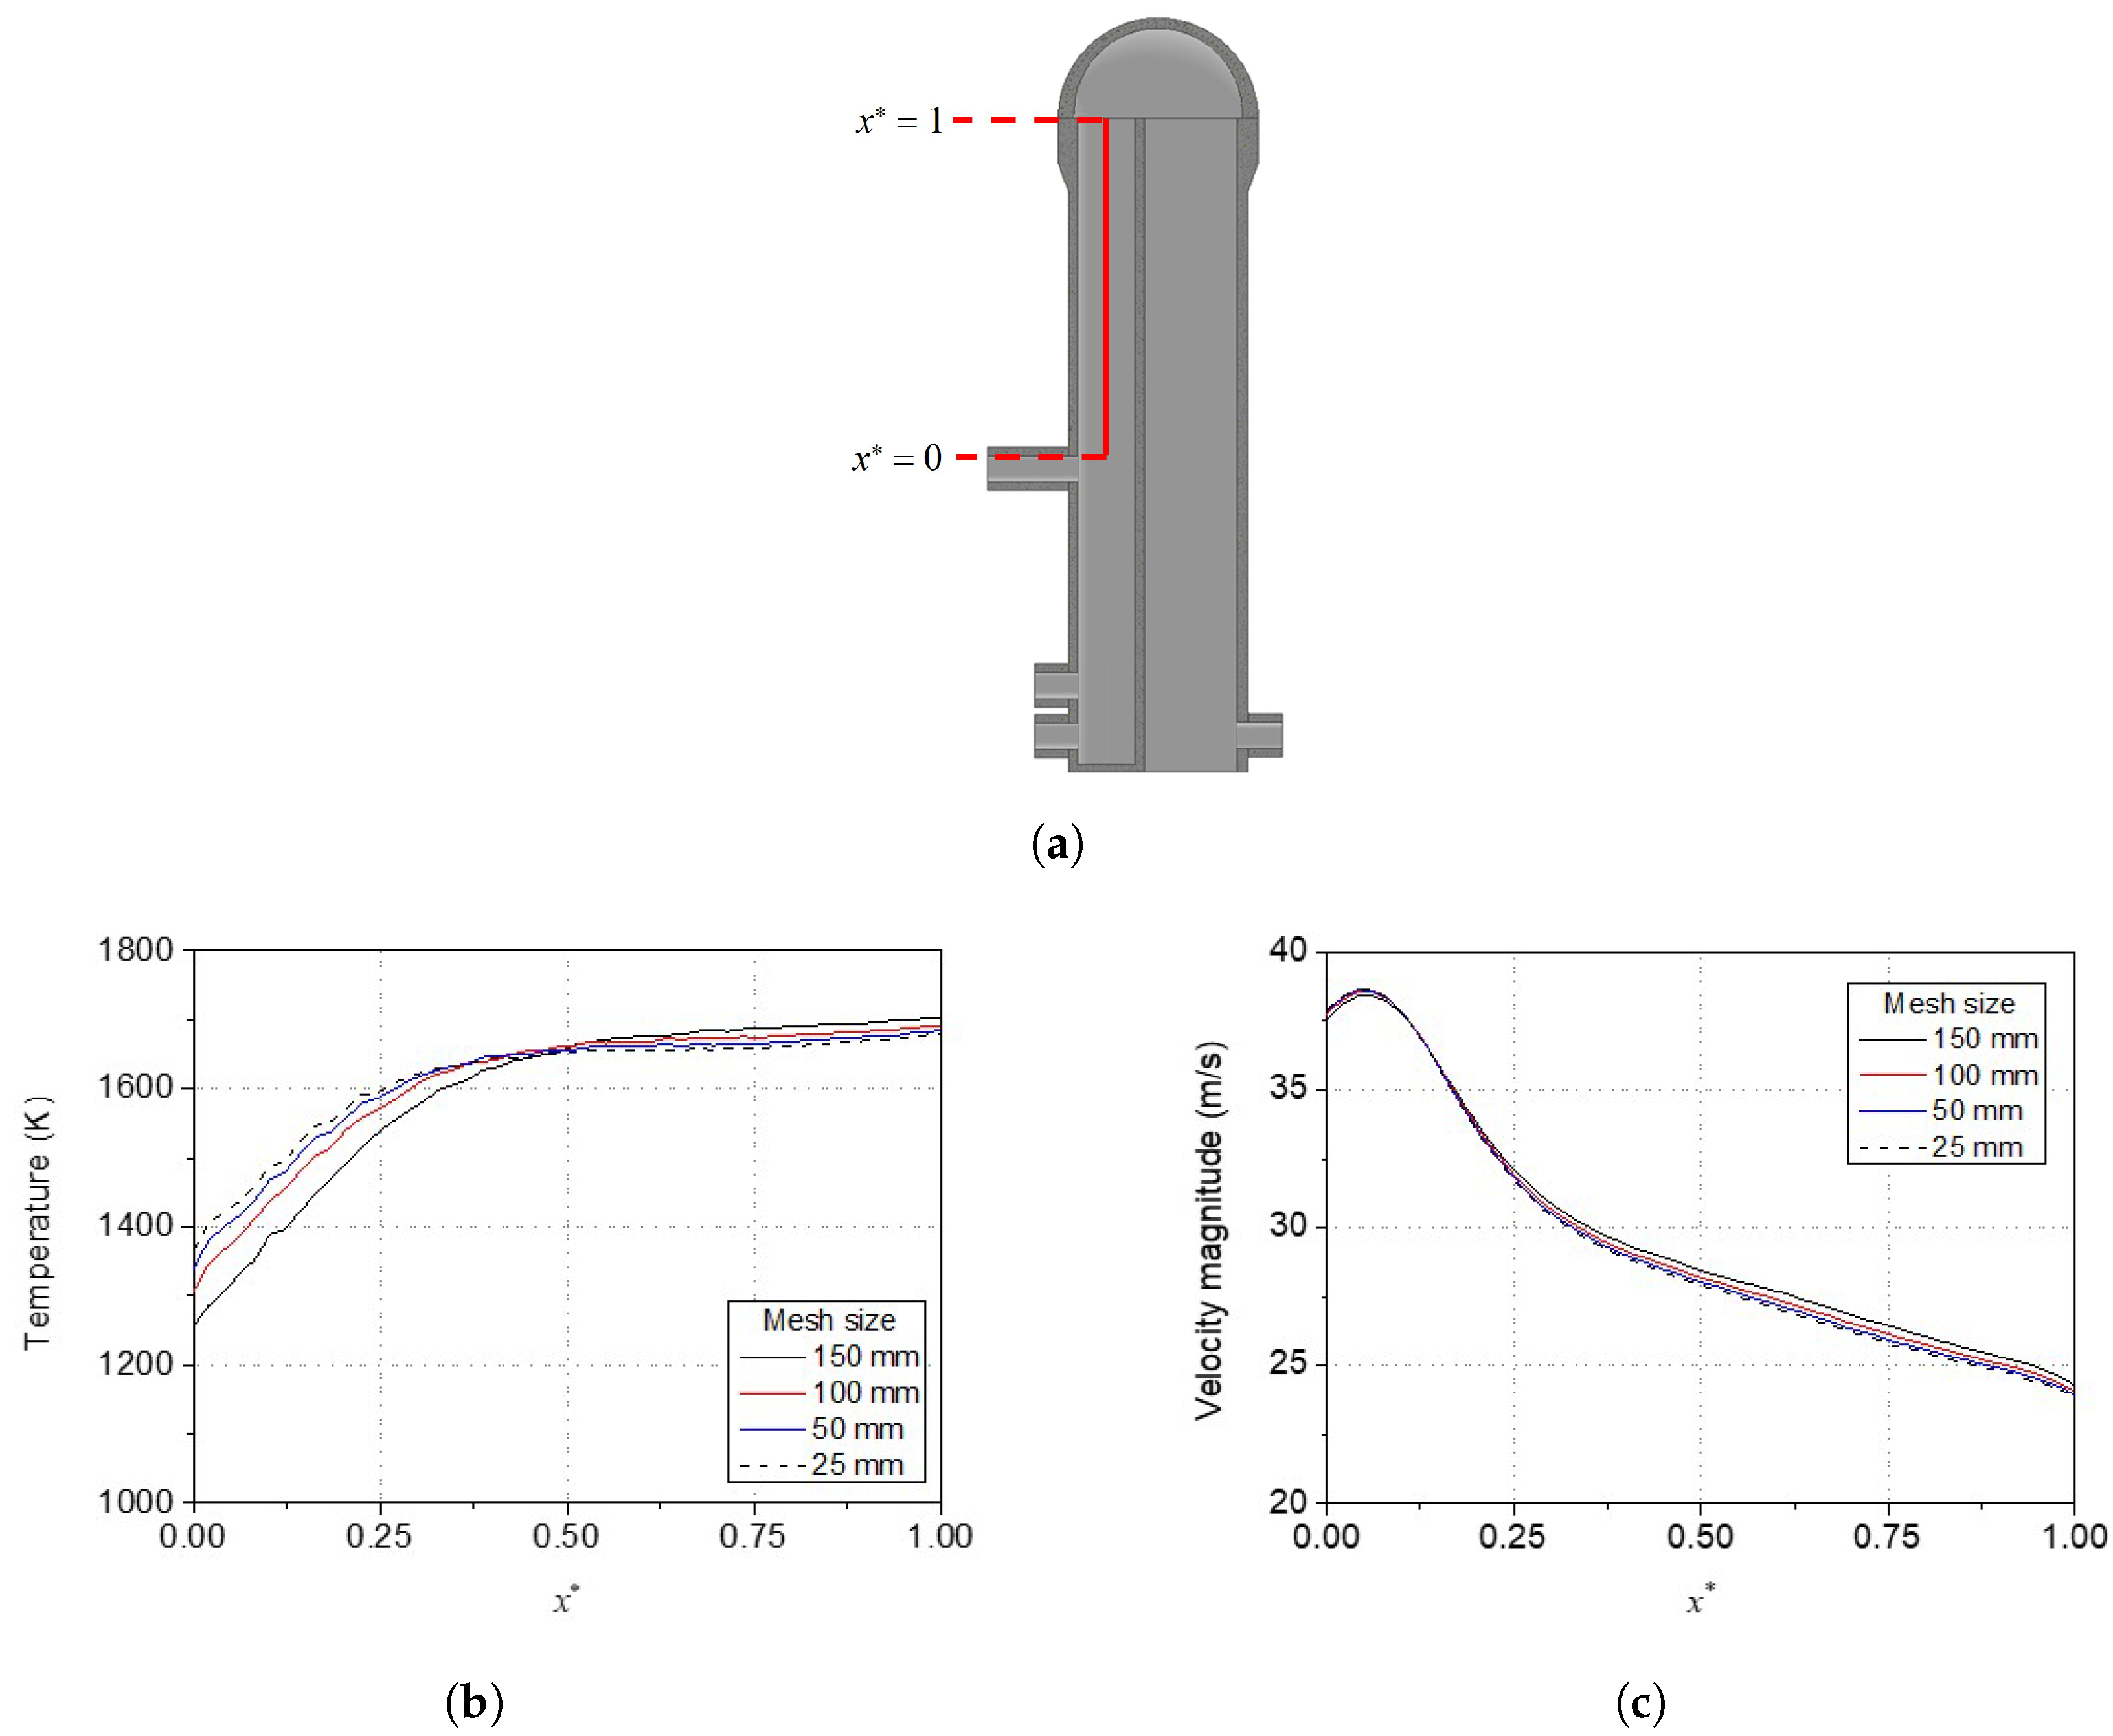
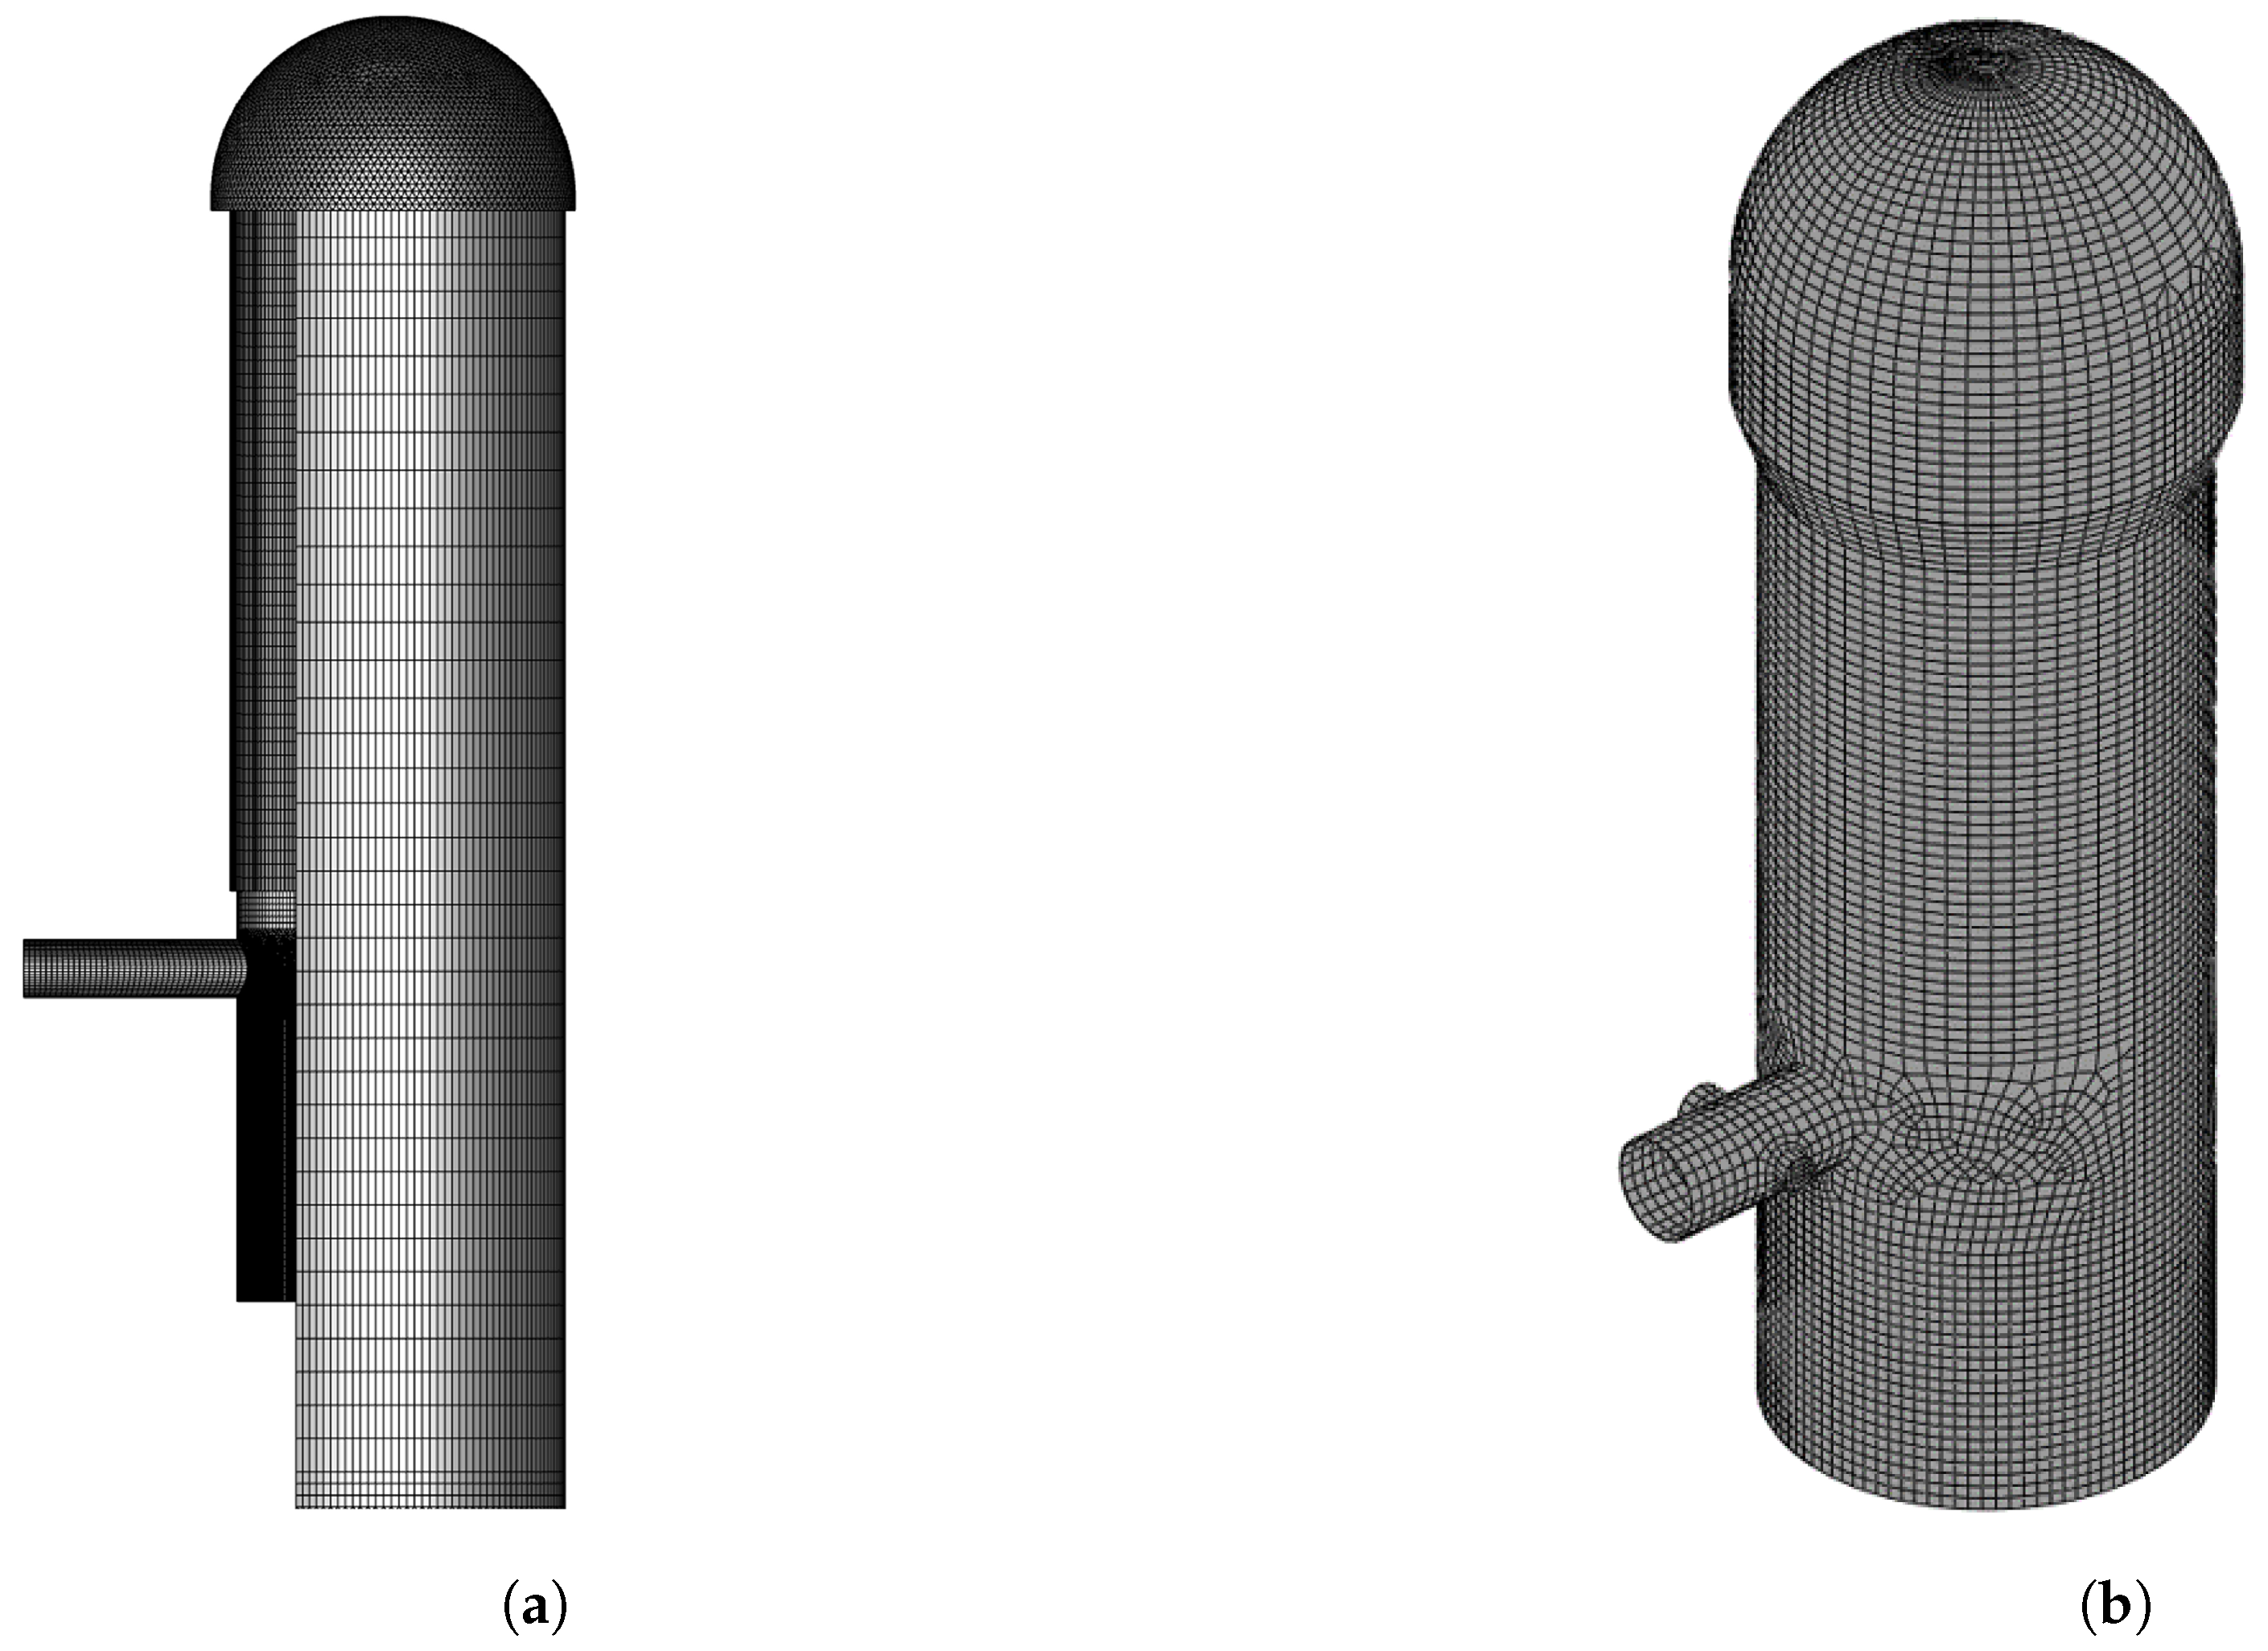
A grid dependence test was conducted to determine the adequate mesh size for the CFD analysis. Temperature and velocity magnitudes in the middle of the on-gas period were compared with different mesh sizes. Temperature and velocity magnitudes were extracted from the centre of the combustion chamber, as shown in Figure 6a where x * denotes the normalised height. The grid dependence was tested for the mesh sizes of 150 mm, 100 mm, 50 mm and 25 mm. Figure 6b,c show the temperature and velocity profiles of the tested mesh sizes. The temperature and velocity magnitude profiles with the 50 mm mesh size had 0.55% and 0.35% average differences from the 25 mm mesh size, respectively. Considering the accuracy and computational burden, the 25 mm mesh size was selected to generate the mesh for the CFD analysis. The mesh for the CFD analysis was generated with 2,874,424 cells, as shown in Figure 7a.
The finite element analyses were conducted after the CFD analysis achieved its periodic steady-state solution. The thermal boundary conditions were calculated based on the periodic steady-state solution. Structural temperature analyses were conducted to obtain the periodic steady-state solution. The same criterion is used in the structural temperature analysis to decide whether the solution reaches the periodic steady-state solution. The generated FEA mesh has 737,865 elements for the refractory linings and 368,237 elements for the shell, as shown in Figure 7b.

3. Results and Discussion

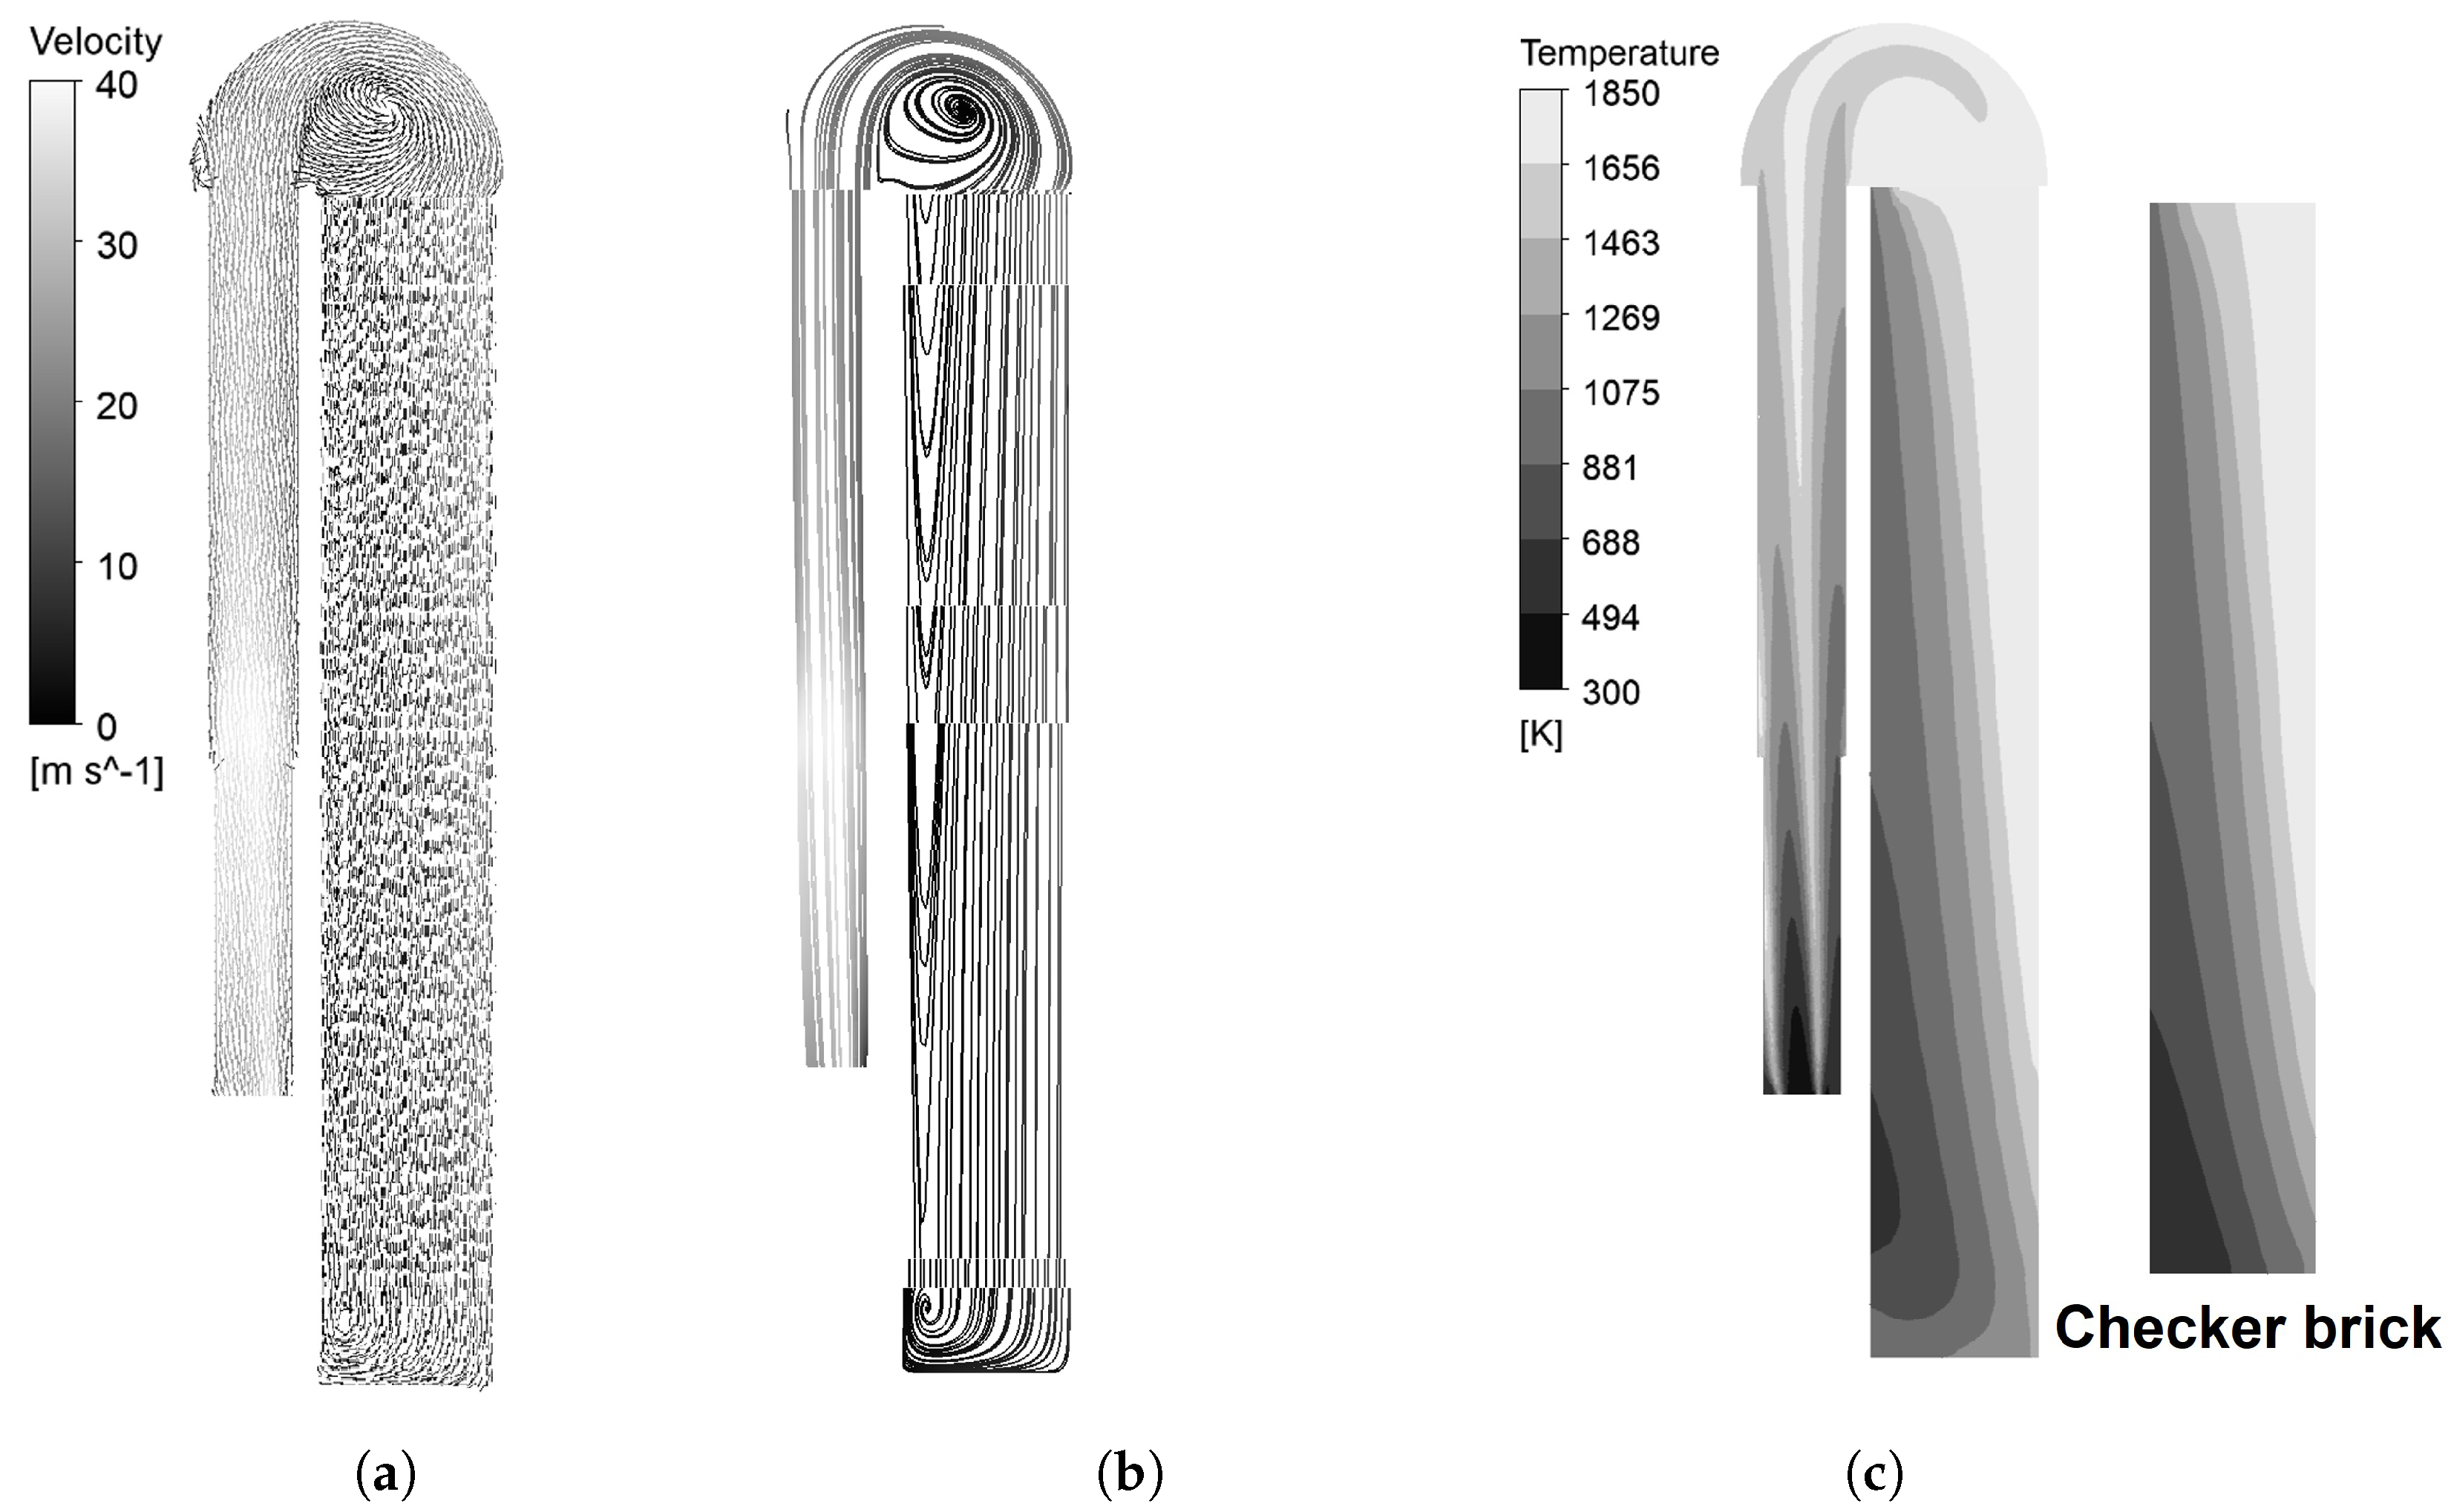
The velocity profile of the fluid and the temperature profiles of the fluid and checker bricks in the middle of the on-gas period ( t = 40 min) are presented in Figure 8. The maximum temperature reached 1841 K in the on-gas period. During the on-gas period, the velocity profile in the combustion chamber increased to 38.8 m/s at maximum and subsequently decreased to 22.8 m/s at the entrance of the dome due to the cross-sectional area change. A vortex was generated in the centre of the dome while the main flow passed through the outer region of the dome. The vortex caused the main flow to occur through the outer region of the checker chamber. Meanwhile, the inner section of the checker chamber could not absorb the heat from the flue gas due to a lack of flow, even though the vortex temperature was high enough. The external combustion hot blast stove also shows the vortex, but it is located at the top of the checker chamber dome [12]. The dome combustion type has the vortex between the top of the checker bricks and the dome [7,9]. The cause of the vortex generation is the sudden expansion of the flue gas discharged from the combustion chamber [7]. The major difference between the internal combustion type and the other types was the location of the vortex, which disturbed the flow to the inner section of the checker chamber. As a result, the temperature profile of the checker chamber, which is presented in Figure 8c, had an elevated temperature region in the outer region of the checker chamber, which showed a high temperature difference in the horizontal direction. External and dome combustion types do not have a high temperature difference in the horizontal direction since the generated vortex does not interfere with the fluid flow to the checker bricks.
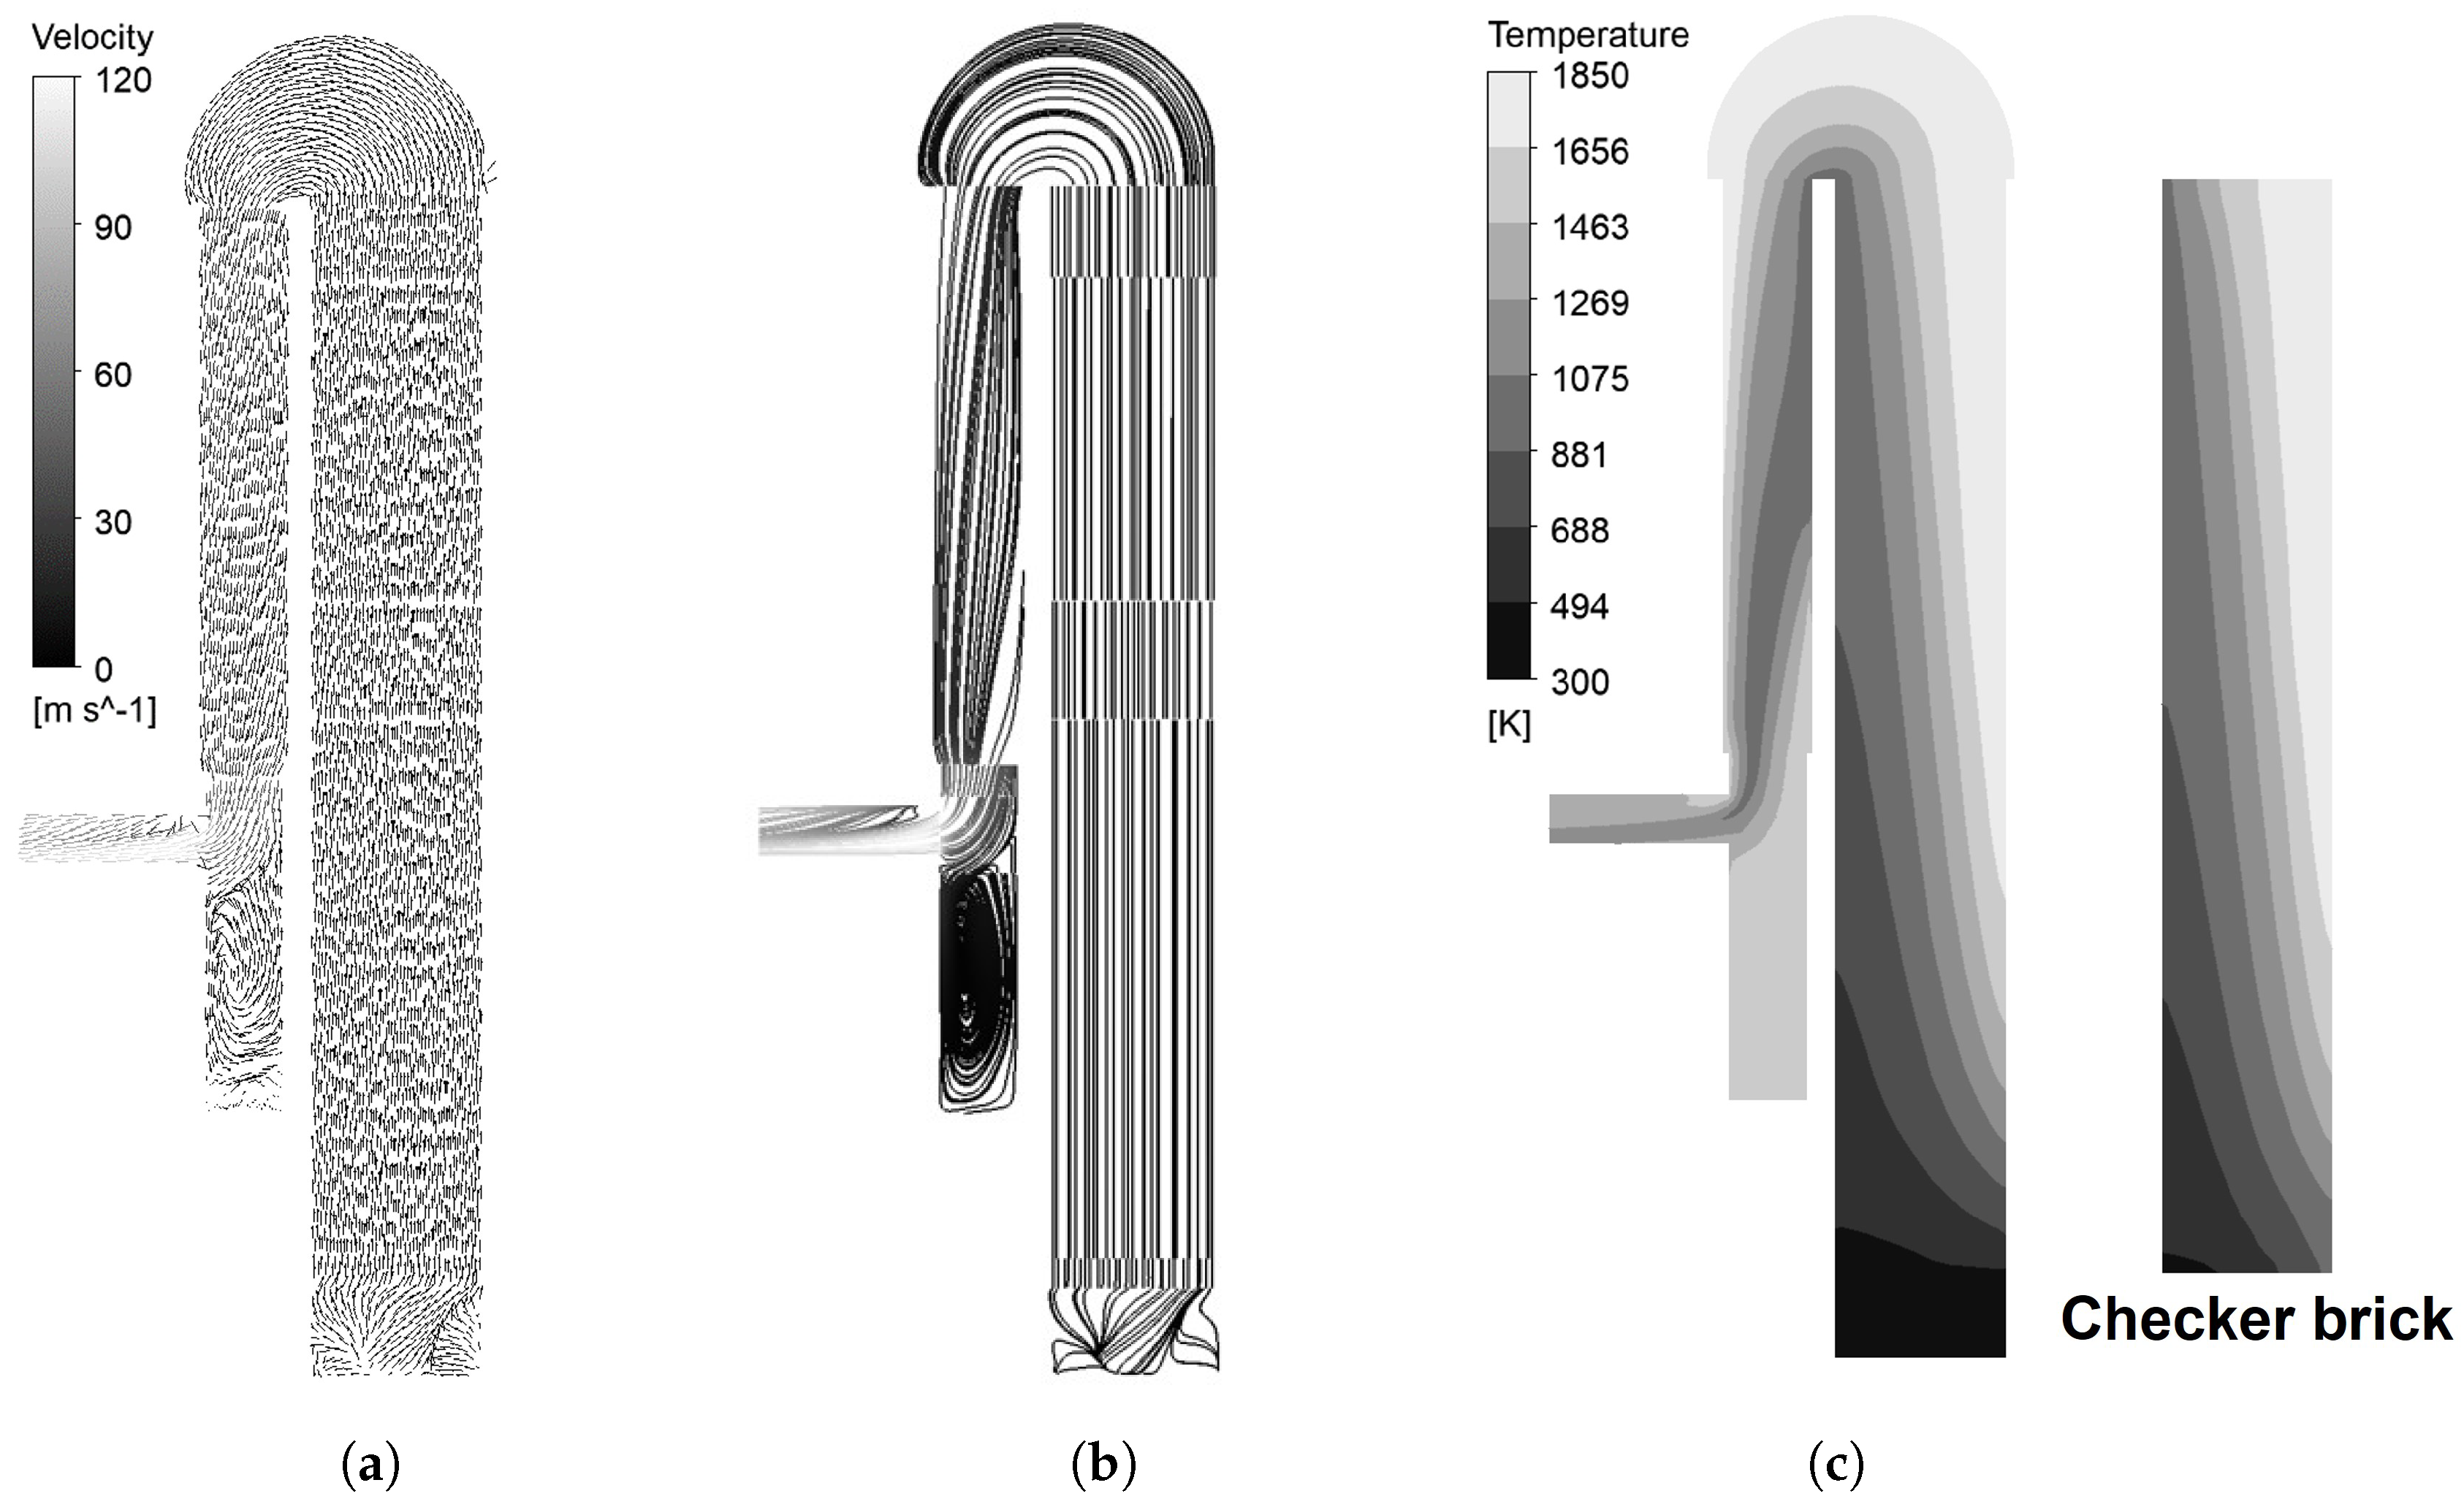
Figure 9 illustrates the velocity and temperature profiles in the middle of the on-blast ( t = 130 min) period. The maximum temperature reached 1804 K, and the average blast temperature reached 1345 K. The vortex was not generated in the on-blast period, and the velocity distribution was considerably even throughout the domain compared to the on-gas period. This flow regime also able to be seen in the dome and external combustion types [9,12]. The fluid velocity started to increase at the entrance of the combustion chamber, and it was hugely increased at the hot blast outlet due to the reduction in the cross-sectional area. The maximum velocity at the hot blast outlet was 117.0 m/s, and the average velocity was 54.2 m/s. The temperature distribution had the elevated temperature region at the outer region of the hot blast stove. The checker bricks in the inner region of the checker chamber received a lower amount of heat during the on-gas period, leading to the lower temperature distribution in the inner region of the hot blast stove. In addition, the dome and external combustion types have comparably slight temperature differences in the horizontal direction, as the checker bricks received a similar amount of heat in the horizontal direction during the on-gas period.
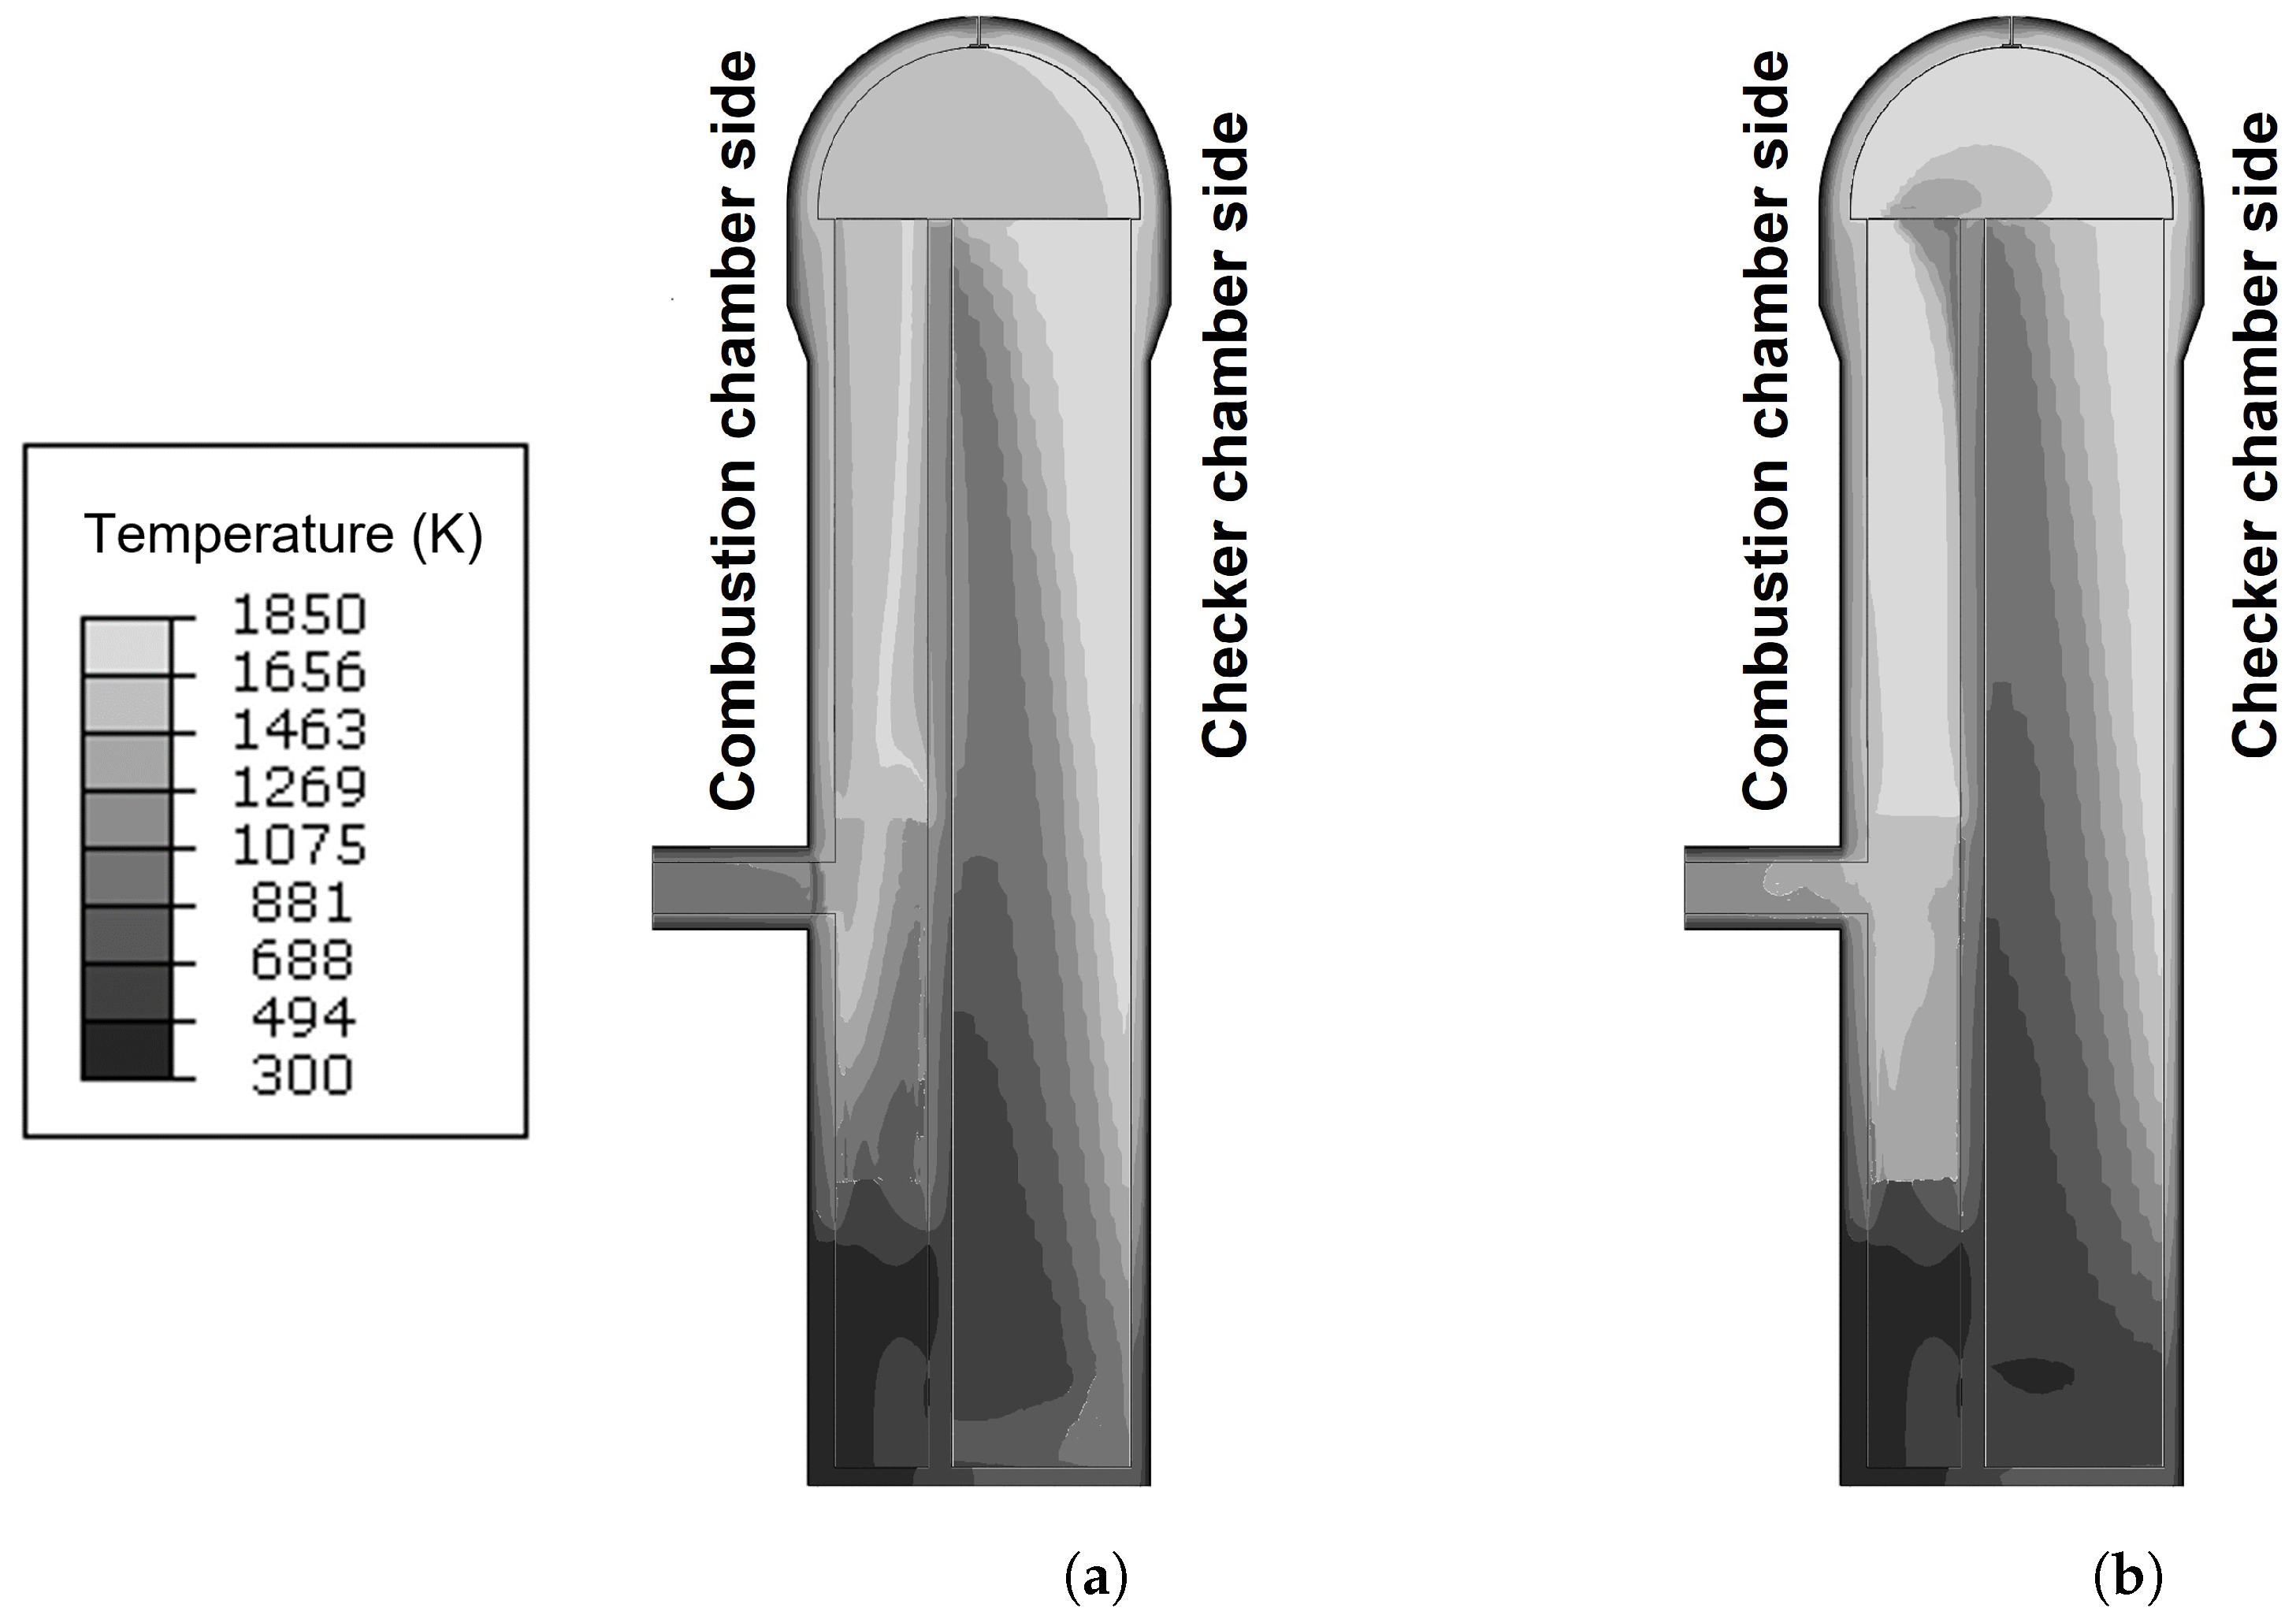
The temperature distributions of the refractory linings in the middle of the on-gas ( t = 40 min) and on-blast ( t = 130 min) periods are described in Figure 10. The inner surface of the refractory linings had similar temperature distribution to the fluid temperature distribution. The outer side of the checker chamber had a higher temperature, whilst the inner region had a lower temperature during the entire operation. The dome region near the outer side of the checker chamber was continuously exposed to a high temperature, as same as the outer side of the checker chamber. From the standpoint of managing the refractory linings, those regions would be a significant area of interest. Most regions of the combustion chamber and the dome had a moderate temperature in the on-gas period, whereas the temperature increased highly in the on-blast period. A noteworthy phenomenon is that the dome region between the combustion and checker chambers showed insignificant temperature change during the operation, which means the region remained in the moderate temperature range during the operation.
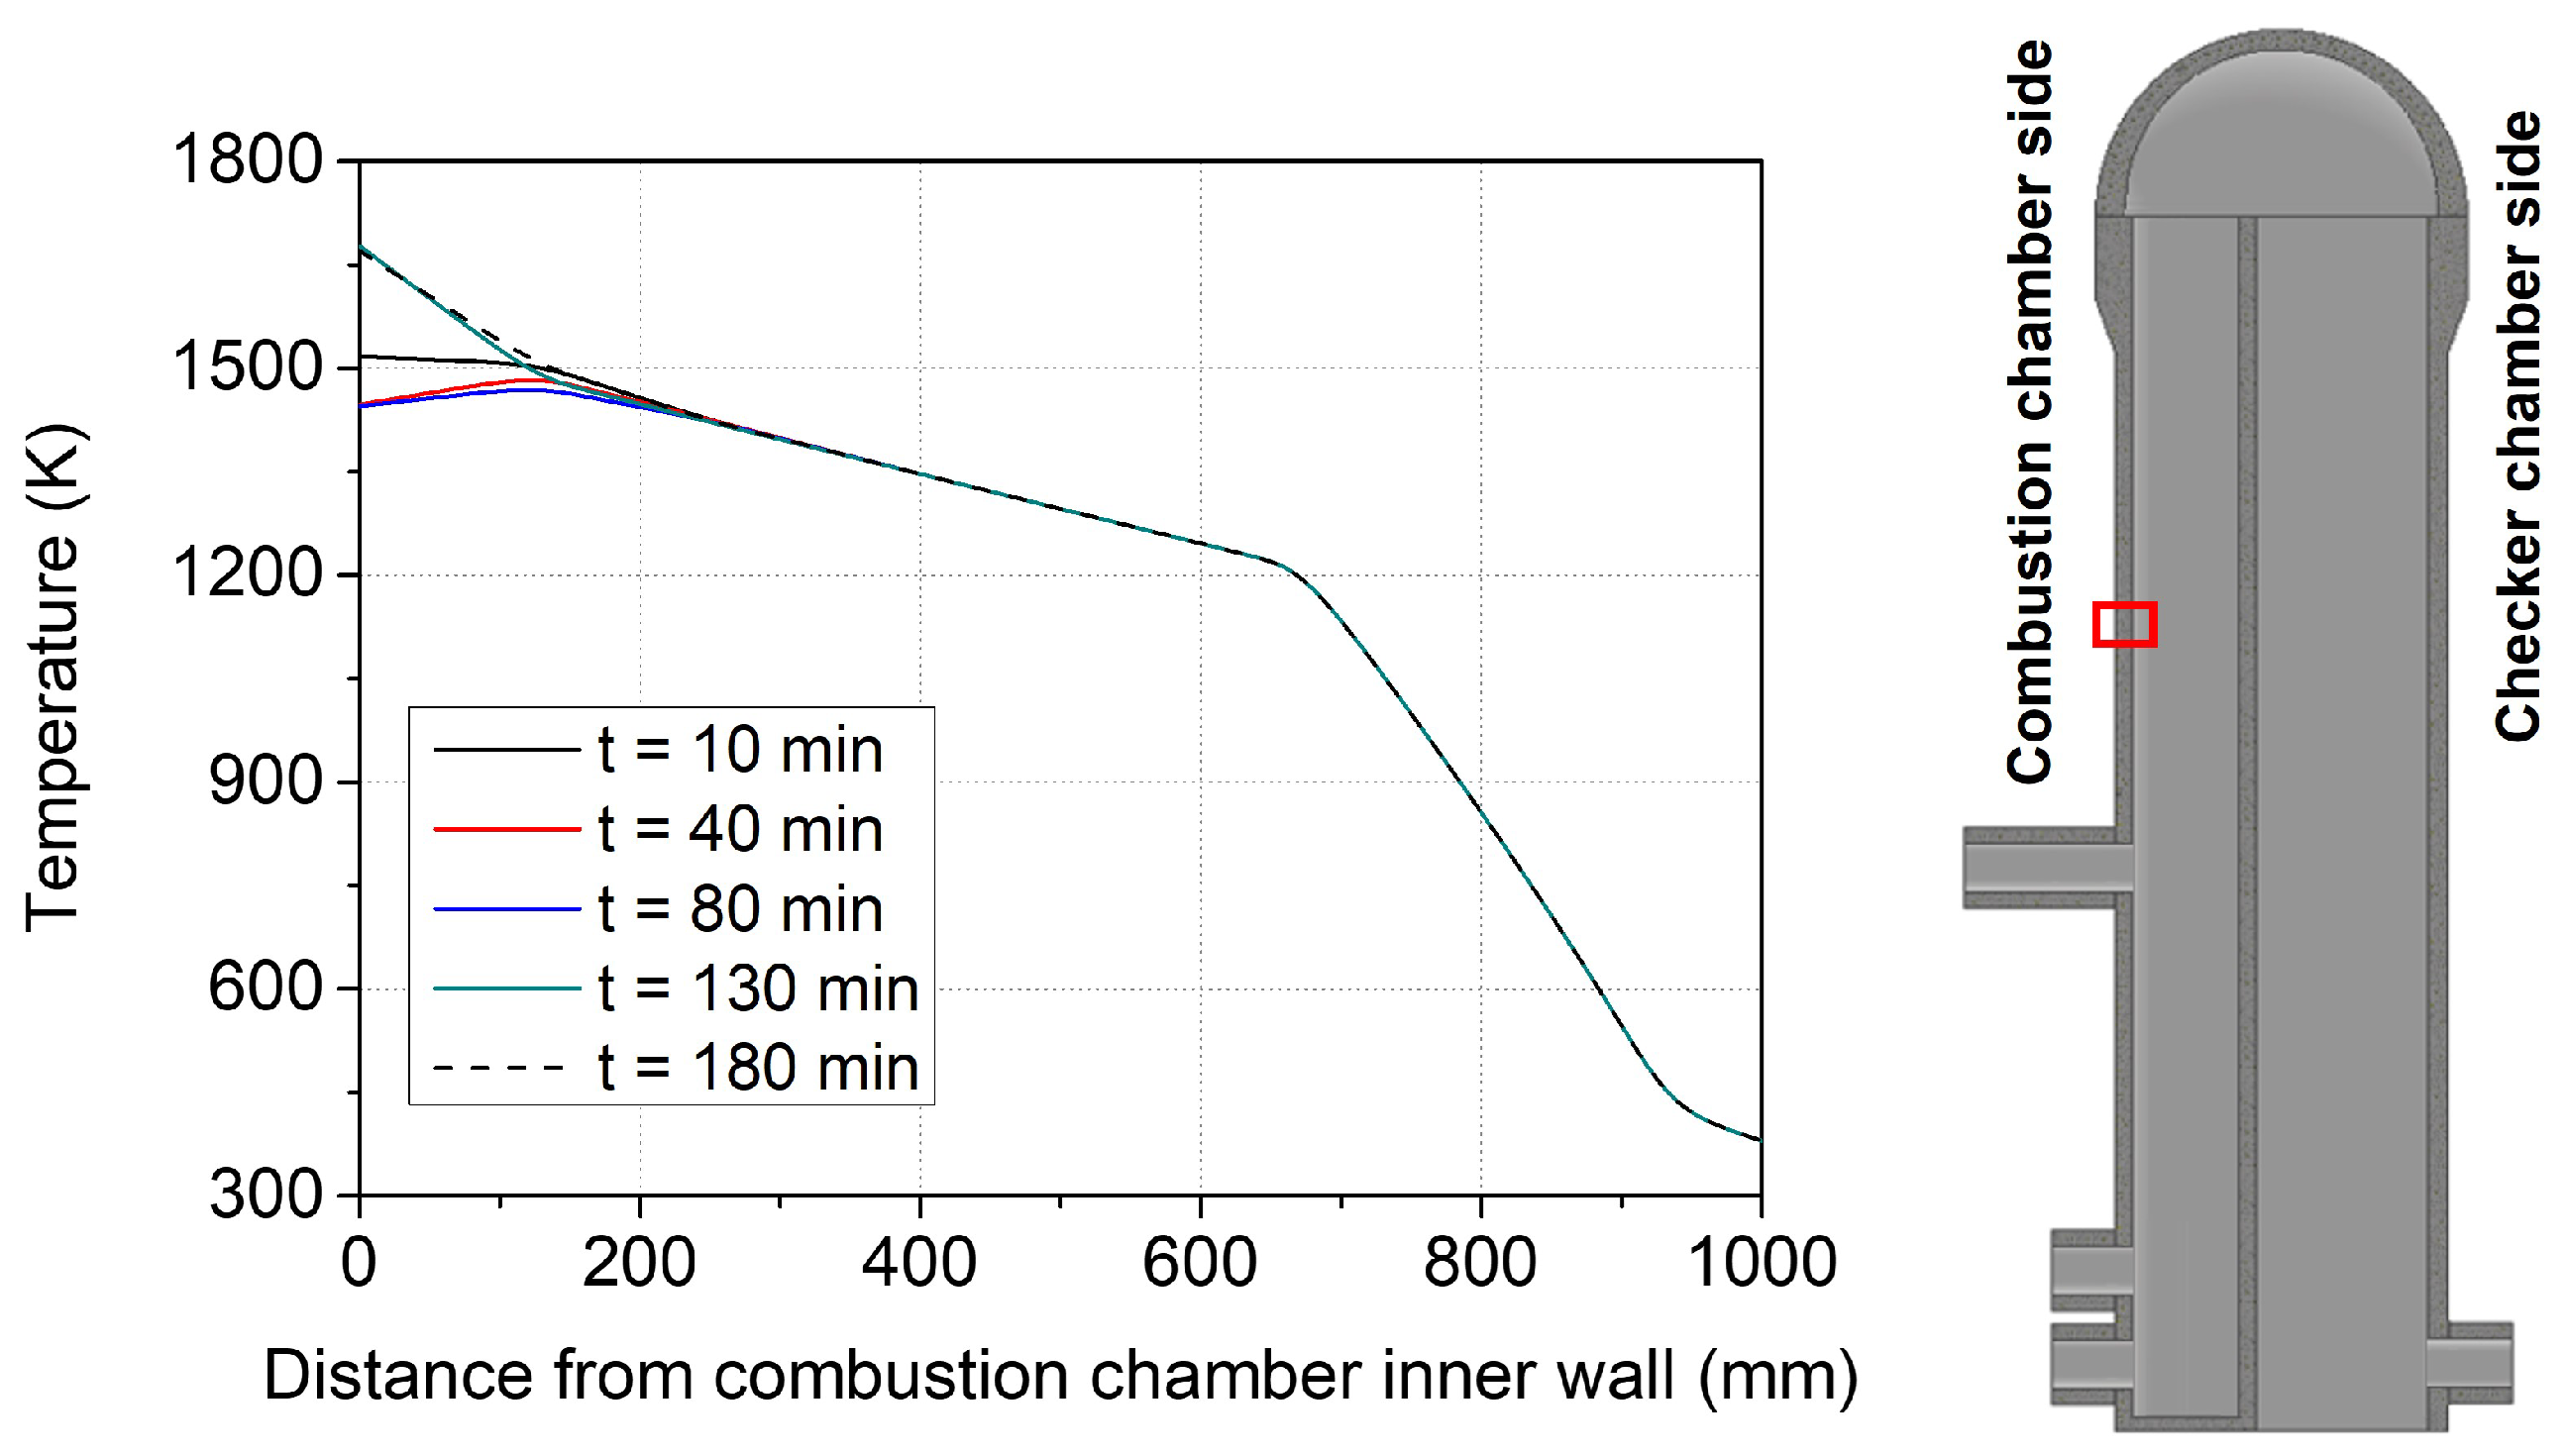
Figure 11 depicts the temperature change in the marked region of the combustion chamber wall through the thickness direction during the operation. The region was exposed to the most fluctuating temperature during the operation. The inner surface of the refractory had a temperature change from 1441 K to 1659 K. However, the temperature change reduced below 10 K from 250 mm from the inner surface and vanished at the outer surface. Similar behaviour also showed in the external combustion hot blast stove [12]. The length scale for thermal diffusion Δ L D can be estimated as Δ L D = κ Δ t where κ is the thermal diffusivity, and Δ t is the time scale. Taking Refractory A in Table 3 as an example material to compute the length scale for the thermal diffusion, its thermal diffusivity at 1000 °C is 0.875 mm2/s. Its length scale for thermal diffusion is calculated as 97.2 mm with the time scale of Δ t = 180 min, which is the operation time for a cycle. The structure temperature analysis results indicated that the temperature difference vanished from 250 mm, which makes the FEA result considered to be reasonable. The shell temperature, therefore, remained steady during the operation thanks to the low thermal diffusivity of the refractories.
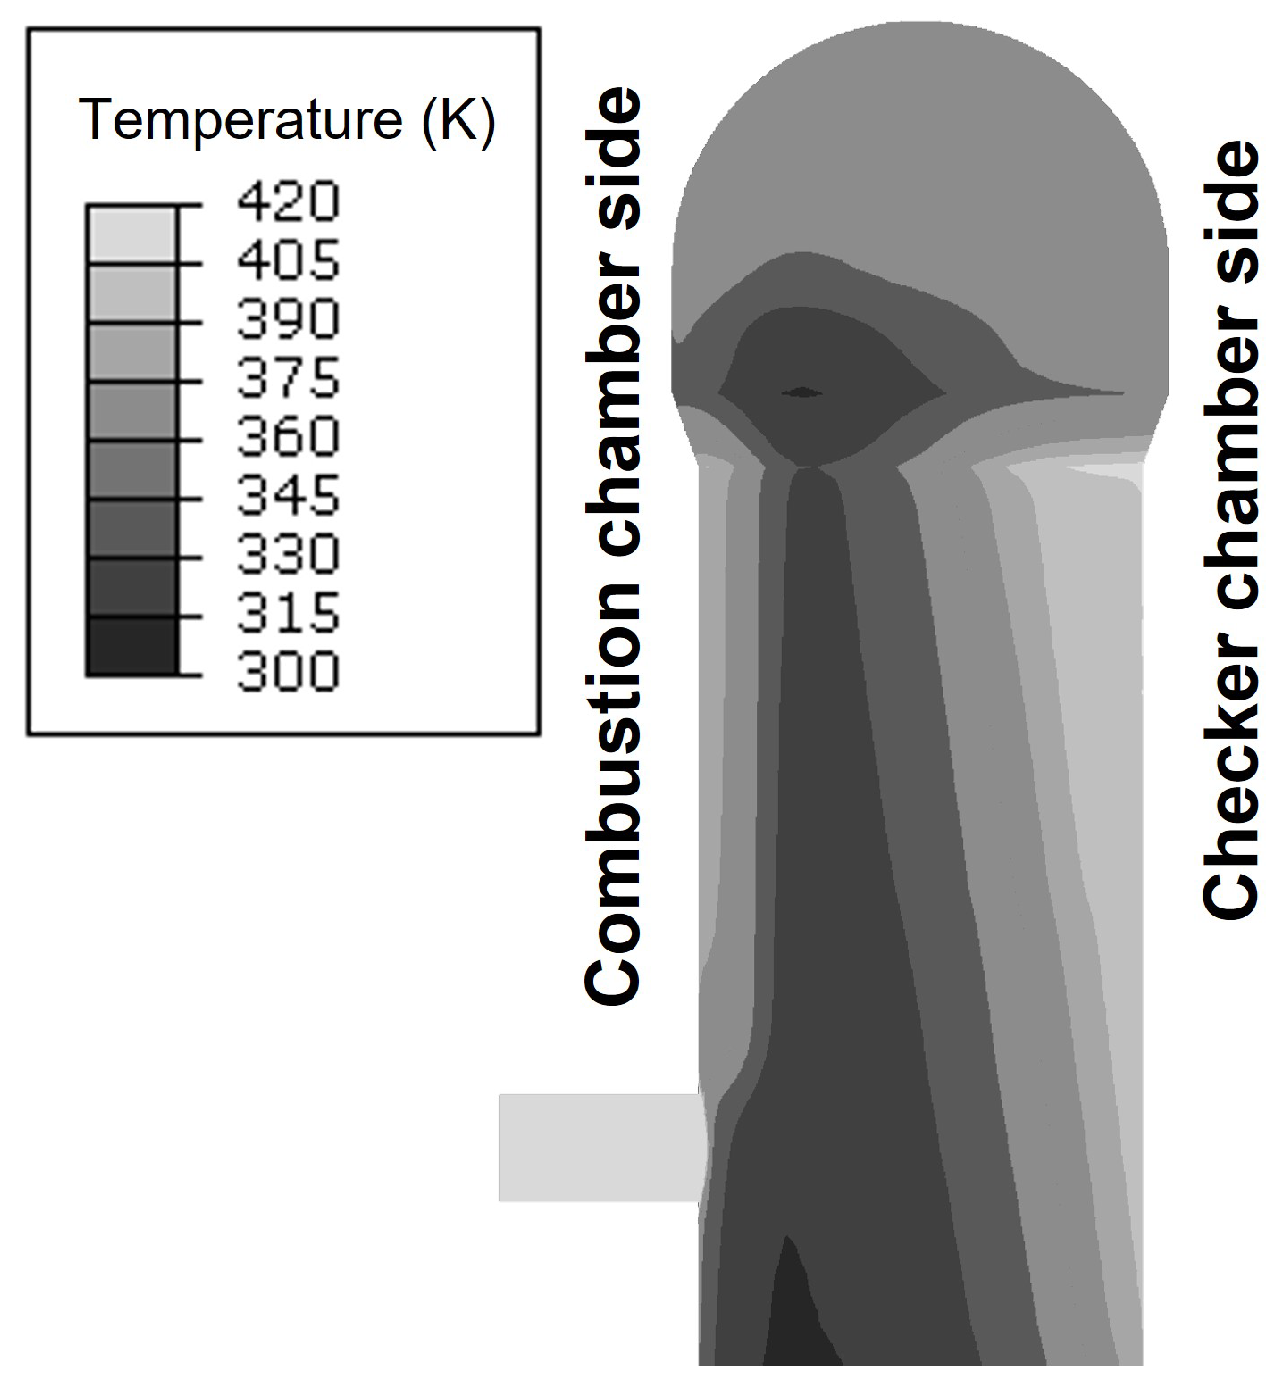
The temperature distribution of the shell is depicted in Figure 12. The checker chamber side exhibited the highest temperature distribution due to continuous exposure to the higher temperature of the outer checker chamber. Upon comparing the temperature distributions of the dome and combustion chamber regions, the dome had a lower temperature since the refractory lining was thicker than the combustion chamber. The partition wall side, located between the combustion and checker chambers, was observed to have a significantly lower temperature distribution than the outer regions. It can be understood that the temperature gradient in the circumferential direction comes from the flow characteristics, and the gradient in the height direction comes from the geometric characteristics. Since the conical region exhibited a higher thermal gradient, it was expected to have higher thermal stress.
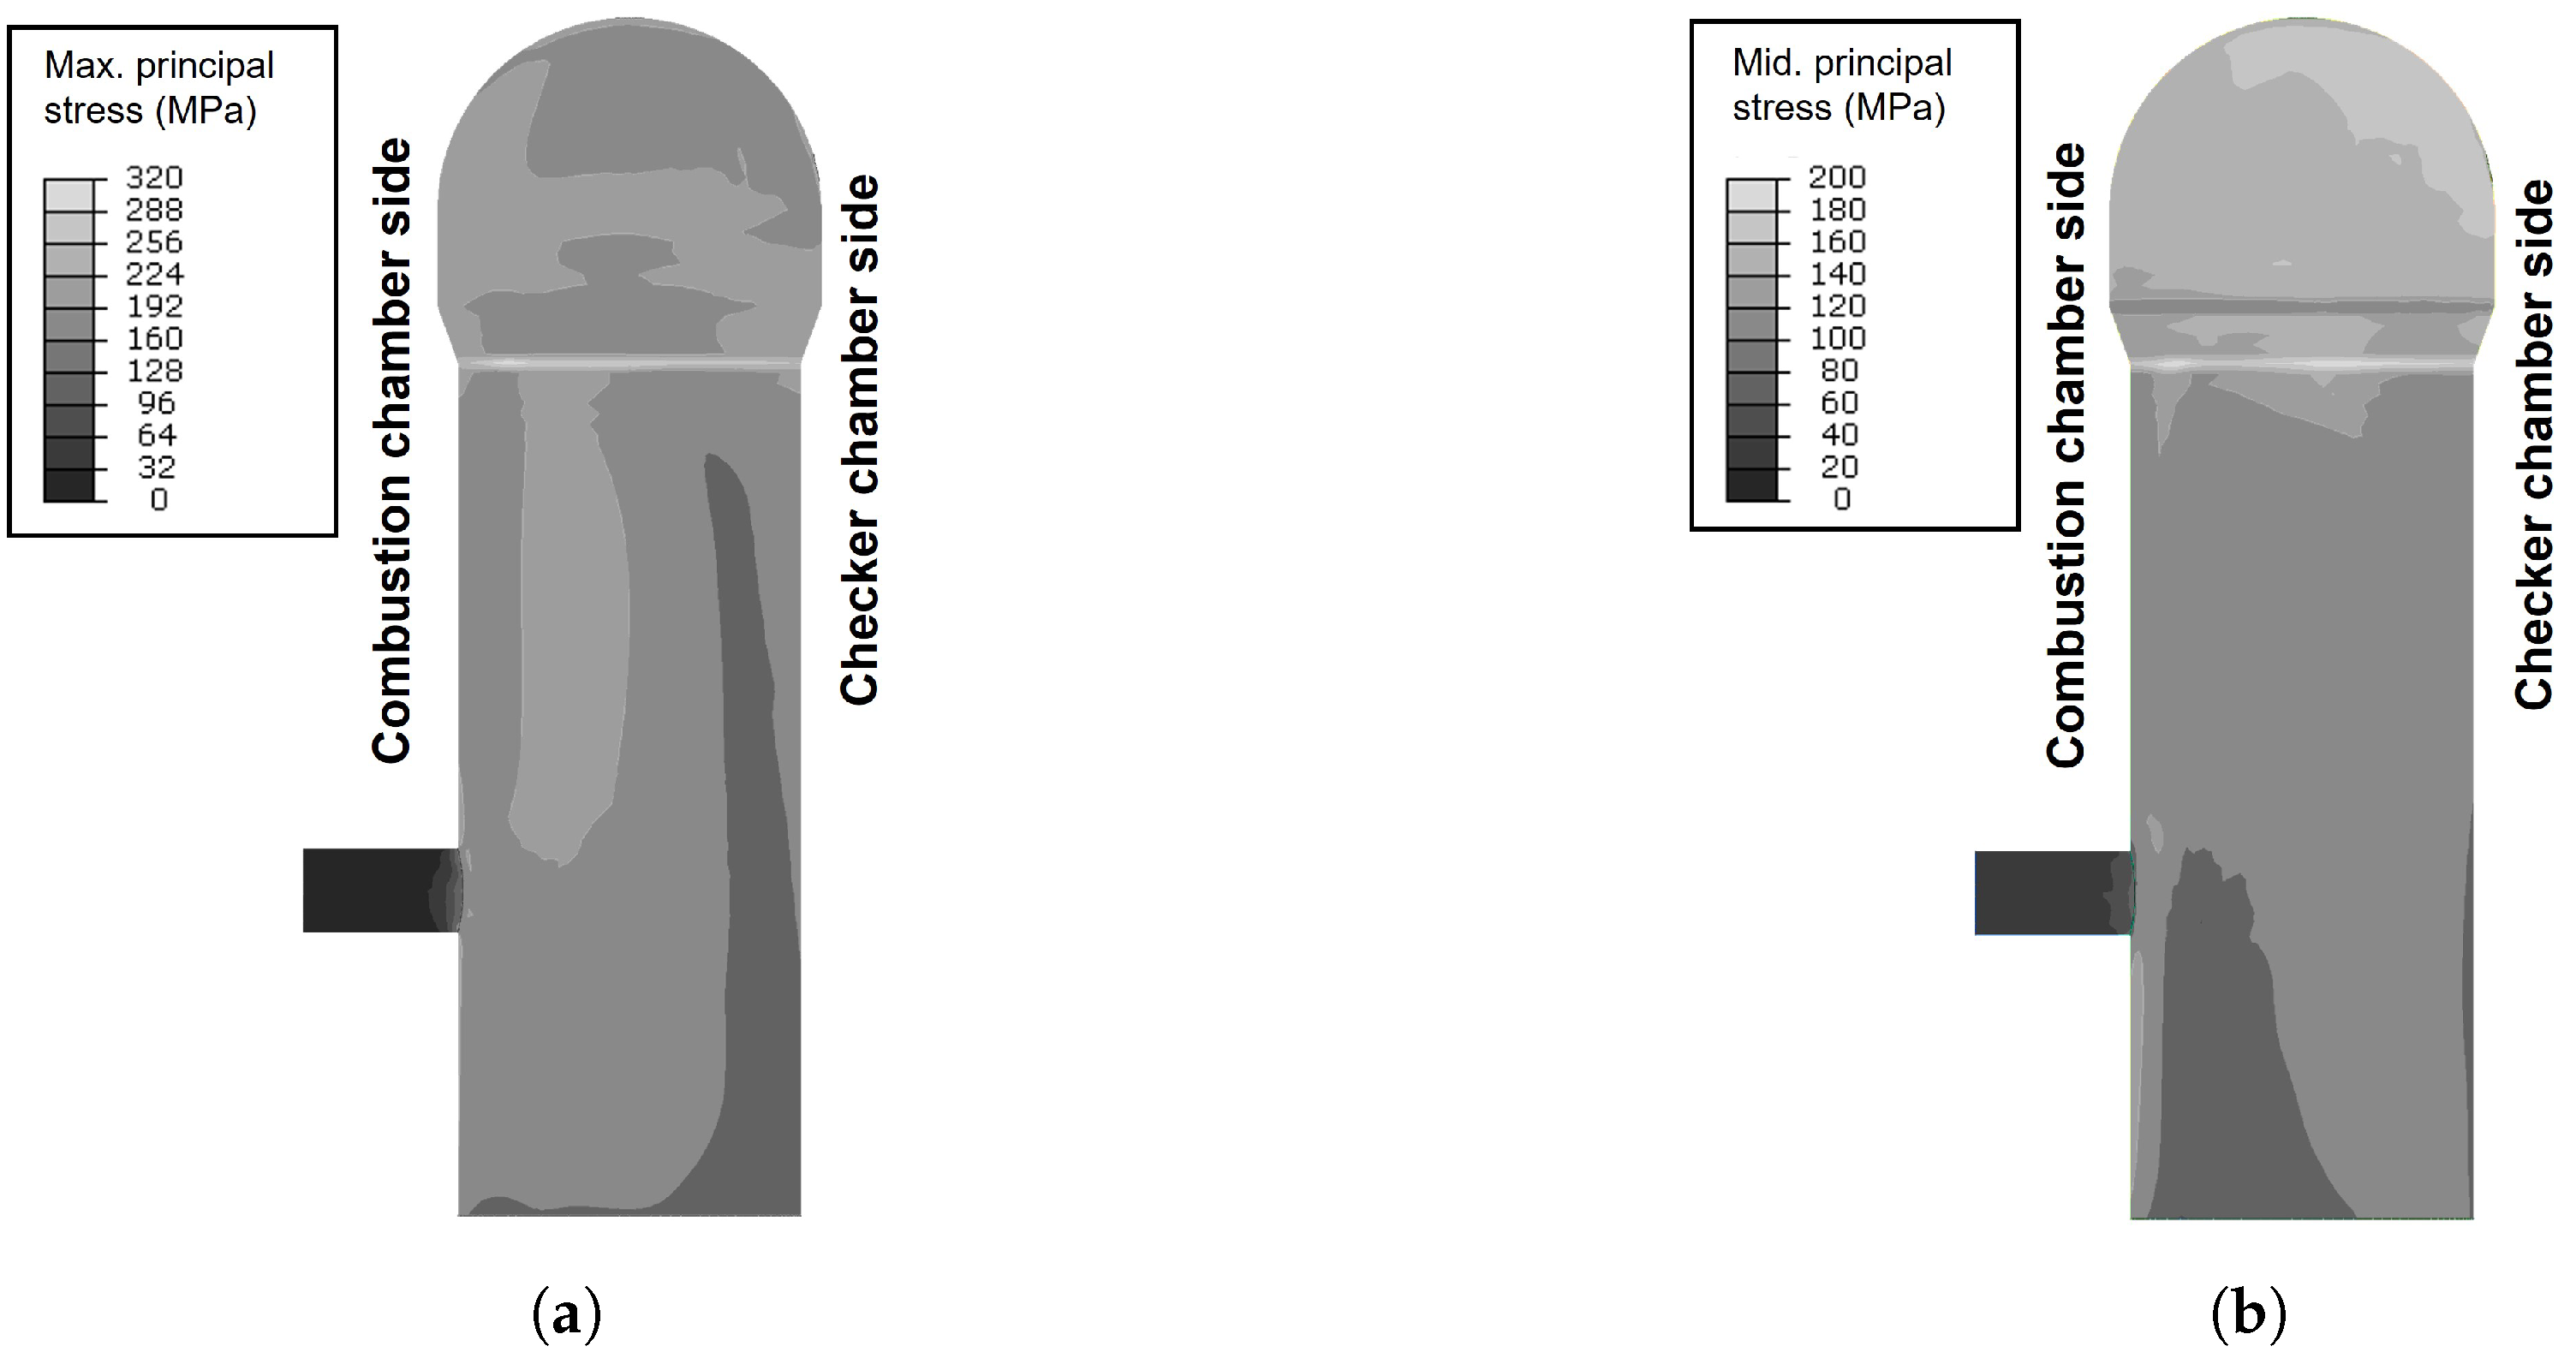
The maximum and middle principal thermal stress distributions of the shell are illustrated in Figure 13. It is observed that both principal stresses appeared to be higher along the conical region, which was induced by not only the thermal gradient discussed but the geometric characteristics that can raise the stress concentration. However, the external combustion type was reported to have tensile maximum principal stress, and compressive minimum principal stress in the conical region [12], while the internal combustion type had biaxial tensile stress. The conical region in the external combustion hot blast stove has a relatively uniform temperature distribution. Since the thicker part has lower temperature distribution than the thinner part of the conical region, the thinner part tends to expand more than the thicker part. As a result, the conical region of the external type has compressive minimum principal stress, whilst the internal combustion type showed uneven temperature distribution, which generated the tensile minimum principal stress on the conical region of the internal type. An intermediate level of the maximum principal stress was observed on the partition wall side compared to the combustion and checker chamber sides. The stress on the partition wall side was induced due to the temperature gradient in the circumferential direction. The combustion, checker chambers, and partition wall sides had a similar level of middle principal stress since the thermal gradient in the height direction did not differ when compared to the circumferential direction. The maximum principal stress of the dome appeared to be higher in the region near the partition wall side, where a higher thermal gradient was generated.
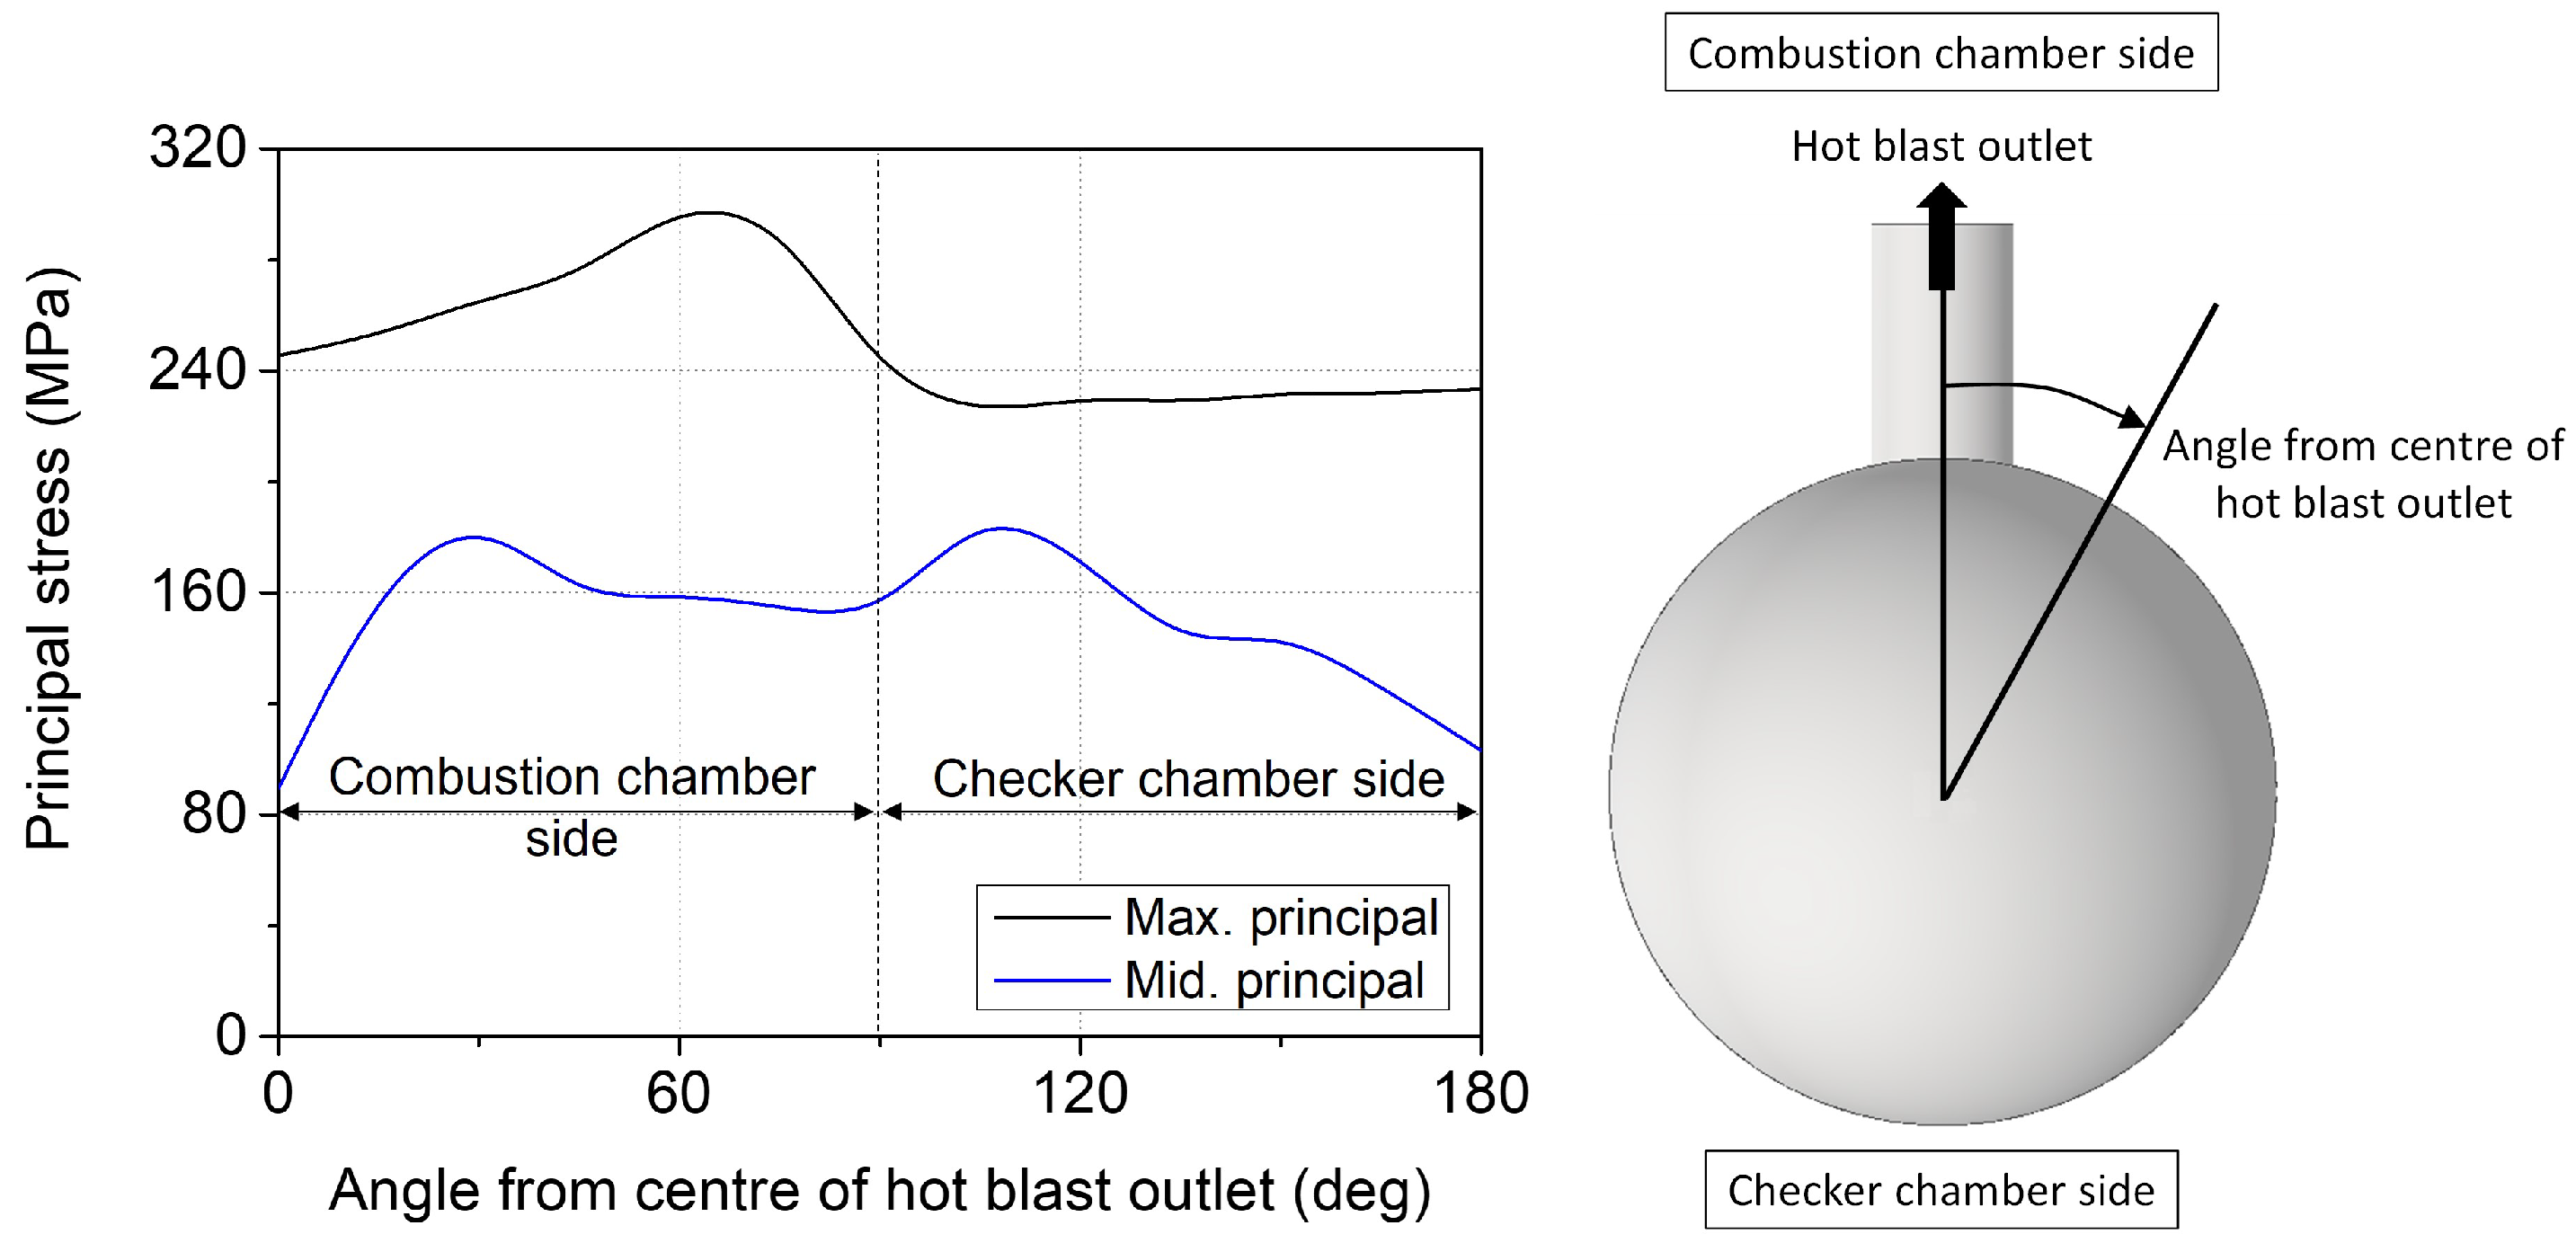
Figure 14 describes the maximum and middle principal thermal stresses of the conical region along the circumferential direction. The highest maximum principal stress occurred at the 65° point, where the low-temperature area of the conical region was as discussed previously, and its magnitude was 300.6 MPa. The combustion chamber side had higher maximum principal stress distribution than the checker chamber side. A higher middle principal stress appeared in the angle region between 30° and 120°. The highest middle principal stress occurred with 192.0 MPa at the 30° and 105° points. However, the external combustion type has the maximum principal magnitude of 53 MPa [12]. Even though the region which has the highest maximum principal stress is the same in both types, the internal type had about three times higher maximum principal stress. It can be understood that temperature variation is a dominant factor for the generation of thermal stress in hot blast stove applications.

4. Conclusions

In this study, a numerical model was developed to analyse the flow phenomenon, temperature, and thermal stress distribution of a hot blast stove with an internal combustion chamber. The thermal boundary conditions of the hot blast stove structure were calculated using the analytic adiabatic Y-plus method and mapped to the FEA mesh through the developed scheme. The conclusions based on the numerical result can be summarised as follows:
  • In the on-gas period, a vortex was generated above the partition wall while the main flow passed through the outer region of the dome. The inner region of the checker chamber could not absorb the heat from the flue gas due to a lack of flow, even though the vortex temperature was high enough;
  • The average temperature of the hot blast reached 1345 K in the on-blast period. There was no vortex generation, and the velocity distribution was considerably even compared to the on-gas period. The temperature distribution had the elevated temperature region at the outer region of the hot blast stove;
  • The refractory linings in the outer side of the checker chamber and the dome region near the outer side of the checker chamber were continuously exposed to a high temperature. These regions would be a significant area of interest in managing the deterioration of the refractory linings;
  • Although the inner surface of the refractory lining temperature changed from 1441 K to 1659 K, the temperature change from 250 mm location into the thickness direction significantly decreased. The shell temperature did not change during the operation thanks to the low thermal diffusivity of the refractories;
  • The conical region of the shell was found to have high maximum and middle principal thermal stresses. The maximum and middle principal stresses were calculated as 300.6 MPa and 192.0 MPa, respectively. The thermal stress is induced due to the high-temperature gradient near the conical region, and the geometric characteristic of the conical region made the thermal stress much higher. The thermal stress analysis result indicates that the conical region would be a significant area of interest.
However, there are some limitations in the presented numerical model, which could be suggested in future works. The mechanical stress generated due to operating pressure and gravity was not considered in the model. The CFD model was built with the adiabatic wall boundary conditions to reduce the computational cost. Even if the temperature was calculated with reasonable precision loss, the conjugate heat transfer approach would give a more accurate result. Another limitation is that the degradation of the refractory linings was not considered in the numerical model, where the deterioration worsens the thermal property of the refractories.

Author Contributions

Conceptualization, N.K. and J.-H.P.; methodology, D.P., F.G., and J.C.; software, D.P.; validation, D.P., J.C., J.-H.P., and N.K.; formal analysis, D.P., F.G., and J.C.; investigation D.P., F.G., and J.C.; resources, N.K. and J.-H.P.; data curation, D.P. and F.G.; writing—original draft preparation, D.P.; writing—review and editing, N.K.; visualization, D.P., F.G., and J.C.; supervision, N.K.; project administration, N.K.; funding acquisition, N.K.; All authors have read and agreed to the published version of the manuscript.

Funding

This research was supported by RIST (Research Institute of Industrial Science and Technology), Republic of Korea.

Institutional Review Board Statement

Not applicable.

Informed Consent Statement

Not applicable.

Data Availability Statement

Not applicable.

Acknowledgments

The authors appreciate the support from POSCO in establishing this work.

Conflicts of Interest

The authors declare no conflict of interest.

References

  1. Dwivedi, S.K.; Vishwakarma, M.; Soni, A. Advances and researches on non destructive testing: A review. Mater. Today Proc. 2018, 5, 3690–3698. [Google Scholar] [CrossRef]
  2. Gol’dfarb, E.; Gres, L.; Lebedev, V.; Kazimirova, I.; Tsukanov, P. Character of fracture of the shell metal of blast-furnace stoves. Metallurgist 1979, 23, 469–472. [Google Scholar] [CrossRef]
  3. Van Ikelen, J.; Nugteren, B. Intercrystalline Stress Corrosion-A Creeping Threat. IRON Steel Technol. 2006, 3, 202. [Google Scholar]
  4. Zhang, F.M.; Mao, Q.W.; Mei, C.H.; Xin, L.; Hu, Z.R. Dome combustion hot blast stove for huge blast furnace. J. Iron Steel Res. Int. 2012, 19, 1–7. [Google Scholar] [CrossRef]
  5. Rieger, J.; Weiss, C.; Rummer, B. Modelling and control of pollutant formation in blast stoves. J. Clean. Prod. 2015, 88, 254–261. [Google Scholar] [CrossRef]
  6. Guo, H.; Yan, B.; Zhang, J.; Liu, F.; Pei, Y. Optimization of the number of burner nozzles in a hot blast stove by the way of simulation. JOM 2014, 66, 1241–1252. [Google Scholar] [CrossRef]
  7. Qi, F.; Liu, Z.; Yao, C.; Li, B. Numerical study and structural optimization of a top combustion hot blast stove. Adv. Mech. Eng. 2015, 7, 709675. [Google Scholar] [CrossRef]
  8. Zetterholm, J.; Ji, X.; Sundelin, B.; Martin, P.M.; Wang, C. Dynamic modelling for the hot blast stove. Appl. Energy 2017, 185, 2142–2150. [Google Scholar] [CrossRef]
  9. Zhang, Q.; Chen, L.; Zhao, C. Numerical simulation of combustion and air supply process and optimal design of traditional top combustion hot blast stoves. Steel Res. Int. 2021, 92, 2000311. [Google Scholar] [CrossRef]
  10. Yan, K.; Cheng, S. Stress and deformation analysis of top combustion hot blast stove shell. In Characterization of Minerals, Metals, and Materials 2017; Springer: Berlin/Heidelberg, Germany, 2017; pp. 757–765. [Google Scholar]
  11. Hwang, Y.M.; Lee, Y.M. Thermal stress analysis of refractory linings in a hot blast stove. J. Phys. Conf. Ser. 2020, 1633, 012075. [Google Scholar] [CrossRef]
  12. Gan, Y.F.; Jang, J.Y.; Wu, T.Y. 3D dynamic thermal and thermomechanical stress analysis of a hot blast stove. Ironmak. Steelmak. 2020, 47, 959–972. [Google Scholar] [CrossRef]
  13. van Straaten, V.; de Graaff, B.; Engel, E. Hot Blast System Development: Technology, Operations, Campaign Management. BHM Berg-und Hüttenmännische Monatshefte 2019, 164, 452–460. [Google Scholar] [CrossRef]
  14. Rajić, M.N.; Banić, M.S.; Živković, D.S.; Tomić, M.M.; Mančić, M.V. Construction optimization of hot water fire-tube boiler using thermomechanical finite element analysis. Therm. Sci. 2018, 22, 1511–1523. [Google Scholar] [CrossRef]
  15. Jaremkiewicz, M.; Taler, D.; Dzierwa, P.; Taler, J. Determination of transient fluid temperature and thermal stresses in pressure thick-walled elements using a new design thermometer. Energies 2019, 12, 222. [Google Scholar] [CrossRef] [Green Version]
  16. Taler, J.; Dzierwa, P.; Jaremkiewicz, M.; Taler, D.; Kaczmarski, K.; Trojan, M.; Sobota, T. Thermal stress monitoring in thick walled pressure components of steam boilers. Energy 2019, 175, 645–666. [Google Scholar] [CrossRef]
  17. Hoseinzadeh, S.; Heyns, P.S. Thermo-structural fatigue and lifetime analysis of a heat exchanger as a feedwater heater in power plant. Eng. Fail. Anal. 2020, 113, 104548. [Google Scholar] [CrossRef]
  18. Rajić, M.; Zivković, D.; Banić, M.; Mančić, M.; Maneski, T.; Milošević, M.; Mitrović, N. Experimental and numerical stress and strain analysis of the boiler reversing chamber tube plate. Therm. Sci. 2022, 26, 2135–2145. [Google Scholar] [CrossRef]
  19. Yıldırım, A.; Yarımpabuç, D.; Arikan, V.; Eker, M.; Celebi, K. Nonlinear thermal stress analysis of functionally graded spherical pressure vessels. Int. J. Press. Vessel. Pip. 2022, 200, 104830. [Google Scholar] [CrossRef]
  20. Jeong, S.H.; Chung, K.S.; Ma, W.J.; Yang, J.S.; Choi, J.B.; Kim, M.K. Thermal stress intensity factor solutions for reactor pressure vessel nozzles. Nucl. Eng. Technol. 2022, 54, 2188–2197. [Google Scholar] [CrossRef]
  21. Karamavruc, A. Obtaining bulk flow based heat transfer coefficients for thermal evaluation of turbochargers. In Proceedings of the IMechE Conference, C6231-110, London, UK, 17–18 May 2016. [Google Scholar]
  22. Hochstein, J.I.; Gerhart, A.L. Young, Munson and Okiishi’s A Brief Introduction to Fluid Mechanics; John Wiley & Sons: Hoboken, NJ, USA, 2021. [Google Scholar]
  23. Kimura, Y.; Takatani, K.; Otsu, N. Three-dimensional mathematical modeling and designing of hot stove. ISIJ Int. 2010, 50, 1040–1047. [Google Scholar] [CrossRef] [Green Version]
  24. Amirshaghaghi, H.; Zamaniyan, A.; Ebrahimi, H.; Zarkesh, M. Numerical simulation of methane partial oxidation in the burner and combustion chamber of autothermal reformer. Appl. Math. Model. 2010, 34, 2312–2322. [Google Scholar] [CrossRef]
  25. Mollamahdi, M.; Hashemi, S.A. The effects of porous wall as a novel flame stabilization method on flame characteristics in a premixed burner for CH4/air mixture by numerical simulation. Proc. Inst. Mech. Eng. Part A J. Power Energy 2020, 234, 211–225. [Google Scholar] [CrossRef]
  26. Rieger, J.; Drózd-Ryś, M.; Weiss, C.; Harmuth, H. Thermochemical wear of refractory linings associated with gas firing in metallurgical plants. Steel Res. Int. 2014, 85, 527–536. [Google Scholar] [CrossRef]
  27. Jia, Z.; Ye, Q.; Wang, H.; Li, H.; Shi, S. Numerical simulation of a new porous medium burner with two sections and double decks. Processes 2018, 6, 185. [Google Scholar] [CrossRef] [Green Version]
  28. Launder, B.E. Lectures in Mathematical Models of Turbulence; Academic Press: Cambridge, MA, USA, 1972. [Google Scholar]
  29. Versteeg, H.K.; Malalasekera, W. An Introduction to Computational Fluid Dynamics: The Finite Volume Method; Pearson Education: Upper Saddle River, NJ, USA, 2007. [Google Scholar]
  30. Magnussen, B.F.; Hjertager, B.H. On mathematical modeling of turbulent combustion with special emphasis on soot formation and combustion. Symp. (Int.) Combust. 1977, 16, 719–729. [Google Scholar] [CrossRef]
  31. Coelho, P.J. Numerical simulation of the interaction between turbulence and radiation in reactive flows. Prog. Energy Combust. Sci. 2007, 33, 311–383. [Google Scholar] [CrossRef]
  32. Coelho, P.J. Advances in the discrete ordinates and finite volume methods for the solution of radiative heat transfer problems in participating media. J. Quant. Spectrosc. Radiat. Transf. 2014, 145, 121–146. [Google Scholar] [CrossRef]
  33. Sakami, M.; Charette, A. A new differencing scheme for the discrete-ordinates method in complex geometries. Revue Générale de Thermique 1998, 37, 440–449. [Google Scholar] [CrossRef]
  34. Joseph, D.; Coelho, P.J.; Cuenot, B.; El Hafi, M. Application of the discrete ordinates method to grey media in complex geometries using unstructured meshes. Eurotherm Comput. Therm. Radiat. Particip. Media 2003, 11, 97–106. [Google Scholar]
  35. Fiveland, W. Discrete-ordinates solutions of the radiative transport equation for rectangular enclosures. J. Heat Transfer. 1984, 106, 699–706. [Google Scholar] [CrossRef]
  36. Fluent, A. Ansys Fluent Theory Guide; Ansys Inc.: Canonsburg, PA, USA, 2011; Volume 15317, pp. 724–746. [Google Scholar]
  37. Haaland, S.E. Simple and explicit formulas for the friction factor in turbulent pipe flow. J. Fluids Eng. 1983, 105, 89–90. [Google Scholar] [CrossRef]
  38. Gnielinski, V. New equations for heat and mass transfer in turbulent pipe and channel flow. Int. Chem. Eng. 1976, 16, 359–368. [Google Scholar]
  39. Carnigila, S.C.; Barna, G.L. Handbook of Industrial Refractories Technology; Elsevier: Amsterdam, The Netherlands, 1991. [Google Scholar]
  40. uczyński, P.; Giesen, M.; Gier, T.S.; Wirsum, M. Uncoupled CFD-FEA methods for the Thermo-structural analysis of turbochargers. Int. J. Turbomachinery Propuls. Power 2019, 4, 39. [Google Scholar] [CrossRef] [Green Version]
  41. Launder, B.E.; Spalding, D.B. The numerical computation of turbulent flows. In Numerical Prediction of Flow, Heat Transfer, Turbulence and Combustion; Elsevier: Amsterdam, The Netherlands, 1983; pp. 96–116. [Google Scholar]
  42. Kader, B. Temperature and concentration profiles in fully turbulent boundary layers. Int. J. Heat Mass Transf. 1981, 24, 1541–1544. [Google Scholar] [CrossRef]
  43. Incropera, F.P.; DeWitt, D.P.; Bergman, T.L.; Lavine, A.S. Fundamentals of Heat and Mass Transfer; Wiley: New York, NY, USA, 1996; Volume 6. [Google Scholar]
  44. Bordbar, M.H.; Węcel, G.; Hyppänen, T. A line by line based weighted sum of gray gases model for inhomogeneous CO2–H2O mixture in oxy-fired combustion. Combust. Flame 2014, 161, 2435–2445. [Google Scholar] [CrossRef]
  45. Schacht, C. Refractories Handbook; CRC Press: Boca Raton, FL, USA, 2004. [Google Scholar]
  46. Sarkar, R. Refractory Technology: Fundamentals and Applications; CRC Press: Boca Raton, FL, USA, 2016. [Google Scholar]
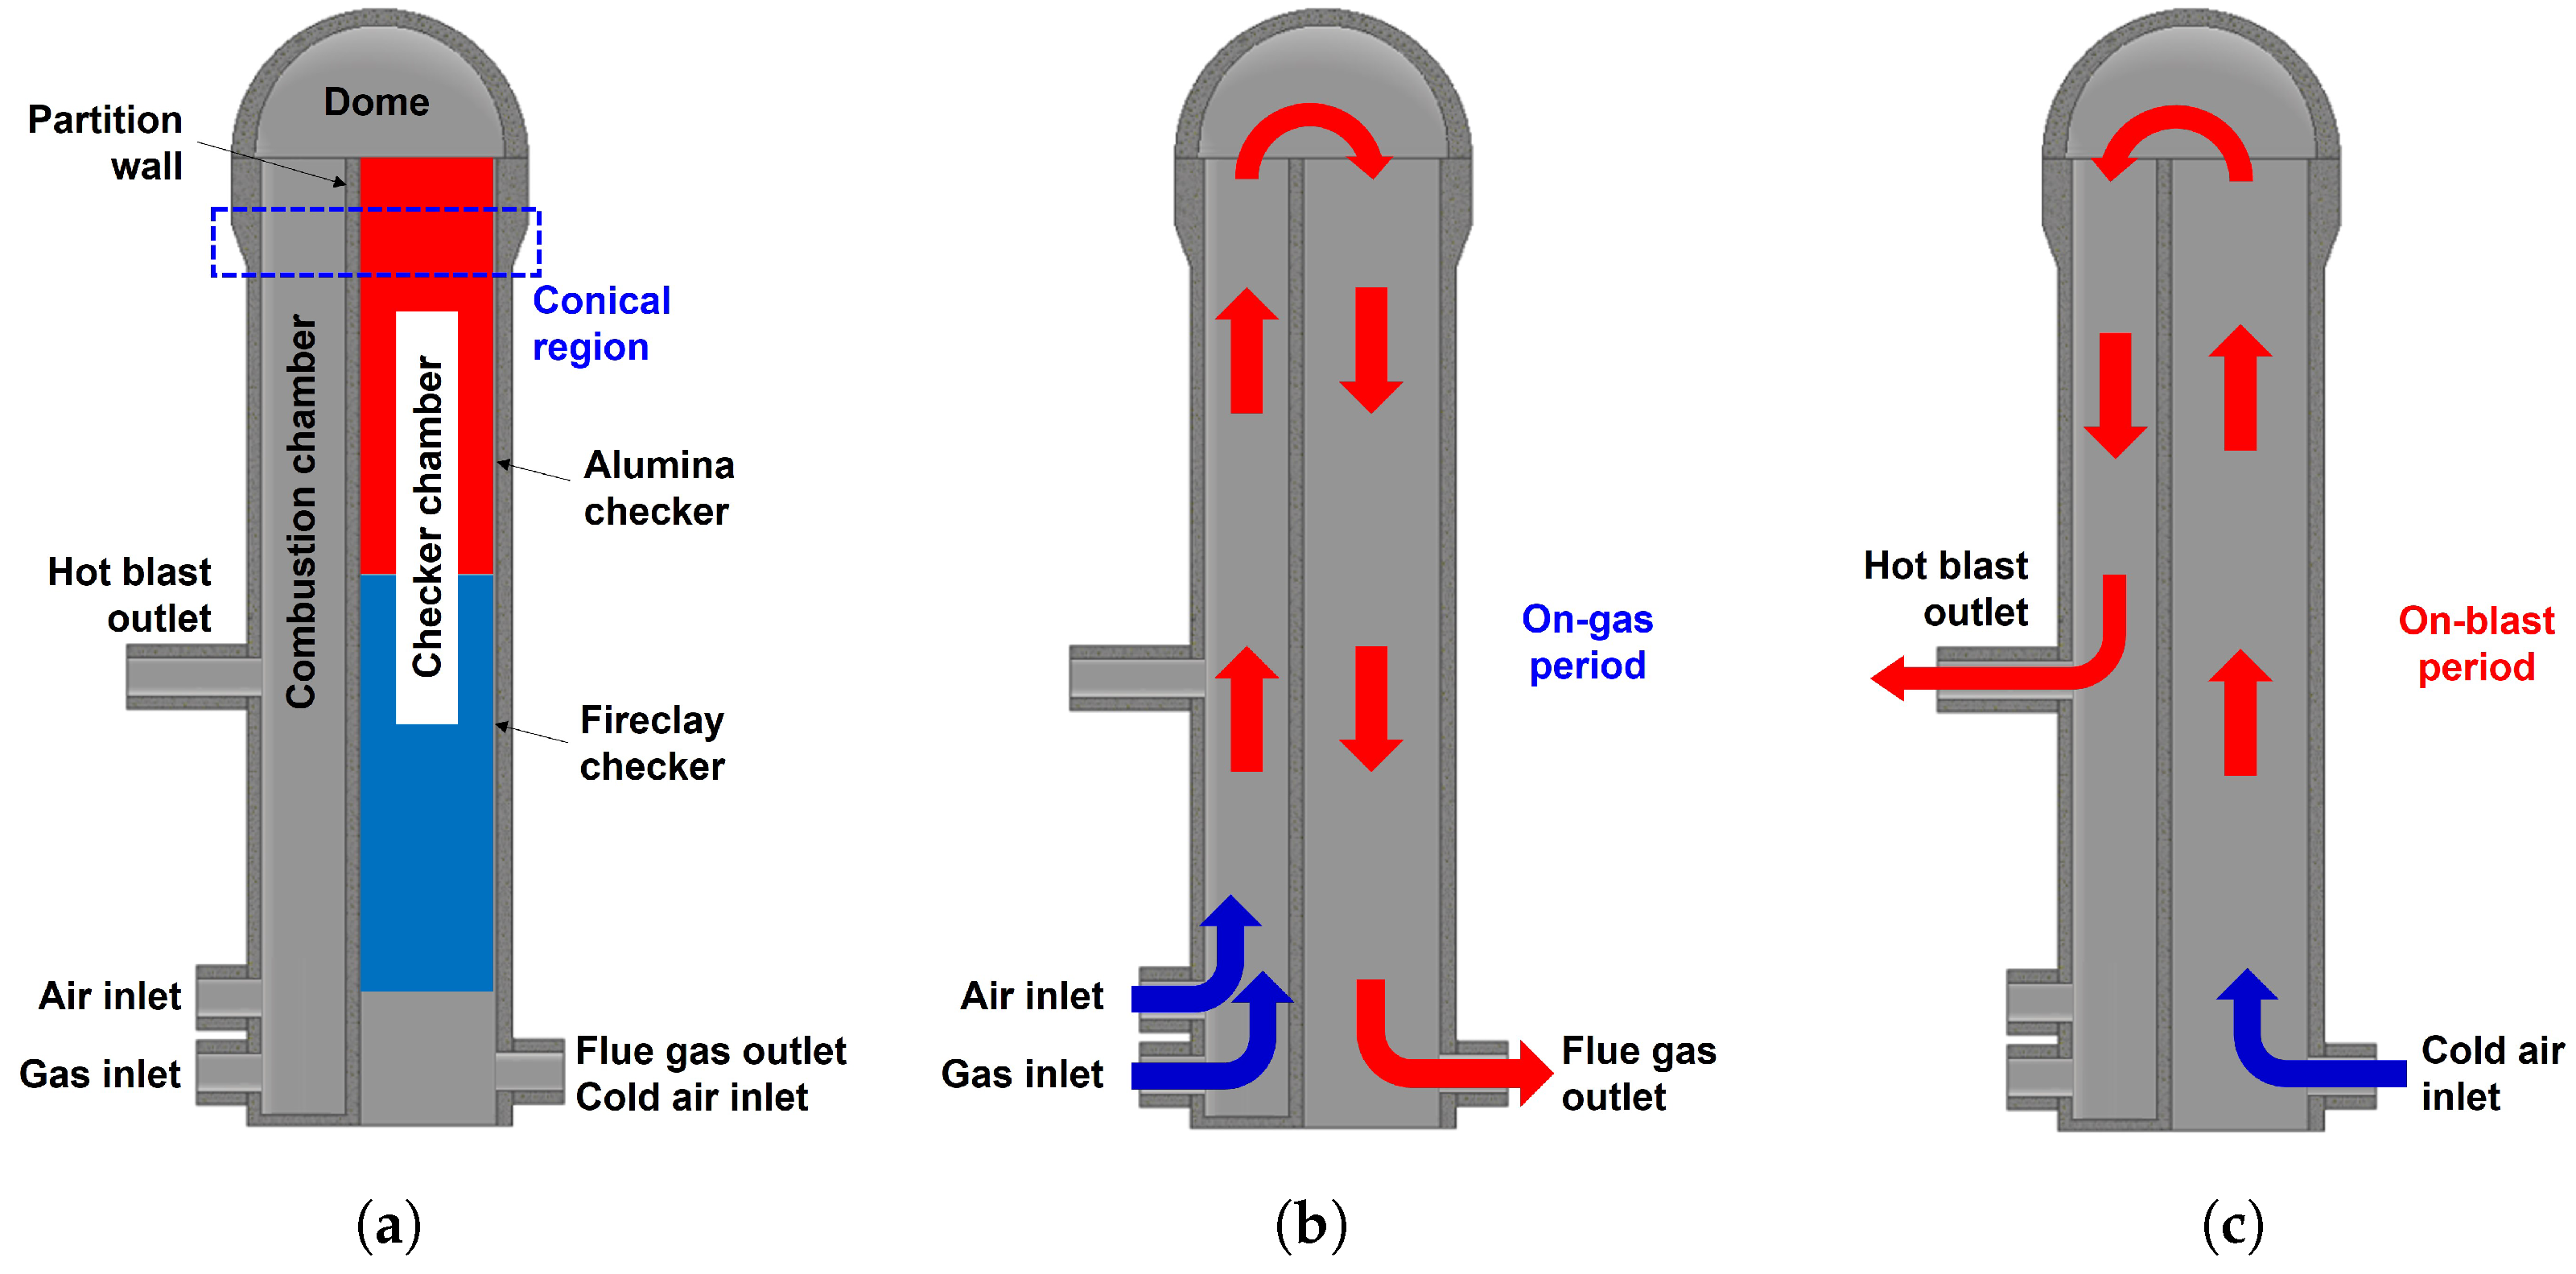
Figure 1. (a) Schematic of the internal combustion hot blast stove, (b) fluid flow in on-gas, and (c) on-blast periods.
Processes 11 00707 g001
Figure 2. Shape of the checker brick. D is the hole diameter, and L is the distance between the holes.
Processes 11 00707 g002
Figure 3. Variables stored in a cell centre P of a wall adjacent cell.
Processes 11 00707 g003
Figure 4. A node of the structural analysis mesh with Cartesian coordinate s, which is to be interpolated, and three cell centres of wall-adjacent cells of the CFD mesh, which are closest from the node, with the Cartesian coordinates x 1 , x 2 , and x 3 . (The prime symbol indicates that the coordinates are transformed from the original basis ( e 1 , e 2 , e 3 ) to the basis ( e 1 , e 2 , e 3 )).
Processes 11 00707 g004
Figure 5. Types of refractories applied to the hot blast stove.
Processes 11 00707 g005
Figure 6. (a) Temperature and velocity magnitude extraction line for grid independence test (centre of the combustion chamber), and grid independence test results for (b) temperature and (c) velocity magnitude profiles.
Processes 11 00707 g006
Figure 7. Meshes used for the (a) CFD and (b) FE analyses.
Processes 11 00707 g007
Figure 8. (a) The fluid velocity with (b) streamline and (c) temperature profile in the middle of the on-gas period ( t = 40 min).
Processes 11 00707 g008
Figure 9. (a) The fluid velocity with (b) streamline and (c) temperature profile in the middle of the on-blast period ( t = 130 min).
Processes 11 00707 g009
Figure 10. Temperature distributions of the refractory linings (a) in the middle of the on-gas period ( t = 40 min) and (b) the on-blast period ( t = 130 min).
Processes 11 00707 g010
Figure 11. The temperature change in the marked region of the combustion chamber wall through the thickness direction during the operation. The marked region showed the most fluctuating temperature during the operation.
Processes 11 00707 g011
Figure 12. Temperature distribution of the shell during the operation.
Processes 11 00707 g012
Figure 13. (a) The maximum and (b) middle principal stress distributions of the shell.
Processes 11 00707 g013
Figure 14. The maximum and middle principal stress of the conical region along the circumferential direction.
Processes 11 00707 g014
Table 1. Mass fraction of the fuel gas.
ComponentCO2O2COH2H2ON2
Composition (%)18.10.124.50.30.256.8
Table 2. Material properties of the checker bricks.
Checker TypeDensity
(kg/m3)
Thermal Conductivity (W/m·K)Specific Heat Capacity (J/kg·K)
Temperature (K)Temperature (K)
30010002000300500100015002000
Alumina2.571.701.781.96823994117112491284
Fireclay2.291.361.481.55799965113812141248
Table 3. Material properties of the refractory linings.
MaterialDensity
(g/cm3)
Thermal Conductivity (W/m·K)Thermal Expansion
Coefficient ( 10 5 K 1 )
at 500 °Cat 1000 °C
Refractory A2.561.771.7964
Refractory B2.241.751.7962
Refractory C2.111.751.7859
Refractory D0.780.240.3955
Disclaimer/Publisher’s Note: The statements, opinions and data contained in all publications are solely those of the individual author(s) and contributor(s) and not of MDPI and/or the editor(s). MDPI and/or the editor(s) disclaim responsibility for any injury to people or property resulting from any ideas, methods, instructions or products referred to in the content.