Article

Dependence of the Staphylococcal Volatilome Composition on Microbial Nutrition

by
Carrie L. Jenkins
1,2 and
Heather D. Bean
1,2,*
1
School of Life Sciences, Arizona State University, Tempe, AZ 85287, USA
2
Center for Fundamental and Applied Microbiomics, The Biodesign Institute, Arizona State University, Tempe, AZ 85287, USA
*
Author to whom correspondence should be addressed.
Metabolites 2020, 10(9), 347; https://doi.org/10.3390/metabo10090347
Submission received: 20 July 2020 / Revised: 16 August 2020 / Accepted: 23 August 2020 / Published: 27 August 2020

Abstract

:
In vitro cultivation of staphylococci is fundamental to both clinical and research microbiology, but few studies, to-date, have investigated how the differences in rich media can influence the volatilome of cultivated bacteria. The objective of this study was to determine the influence of rich media composition on the chemical characteristics of the volatilomes of Staphylococcus aureus and Staphylococcus epidermidis. S. aureus (ATCC 12600) and S. epidermidis (ATCC 12228) were cultured in triplicate in four rich complex media (brain heart infusion (BHI), lysogeny broth (LB), Mueller Hinton broth (MHB), and tryptic soy broth (TSB)), and the volatile metabolites produced by each culture were analyzed using headspace solid-phase microextraction combined with comprehensive two-dimensional gas chromatography—time-of-flight mass spectrometry (HS-SPME-GC×GC-TOFMS). When comparing the chemical compositions of the staph volatilomes by the presence versus absence of volatiles produced in each medium, we observed few differences. However, when the relative abundances of volatiles were included in the analyses, we observed that culturing staph in media containing free glucose (BHI and TSB) resulted in volatilomes dominated by acids and esters (67%). The low-glucose media (LB and MHB) produced ketones in greatest relative abundances, but the volatilome compositions in these two media were highly dissimilar. We conclude that the staphylococcal volatilome is strongly influenced by the nutritional composition of the growth medium, especially the availability of free glucose, which is much more evident when the relative abundances of the volatiles are analyzed, compared to the presence versus absence.

Graphical Abstract

1. Introduction

In vitro cultivation of staphylococci is fundamental to both clinical and research microbiology, and the selection of growth medium substantially influences staph growth rates, genetic integrity, pathogenicity, and metabolic capacity [1,2,3,4,5]. Depending on the species, staphylococci possess remarkable genetic plasticity, regulated by two-component systems that enable rapid responses to fluctuations in environmental conditions [1,4,6]. Additionally, staph is able to survive under host sequestration (also known as nutritional immunity) and microbial competition, both of which influence the availability of essential nutrients and carbon sources [1,4,6,7,8,9,10,11,12,13,14,15]. Like many heterotrophic bacteria, glucose is the preferred carbon and energy source for staphylococci, which employ catabolite repression control to regulate metabolism in glucose-rich environments. Under catabolite repression control in glucose-replete conditions, the tricarboxylic acid cycle is markedly downregulated, forcing catabolism through the Embden–Meyerhof–Parnas pathway (EMP; glycolysis) and the pentose phosphate pathway (PPP) [16,17,18,19]. Once glucose and other hexose sugars are depleted, other nutrient sources, such as peptides, will be imported and catabolized. Alternatively, under starvation conditions, intracellular biomass (amino acids, proteins, RNA) will become substrates of endogenous metabolism [17,20,21].
Four common media used for the enrichment of staph are brain heart infusion (BHI), lysogeny broth (LB), Mueller Hinton broth (MHB), and tryptic soy broth (TSB). All of these are complex media with high contributions of amino acids or peptides to the total organic dry weight, ranging from approximately 66% in LB to 89% in TSB and 93% in BHI and MHB. Thus, these media provide nitrogen-replete conditions for protein and nucleotide synthesis during growth. In contrast, the sugar content of these media substantially differs. TSB and BHI contain 11% and 7% dextrose (α-d-glucose), respectively, by dry organic weight, while MHB provides 7% starch (amylose and amylopectin), which can be hydrolyzed by most staphylococci via α-amylase to generate free sugars for glycolysis [22]. LB contains no added dextrose or starches, and the yeast extract ingredient has been shown to contribute less than 100 µM fermentable sugar equivalents (nucleotides, sugar phosphates, or oligosaccharides), which substantially slow the growth of Escherichia coli and S. aureus once the sugars are depleted [23,24,25]. A few other notable differences in the media may influence staph metabolism. For instance, MHB has low concentrations of thymine and thymidine, which will require upregulations in thymidine precursor biosynthesis during replication [26,27]. Additionally, the proteins in BHI, LB, and TSB have been enzymatically digested, generating random length oligopeptides, while MHB contains an acid digest of casein, which generates free amino acids that are not as easily imported by staphylococci [28]. Lastly, the low lipid content of TSB, contributing <0.05% dry organic weight, may introduce a differential effect on staph metabolism compared to other media, as both S. aureus and S. epidermidis must activate de novo fatty acid biosynthetic pathways when exogenous fatty acids are unavailable for assimilation [29,30,31].
We are specifically interested in the role that growth media play on the production of the volatile metabolome (or volatilome) of staph and other microbes. In BHI, LB, MHB, and TSB, proteolysis and/or glycolysis will dominate the production of volatiles. Amino acid catabolism generates sulfur and nitrogen-containing volatiles (e.g., dimethyl disulfide, pyrazines, nitriles, and pyrroles), as well as aromatic compounds (e.g., aromatic alcohols, aldehydes, and ketones) from the catabolism of aromatic amino acids [32,33,34]. Additionally, acids, aldehydes, ketones, and alcohols are formed by amino acid degradation via deamination, followed by decarboxylation and reduction [32,33,34]. Catabolism of glucose to pyruvate and acetyl-CoA leads to the synthesis of short-chain fatty acids and esters, which can be reduced to aldehydes, alcohols, and saturated and unsaturated hydrocarbons [32,33,34]. Extrapolating these observations to predict effects on the volatilome of staph is challenging, though two comparative analyses of bacterial volatiles in rich media have been performed and inform our hypotheses. Dryahina and colleagues [35] analyzed the volatilomes of ten isolates each of S. aureus, Pseudomonas aeruginosa, Stenotrophomonas maltophilia, and Burkholderia cepacia complex in BHI, MHB, and nutrient broth (NB), which like LB contains yeast extract and no added sugars or starches. S. aureus produced the highest proportion of acids when grown in BHI, the medium with readily accessible sugars, and when grown in the no-sugar medium, NB, it produced the highest proportion of hydrocarbons. Rees and colleagues [36] characterized the volatilomes of Klebsiella pneumoniae clinical isolates cultivated in BHI, LB, MHB, and TSB. When comparing the four media by the numbers of compounds produced in each, similar chemical compositions of the K. pneumoniae volatilomes were observed. However, when clustering the volatilomes using the relative abundances of the volatiles, they observed significant media-dependent differences in the volatilomes, which clustered by high-glucose media (BHI and TSB) versus low-glucose media (LB and MHB).
The primary goal of this study was to determine how the chemical compositions of the volatilomes of S. aureus and S. epidermidis are affected by the nutrients of the growth medium. Because glucose is the preferred carbon source of staphylococci, we expected that media with high concentrations of glucose would support the highest overall abundances of volatiles. We also hypothesized that high-glucose media would activate catabolite repression control, and thus a narrower range of metabolic pathways will be engaged, which will result in the production of a lower diversity of volatile chemical classes. Additionally, we expected to observe a higher relative abundance of aldehydes, acids and esters, ketones and alcohols in high-glucose media versus low-glucose media. Conversely, media without glucose will not induce catabolite repression control and will, therefore, have a higher relative abundance of volatiles derived from amino acid catabolism, e.g., nitrogen and sulfur compounds. To test our hypotheses, we cultured S. aureus and S. epidermidis in BHI, LB, MHB, and TSB and analyzed the volatilomes using headspace solid-phase microextraction combined with comprehensive two-dimensional gas chromatography – time-of-flight mass spectrometry (HS-SPME-GC×GC-TOFMS). We compared the volatilomes by the number and relative abundance of volatiles in each chemical class. Additionally, we compared the analyzed volatilomes to the literature on S. aureus and S. epidermidis volatiles and added several compounds to the volatilomes of both species by reporting them here for the first time.

2. Results and Discussion

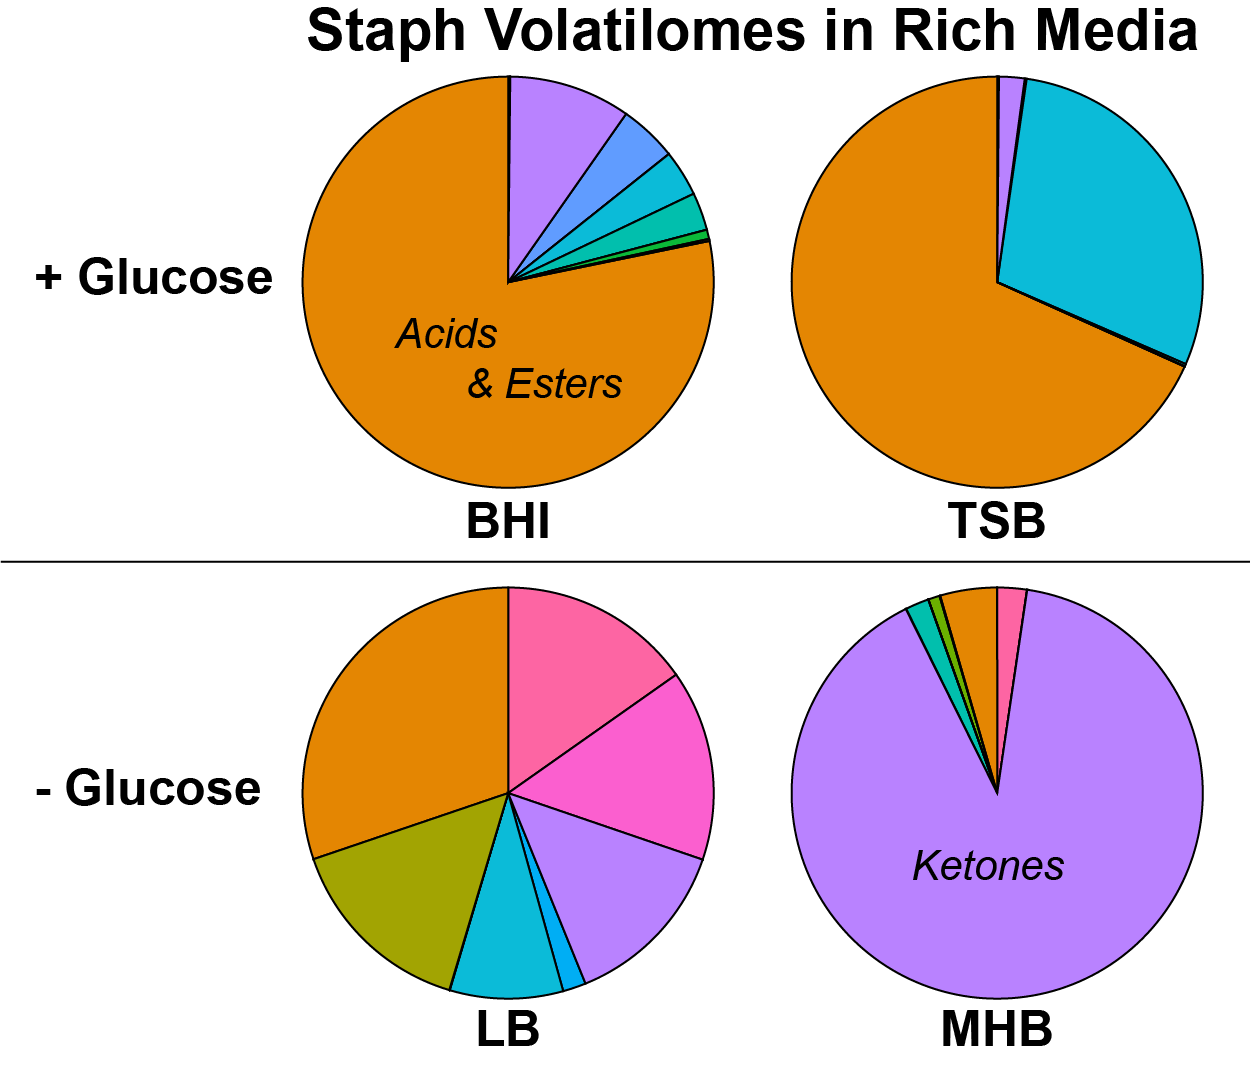
2.1. Staphylococcal Volatile Metabolites Produced in Rich Media

Aerobic growth of S. aureus and S. epidermidis in four complex media (BHI, LB, MHB, and TSB) yielded 337 non-redundant peaks (Table S1 in the Supplementary Materials), 85 of which we were able to assign names based on mass spectral and retention index matches to the NIST library and prior published analyses of Staphylococcus spp. volatiles (Table 1). We assigned chemical classifications to an additional 61 volatiles that were identified to a Metabolomics Standards Initiative (MSI) level 3 (Table S1). Of the level 2 or level 3 volatiles, 102 were detected in S. aureus culture filtrates, 110 were detected in S. epidermidis filtrates, and 66 volatiles were produced by both species. We detected seven volatiles in this study, which have been frequently detected in prior analyses of S. aureus, S. epidermidis, and other staphylococci: 3-methylbutanoic acid, 3-methylbutan-1-ol, 3-methylbutanal, 2-phenylacetaldehyde, butan-2-one, butane-2,3-dione, and undecan-2-one. Sixty-eight compounds from this study were named for the first time as volatile metabolites of either S. aureus (n = 9), S. epidermidis (n = 37), or both (n = 22), and 12 of them have not been previously described for any bacterium (Table 1).
We identified 36 volatiles that were specific to S. aureus and 44 to S. epidermidis. Two S. aureus-specific volatiles that were detected in the greatest relative abundance in BHI and TSB filtrates were acetic acid and 3-methylbut-3-enyl acetate (isopentenyl alcohol acetate). We posited that the former was resulting from a process called overflow metabolism through the reversible Pta-AckA pathway, in which bacteria will excrete acetate during rapid growth via glycolysis [1,37]. Upon glucose depletion, acetate is assimilated by the same pathway for energy production, and, therefore, the absence of similar amounts of acetate in S. epidermidis BHI and TSB cultures may be related to growth kinetics (i.e., sampling at only one time point). 2,4-Dimethyl-1H-pyrrole, a constituent of porphobilinogen, the major precursor of heme and other bacterial siderophores, was detected exclusively in S. epidermidis filtrates of BHI and LB in high abundance. We were unable to specify this metabolite as a product of anabolism or catabolism, but one possibility is that the propionic acid portions of porphobilinogen are stripped off as easily available carbon and energy sources by S. epidermidis, and the 2,4-dimethyl-1H-pyrrole is discarded as a catabolic byproduct. Additional compounds detected solely in the filtrates of S. epidermidis were benzaldehyde (MHB only), 2-phenylacetaldehyde (all media), and (methyldisulfanyl)methane (BHI and LB), though all three compounds have been reported in prior analyses of S. aureus volatilomes [38,39,40,41].

2.2. Chemical Composition of the S. aureus and S. epidermidis Volatilomes

We evaluated the composition of the staph volatilome both by the numbers of volatiles in each of the 16 chemical classes (i.e., presence vs. absence) and by the relative abundances of the volatiles in each class using the 146 level 2 and level 3 volatiles. When defining the composition by the number of volatiles, a compound that was detected in any one of the S. aureus or S. epidermidis cultures in any medium was counted toward the volatilome. When defining the volatilome composition by the relative abundance, the highest peak intensity for each compound across any of the S. aureus or S. epidermidis cultures was added to the total. By the number of volatiles, the total staph volatilome, which is a combination of S. aureus and S. epidermidis in all four complex media, was dominated by hydrocarbons (HC, n = 42, 29%), followed by aromatic compounds (aggregated across all aromatic compound categories; ARO, n = 26, 18%), ketones (KET, n = 23, 16%), sulfur compounds (SULF, n = 12, 8%), alcohols (ALC, n = 12, 8%), and acids and esters (A/E, n = 11, 8%) (Figure 1a,b). The composite volatilomes of S. aureus and S. epidermidis across all four media were quite similar to each other, but the proportions of more oxidized compounds to hydrocarbons was higher in S. aureus compared to S. epidermidis, with the most pronounced differences observed in the numbers of acids and esters. When characterizing the volatilomes by the relative abundances of the chemical classes, a different profile was revealed in which acids and esters (which are primarily short-chain fatty acids) dominated (Figure 1c,d). Though high-confidence comparisons between class intensities could not be made due to variations in ionization efficiency and a lack of chemical standards, the diminishing contribution of hydrocarbons relative to acids and esters in the abundance-based characterization of the volatilome was notable.

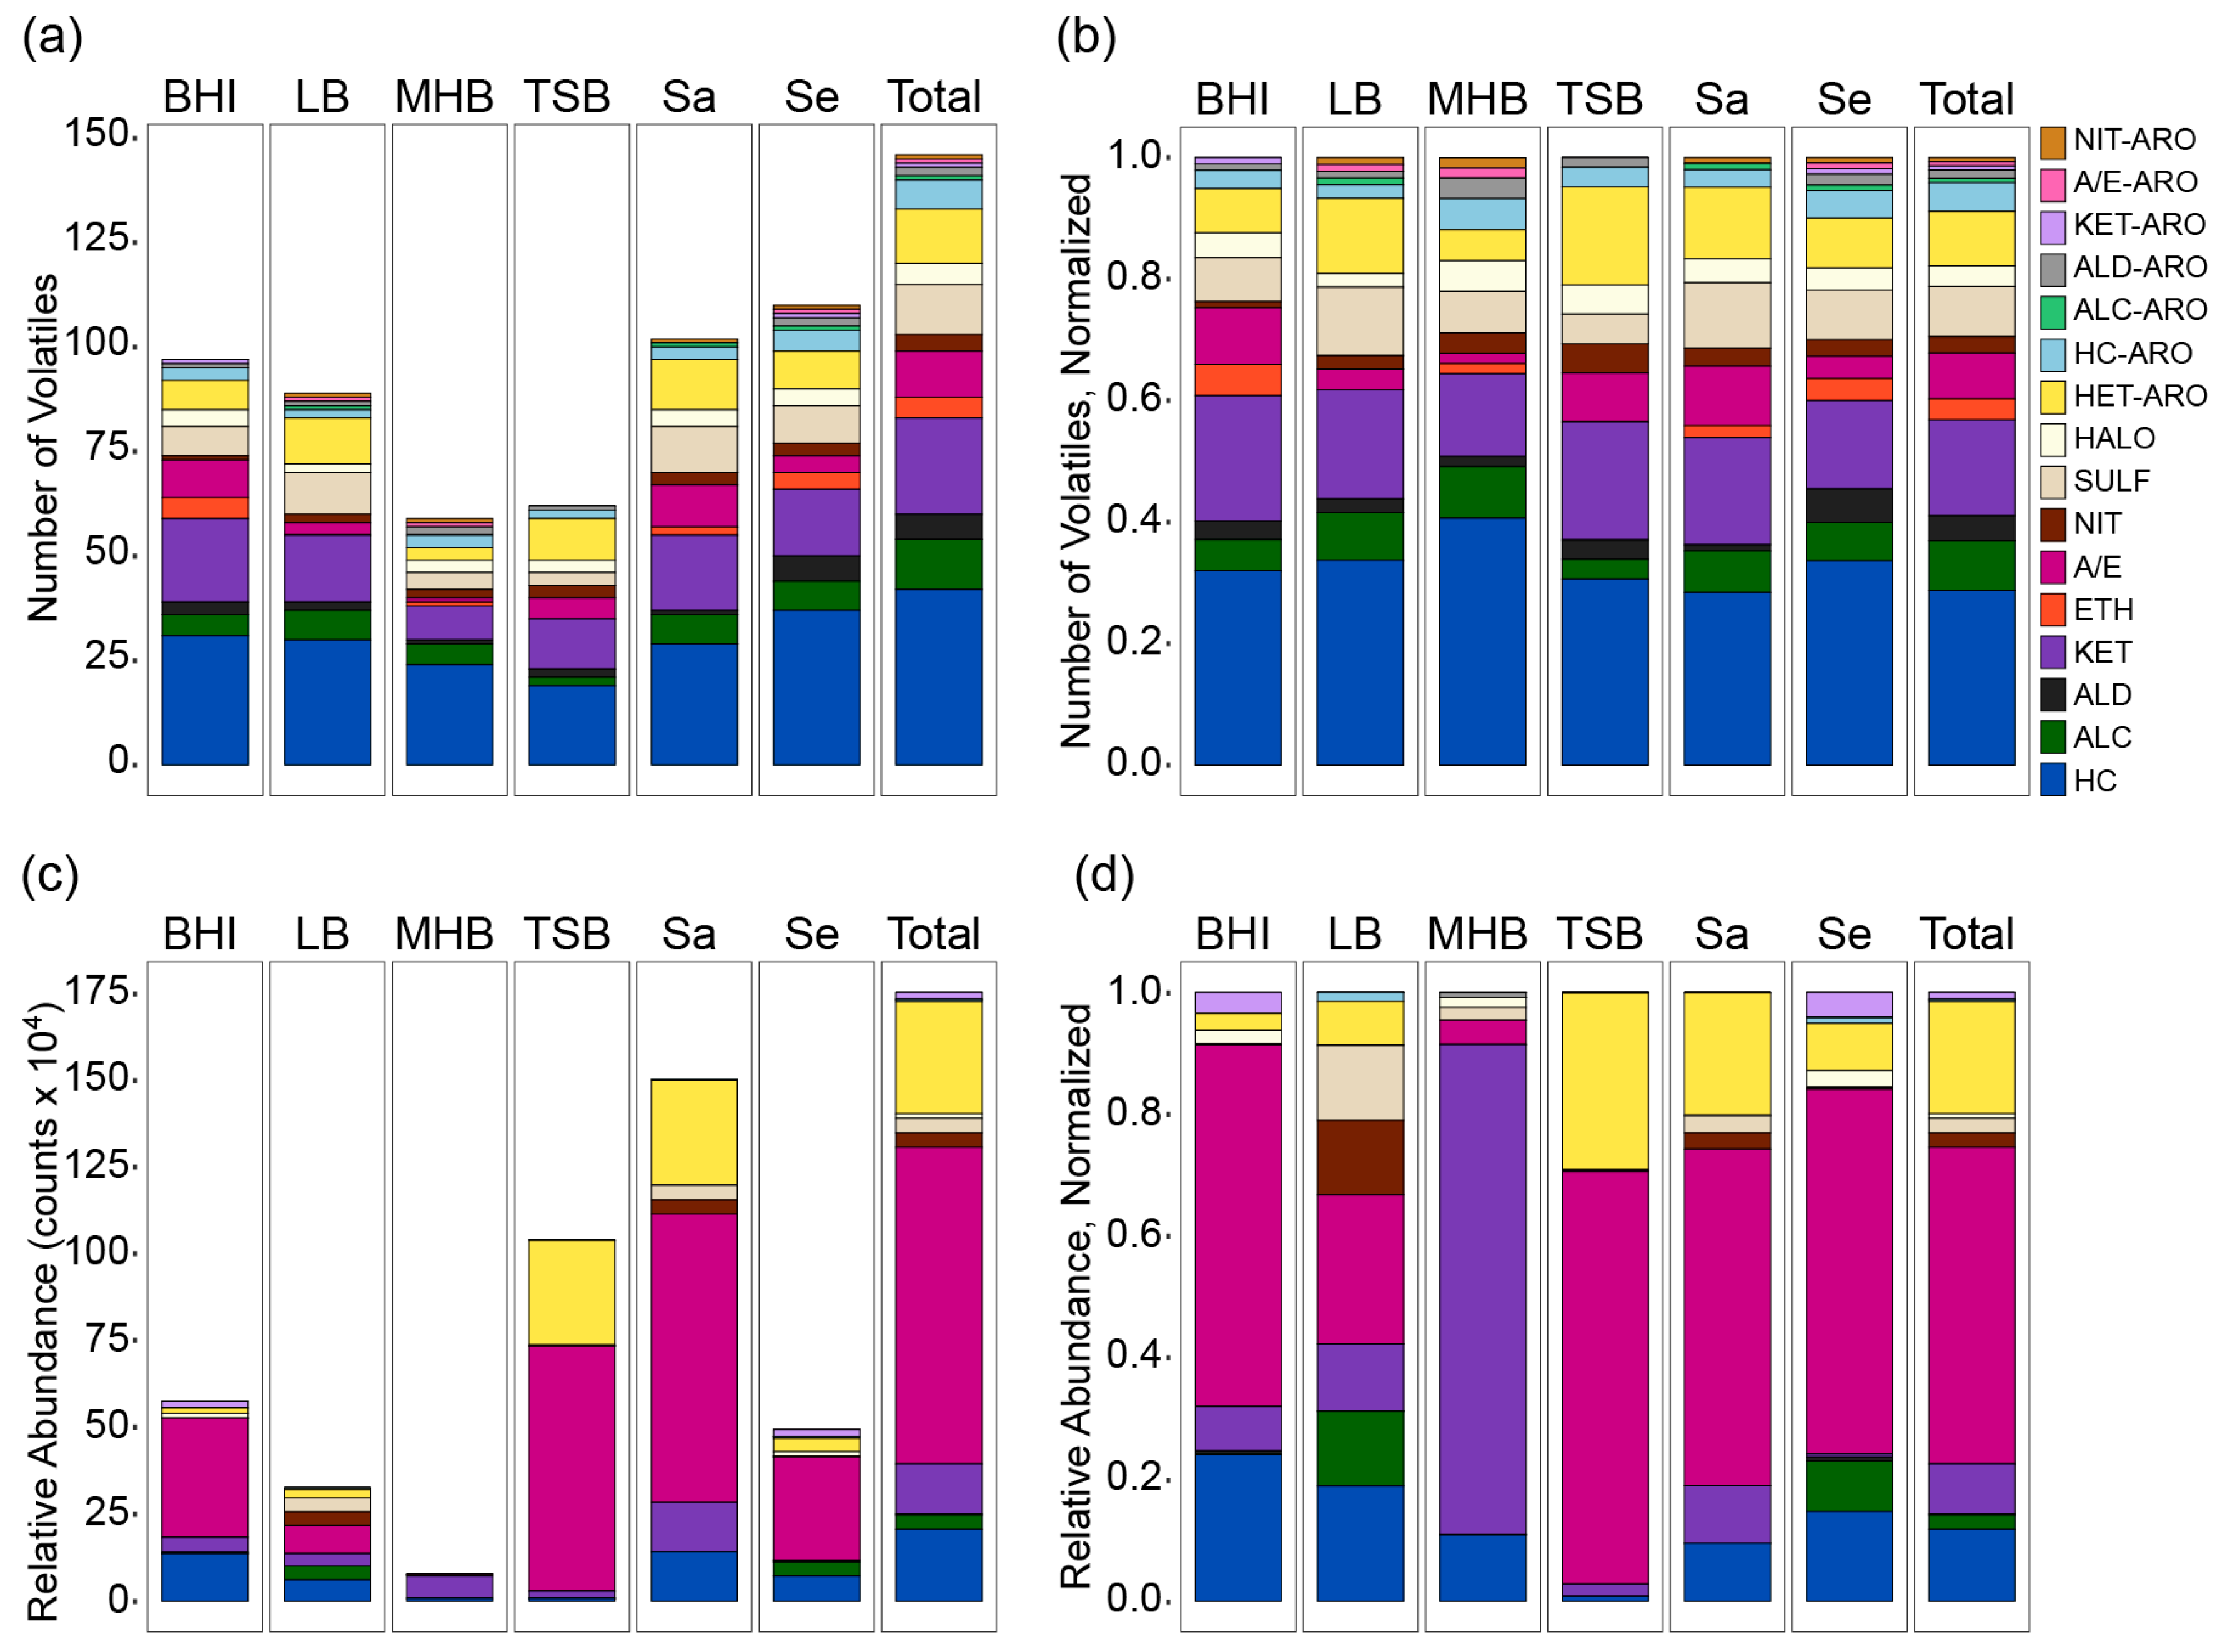
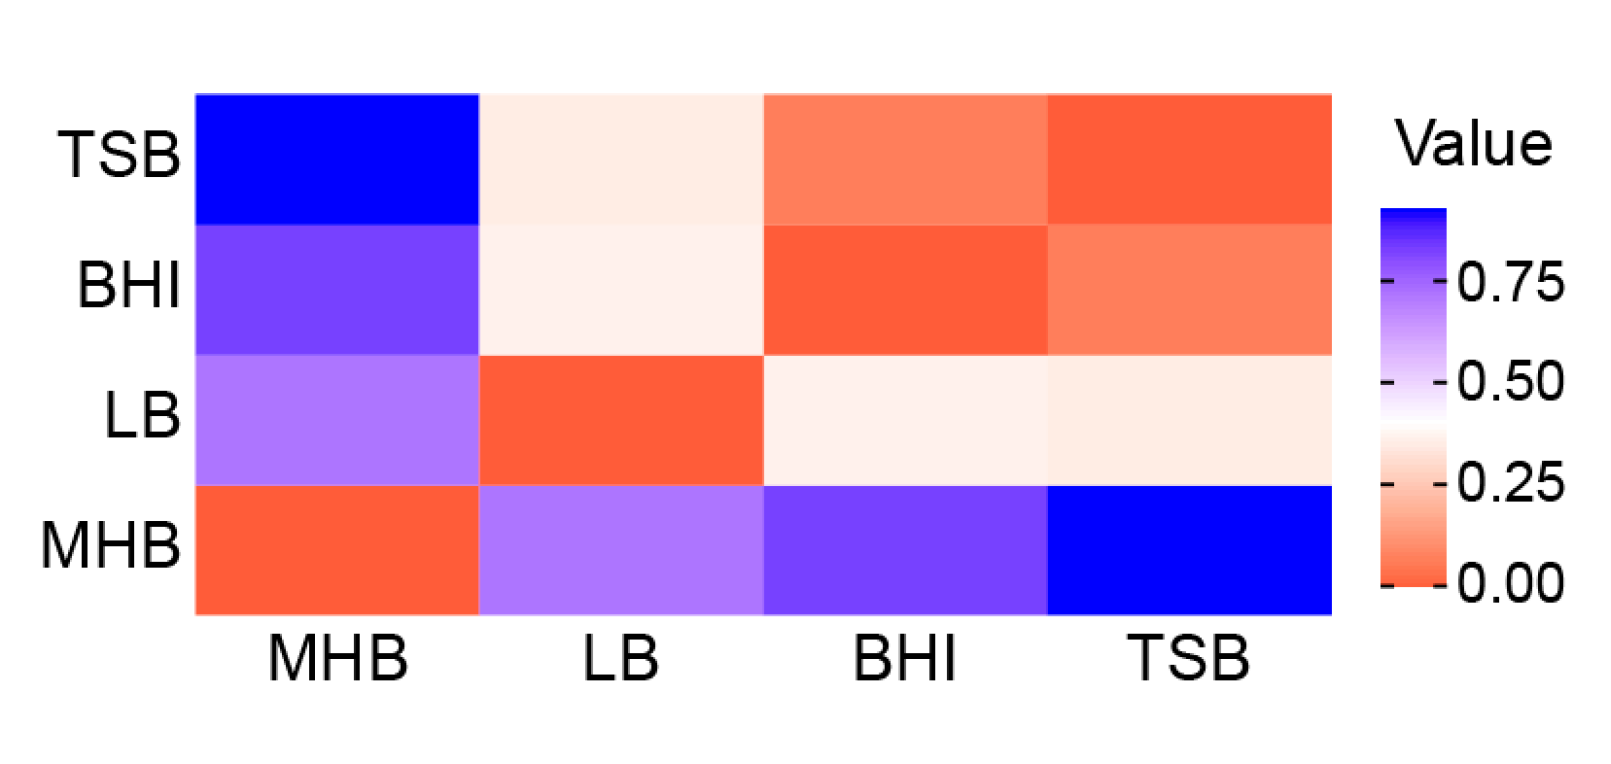
2.3. Influence of Medium and Nutrition on the Chemical Composition of the Volatilome

Based on differences in glucose concentration in the four complex media, and its influence on Staphylococcus spp. catabolite repression control, we posited that the volatilome of both species would strongly vary by media. Interestingly, whether we characterized the volatilome by numbers of volatiles (Figure 1a,b) or by relative abundance (Figure 1c,d) determined whether we classified this hypothesis as true or false. When viewed by the numbers of volatiles in each chemical class, the staph volatilomes in each medium were relatively uniform (Figure 1a,b). For example, in all four media, hydrocarbons were the most numerous, and hydrocarbons plus ketones made up about 50% of all volatiles detected. However, some notable variations did occur. First, the numbers of volatiles that were produced in each medium did not correlate with the availability of free glucose (Figure 1a). Second, the two high-glucose media had some interesting differences in their volatilome compositions. The TSB volatilome contained the lowest numbers of alcohols and sulfurous volatiles, while BHI produced proportionally high numbers of acids and esters but the fewest aromatics of any kind. LB, a low glucose medium, produced the greatest number of alcohols and sulfurs but the fewest halogens and no detectable ethers. Although MHB cultures had the lowest number of identified analytes, it produced a staph volatilome with the largest percentage of hydrocarbons and the lowest percentage of ketones.
Comparing the staphylococcus volatilomes across the rich media not by numbers of compounds but by the relative abundance of volatiles in each chemical class told a contradictory story (Figure 1c,d). First, the relative abundance of volatiles produced in each medium did trend with the availability of glucose (TSB > BHI > LB > MHB). In addition, while acids and esters comprised 8% of the total number of volatiles detected across all four media (Figure 1b), by relative abundance, they made up approximately half (52%) of all classified volatiles, and heteroaromatics were the second most abundant at 18% (Figure 1d). Hydrocarbons, by contrast, represented only 12% of the volatilome. Additionally, differences between the four media were much more pronounced when the relative abundances of the volatiles were considered, and interesting patterns emerged related to glucose availability and catabolite repression control (Figure 1d). We observed that the two high-glucose media were the primary sources of the acids and esters in the staphylococcal volatilome, with this class representing approximately two-thirds of the volatiles produced in BHI and TSB. By contrast, staph grown in LB and MHB, the two low-glucose media, produced acids and esters at 25% and 4%, respectively. The dependency of acid production on the availability of free glucose was consistent with prior observations of the volatilome of S. aureus grown in BHI, MHB, and NB [35]. More strikingly, the overall volatilome compositions of LB and MHB were very different, with the former producing a relatively even distribution of many different chemical classes, and the latter almost exclusively producing ketones, which might be caused by growth defects due to the poor uptake of amino acid monomers in MHB relative to polypeptides in LB by staphylococci [28]. The non-acid/ester portion of the volatilomes produced in high-glucose media were also unique, with TSB dominated by heteroaromatics and BHI by hydrocarbons.
We quantified the chemical diversities and dissimilarities of the volatilomes in each medium using Shannon diversity and Morisita–Horn methods, respectively, and the relative abundances of volatile chemical classes (Table S5). We observed that the Shannon diversities of the staph volatilomes in BHI and TSB were relatively low (H = 0.84 and 0.73, respectively) compared to LB (H = 1.78), while their dissimilarities to each other were the lowest of any pair-wise comparison (CMH = 0.071) (Figure 2). Together, these data suggested that adding glucose to the medium would regulate the composition of the staph volatilome by inducing catabolite repression control and enhancing the production of acids and esters. When glucose is unavailable, a wider variety of metabolic pathways will be induced based upon the carbon sources specific to each medium, thus resulting in volatilome compositions that are more unique and possibly more diverse. If true, we predict that the addition of glucose to LB or MHB will enhance the production of acids and esters. We also predict that shorter growth times (e.g., 8 vs. 24 h) will reduce the differences we observed in the non-acid/ester portion of the BHI and TSB volatilomes, which we posit arose after glucose was exhausted from the medium and catabolite repression control was removed. Experiments to test these hypotheses remain for the future.

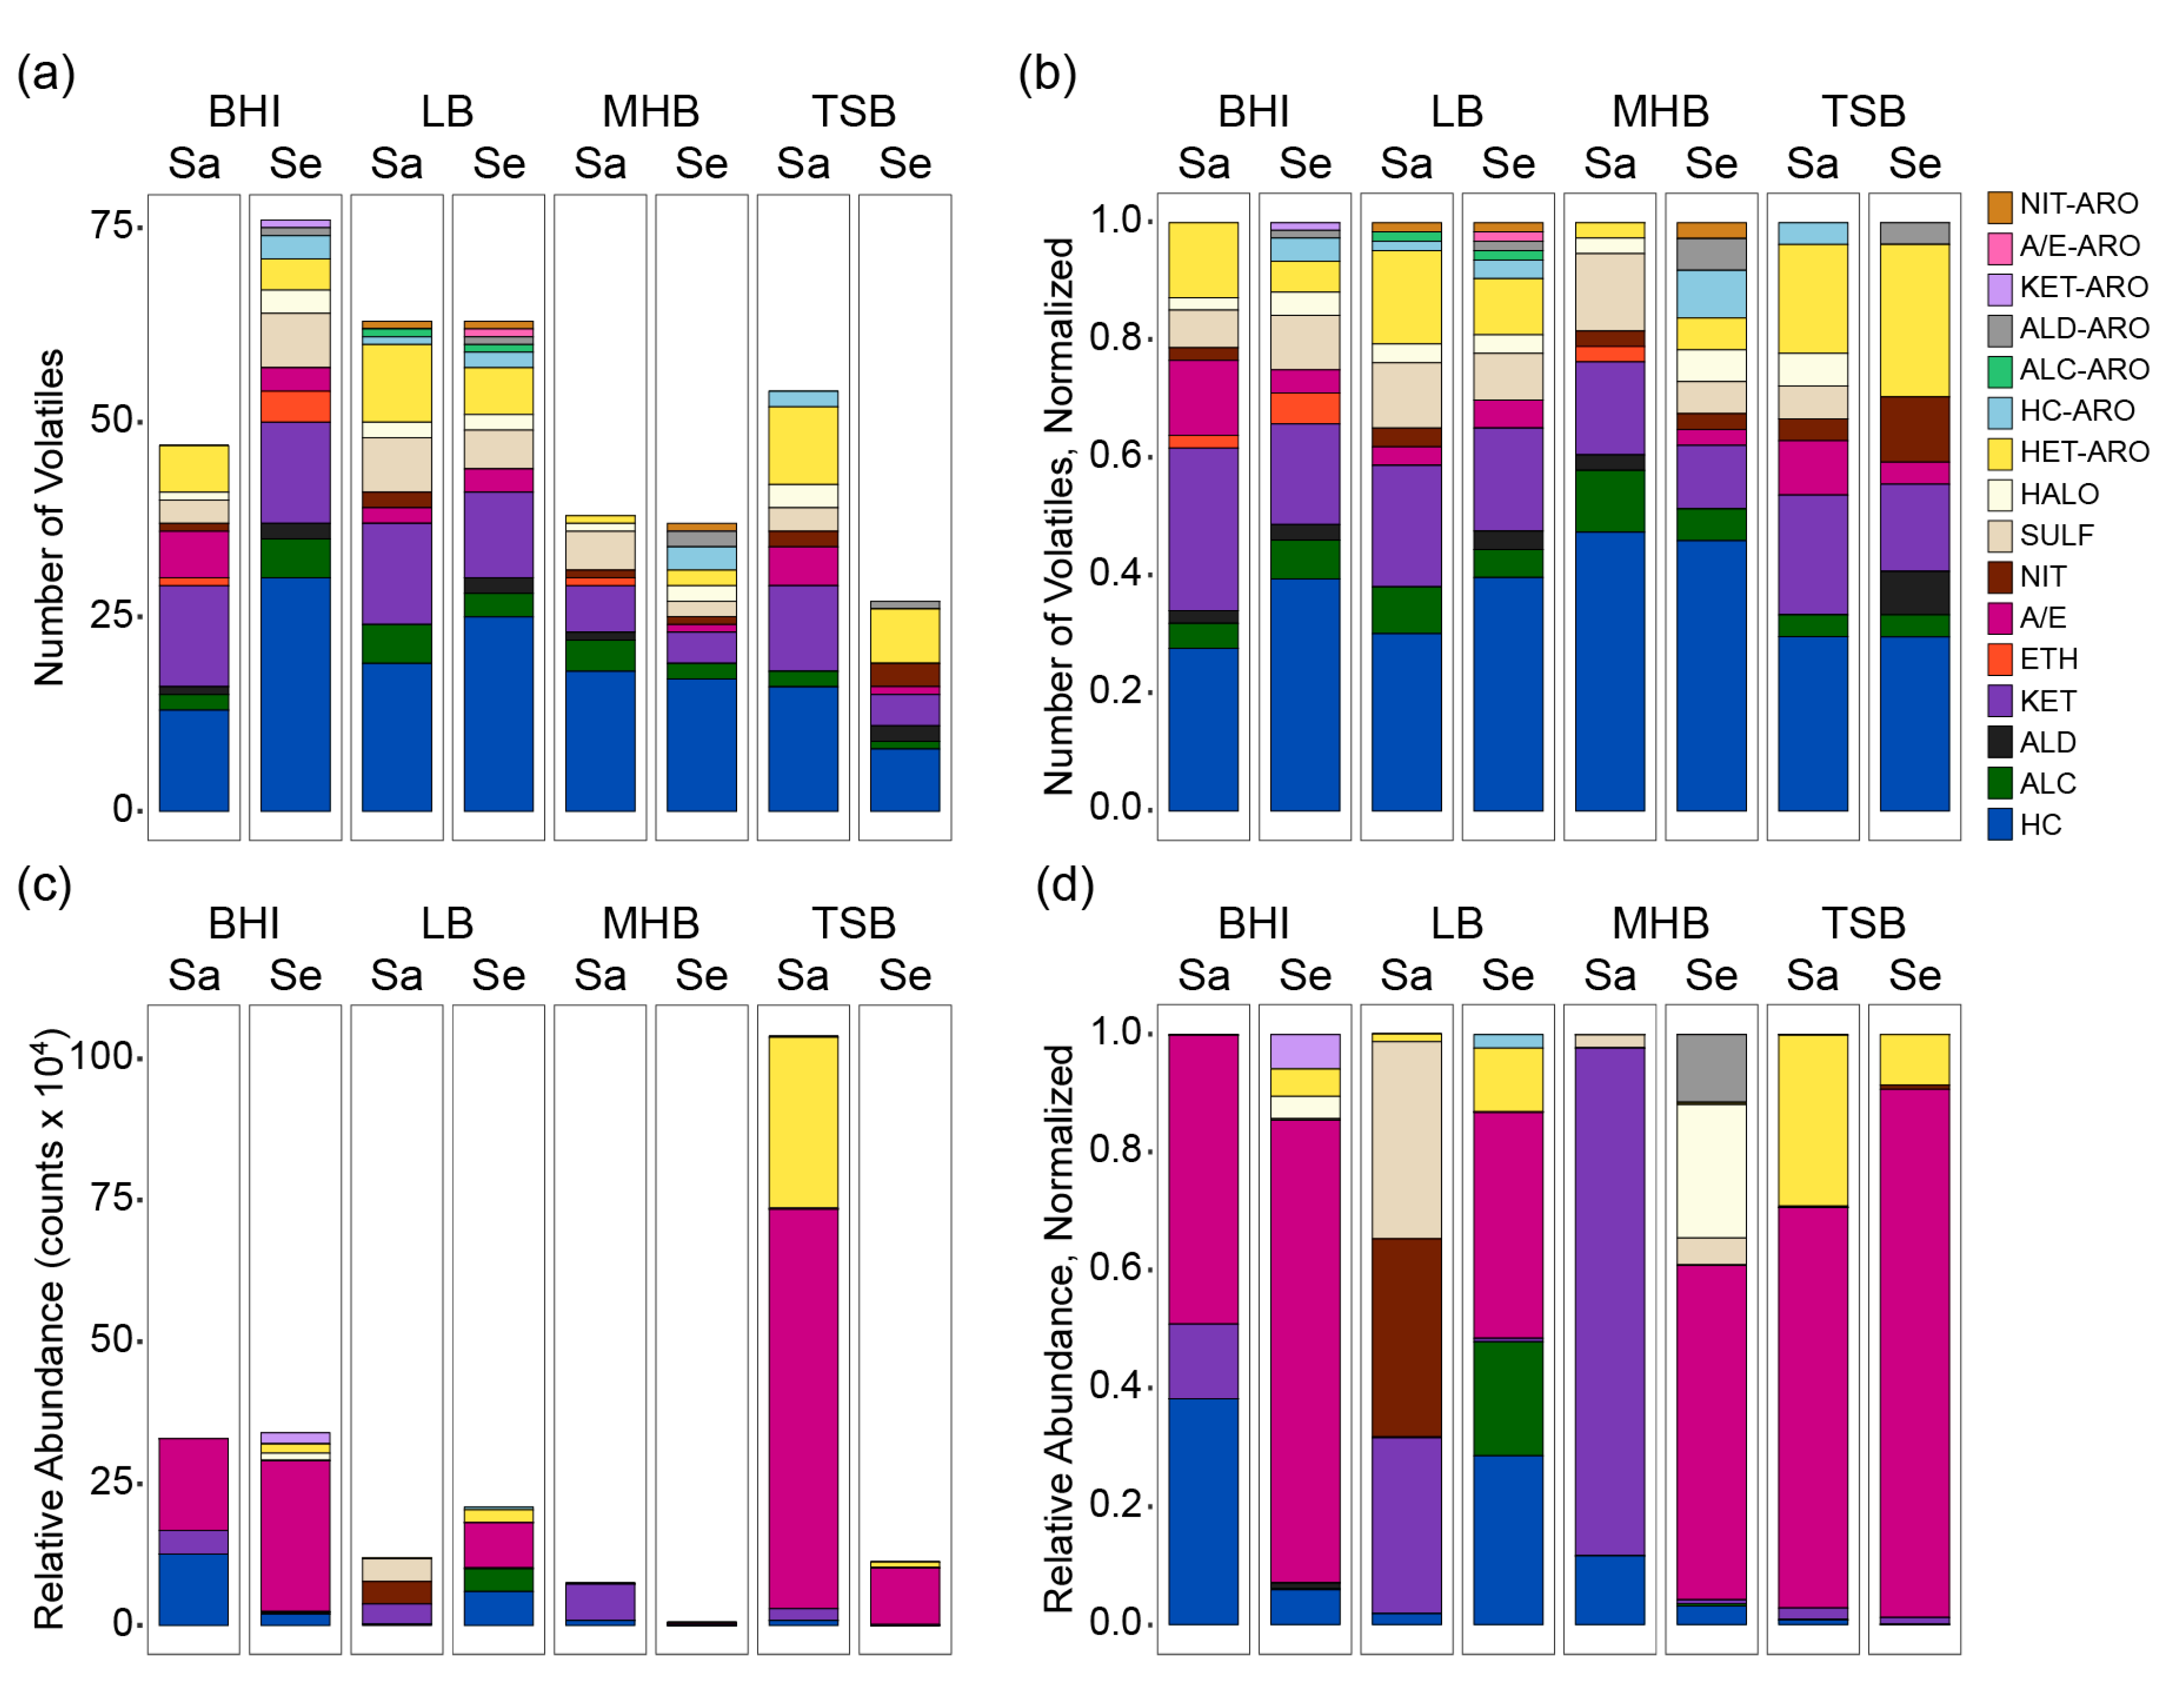
2.4. Species-Specific Responses to Medium Nutrition

We examined the species-specific responses to the four complex media to obtain a fuller understanding of staphylococcal responses to differences in nutrition (Figure 3). We saw that the number of volatiles produced by each species in each medium did not correspond to free glucose availability (Figure 3a), demonstrating that our prior observation of the staph volatiles was not a function of data aggregation (Figure 1a). We also observed that the volatilomes of both species were dominated by high numbers of hydrocarbons and ketones in all media, and in each medium, the ratio of hydrocarbons to ketones was larger in S. epidermidis than in S. aureus. When analyzing the volatilomes by the relative abundances of each chemical class (Figure 3c), we found that the relative abundance of S. aureus volatiles correlated to free glucose availability (TSB > BHI > LB > MHB), but the S. epidermidis volatilome did not (BHI > LB > TSB > MHB). We also observed that S. aureus seemed to be more strongly influenced by the presence or absence of free glucose, with half or more of the volatilome represented by acids and esters in the high glucose media and less than one percent in the low glucose media (Figure 3d). S. epidermidis, by contrast, produced abundant acids and esters in all four media, but at 78–89% of the total abundance in high-glucose media, and 38–57% in the low glucose media. Because we did not have time course sampling of the volatilomes, we could not determine if these differences were a function of greater relative production of acids and esters by S. epidermidis in all four media or reduced assimilation as an alternate carbon source in nutrient-depleted media. However, these snapshots supported the assertion by Filipiak and colleagues [64] who surmise that attempts to standardize optimal cultivation conditions by the selection of a single medium for all microorganisms—even two species of the same genus, as shown here—will insufficiently reveal the full spectrum of volatile metabolic compounds.

3. Materials and Methods

3.1. Bacterial Strains, Culture Conditions, and Metabolomics Analysis Sample Preparation

The volatilomes of S. aureus (ATCC 12600) and S. epidermidis (ATCC 12228) were analyzed after 24 h aerobic incubation at 37 °C in the following four filter-sterilized complex media: brain heart infusion broth (BHI) (Becton, Dickenson and Co., Franklin Lakes, NJ, USA) [77], lysogeny broth Lennox (LB) (Becton, Dickenson and Co., Franklin Lakes, NJ, USA), Mueller Hinton broth (MHB) —not cation-adjusted (Becton, Dickenson and Co., Franklin Lakes, NJ, USA) [77], and tryptic soy broth (TSB) (Becton, Dickenson and Co., Franklin Lakes, NJ, USA) [77]. The manufacturers’ part numbers and compositions of the media are in Table S6. The bacteria were pre-cultured on LB agar for 24 h at 37 °C, and single colonies were inoculated into 5 mL of BHI, LB, MHB, or TSB media in 50 mL conical tubes, which were incubated overnight in an orbital shaker at 37 °C and 200 rpm. The overnight cultures were subcultured with a 1000-fold dilution into 25 mL media in 250 mL Erlenmeyer flasks with foam stoppers and incubated for 24 h in an orbital shaker at 37 °C and 200 rpm. Bacterial cultures were prepared in biological triplicates, and media-only controls were prepared in six replicates for BHI, LB, and MHB, and in triplicate for TSB, following the same procedures as the bacterial cultures. After culturing, the samples and blanks were chilled on ice, then centrifuged to pellet the cells. Ten milliliters of the supernatants were filter-sterilized at 4 °C through Macrosep Advance centrifugal filter devices (Pall, 0.20 μm Supor membrane, New York, NY, USA) that were pre-rinsed using 10 mL filter-sterilized media. Two milliliters of each filtrate were transferred to heat-treated (24 h at 100°C) 10 mL GC headspace vials with polytetrafluoroethylene/silicone septum screw caps. The samples were stored for approximately two weeks at −20 °C prior to volatile metabolomics analysis.

3.2. Analysis by HS-SPME-GC×GC-TOFMS

Headspace solid-phase microextraction (HS-SPME), chromatographic and mass spectrometric analyses, and data processing and alignment were carried out on a Leco Pegasus 4D GC×GC-TOFMS (St. Joseph, MI, USA) outfitted with a Gerstel MultiPurpose Sampler autosampler (Mülheim, Germany), as previously published [78], using parameters in Table S7. Samples and media blanks were analyzed in a randomized order. The mass spectrometer was calibrated daily with perfluorotributylamine, and the column performance was checked at three points during the analysis using a quality control sample (a 24 h culture of Pseudomonas aeruginosa PA14 in LB, sampled using the parameters described in Table S7) and at the beginning, mid-point, and end of the run using alkane standards (C6-C15; Sigma-Aldrich). Headspace volatiles of a pure alkane mixture were sampled using a 2 cm divinylbenzene/carboxen/polydimethylsiloxane (DVB/CAR/PDMS) SPME fiber (Supelco) for 10 min at 50 °C and desorbed for 10 min at 250 °C without a split. All other GC×GC-TOFMS parameters for the alkane mix were as described in Table S7. The alkane retention times were utilized to calculate retention indices (RIs); RIs greater than 1500 or less than 600 were extrapolated.
The datasets generated during the current study are available as Study ST001426 in the Metabolomics Workbench repository [79], http://dx.doi.org/10.21228/M88Q44.

3.3. Statistical Analyses

Peaks were removed that eluted prior to acetone in the first dimension, at 358 s. Probabilistic quotient normalization (PQN), followed by log10 transformation, was employed to minimize differences in peak abundance resulting from cell culture density variations [80]. As previously described [78], peaks were excluded upon failure to meet all of the following criteria in at least one sample: (1) present in all biological replicates, (2) two-fold or greater mean peak area compared to the mean peak area in the corresponding media control sample, and (3) significantly greater in abundance in the biological sample versus media control as evaluated by a one-tailed t-test (p < 0.05). Statistical analyses were performed using RStudio for desktop version 1.3.959 (RStudio: Integrated Development for R. RStudio, PBC). Shannon diversity indices and volatilome dissimilarities were calculated for the relative abundance volatilome data using the Vegan package (v. 2.5-6) with the functions—diversity (method: Shannon) and vegdist (method: Morisita-Horn).

3.4. Compound Identification

Peaks were assigned putative identifications based on mass spectral and retention time data, and the confidence of the identification was indicated using the four levels described by the Chemical Analysis Working Group Metabolomics Standards Initiative (MSI) [81,82]. Level 2 was the highest in this study, indicating a forward and/or reverse NIST MS library match ≥ 800 (out of 1000), and RIs were consistent with published values. The RIs reported here fell between the literature values for polar and nonpolar column sets, as a result of the mid-polarity of the cyanopropyl stationary phase. We considered the measured (experimental) RIs to be consistent with the literature values if they fell within 0–35% of the range between polar and non-polar values (see [65] for calculation).

4. Conclusions

The staphylococcal volatilome was strongly influenced by the nutritional composition of the growth medium, which was much more evident when the relative abundances of the volatiles were analyzed, compared to the presence versus absence. In the glucose-free media of LB and MHB, we observed substantial media-dependent differences in the volatilome chemical composition, while in BHI and TSB media containing free glucose, half or more of the volatilome was comprised of acids and esters, and the remaining portion was of unique chemical composition by the medium. We attributed these observations to S. aureus and S. epidermidis catabolite repression control, which would preferentially catabolize glucose when available and would catabolize a wider variety of substrates (amino acids, organic acids, nucleic acid and nucleotides, alcohols, and heteroaromatics) when glucose is depleted. In the low glucose media LB and MHB, ketones became the most abundant chemical class, suggesting that ketogenic amino acid metabolism dominated under these conditions. Our observations on the relative abundances of acids/esters and ketones versus other chemical classes in any given medium would be very specific to the use of SPME headspace analysis, gas chromatography separations on underivatized analytes, and electron impact ionization. However, these analyses provided preliminary data on how the microbial volatilome could be influenced by microbial nutrition and suggested that the concentration of free glucose in in vitro media should be matched to each infection site to improve the translatability of the volatilomes. Our data also underscored the need to consider volatile abundances in addition to presence and absence when studying the effect of nutrition on volatile metabolites. Future analyses will include experiments to test our hypotheses about the role of catabolite repression control and glucose availability on the staphylococcal volatilome, with an eye toward developing in vitro culture conditions that more closely replicate in vivo volatilomes. We will also explore if the species-specific volatilome responses to free glucose can be correlated to virulence, potentially enabling the detection of pathogenic strains of S. epidermidis and other coagulase-negative staphylococci that are typically regarded as commensals.

Supplementary Materials

The following are available online at https://www.mdpi.com/2218-1989/10/9/347/s1: Table S1: Volatile compounds detected in the headspace of in vitro cultures of S. aureus or S. epidermidis cultured in BHI, LB, MHB, or TSB, Table S2: Number of volatiles produced in 16 chemical classes by culturing S. aureus or S. epidermidis in BHI, LB, MHB, or TSB, Table S3: Normalized number of volatiles produced in 16 chemical classes by culturing S. aureus or S. epidermidis in BHI, LB, MHB, or TSB, Table S4: Relative abundances of volatiles produced in 16 chemical classes by culturing S. aureus or S. epidermidis in BHI, LB, MHB, or TSB, Table S5: Normalized relative abundances of volatiles produced in 16 chemical classes by culturing S. aureus or S. epidermidis in BHI, LB, MHB, or TSB, Table S6: Media composition and characteristics, Table S7: Parameters for HS-SPME volatiles sampling, GC×GC-TOFMS analysis, and data processing and alignment.

Author Contributions

Conceptualization and design: C.L.J., H.D.B.; Acquisition of the data: C.L.J.; Analysis and interpretation of the data: C.L.J., H.D.B.; Writing and review of the manuscript: H.D.B., C.L.J. All authors have read and agreed to the published version of the manuscript.

Funding

Funding for this work was supported by the Cystic Fibrosis Foundation (Hill18A0-CI) and Arizona State University’s internal funds.

Conflicts of Interest

The authors declare no conflict of interest.

References

  1. Somerville, G.A.; Proctor, R.A. At the crossroads of bacterial metabolism and virulence factor synthesis in staphylococci. Microbiol. Mol. Biol. Rev. 2009, 73, 233–248. [Google Scholar] [CrossRef] [Green Version]
  2. Seidl, K.; Müller, S.; François, P.; Kriebitzsch, C.; Schrenzel, J.; Engelmann, S.; Bischoff, M.; Berger-Bächi, B. Effect of a glucose impulse on the CcpA regulon in Staphylococcus aureus. BMC Microbiol. 2009, 9, 95. [Google Scholar] [CrossRef] [Green Version]
  3. Liebeke, M.; Dörries, K.; Zühlke, D.; Bernhardt, J.; Fuchs, S.; Pane-Farre, J.; Engelmann, S.; Völker, U.; Bode, R.; Dandekar, T. A metabolomics and proteomics study of the adaptation of Staphylococcus aureus to glucose starvation. Mol. Biosyst. 2011, 7, 1241–1253. [Google Scholar] [CrossRef]
  4. Richardson, A.R. Virulence and metabolism. Microbiol. Spectr. 2019, 7. [Google Scholar] [CrossRef]
  5. Schurig-Briccio, L.A.; Parraga Solorzano, P.K.; Lencina, A.M.; Radin, J.N.; Chen, G.Y.; Sauer, J.D.; Kehl-Fie, T.E.; Gennis, R.B. Role of respiratory NADH oxidation in the regulation of Staphylococcus aureus virulence. EMBO Rep. 2020, e45832. [Google Scholar] [CrossRef]
  6. Haag, A.F.; Bagnoli, F. The role of two-component signal transduction systems in Staphylococcus aureus virulence regulation. In Staphylococcus aureus; Springer: Berlin/Heidelberg, Germany, 2015; pp. 145–198. [Google Scholar]
  7. Scott, W. Water relations of Staphylococcus aureus at 30 °C. Aust. J. Biol. Sci. 1953, 6, 549–564. [Google Scholar] [CrossRef] [Green Version]
  8. Graham, J.E.; Wilkinson, B.J. Staphylococcus aureus osmoregulation: Roles for choline, glycine betaine, proline, and taurine. J. Bacteriol. 1992, 174, 2711–2716. [Google Scholar] [CrossRef] [Green Version]
  9. Chan, P.F.; Foster, S.J. The role of environmental factors in the regulation of virulence-determinant expression in Staphylococcus aureus 8325-4. Microbiol. SGM 1998, 144, 2469–2479. [Google Scholar] [CrossRef] [Green Version]
  10. Clements, M.O.; Foster, S.J. Stress resistance in Staphylococcus aureus. Trends Microbiol. 1999, 7, 458–462. [Google Scholar] [CrossRef]
  11. Cebrián, G.; Sagarzazu, N.; Pagán, R.; Condón, S.; Mañas, P. Development of stress resistance in Staphylococcus aureus after exposure to sublethal environmental conditions. Int. J. Food Microbiol. 2010, 140, 26–33. [Google Scholar] [CrossRef]
  12. Kehl-Fie, T.E.; Chitayat, S.; Hood, M.I.; Damo, S.; Restrepo, N.; Garcia, C.; Munro, K.A.; Chazin, W.J.; Skaar, E.P. Nutrient metal sequestration by calprotectin inhibits bacterial superoxide defense, enhancing neutrophil killing of Staphylococcus aureus. Cell Host Microbe 2011, 10, 158–164. [Google Scholar] [CrossRef] [Green Version]
  13. Liebeke, M.; Lalk, M. Staphylococcus aureus metabolic response to changing environmental conditions—A metabolomics perspective. Int. J. Med. Microbiol. 2014, 304, 222–229. [Google Scholar] [CrossRef]
  14. Alreshidi, M.M.; Dunstan, R.H.; Macdonald, M.M.; Smith, N.D.; Gottfries, J.; Roberts, T.K. Amino acids and proteomic acclimation of Staphylococcus aureus when incubated in a defined minimal medium supplemented with 5% sodium chloride. MicrobiologyOpen 2019, 8, e00772. [Google Scholar] [CrossRef] [Green Version]
  15. Solórzano, P.K.P.; Yao, J.; Rock, C.O.; Kehl-Fie, T.E. Disruption of glycolysis by nutritional immunity activates a two-component system that coordinates a metabolic and antihost response by Staphylococcus aureus. Mbio 2019, 10, e01321-19. [Google Scholar]
  16. Collins, F.; Lascelles, J. The effect of growth conditions on oxidative and dehydrogenase activity in Staphylococcus aureus. J. Gen. Microbiol. 1962, 29, 531–535. [Google Scholar] [CrossRef] [Green Version]
  17. Strasters, K.; Winkler, K. Carbohydrate metabolism of Staphylococcus aureus. J. Gen. Microbiol. 1963, 33, 213–229. [Google Scholar] [CrossRef] [Green Version]
  18. Somerville, G.A.; Cockayne, A.; Dürr, M.; Peschel, A.; Otto, M.; Musser, J.M. Synthesis and deformylation of Staphylococcus aureus δ-toxin are linked to tricarboxylic acid cycle activity. J. Bacteriol. 2003, 185, 6686–6694. [Google Scholar] [CrossRef] [Green Version]
  19. Kaiser, J.C.; King, A.N.; Grigg, J.C.; Sheldon, J.R.; Edgell, D.R.; Murphy, M.E.; Brinsmade, S.R.; Heinrichs, D.E. Repression of branched-chain amino acid synthesis in Staphylococcus aureus is mediated by isoleucine via CodY, and by a leucine-rich attenuator peptide. PLoS Genet. 2018, 14, e1007159. [Google Scholar] [CrossRef]
  20. Ramsey, H. Endogenous respiration of Staphylococcus aureus. J. Bacteriol. 1962, 83, 507–514. [Google Scholar] [CrossRef] [Green Version]
  21. Krzemiński, Z.; Mikucki, J.; Szarapińska-Kwaszewska, J. Endogenous metabolism of Staphylococcus aureus. Folia Microbiol. 1972, 17, 46–54. [Google Scholar] [CrossRef]
  22. Lakshmi, H.P.; Prasad, U.V.; Yeswanth, S.; Swarupa, V.; Prasad, O.H.; Narasu, M.L.; Sarma, P.V.G.K. Molecular characterization of α-amylase from Staphylococcus aureus. Bioinformation 2013, 9, 281. [Google Scholar] [CrossRef] [PubMed]
  23. Rayner, M.H.; Sadler, P.J.; Scawen, M.D. NMR studies of a bacterial cell culture medium (LB broth): Cyclic nucleosides in yeast extracts. FEMS Microbiol. Lett. 1990, 68, 217–221. [Google Scholar] [CrossRef] [PubMed]
  24. Sezonov, G.; Joseleau-Petit, D.; D’Ari, R. Escherichia coli physiology in Luria-Bertani broth. J. Bacteriol. 2007, 189, 8746–8749. [Google Scholar] [CrossRef] [PubMed] [Green Version]
  25. Wijesinghe, G.; Dilhari, A.; Gayani, B.; Kottegoda, N.; Samaranayake, L.; Weerasekera, M. Influence of laboratory culture media on in vitro growth, adhesion, and biofilm formation of Pseudomonas aeruginosa and Staphylococcus aureus. Med. Princ. Pract. 2019, 28, 28–35. [Google Scholar] [CrossRef]
  26. Macleod, P.; Jensen, R.; Gander, G.; Sampugna, J. Quantity and fatty acid composition of lipid extracted from cells of Streptococcus lactis. J. Bacteriol. 1962, 83, 806–810. [Google Scholar] [CrossRef] [Green Version]
  27. Huston, C.K.; Albro, P.W. Lipids of Sarcina lutea I.: Fatty acid composition of the extractable lipids. J. Bacteriol. 1964, 88, 425–432. [Google Scholar] [CrossRef] [Green Version]
  28. Hiron, A.; Borezée-Durant, E.; Piard, J.-C.; Juillard, V. Only one of four oligopeptide transport systems mediates nitrogen nutrition in Staphylococcus aureus. J. Bacteriol. 2007, 189, 5119–5129. [Google Scholar] [CrossRef] [Green Version]
  29. Zhang, Y.-M.; Rock, C.O. Membrane lipid homeostasis in bacteria. Nat. Rev. Microbiol. 2008, 6, 222–233. [Google Scholar] [CrossRef]
  30. Sen, S.; Sirobhushanam, S.; Johnson, S.R.; Song, Y.; Tefft, R.; Gatto, C.; Wilkinson, B.J. Growth-environment dependent modulation of Staphylococcus aureus branched-chain to straight-chain fatty acid ratio and incorporation of unsaturated fatty acids. PLoS ONE 2016, 11, e0165300. [Google Scholar] [CrossRef] [Green Version]
  31. Tiwari, K.B.; Gatto, C.; Wilkinson, B.J. Plasticity of coagulase-negative staphylococcal membrane fatty acid composition and implications for responses to antimicrobial agents. Antibiotics 2020, 9, 214. [Google Scholar] [CrossRef]
  32. Schulz, S.; Dickschat, J.S. Bacterial volatiles: The smell of small organisms. Nat. Prod. Rep. 2007, 24, 814–842. [Google Scholar] [CrossRef]
  33. Citron, C.A.; Rabe, P.; Dickschat, J.S. The scent of bacteria: Headspace analysis for the discovery of natural products. J. Nat. Prod. 2012, 75, 1765–1776. [Google Scholar] [CrossRef]
  34. Veselova, M.; Plyuta, V.; Khmel, I. Volatile compounds of bacterial origin: Structure, biosynthesis, and biological activity. Microbiology 2019, 88, 261–274. [Google Scholar] [CrossRef]
  35. Dryahina, K.; Sovova, K.; Nemec, A.; Spanel, P. Differentiation of pulmonary bacterial pathogens in cystic fibrosis by volatile metabolites emitted by their in vitro cultures: Pseudomonas aeruginosa, Staphylococcus aureus, Stenotrophomonas maltophilia and the Burkholderia cepacia complex. J. Breath Res. 2016, 10, 037102. [Google Scholar] [CrossRef]
  36. Rees, C.A.; Nordick, K.V.; Franchina, F.A.; Lewis, A.E.; Hirsch, E.B.; Hill, J.E. Volatile metabolic diversity of Klebsiella pneumoniae in nutrient-replete conditions. Metabolomics 2017, 13, 18. [Google Scholar] [CrossRef]
  37. Wolfe, A.J. The acetate switch. Microbiol. Mol. Biol. Rev. 2005, 69, 12–50. [Google Scholar] [CrossRef] [Green Version]
  38. Baptista, I.; Santos, M.; Rudnitskaya, A.; Saraiva, J.A.; Almeida, A.; Rocha, S.M. A comprehensive look into the volatile exometabolome of enteroxic and non-enterotoxic Staphylococcus aureus strains. Int. J. Biochem. Cell Biol. 2019, 108, 40–50. [Google Scholar] [CrossRef]
  39. Berrou, K.; Dunyach-Remy, C.; Lavigne, J.-P.; Roig, B.; Cadiere, A. Multiple stir bar sorptive extraction combined with gas chromatography-mass spectrometry analysis for a tentative identification of bacterial volatile and/or semi-volatile metabolites. Talanta 2019, 195, 245–250. [Google Scholar] [CrossRef]
  40. Jia, B.; Sohnlein, B.; Mortelmans, K.; Coggiola, M.; Oser, H. Distinguishing methicillin-resistant and sensitive Staphylococcus aureus using volatile headspace metabolites. IEEE Sens. J. 2010, 10, 71–75. [Google Scholar] [CrossRef]
  41. Preti, G.; Thaler, E.; Hanson, C.W.; Troy, M.; Eades, J.; Gelperin, A. Volatile compounds characteristic of sinus-related bacteria and infected sinus mucus: Analysis by solid-phase microextraction and gas chromatography-mass spectrometry. J. Chromatogr. B Analyt. Technol. Biomed. Life Sci. 2009, 877, 2011–2018. [Google Scholar] [CrossRef]
  42. Timm, C.M.; Lloyd, E.P.; Egan, A.; Mariner, R.; Karig, D. Direct growth of bacteria in headspace vials allows for screening of volatiles by gas chromatography mass spectrometry. Front. Microbiol. 2018, 9, 491. [Google Scholar] [CrossRef] [PubMed]
  43. Rees, C.A.; Shen, A.; Hill, J.E. Characterization of the Clostridium difficile volatile metabolome using comprehensive two-dimensional gas chromatography time-of-flight mass spectrometry. J. Chromatogr. B Analyt. Technol. Biomed. Life Sci. 2016, 1039, 8–16. [Google Scholar] [CrossRef] [PubMed]
  44. Lee, C.J.; DeMilo, A.B.; Moreno, D.S.; Martinez, A.J. Analysis of the volatile components of a bacterial fermentation attractive to the Mexican fruit fly (Anastrepha ludens). J. Agric. Food Chem. 1995, 43, 1348–1351. [Google Scholar] [CrossRef]
  45. Hettinga, K.A.; van Valenberg, H.J.; Lam, T.J.; van Hooijdonk, A.C. The origin of the volatile metabolites found in mastitis milk. Vet. Microbiol. 2009, 137, 384–387. [Google Scholar] [CrossRef] [Green Version]
  46. Filipiak, W.; Sponring, A.; Filipiak, A.; Baur, M.; Ager, C.; Wiesenhofer, H.; Margesin, R.; Nagl, M.; Troppmair, J.; Amann, A. Volatile organic compounds (VOCs) released by pathogenic microorganisms in vitro: Potential breath biomarkers. In Volatile Biomarkers; Elsevier: Amsterdam, The Netherlands, 2013; p. 463. [Google Scholar]
  47. Filipiak, W.; Beer, R.; Sponring, A.; Filipiak, A.; Ager, C.; Schiefecker, A.; Lanthaler, S.; Helbok, R.; Nagl, M.; Troppmair, J. Breath analysis for in vivo detection of pathogens related to ventilator-associated pneumonia in intensive care patients: A prospective pilot study. J. Breath Res. 2015, 9, 016004. [Google Scholar] [CrossRef]
  48. Pizzini, A.; Filipiak, W.; Wille, J.; Ager, C.; Wiesenhofer, H.; Kubinec, R.; Blaško, J.; Tschurtschenthaler, C.; Mayhew, C.A.; Weiss, G. Analysis of volatile organic compounds in the breath of patients with stable or acute exacerbation of chronic obstructive pulmonary disease. J. Breath Res. 2018, 12, 036002. [Google Scholar] [CrossRef]
  49. Lemfack, M.C.; Ravella, S.R.; Lorenz, N.; Kai, M.; Jung, K.; Schulz, S.; Piechulla, B. Novel volatiles of skin-borne bacteria inhibit the growth of Gram-positive bacteria and affect quorum-sensing controlled phenotypes of Gram-negative bacteria. Syst. Appl. Microbiol. 2016, 39, 503–515. [Google Scholar] [CrossRef]
  50. Chen, J.; Tang, J.; Shi, H.; Tang, C.; Zhang, R. Characteristics of volatile organic compounds produced from five pathogenic bacteria by headspace-solid phase micro-extraction/gas chromatography-mass spectrometry. J. Basic Microbiol. 2017, 57, 228–237. [Google Scholar] [CrossRef]
  51. Bean, H.D.; Dimandja, J.M.; Hill, J.E. Bacterial volatile discovery using solid phase microextraction and comprehensive two-dimensional gas chromatography-time-of-flight mass spectrometry. J. Chromatogr. B Analyt. Technol. Biomed. Life Sci. 2012, 901, 41–46. [Google Scholar] [CrossRef] [Green Version]
  52. Vergnais, L.; Masson, F.; Montel, M.C.; Berdague, J.L.; Talon, R. Evaluation of solid-phase microextraction for analysis of volatile metabolites produced by staphylococci. J. Agric. Food Chem. 1998, 46, 228–234. [Google Scholar] [CrossRef]
  53. Rees, C.A.; Smolinska, A.; Hill, J.E. The volatile metabolome of Klebsiella pneumoniae in human blood. J. Breath Res. 2016, 10, 027101. [Google Scholar] [CrossRef] [PubMed]
  54. Hang, Y.; Chingin, K.; Liang, J.; Wang, X.; Hu, L. Fast detection of volatile organic compounds from staphylococcal blood cultures by CDI-MS. RSC Adv. 2017, 7, 24789–24794. [Google Scholar] [CrossRef] [Green Version]
  55. Tait, E.; Perry, J.D.; Stanforth, S.P.; Dean, J.R. Identification of volatile organic compounds produced by bacteria using HS-SPME-GC-MS. J. Chromatogr. Sci. 2014, 52, 363–373. [Google Scholar] [CrossRef] [PubMed] [Green Version]
  56. Storer, M.K.; Hibbard-Melles, K.; Davis, B.; Scotter, J. Detection of volatile compounds produced by microbial growth in urine by selected ion flow tube mass spectrometry (SIFT-MS). J. Microbiol. Methods 2011, 87, 111–113. [Google Scholar] [CrossRef] [PubMed]
  57. Thorn, R.M.; Reynolds, D.M.; Greenman, J. Multivariate analysis of bacterial volatile compound profiles for discrimination between selected species and strains in vitro. J. Microbiol. Methods 2011, 84, 258–264. [Google Scholar] [CrossRef] [PubMed]
  58. Allardyce, R.A.; Langford, V.S.; Hill, A.L.; Murdoch, D.R. Detection of volatile metabolites produced by bacterial growth in blood culture media by selected ion flow tube mass spectrometry (SIFT-MS). J. Microbiol. Methods 2006, 65, 361–365. [Google Scholar] [CrossRef]
  59. Verhulst, N.O.; Andriessen, R.; Groenhagen, U.; Bukovinszkine Kiss, G.; Schulz, S.; Takken, W.; van Loon, J.J.; Schraa, G.; Smallegange, R.C. Differential attraction of malaria mosquitoes to volatile blends produced by human skin bacteria. PLoS ONE 2010, 5, e15829. [Google Scholar] [CrossRef] [Green Version]
  60. Nizio, K.D.; Perrault, K.A.; Troobnikoff, A.N.; Ueland, M.; Shoma, S.; Iredell, J.R.; Middleton, P.G.; Forbes, S.L. In vitro volatile organic compound profiling using GC×GC-TOFMS to differentiate bacteria associated with lung infections: A proof-of-concept study. J. Breath Res. 2016, 10, 026008. [Google Scholar] [CrossRef] [Green Version]
  61. Elgaali, H.; Hamilton-Kemp, T.R.; Newman, M.C.; Collins, R.W.; Yu, K.; Archbold, D.D. Comparison of long-chain alcohols and other volatile compounds emitted from food-borne and related Gram positive and Gram negative bacteria. J. Basic Microbiol. 2002, 42, 373–380. [Google Scholar] [CrossRef]
  62. Robacker, D.C.; Bartelt, R.J. Chemicals attractive to Mexican fruit fly from Klebsiella pneumoniae and Citrobacter freundii. Cultures sampled by solid-phase microextraction. J. Chem. Ecol. 1997, 23, 2897–2915. [Google Scholar] [CrossRef]
  63. Nasir, M.; Bean, H.D.; Smolinska, A.; Rees, C.A.; Zemanick, E.T.; Hill, J.E. Volatile molecules from bronchoalveolar lavage fluid can ‘rule-in’ Pseudomonas aeruginosa and ‘rule-out’ Staphylococcus aureus infections in cystic fibrosis patients. Sci. Rep. 2018, 8, 826. [Google Scholar] [CrossRef] [PubMed]
  64. Filipiak, W.; Sponring, A.; Baur, M.M.; Filipiak, A.; Ager, C.; Wiesenhofer, H.; Nagl, M.; Troppmair, J.; Amann, A. Molecular analysis of volatile metabolites released specifically by Staphylococcus aureus and Pseudomonas aeruginosa. BMC Microbiol. 2012, 12, 113. [Google Scholar] [CrossRef] [PubMed] [Green Version]
  65. Bean, H.D.; Rees, C.A.; Hill, J.E. Comparative analysis of the volatile metabolomes of Pseudomonas aeruginosa clinical isolates. J. Breath Res. 2016, 10, 047102. [Google Scholar] [CrossRef]
  66. Smart, A.; de Costello, B.L.; White, P.; Avison, M.; Batty, C.; Turner, C.; Persad, R.; Ratcliffe, N. Sniffing out resistance-rapid identification of urinary tract infection-causing bacteria and their antibiotic susceptibility using volatile metabolite profiles. J. Pharm. Biomed. Anal. 2019, 167, 59–65. [Google Scholar] [CrossRef] [PubMed] [Green Version]
  67. Lawal, O.; Muhamadali, H.; Ahmed, W.M.; White, I.R.; Nijsen, T.M.E.; Goodacre, R.; Fowler, S.J. Headspace volatile organic compounds from bacteria implicated in ventilator-associated pneumonia analysed by TD-GC/MS. J. Breath Res. 2018, 12, 026002. [Google Scholar] [CrossRef] [PubMed] [Green Version]
  68. Jünger, M.; Vautz, W.; Kuhns, M.; Hofmann, L.; Ulbricht, S.; Baumbach, J.I.; Quintel, M.; Perl, T. Ion mobility spectrometry for microbial volatile organic compounds: A new identification tool for human pathogenic bacteria. Appl. Microbiol. Biotechnol. 2012, 93, 2603–2614. [Google Scholar] [CrossRef] [PubMed] [Green Version]
  69. Epsky, N.D.; Heath, R.R.; Dueben, B.D.; Lauzon, C.R.; Proveaux, A.T.; MacCollom, G.B. Attraction of 3-methyl-1-butanol and ammonia identified from Enterobacter agglomerans to Anastrepha suspensa. J. Chem. Ecol. 1998, 24, 1867–1880. [Google Scholar] [CrossRef]
  70. Franchina, F.A.; Purcaro, G.; Burklund, A.; Beccaria, M.; Hill, J.E. Evaluation of different adsorbent materials for the untargeted and targeted bacterial VOC analysis using GC×GC-MS. Anal. Chim. Acta 2019, 1066, 146–153. [Google Scholar] [CrossRef]
  71. Karami, N.; Mirzajani, F.; Rezadoost, H.; Karimi, A.; Fallah, F.; Ghassempour, A.; Aliahmadi, A. Initial study of three different pathogenic microorganisms by gas chromatography-mass spectrometry. F1000research 2017, 6. [Google Scholar] [CrossRef]
  72. Neerincx, A.H.; Geurts, B.P.; van Loon, J.; Tiemes, V.; Jansen, J.J.; Harren, F.J.; Kluijtmans, L.A.; Merkus, P.J.; Cristescu, S.M.; Buydens, L.M.; et al. Detection of Staphylococcus aureus in cystic fibrosis patients using breath VOC profiles. J. Breath Res. 2016, 10, 046014. [Google Scholar] [CrossRef]
  73. Rees, C.A.; Franchina, F.A.; Nordick, K.V.; Kim, P.J.; Hill, J.E. Expanding the Klebsiella pneumoniae volatile metabolome using advanced analytical instrumentation for the detection of novel metabolites. J. Appl. Microbiol. 2017, 122, 785–795. [Google Scholar] [CrossRef]
  74. Boots, A.W.; Smolinska, A.; van Berkel, J.J.; Fijten, R.R.; Stobberingh, E.E.; Boumans, M.L.; Moonen, E.J.; Wouters, E.F.; Dallinga, J.W.; Van Schooten, F.J. Identification of microorganisms based on headspace analysis of volatile organic compounds by gas chromatography-mass spectrometry. J. Breath Res. 2014, 8, 027106. [Google Scholar] [CrossRef] [PubMed]
  75. Rees, C.A.; Burklund, A.; Stefanuto, P.H.; Schwartzman, J.D.; Hill, J.E. Comprehensive volatile metabolic fingerprinting of bacterial and fungal pathogen groups. J. Breath Res. 2018, 12, 026001. [Google Scholar] [CrossRef] [PubMed]
  76. Phan, J.; Meinardi, S.; Barletta, B.; Blake, D.R.; Whiteson, K. Stable isotope profiles reveal active production of VOCs from human-associated microbes. J. Breath Res. 2017, 11, 017101. [Google Scholar] [CrossRef] [PubMed]
  77. Power, D.A.; Johnson, J.A. Difco™ & BBL™ Manual; Becton, Dickinson and Company: Sparks, MD, USA, 2009. [Google Scholar]
  78. Jenkins, C.L.; Bean, H.D. Influence of media on the differentiation of Staphylococcus spp. by volatile compounds. J. Breath Res. 2020, 14, 016007. [Google Scholar] [CrossRef] [PubMed]
  79. Sud, M.; Fahy, E.; Cotter, D.; Azam, K.; Vadivelu, I.; Burant, C.; Edison, A.; Fiehn, O.; Higashi, R.; Nair, K.S. Metabolomics workbench: An international repository for metabolomics data and metadata, metabolite standards, protocols, tutorials and training, and analysis tools. Nucleic Acids Res. 2016, 44, D463–D470. [Google Scholar] [CrossRef] [Green Version]
  80. Dieterle, F.; Ross, A.; Schlotterbeck, G.; Senn, H. Probabilistic quotient normalization as robust method to account for dilution of complex biological mixtures. Application in 1H NMR metabonomics. Anal. Chem. 2006, 78, 4281–4290. [Google Scholar] [CrossRef]
  81. Fiehn, O.; Kristal, B.; van Ommen, B.; Sumner, L.W.; Sansone, S.A.; Taylor, C.; Hardy, N.; Kaddurah-Daouk, R. Establishing reporting standards for metabolomic and metabonomic studies: A call for participation. OMICS 2006, 10, 158–163. [Google Scholar] [CrossRef]
  82. Sumner, L.W.; Amberg, A.; Barrett, D.; Beale, M.H.; Beger, R.; Daykin, C.A.; Fan, T.W.; Fiehn, O.; Goodacre, R.; Griffin, J.L.; et al. Proposed minimum reporting standards for chemical analysis Chemical Analysis Working Group (CAWG) Metabolomics Standards Initiative (MSI). Metabolomics 2007, 3, 211–221. [Google Scholar] [CrossRef] [Green Version]
Figure 1. Chemical composition of the total staph volatilome (Total), and the volatilome by species (S. aureus, Sa, or S. epidermidis, Se) or by growth medium (brain heart infusion (BHI), tryptic soy broth (TSB), Mueller Hinton broth (MHB), lysogeny broth (LB)). The data are presented as the total number of volatiles detected in each chemical class, unnormalized (a) and normalized (b), and the total relative abundances of volatiles in each chemical class, unnormalized (c) and normalized (d). Level 4 (unknown) compounds were excluded. Each column represents composite data, with the media volatilomes representing the data for both species, the species volatilomes representing the volatilomes of that species in all four media, and the total representing the volatilomes of both species in all four media. The numerical data are provided in Tables S2–S5. HC, hydrocarbons; ALC, alcohols; ALD, aldehydes; KET, ketones; ETH, ethers; A/E, acids and esters; NIT, nitrogen-containing; SULF, sulfur-containing; HALO, halogen-containing; HET-ARO, heteroaromatics; HC-ARO, aromatic hydrocarbons; ALC-ARO, aromatic alcohols; ALD-ARO, aromatic aldehydes; KET-ARO, aromatic ketones; A/E-ARO, aromatic acids and esters; NIT-ARO, aromatic nitrogen-containing.
Metabolites 10 00347 g001
Figure 2. Media-dependent staph volatilome variation represented as a dissimilarity matrix using Morisita–Horn differences calculated using relative abundances of volatile chemical classes.
Metabolites 10 00347 g002
Figure 3. Chemical composition of the staph volatilome as a function of species and growth medium. The data are presented as the total number of volatiles detected in each chemical class, unnormalized (a) and normalized (b), and the total relative abundances of volatiles in each chemical class, unnormalized (c) and normalized (d). Level 4 (unknown) compounds were excluded. The numerical data are provided in Tables S2–S5. HC, hydrocarbons; ALC, alcohols; ALD, aldehydes; KET, ketones; ETH, ethers; A/E, acids and esters; NIT, nitrogen-containing; SULF, sulfur-containing; HALO, halogen-containing; HET-ARO, heteroaromatics; HC-ARO, aromatic hydrocarbons; ALC-ARO, aromatic alcohols; ALD-ARO, aromatic aldehydes; KET-ARO, aromatic ketones; A/E-ARO, aromatic acids and esters; NIT-ARO, aromatic nitrogen-containing.
Metabolites 10 00347 g003
Table 1. Volatiles detected in the headspace of S. aureus or S. epidermidis cultured in brain heart infusion (BHI), lysogeny broth (LB), Mueller Hinton broth (MHB), or tryptic soy broth (TSB). Peak relative abundances are reported as the Log10 fold change of the mean peak intensity in the bacterial culture versus the mean intensity in the corresponding medium control. Italicized volatiles have not been previously reported for S. aureus or S. epidermidis, and bolded italicized volatiles have not been previously reported for bacteria. Additional data for these volatiles are available in Table S1.
Log10 Peak Relative AbundancesCompound NameCAS #References
S. aureusS. epidermidis
BHILBMHBTSBBHILBMHBTSB
ACIDS and ESTERS
4.74.93.5 2-methylbutanoic acid116-53-0[41,42,43,44,45]
4.14.2 2-methylbutyl acetate624-41-9[46,47]
4.3 4.6 3-methylbut-3-enyl acetate5205-07-2[38,48]
2.3 5.85.32.8 5.03-methylbutanoic acid503-74-2[36,38,39,40,41,42,43,44,45,46,47,49,50,51,52]
4.2 4.3 acetic acid64-19-7[35,38,39,40,41,42,45,46,47,48,53,54,55,56,57,58]
5.1 butyl 2-methylbutanoate15706-73-7[51,59]
0.6 butyl 2-methylpropanoate97-87-0[59]
0.6 butyl acetate123-86-4[38,46,47,48,51,59,60]
0.8 butyl propanoate590-01-2
0.6 0.6 dec-5-en-1-ol acetic acid [60]
AROMATIC ACIDS and ESTERS
0.8 methyl benzoate93-58-3[38,58]
ALCOHOLS
1.8 2-butyloctan-1-ol3913-02-8
4.6 2-methylbutan-1-ol137-32-6[40,43,61,62]
0.4 2-methylbutan-2-ol75-85-4[60,63]
0.5 2-methylpropan-2-ol75-65-0[36,52,64]
0.4 3-methylbut-3-en-1-ol763-32-6[36,38,65]
0.90.80.61.12.82.51.31.53-methylbutan-1-ol123-51-3[36,38,39,40,42,44,46,47,48,51,52,56,60,61,62,64,66,67,68,69,70]
0.60.5 6-methylheptan-1-ol1653-40-3[38]
0.4 octan-1-ol111-87-5[38,43,50,55,61]
AROMATIC ALCOHOLS
0.4 0.4 2-phenylpropan-2-ol617-94-7
ALDEHYDES
1.02-methylidenebutanal922-63-4[47]
0.3 2-methylpropanal78-84-2[36,38,39,46,47,48,57]
0.3 3-methylbutanal590-86-3[40,42,45,46,47,48,50,52,55,62,67,68]
3.5 oct-2-enal2363-89-5[64]
AROMATIC ALDEHYDES
2.8 benzaldehyde100-52-7[38,39,40,41,42,46,47,54,62,71]
1.10.71.10.52-phenylacetaldehyde122-78-1[42,52,71]
ETHERS
0.4 2-butoxyethanol111-76-2
0.4 2-methyl-2-propan-2-yloxypropane17348-59-3
HYDROCARBONS
0.5 1-methyl-4-prop-1-en-2-ylcyclohexene138-86-3[38]
1.2 1.80.9 2,4,6,8-tetramethylundec-1-ene59920-26-2
0.71.0 0.71.00.70.43,3-dimethyloctane4110-44-5[60]
1.01.41.61.51.21.71.00.83,7-dimethyloct-1-ene4984-01-4
0.4 4-methylheptane589-53-7[36,48]
3.3 3.9 7-methyl-3-methylideneocta-1,6-diene123-35-3
1.41.21.5 1.81.81.00.6decane124-18-5[48,65]
1.3 dodecane112-40-3
0.7 0.9 hexan-2-ylcyclopropane6976-28-9
1.01.32.31.21.21.51.40.4tridec-3-ene
0.9 0.3 undec-3-ene60669-40-1
0.70.6 undecane1120-21-4[36,48,66,72]
AROMATIC HYDROCARBONS
3.7 1,1,5,6-tetramethyl-2H-naphthalene220766-68-7
0.4 0.3 1,2-xylene95-47-6
0.3 0.4 1,3-ditert-butylbenzene1014-60-4
0.4 0.3 1,4-xylene106-42-3
0.3 1-ethyl-2-methylbenzene611-14-3[43]
0.4 0.3 ethylbenzene100-41-4[36,48,73]
KETONES
1.10.7 0.91.1 3-methylbutan-2-one563-80-4[36,60,63,64,65]
0.6 4,6-dimethylheptan-2-one19549-80-5[36]
1.72.71.61.61.73.0 4-methylheptan-2-one6137-06-0[36,38,39]
0.9 0.80.80.6 4-methylpentan-2-one108-10-1[38,46,65]
0.4 6-methylhept-5-en-2-one110-93-0[38,48,71]
2.01.9 0.91.1 6-methylheptan-2-one928-68-7[36,38]
0.30.3 but-3-en-2-one78-94-4[46,48,65,74]
0.4 butan-2-one78-93-3[35,36,38,42,46,55,56,62,63,64,65,66,69,72,75]
0.5 1.6 0.5 butane-2,3-dione431-03-8[36,46,47,48,53,55,60,62,64,74,75,76]
0.4 cyclohexanone108-94-1[38,43,48]
2.32.9 1.01.6 decan-2-one693-54-9[38,65]
1.2 0.7 dodecan-2-one6175-49-1[65]
0.4 1.91.11.3 0.7heptane-2,3-dione96-04-8[38,64,68]
1.61.40.71.60.61.0 nonan-2-one821-55-6[35,36,38,42,43,44,46,48,49,50,55,60,61,64,65,68,73]
2.92.82.12.71.61.60.80.5octan-2-one111-13-7[35,38,67,68,73]
1.2 3.60.91.31.33.1octan-3-one106-68-3[38,46,48,65]
0.7 0.6 pentan-2-one107-87-9[35,38,39,42,45,46,47,48,52,53,56,62,64,65]
0.5 propan-2-one67-64-1[35,38,48,55,56,57,60,65,66,72,74]
2.73.62.8 0.5 tetradecan-2-one2345-27-9[38]
2.44.52.02.1 tridecan-2-one593-08-8[38,61]
2.84.84.2 undecan-2-one112-12-9[38,39,42,49,50,61,64,65,68]
AROMATIC KETONES
4.3 1-phenylpropan-2-one103-79-7[36,38,73]
NITROGENS
2.5 0.70.53-methylbutanenitrile625-28-5
AROMATIC NITROGENS
0.4 0.40.5 benzonitrile100-47-0[36,38,64,68,73]
HETEROAROMATICS
0.71.0 2.50.51.2 0.82,3,5-trimethylpyrazine14667-55-1[41,44,62,68]
0.4 2,3-dimethylpyrazine5910-89-4[41,73]
4.24.0 2,4-dimethyl-1H-pyrrole625-82-1
1.42.0 2.30.51.01.01.12,5-dimethylpyrazine123-32-0[43,44,53,62,71]
3.3 2.82-ethyl-6-methylpyrazine13925-03-6[66]
1.5 1.2 1.20.71.32-methyl-5-propylpyrazine29461-03-8
0.50.70.91.50.30.4 0.72-methylpyrazine109-08-0[36,41,44,62,64,68]
0.3 4.3 3.03,5-dimethyl-2-(3-methylbutyl)pyrazine111150-30-2[73]
0.51.7 3.2 3-butyl-2,5-dimethylpyrazine40790-29-2
2.7 3.8 4.1 3-ethyl-2,5-dimethylpyrazine13360-65-1
SULFURS
0.81.01.1 2-methylundecane-2-thiol10059-13-9[38,71]
0.40.7 0.3 isothiocyanatocyclohexane1122-82-3
0.40.4 (methyldisulfanyl)methane624-92-0[35,36,38,41,46,47,48,55,56,58,61,62,65,66,67,68,74]
0.5 0.4 0.50.60.4 (methyltrisulfanyl)methane3658-80-8[35,38,46,48,55,61,65,66,67,68]

