Gut Microbiota Dysbiosis Is Associated with Elevated Bile Acids in Parkinson’s Disease

 ,
,  ,
,  and
and 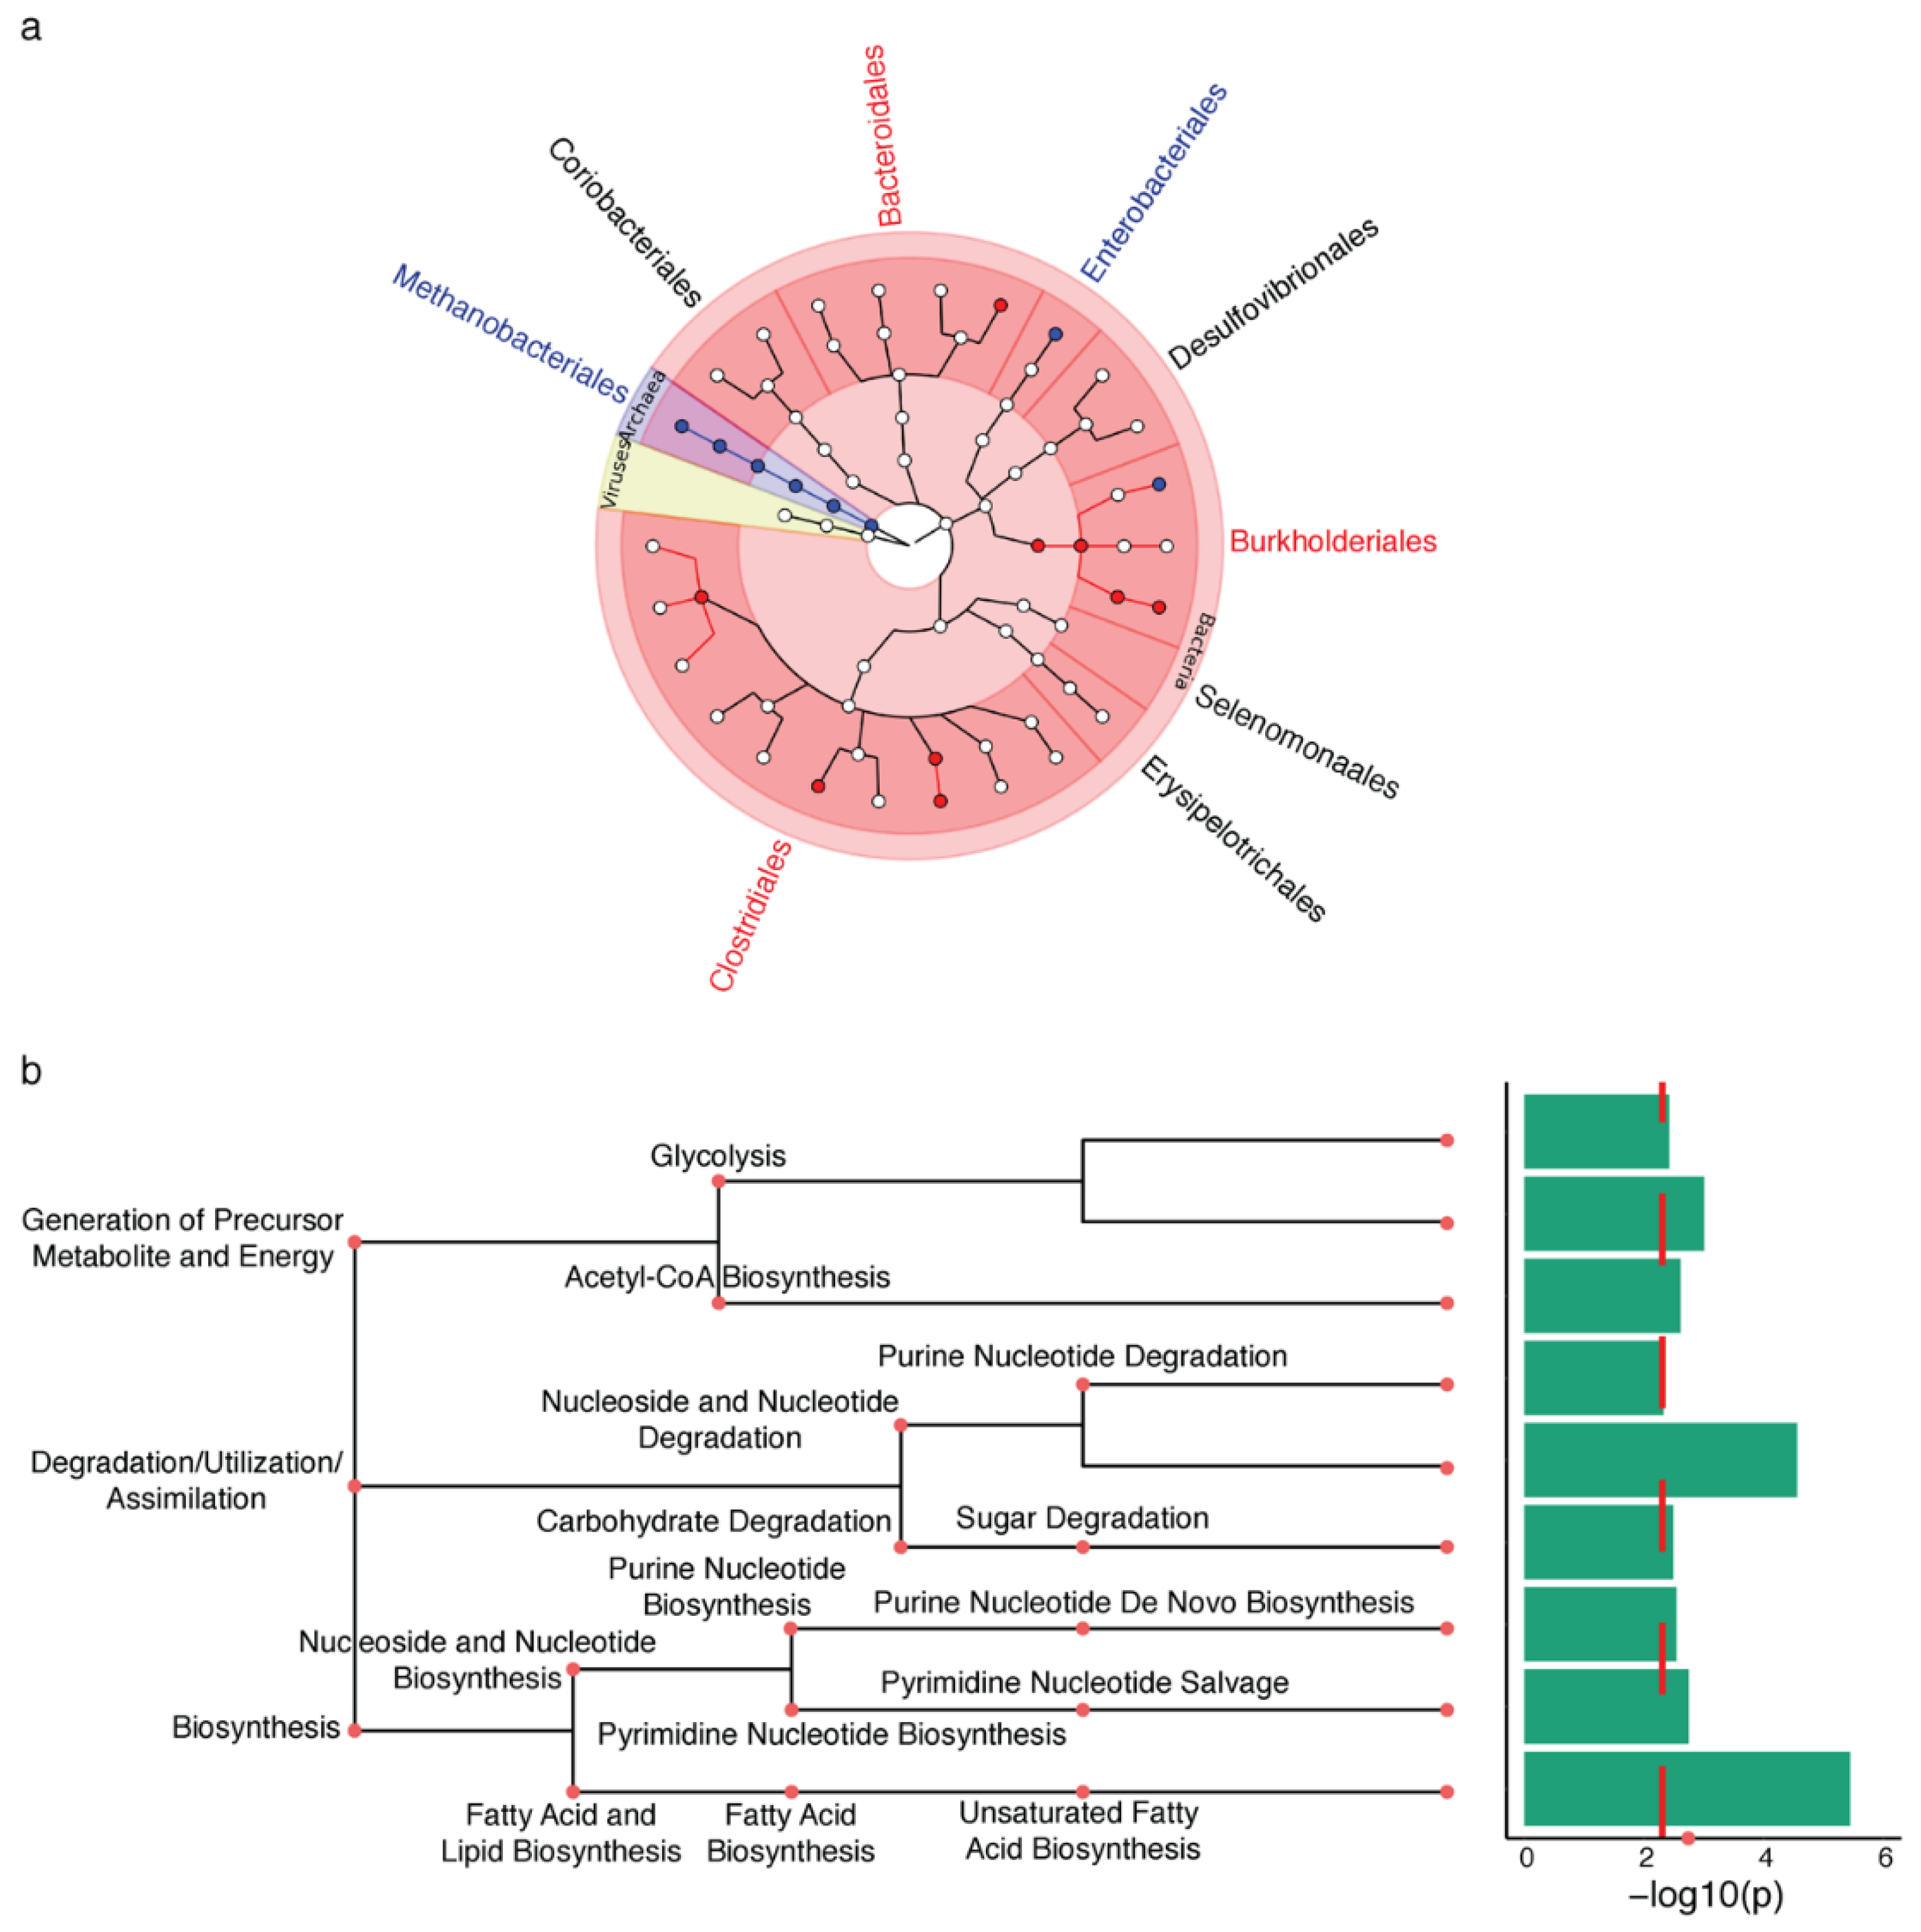
Abstract
1. Introduction
2. Results
2.1. Microbiota Changes in PD Appendix
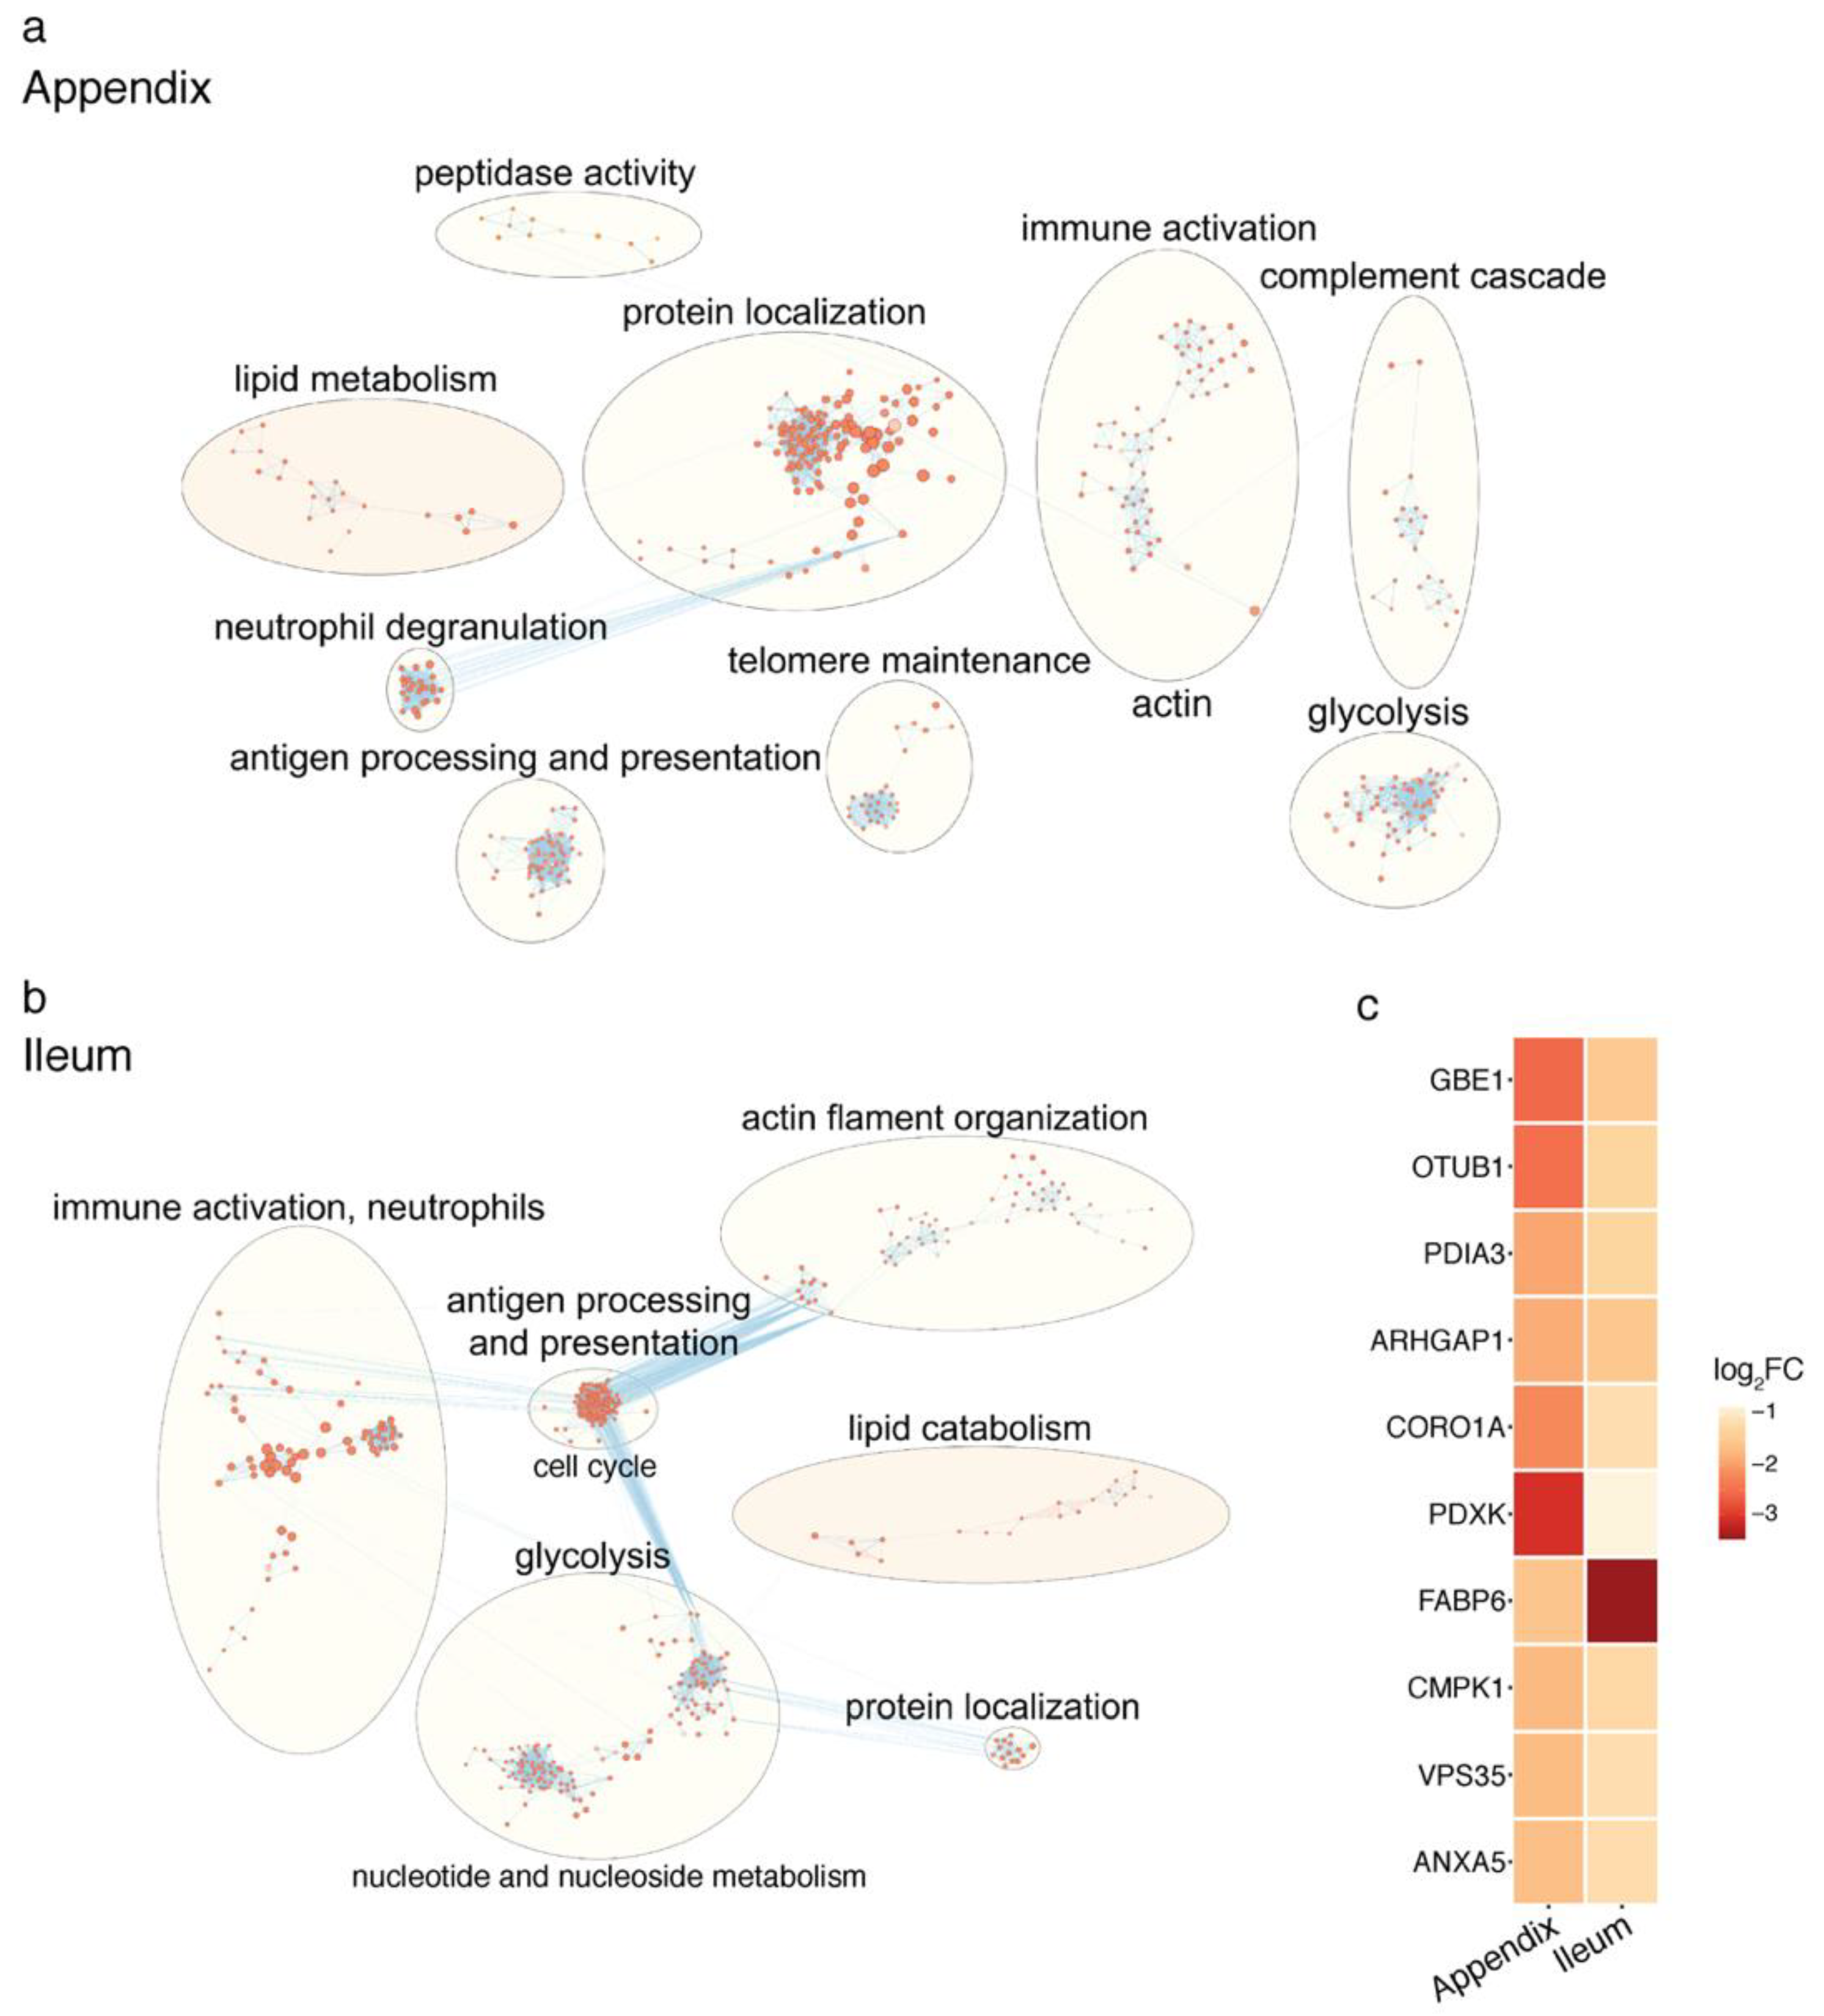
2.2. Proteomic Changes in the PD Gut
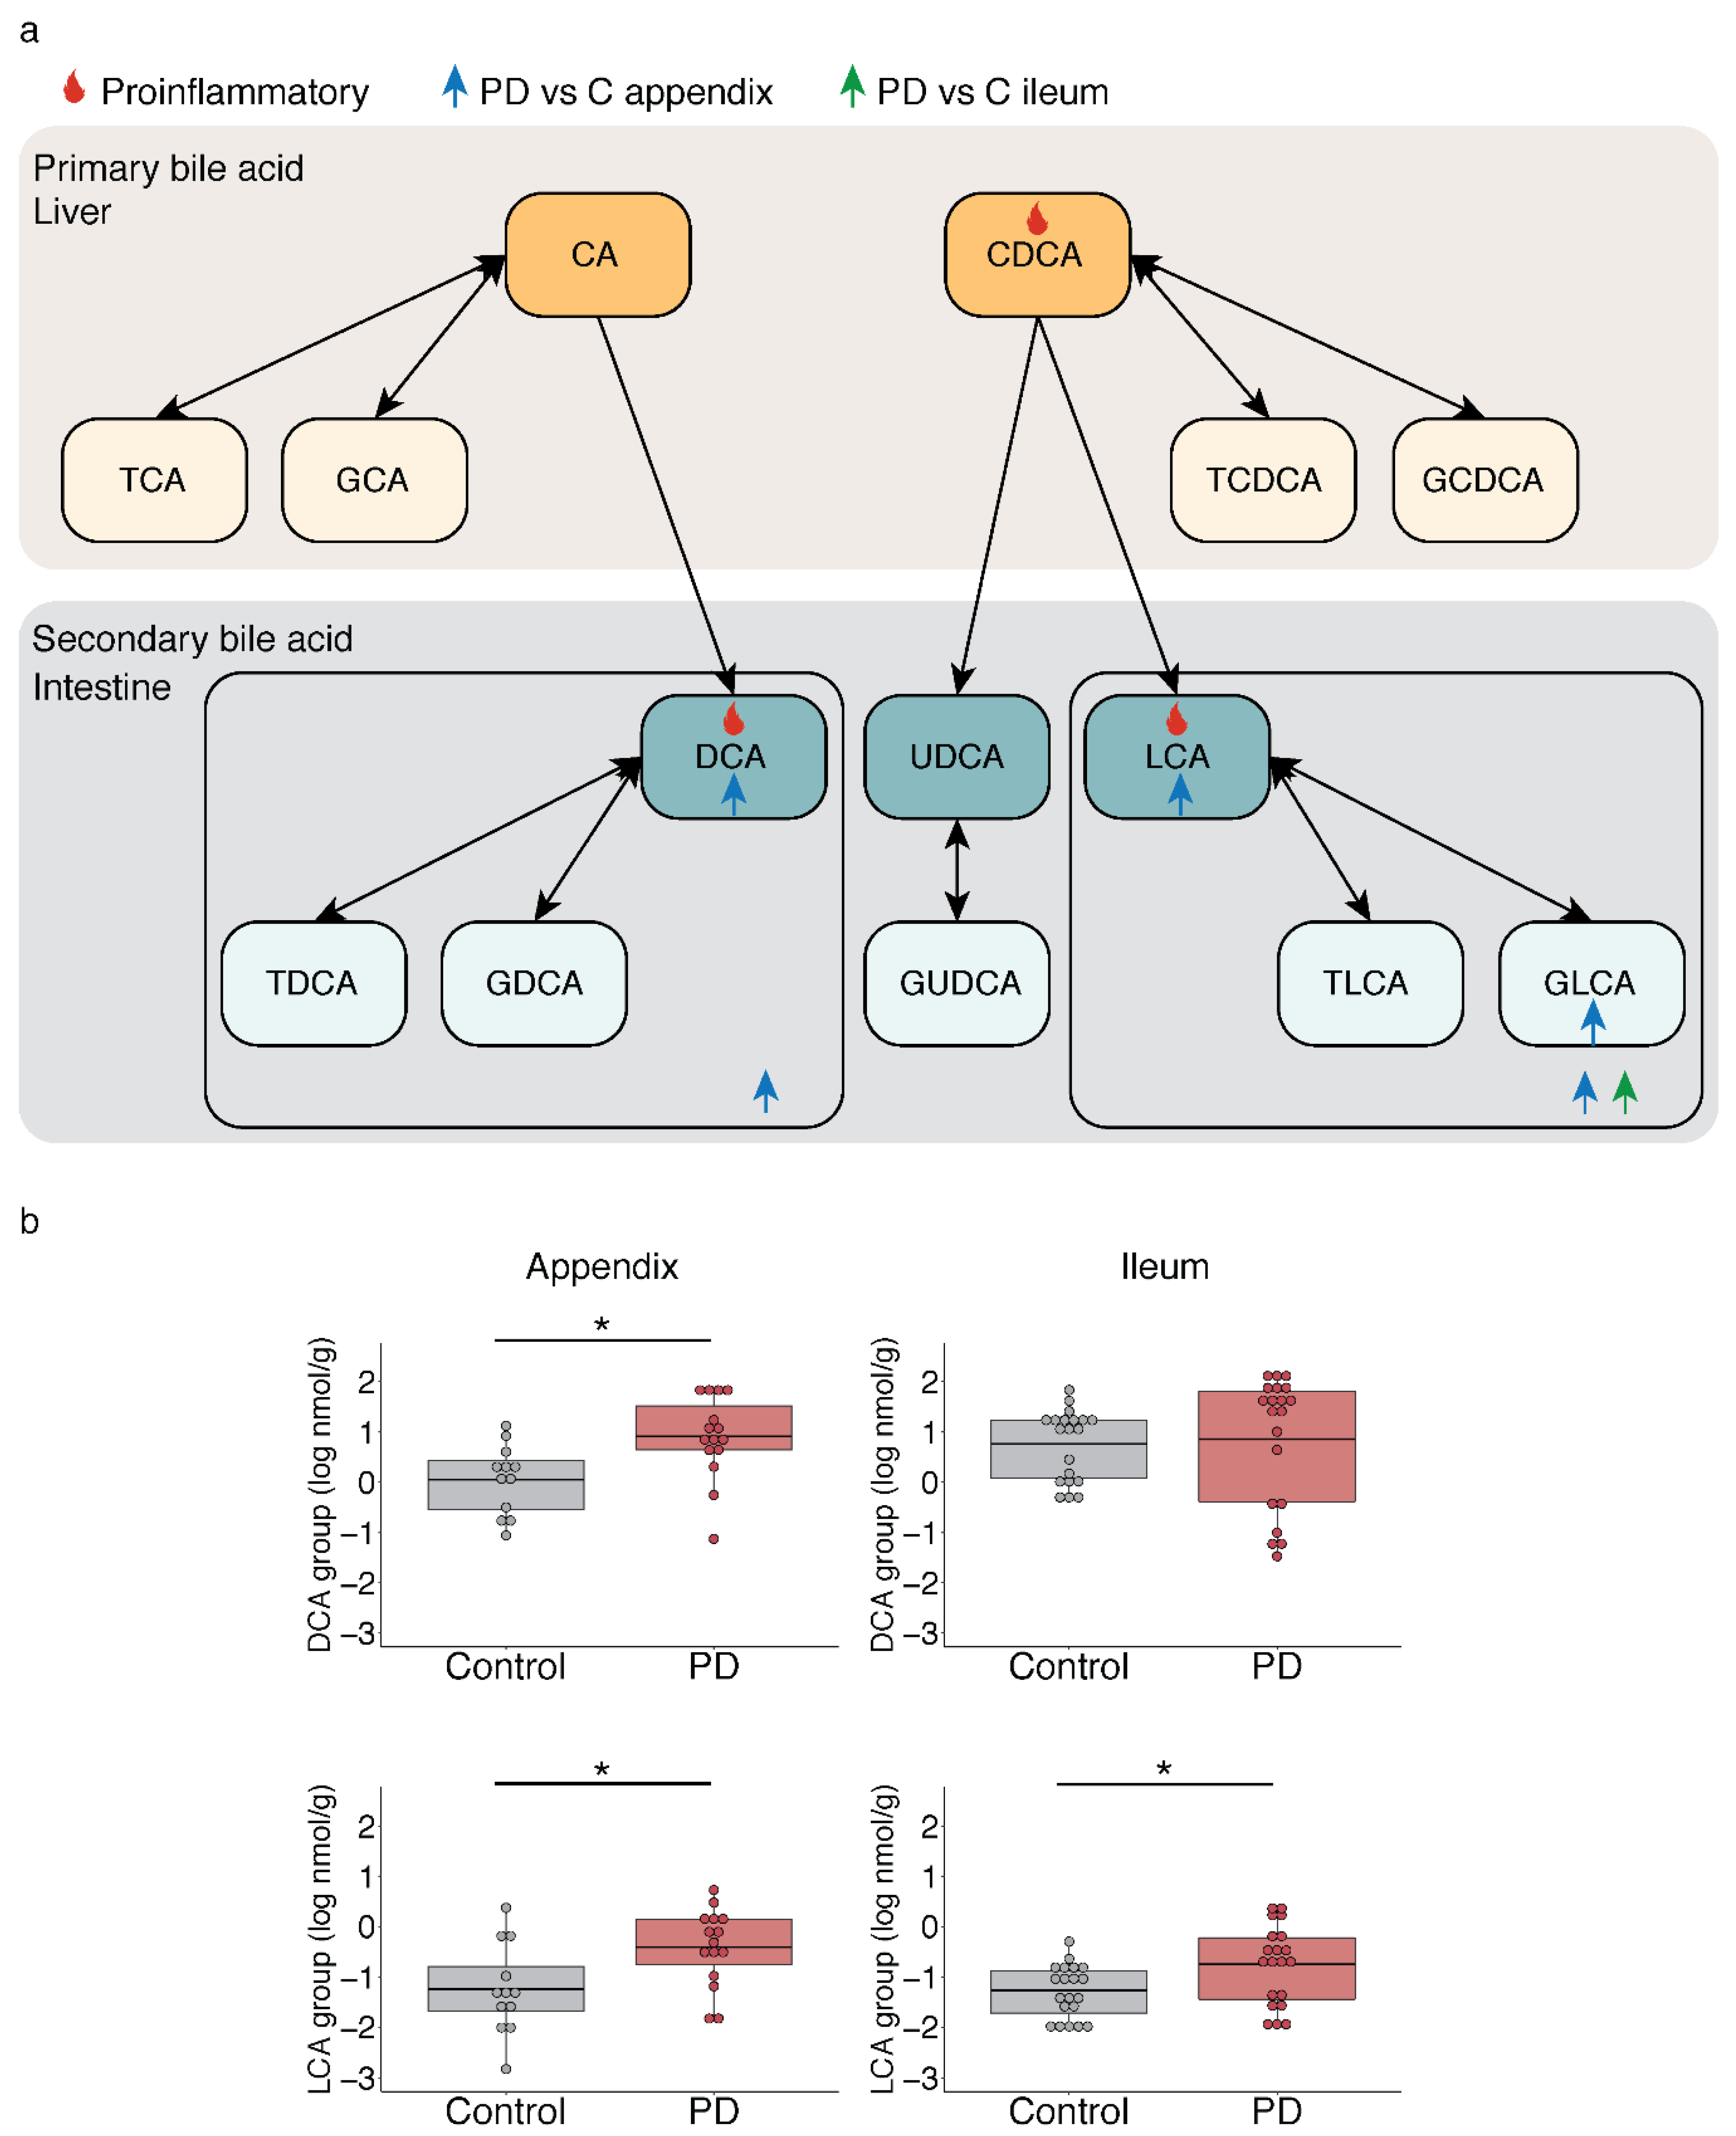
2.3. Microbiota-Driven Bile Acid Changes in the Gut of PD Patients
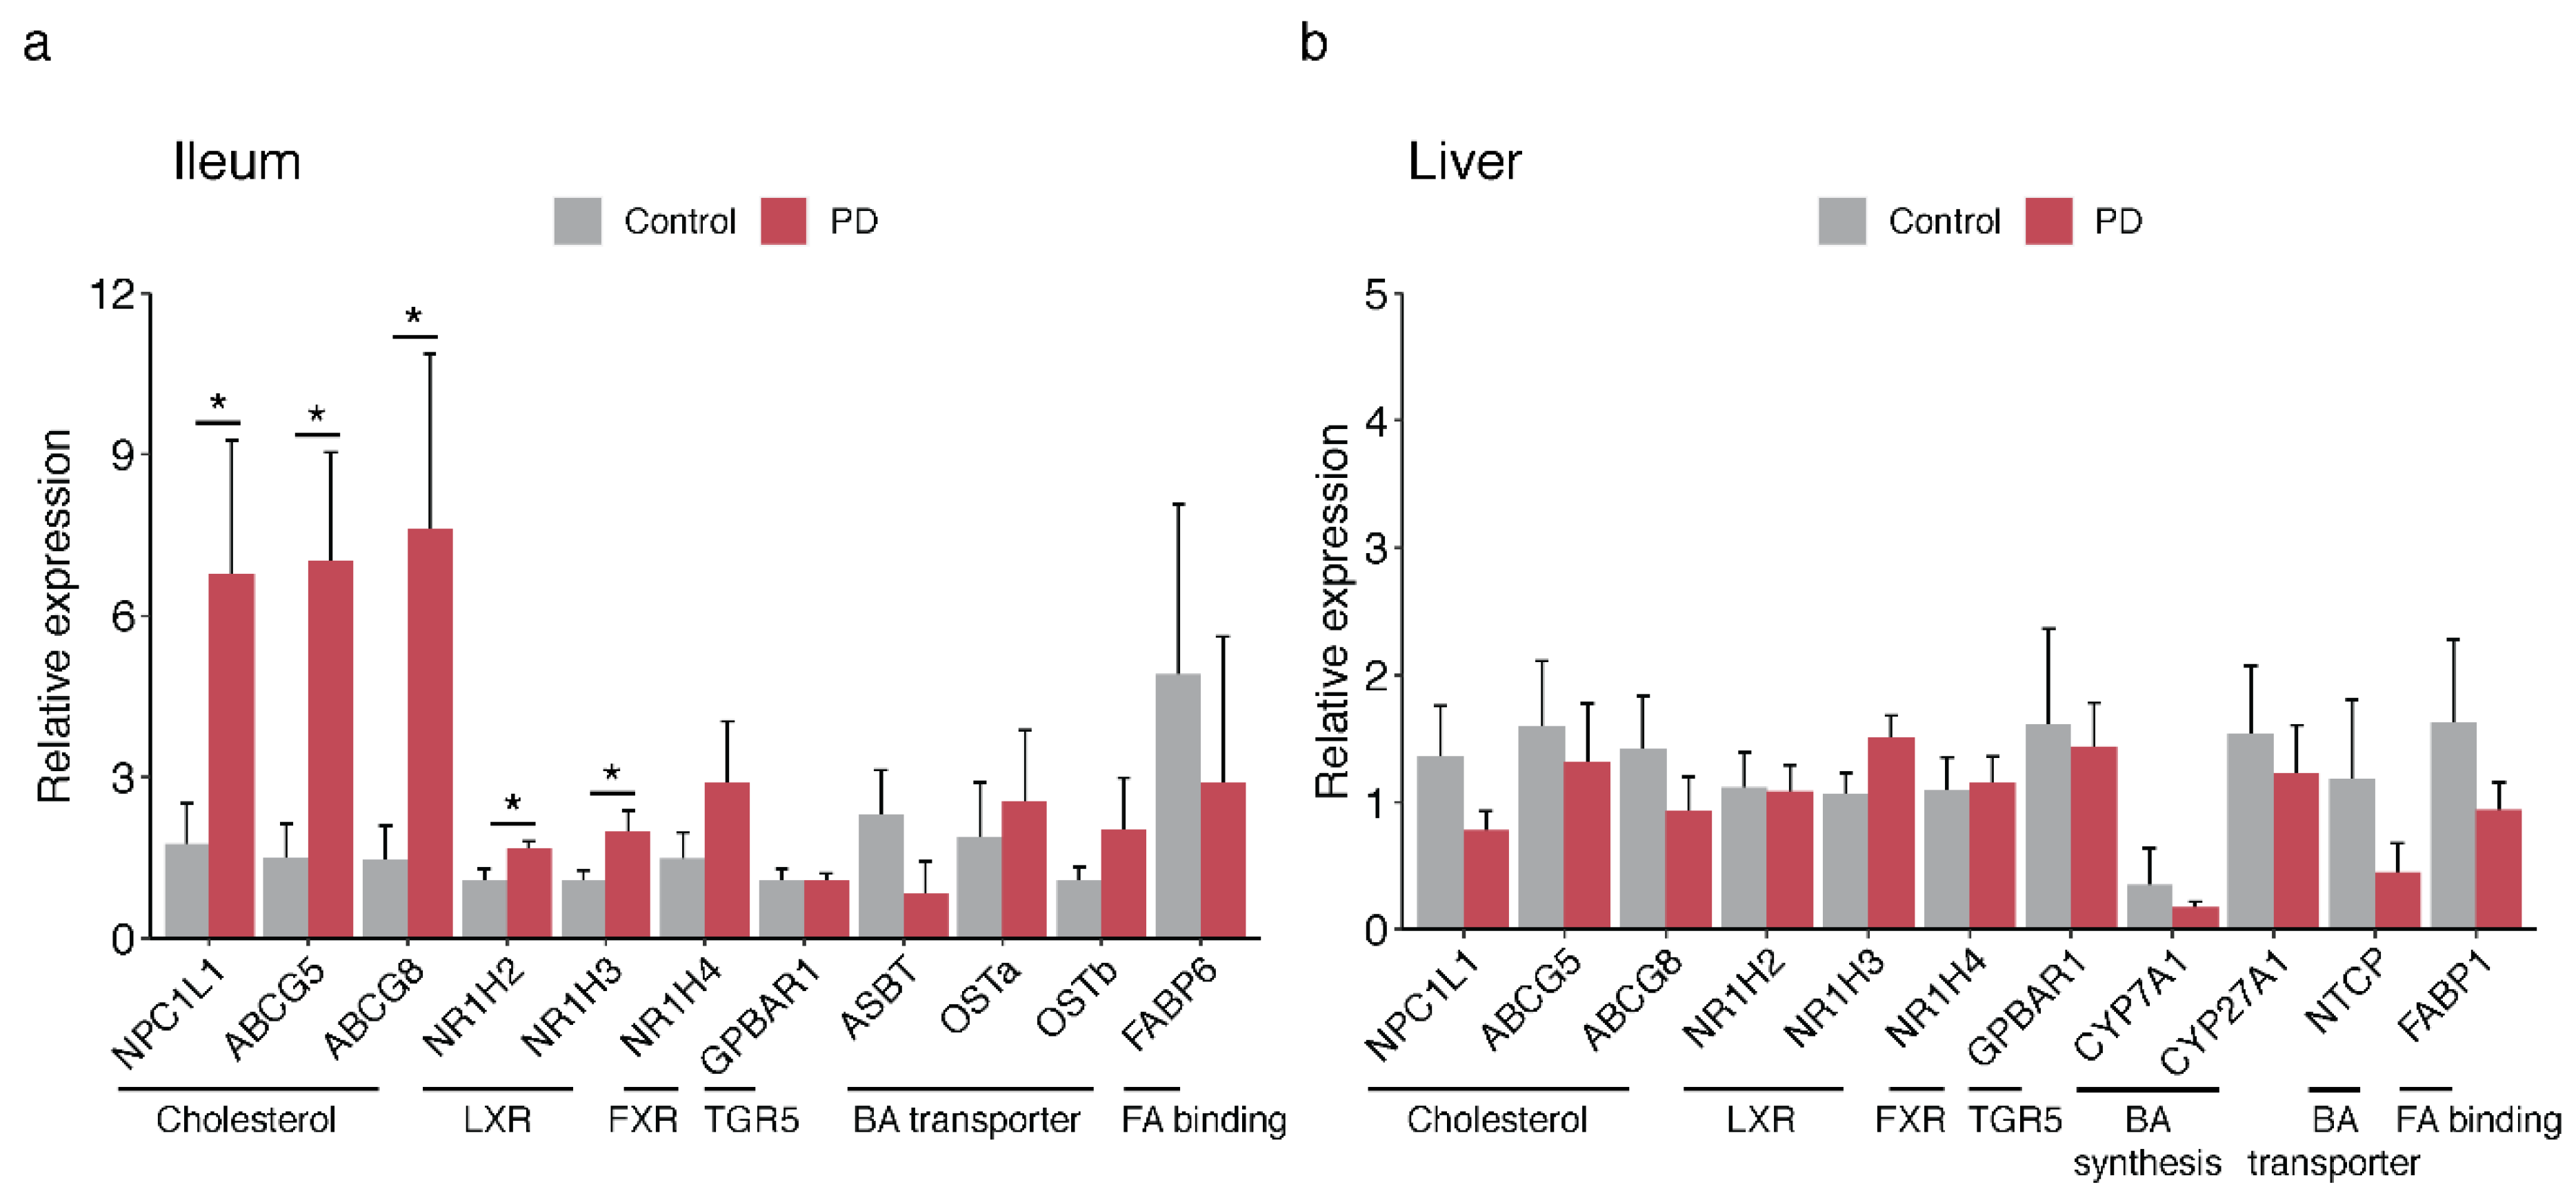
2.4. Bile-Associated Transcriptomic Changes in the PD Gut
3. Discussion
4. Materials and Methods
4.1. Human Tissue Samples
4.2. Metatranscriptomic Analysis of PD Appendix Microbiota
4.3. Mass Spectrometry and Proteomics Analysis
4.4. Bile Acid Sample Preparation and Metabolite Quantification
4.5. qPCR Analysis of Gene Transcripts Involved in Bile Acid and Cholesterol Homeostasis
Supplementary Materials
Author Contributions
Funding
Institutional Review Board Statement
Informed Consent Statement
Data Availability Statement
Acknowledgments
Conflicts of Interest
References
- Ascherio, A.; Schwarzschild, M.A. The epidemiology of Parkinson’s disease: Risk factors and prevention. Lancet Neurol. 2016, 15, 1257–1272. [Google Scholar] [CrossRef]
- Kalia, L.V.; Lang, A.E. Parkinson’s disease. Lancet 2015, 386, 896–912. [Google Scholar] [CrossRef]
- Stokholm, M.G.; Danielsen, E.H.; Hamilton-Dutoit, S.J.; Borghammer, P. Pathological α-synuclein in gastrointestinal tissues from prodromal Parkinson disease patients. Ann. Neurol. 2016, 79, 940–949. [Google Scholar] [CrossRef]
- Hilton, D.; Stephens, M.; Kirk, L.; Edwards, P.; Potter, R.; Zajicek, J.; Broughton, E.; Hagan, H.; Carroll, C. Accumulation of α-synuclein in the bowel of patients in the pre-clinical phase of Parkinson’s disease. Acta Neuropathol. 2014, 127, 235–241. [Google Scholar] [CrossRef]
- Kim, S.; Kwon, S.-H.; Kam, T.-I.; Panicker, N.; Karuppagounder, S.S.; Lee, S.; Lee, J.H.; Kim, W.R.; Kook, M.; Foss, C.A.; et al. Transneuronal Propagation of Pathologic α-Synuclein from the Gut to the Brain Models Parkinson’s Disease. Neuron 2019, 103, 627–641.e627. [Google Scholar] [CrossRef]
- Van Den Berge, N.; Ferreira, N.; Gram, H.; Mikkelsen, T.W.; Alstrup, A.K.O.; Casadei, N.; Tsung-Pin, P.; Riess, O.; Nyengaard, J.R.; Tamgüney, G.; et al. Evidence for bidirectional and trans-synaptic parasympathetic and sympathetic propagation of alpha-synuclein in rats. Acta Neuropathol. 2019, 138, 535–550. [Google Scholar] [CrossRef]
- Killinger, B.A.; Madaj, Z.; Sikora, J.W.; Rey, N.; Haas, A.J.; Vepa, Y.; Lindqvist, D.; Chen, H.; Thomas, P.M.; Brundin, P.; et al. The vermiform appendix impacts the risk of developing Parkinson’s disease. Sci. Transl. Med. 2018, 10. [Google Scholar] [CrossRef]
- Marras, C.; Lang, A.E.; Austin, P.C.; Lau, C.; Urbach, D.R. Appendectomy in mid and later life and risk of Parkinson’s disease: A population-based study. Mov. Disord. 2016, 31, 1243–1247. [Google Scholar] [CrossRef]
- Liu, B.; Fang, F.; Ye, W.; Wirdefeldt, K. Appendectomy, Tonsillectomy and Parkinson’s Disease Risk: A Swedish Register-Based Study. Front. Neurol. 2020, 11, 510. [Google Scholar] [CrossRef]
- Donaldson, G.P.; Lee, S.M.; Mazmanian, S.K. Gut biogeography of the bacterial microbiota. Nat. Rev. Microbiol. 2016, 14, 20–32. [Google Scholar] [CrossRef]
- Killinger, B.; Labrie, V. The Appendix in Parkinson’s Disease: From Vestigial Remnant to Vital Organ? J. Parkinson’s Dis. 2019, 9, S345–S358. [Google Scholar] [CrossRef]
- Fung, T.C.; Olson, C.A.; Hsiao, E.Y. Interactions between the microbiota, immune and nervous systems in health and disease. Nat. Neurosci. 2017, 20, 145–155. [Google Scholar] [CrossRef] [PubMed]
- Scheperjans, F.; Aho, V.; Pereira, P.A.B.; Koskinen, K.; Paulin, L.; Pekkonen, E.; Haapaniemi, E.; Kaakkola, S.; Eerola-Rautio, J.; Pohja, M.; et al. Gut microbiota are related to Parkinson’s disease and clinical phenotype. Mov. Disord. 2015, 30, 350–358. [Google Scholar] [CrossRef] [PubMed]
- Bedarf, J.R.; Hildebrand, F.; Coelho, L.P.; Sunagawa, S.; Bahram, M.; Goeser, F.; Bork, P.; Wüllner, U. Functional implications of microbial and viral gut metagenome changes in early stage L-DOPA-naïve Parkinson’s disease patients. Genome Med. 2017, 9, 39. [Google Scholar] [CrossRef] [PubMed]
- Perez-Pardo, P.; Dodiya, H.B.; Engen, P.A.; Forsyth, C.B.; Huschens, A.M.; Shaikh, M.; Voigt, R.M.; Naqib, A.; Green, S.J.; Kordower, J.H.; et al. Role of TLR4 in the gut-brain axis in Parkinson’s disease: A translational study from men to mice. Gut 2019, 68, 829–843. [Google Scholar] [CrossRef]
- Heinzel, S.; Aho, V.T.E.; Suenkel, U.; von Thaler, A.K.; Schulte, C.; Deuschle, C.; Paulin, L.; Hantunen, S.; Brockmann, K.; Eschweiler, G.W.; et al. Gut Microbiome Signatures of Risk and Prodromal Markers of Parkinson Disease. Ann. Neurol. 2020, 88, 320–331. [Google Scholar] [CrossRef]
- Jackson, H.T.; Mongodin, E.F.; Davenport, K.P.; Fraser, C.M.; Sandler, A.D.; Zeichner, S.L. Culture-independent evaluation of the appendix and rectum microbiomes in children with and without appendicitis. PLoS ONE 2014, 9, e95414. [Google Scholar] [CrossRef]
- Tytgat, H.L.P.; Nobrega, F.L.; van der Oost, J.; de Vos, W.M. Bowel Biofilms: Tipping Points between a Healthy and Compromised Gut? Trends Microbiol. 2019, 27, 17–25. [Google Scholar] [CrossRef]
- Masahata, K.; Umemoto, E.; Kayama, H.; Kotani, M.; Nakamura, S.; Kurakawa, T.; Kikuta, J.; Gotoh, K.; Motooka, D.; Sato, S.; et al. Generation of colonic IgA-secreting cells in the caecal patch. Nat. Commun. 2014, 5, 3704. [Google Scholar] [CrossRef]
- Sanchez-Alcoholado, L.; Fernandez-Garcia, J.C.; Gutierrez-Repiso, C.; Bernal-Lopez, M.R.; Ocana-Wilhelmi, L.; Garcia-Fuentes, E.; Moreno-Indias, I.; Tinahones, F.J. Incidental Prophylactic Appendectomy Is Associated with a Profound Microbial Dysbiosis in the Long-Term. Microorganisms 2020, 8, 609. [Google Scholar] [CrossRef]
- Johnson, M.E.; Stecher, B.; Labrie, V.; Brundin, L.; Brundin, P. Triggers, Facilitators, and Aggravators: Redefining Parkinson’s Disease Pathogenesis. Trends Neurosci. 2019, 42, 4–13. [Google Scholar] [CrossRef] [PubMed]
- van Kessel, S.P.; El Aidy, S. Bacterial Metabolites Mirror Altered Gut Microbiota Composition in Patients with Parkinson’s Disease. J. Parkinsons Dis. 2019, 9, S359–S370. [Google Scholar] [CrossRef] [PubMed]
- Schulthess, J.; Pandey, S.; Capitani, M.; Rue-Albrecht, K.C.; Arnold, I.; Franchini, F.; Chomka, A.; Ilott, N.E.; Johnston, D.G.W.; Pires, E.; et al. The Short Chain Fatty Acid Butyrate Imprints an Antimicrobial Program in Macrophages. Immunity 2019, 50, 432–445.e437. [Google Scholar] [CrossRef] [PubMed]
- Bachem, A.; Makhlouf, C.; Binger, K.J.; de Souza, D.P.; Tull, D.; Hochheiser, K.; Whitney, P.G.; Fernandez-Ruiz, D.; Dahling, S.; Kastenmuller, W.; et al. Microbiota-Derived Short-Chain Fatty Acids Promote the Memory Potential of Antigen-Activated CD8(+) T Cells. Immunity 2019, 51, 285–297.e285. [Google Scholar] [CrossRef] [PubMed]
- Chun, E.; Lavoie, S.; Fonseca-Pereira, D.; Bae, S.; Michaud, M.; Hoveyda, H.R.; Fraser, G.L.; Gallini Comeau, C.A.; Glickman, J.N.; Fuller, M.H.; et al. Metabolite-Sensing Receptor Ffar2 Regulates Colonic Group 3 Innate Lymphoid Cells and Gut Immunity. Immunity 2019, 51, 871–884.e876. [Google Scholar] [CrossRef] [PubMed]
- Wahlström, A.; Sayin, S.I.; Marschall, H.-U.; Bäckhed, F. Intestinal Crosstalk between Bile Acids and Microbiota and Its Impact on Host Metabolism. Cell Metabolism. 2016, 24, 41–50. [Google Scholar] [CrossRef]
- Hegyi, P.; Maléth, J.; Walters, J.R.; Hofmann, A.F.; Keely, S.J. Guts and Gall: Bile Acids in Regulation of Intestinal Epithelial Function in Health and Disease. Physiol. Rev. 2018, 98, 1983–2023. [Google Scholar] [CrossRef]
- McMillin, M.; DeMorrow, S. Effects of bile acids on neurological function and disease. FASEB J. 2016, 30, 3658–3668. [Google Scholar] [CrossRef]
- Chen, M.L.; Takeda, K.; Sundrud, M.S. Emerging roles of bile acids in mucosal immunity and inflammation. Mucosal Immunol 2019, 12, 851–861. [Google Scholar] [CrossRef]
- Pavlidis, P.; Powell, N.; Vincent, R.P.; Ehrlich, D.; Bjarnason, I.; Hayee, B. Systematic review: Bile acids and intestinal inflammation-luminal aggressors or regulators of mucosal defence? Aliment. Pharmacol. Ther. 2015, 42, 802–817. [Google Scholar] [CrossRef]
- Berr, F.; Mayer, M.; Sackmann, M.F.; Sauerbruch, T.; Holl, J.; Paumgartner, G. Pathogenic factors in early recurrence of cholesterol gallstones. Gastroenterology 1994, 106, 215–224. [Google Scholar] [CrossRef]
- Hang, S.; Paik, D.; Yao, L.; Kim, E.; Trinath, J.; Lu, J.; Ha, S.; Nelson, B.N.; Kelly, S.P.; Wu, L.; et al. Bile acid metabolites control TH17 and Treg cell differentiation. Nature 2019, 576, 143–148. [Google Scholar] [CrossRef] [PubMed]
- Song, X.; Sun, X.; Oh, S.F.; Wu, M.; Zhang, Y.; Zheng, W.; Geva-Zatorsky, N.; Jupp, R.; Mathis, D.; Benoist, C.; et al. Microbial bile acid metabolites modulate gut RORγ+ regulatory T cell homeostasis. Nature 2020, 577, 410–415. [Google Scholar] [CrossRef] [PubMed]
- Kolde, R.; Laur, S.; Adler, P.; Vilo, J. Robust rank aggregation for gene list integration and meta-analysis. Bioinformatics 2012, 28, 573–580. [Google Scholar] [CrossRef] [PubMed]
- Weis, S.; Schwiertz, A.; Unger, M.M.; Becker, A.; Faßbender, K.; Ratering, S.; Kohl, M.; Schnell, S.; Schäfer, K.-H.; Egert, M. Effect of Parkinson’s disease and related medications on the composition of the fecal bacterial microbiota. NPJ Parkinson’s Dis. 2019, 5, 28. [Google Scholar] [CrossRef] [PubMed]
- Alemi, F.; Poole, D.P.; Chiu, J.; Schoonjans, K.; Cattaruzza, F.; Grider, J.R.; Bunnett, N.W.; Corvera, C.U. The receptor TGR5 mediates the prokinetic actions of intestinal bile acids and is required for normal defecation in mice. Gastroenterology 2013, 144, 145–154. [Google Scholar] [CrossRef]
- Misawa, N.; Higurashi, T.; Takatsu, T.; Iwaki, M.; Kobayashi, T.; Yoshihara, T.; Ashikari, K.; Kessoku, T.; Fuyuki, A.; Matsuura, T.; et al. The benefit of elobixibat in chronic constipation is associated with faecal deoxycholic acid but not effects of altered microbiota. Aliment. Pharmacol. Ther. 2020, 52, 821–828. [Google Scholar] [CrossRef]
- Ge, X.; Zhao, W.; Ding, C.; Tian, H.; Xu, L.; Wang, H.; Ni, L.; Jiang, J.; Gong, J.; Zhu, W.; et al. Potential role of fecal microbiota from patients with slow transit constipation in the regulation of gastrointestinal motility. Sci. Rep. 2017, 7, 441. [Google Scholar] [CrossRef]
- Erny, D.; Hrabě de Angelis, A.L.; Jaitin, D.; Wieghofer, P.; Staszewski, O.; David, E.; Keren-Shaul, H.; Mahlakoiv, T.; Jakobshagen, K.; Buch, T.; et al. Host microbiota constantly control maturation and function of microglia in the CNS. Nat. Neurosci. 2015, 18, 965–977. [Google Scholar] [CrossRef]
- Sampson, T.R.; Debelius, J.W.; Thron, T.; Janssen, S.; Shastri, G.G.; Ilhan, Z.E.; Challis, C.; Schretter, C.E.; Rocha, S.; Gradinaru, V.; et al. Gut Microbiota Regulate Motor Deficits and Neuroinflammation in a Model of Parkinson’s Disease. Cell 2016, 167, 1469–1480.e1412. [Google Scholar] [CrossRef]
- Chiarini, L.; Bevivino, A.; Dalmastri, C.; Tabacchioni, S.; Visca, P. Burkholderia cepacia complex species: Health hazards and biotechnological potential. Trends Microbiol. 2006, 14, 277–286. [Google Scholar] [CrossRef] [PubMed]
- Kaur, H.; Bose, C.; Mande, S.S. Tryptophan Metabolism by Gut Microbiome and Gut-Brain-Axis: An in silico Analysis. Front. Neurosci 2019, 13, 1365. [Google Scholar] [CrossRef]
- Heilman, P.L.; Wang, E.W.; Lewis, M.M.; Krzyzanowski, S.; Capan, C.D.; Burmeister, A.R.; Du, G.; Escobar Galvis, M.L.; Brundin, P.; Huang, X.; et al. Tryptophan Metabolites Are Associated With Symptoms and Nigral Pathology in Parkinson’s Disease. Mov. Disord. 2020, 35, 2028–2037. [Google Scholar] [CrossRef] [PubMed]
- Hsueh, P.-T.; Lin, H.-H.; Liu, C.-L.; Ni, W.-F.; Chen, Y.-L.; Chen, Y.-S. Burkholderia pseudomallei-loaded cells act as a Trojan horse to invade the brain during endotoxemia. Sci. Rep. 2018, 8, 13632. [Google Scholar] [CrossRef] [PubMed]
- St John, J.A.; Walkden, H.; Nazareth, L.; Beagley, K.W.; Ulett, G.C.; Batzloff, M.R.; Beacham, I.R.; Ekberg, J.A. Burkholderia pseudomallei Rapidly Infects the Brain Stem and Spinal Cord via the Trigeminal Nerve after Intranasal Inoculation. Infect. Immun. 2016, 84, 2681–2688. [Google Scholar] [CrossRef]
- Wallner, A.; King, E.; Ngonkeu, E.L.M.; Moulin, L.; Béna, G. Genomic analyses of Burkholderia cenocepacia reveal multiple species with differential host-adaptation to plants and humans. BMC Genom. 2019, 20, 803. [Google Scholar] [CrossRef]
- Kishimoto, Y.; Zhu, W.; Hosoda, W.; Sen, J.M.; Mattson, M.P. Chronic Mild Gut Inflammation Accelerates Brain Neuropathology and Motor Dysfunction in α-Synuclein Mutant Mice. Neuromolecular. Med. 2019, 21, 239–249. [Google Scholar] [CrossRef]
- Stolzenberg, E.; Berry, D.; Yang, D.; Lee, E.Y.; Kroemer, A.; Kaufman, S.; Wong, G.C.L.; Oppenheim, J.J.; Sen, S.; Fishbein, T.; et al. A Role for Neuronal Alpha-Synuclein in Gastrointestinal Immunity. J. Innate Immun. 2017, 9, 456–463. [Google Scholar] [CrossRef]
- Yue, S.; Zhao, D.; Peng, C.; Tan, C.; Wang, Q.; Gong, J. Effects of theabrownin on serum metabolites and gut microbiome in rats with a high-sugar diet. Food Funct. 2019, 10, 7063–7080. [Google Scholar] [CrossRef]
- Anderson, G.; Seo, M.; Berk, M.; Carvalho, A.F.; Maes, M. Gut Permeability and Microbiota in Parkinson’s Disease: Role of Depression, Tryptophan Catabolites, Oxidative and Nitrosative Stress and Melatonergic Pathways. Curr. Pharm. Des. 2016, 22, 6142–6151. [Google Scholar] [CrossRef]
- Duboc, H.; Rajca, S.; Rainteau, D.; Benarous, D.; Maubert, M.-A.; Quervain, E.; Thomas, G.; Barbu, V.; Humbert, L.; Despras, G.; et al. Connecting dysbiosis, bile-acid dysmetabolism and gut inflammation in inflammatory bowel diseases. Gut 2013, 62, 531–539. [Google Scholar] [CrossRef] [PubMed]
- Guo, C.; Xie, S.; Chi, Z.; Zhang, J.; Liu, Y.; Zhang, L.; Zheng, M.; Zhang, X.; Xia, D.; Ke, Y.; et al. Bile Acids Control Inflammation and Metabolic Disorder through Inhibition of NLRP3 Inflammasome. Immunity 2016, 45, 802–816. [Google Scholar] [CrossRef] [PubMed]
- Ma, C.; Han, M.; Heinrich, B.; Fu, Q.; Zhang, Q.; Sandhu, M.; Agdashian, D.; Terabe, M.; Berzofsky, J.A.; Fako, V.; et al. Gut microbiome-mediated bile acid metabolism regulates liver cancer via NKT cells. Science 2018, 360. [Google Scholar] [CrossRef] [PubMed]
- Praslickova, D.; Torchia, E.C.; Sugiyama, M.G.; Magrane, E.J.; Zwicker, B.L.; Kolodzieyski, L.; Agellon, L.B. The ileal lipid binding protein is required for efficient absorption and transport of bile acids in the distal portion of the murine small intestine. PLoS ONE 2012, 7, e50810. [Google Scholar] [CrossRef] [PubMed]
- Mullish, B.H.; McDonald, J.A.K.; Pechlivanis, A.; Allegretti, J.R.; Kao, D.; Barker, G.F.; Kapila, D.; Petrof, E.O.; Joyce, S.A.; Gahan, C.G.M.; et al. Microbial bile salt hydrolases mediate the efficacy of faecal microbiota transplant in the treatment of recurrent Clostridioides difficile infection. Gut 2019, 68, 1791–1800. [Google Scholar] [CrossRef]
- Rodrigues, C.M.; Fan, G.; Wong, P.Y.; Kren, B.T.; Steer, C.J. Ursodeoxycholic acid may inhibit deoxycholic acid-induced apoptosis by modulating mitochondrial transmembrane potential and reactive oxygen species production. Mol. Med. 1998, 4, 165–178. [Google Scholar] [CrossRef]
- Salen, G.; Colalillo, A.; Verga, D.; Bagan, E.; Tint, G.S.; Shefer, S. Effect of high and low doses of ursodeoxycholic acid on gallstone dissolution in humans. Gastroenterology 1980, 78, 1412–1418. [Google Scholar] [CrossRef]
- Mortiboys, H.; Furmston, R.; Bronstad, G.; Aasly, J.; Elliott, C.; Bandmann, O. UDCA exerts beneficial effect on mitochondrial dysfunction in LRRK2(G2019S) carriers and in vivo. Neurology 2015, 85, 846–852. [Google Scholar] [CrossRef]
- Sathe, A.G.; Tuite, P.; Chen, C.; Ma, Y.; Chen, W.; Cloyd, J.; Low, W.C.; Steer, C.J.; Lee, B.-Y.; Zhu, X.-H.; et al. Pharmacokinetics, Safety, and Tolerability of Orally Administered Ursodeoxycholic Acid in Patients With Parkinson’s Disease-A Pilot Study. J. Clin. Pharmacol. 2020, 60, 744–750. [Google Scholar] [CrossRef]
- Dobin, A.; Davis, C.A.; Schlesinger, F.; Drenkow, J.; Zaleski, C.; Jha, S.; Batut, P.; Chaisson, M.; Gingeras, T.R. STAR: Ultrafast universal RNA-seq aligner. Bioinformatics 2013, 29, 15–21. [Google Scholar] [CrossRef]
- Segata, N.; Waldron, L.; Ballarini, A.; Narasimhan, V.; Jousson, O.; Huttenhower, C. Metagenomic microbial community profiling using unique clade-specific marker genes. Nat. Methods 2012, 9, 811–814. [Google Scholar] [CrossRef]
- Franzosa, E.A.; McIver, L.J.; Rahnavard, G.; Thompson, L.R.; Schirmer, M.; Weingart, G.; Lipson, K.S.; Knight, R.; Caporaso, J.G.; Segata, N.; et al. Species-level functional profiling of metagenomes and metatranscriptomes. Nat. Methods 2018, 15, 962–968. [Google Scholar] [CrossRef]
- Paulson, J.N.; Stine, O.C.; Bravo, H.C.; Pop, M. Differential abundance analysis for microbial marker-gene surveys. Nat. Methods 2013, 10, 1200–1202. [Google Scholar] [CrossRef]
- Raudvere, U.; Kolberg, L.; Kuzmin, I.; Arak, T.; Adler, P.; Peterson, H.; Vilo, J. g:Profiler: A web server for functional enrichment analysis and conversions of gene lists (2019 update). Nucleic Acids Res. 2019, 47, W191–W198. [Google Scholar] [CrossRef]
- Reimand, J.; Isserlin, R.; Voisin, V.; Kucera, M.; Tannus-Lopes, C.; Rostamianfar, A.; Wadi, L.; Meyer, M.; Wong, J.; Xu, C.; et al. Pathway enrichment analysis and visualization of omics data using g:Profiler, GSEA, Cytoscape and EnrichmentMap. Nat. Protoc. 2019, 14, 482–517. [Google Scholar] [CrossRef]
- Pan, X.; Elliott, C.T.; McGuinness, B.; Passmore, P.; Kehoe, P.G.; Holscher, C.; McClean, P.L.; Graham, S.F.; Green, B.D. Metabolomic Profiling of Bile Acids in Clinical and Experimental Samples of Alzheimer’s Disease. Metabolites 2017, 7, 28. [Google Scholar] [CrossRef]
- Ritchie, M.E.; Phipson, B.; Wu, D.; Hu, Y.; Law, C.W.; Shi, W.; Smyth, G.K. Limma powers differential expression analyses for RNA-sequencing and microarray studies. Nucleic Acids Res. 2015, 43, e47. [Google Scholar] [CrossRef]


Publisher’s Note: MDPI stays neutral with regard to jurisdictional claims in published maps and institutional affiliations. |
© 2021 by the authors. Licensee MDPI, Basel, Switzerland. This article is an open access article distributed under the terms and conditions of the Creative Commons Attribution (CC BY) license (http://creativecommons.org/licenses/by/4.0/).
Share and Cite
Li, P.; Killinger, B.A.; Ensink, E.; Beddows, I.; Yilmaz, A.; Lubben, N.; Lamp, J.; Schilthuis, M.; Vega, I.E.; Woltjer, R.; et al. Gut Microbiota Dysbiosis Is Associated with Elevated Bile Acids in Parkinson’s Disease. Metabolites 2021, 11, 29. https://doi.org/10.3390/metabo11010029
Li P, Killinger BA, Ensink E, Beddows I, Yilmaz A, Lubben N, Lamp J, Schilthuis M, Vega IE, Woltjer R, et al. Gut Microbiota Dysbiosis Is Associated with Elevated Bile Acids in Parkinson’s Disease. Metabolites. 2021; 11(1):29. https://doi.org/10.3390/metabo11010029
Chicago/Turabian StyleLi, Peipei, Bryan A. Killinger, Elizabeth Ensink, Ian Beddows, Ali Yilmaz, Noah Lubben, Jared Lamp, Meghan Schilthuis, Irving E. Vega, Randy Woltjer, and et al. 2021. "Gut Microbiota Dysbiosis Is Associated with Elevated Bile Acids in Parkinson’s Disease" Metabolites 11, no. 1: 29. https://doi.org/10.3390/metabo11010029
APA StyleLi, P., Killinger, B. A., Ensink, E., Beddows, I., Yilmaz, A., Lubben, N., Lamp, J., Schilthuis, M., Vega, I. E., Woltjer, R., Pospisilik, J. A., Brundin, P., Brundin, L., Graham, S. F., & Labrie, V. (2021). Gut Microbiota Dysbiosis Is Associated with Elevated Bile Acids in Parkinson’s Disease. Metabolites, 11(1), 29. https://doi.org/10.3390/metabo11010029