Effect of n-3 (Omega-3) Polyunsaturated Fatty Acid Supplementation on Metabolic and Inflammatory Biomarkers and Body Weight in Patients with Type 2 Diabetes Mellitus: A Systematic Review and Meta-Analysis of RCTs
Abstract
:1. Introduction
2. Results
2.1. Characteristics of Included Studies
2.2. Meta-Analysis Results
2.2.1. Glycemic Factors
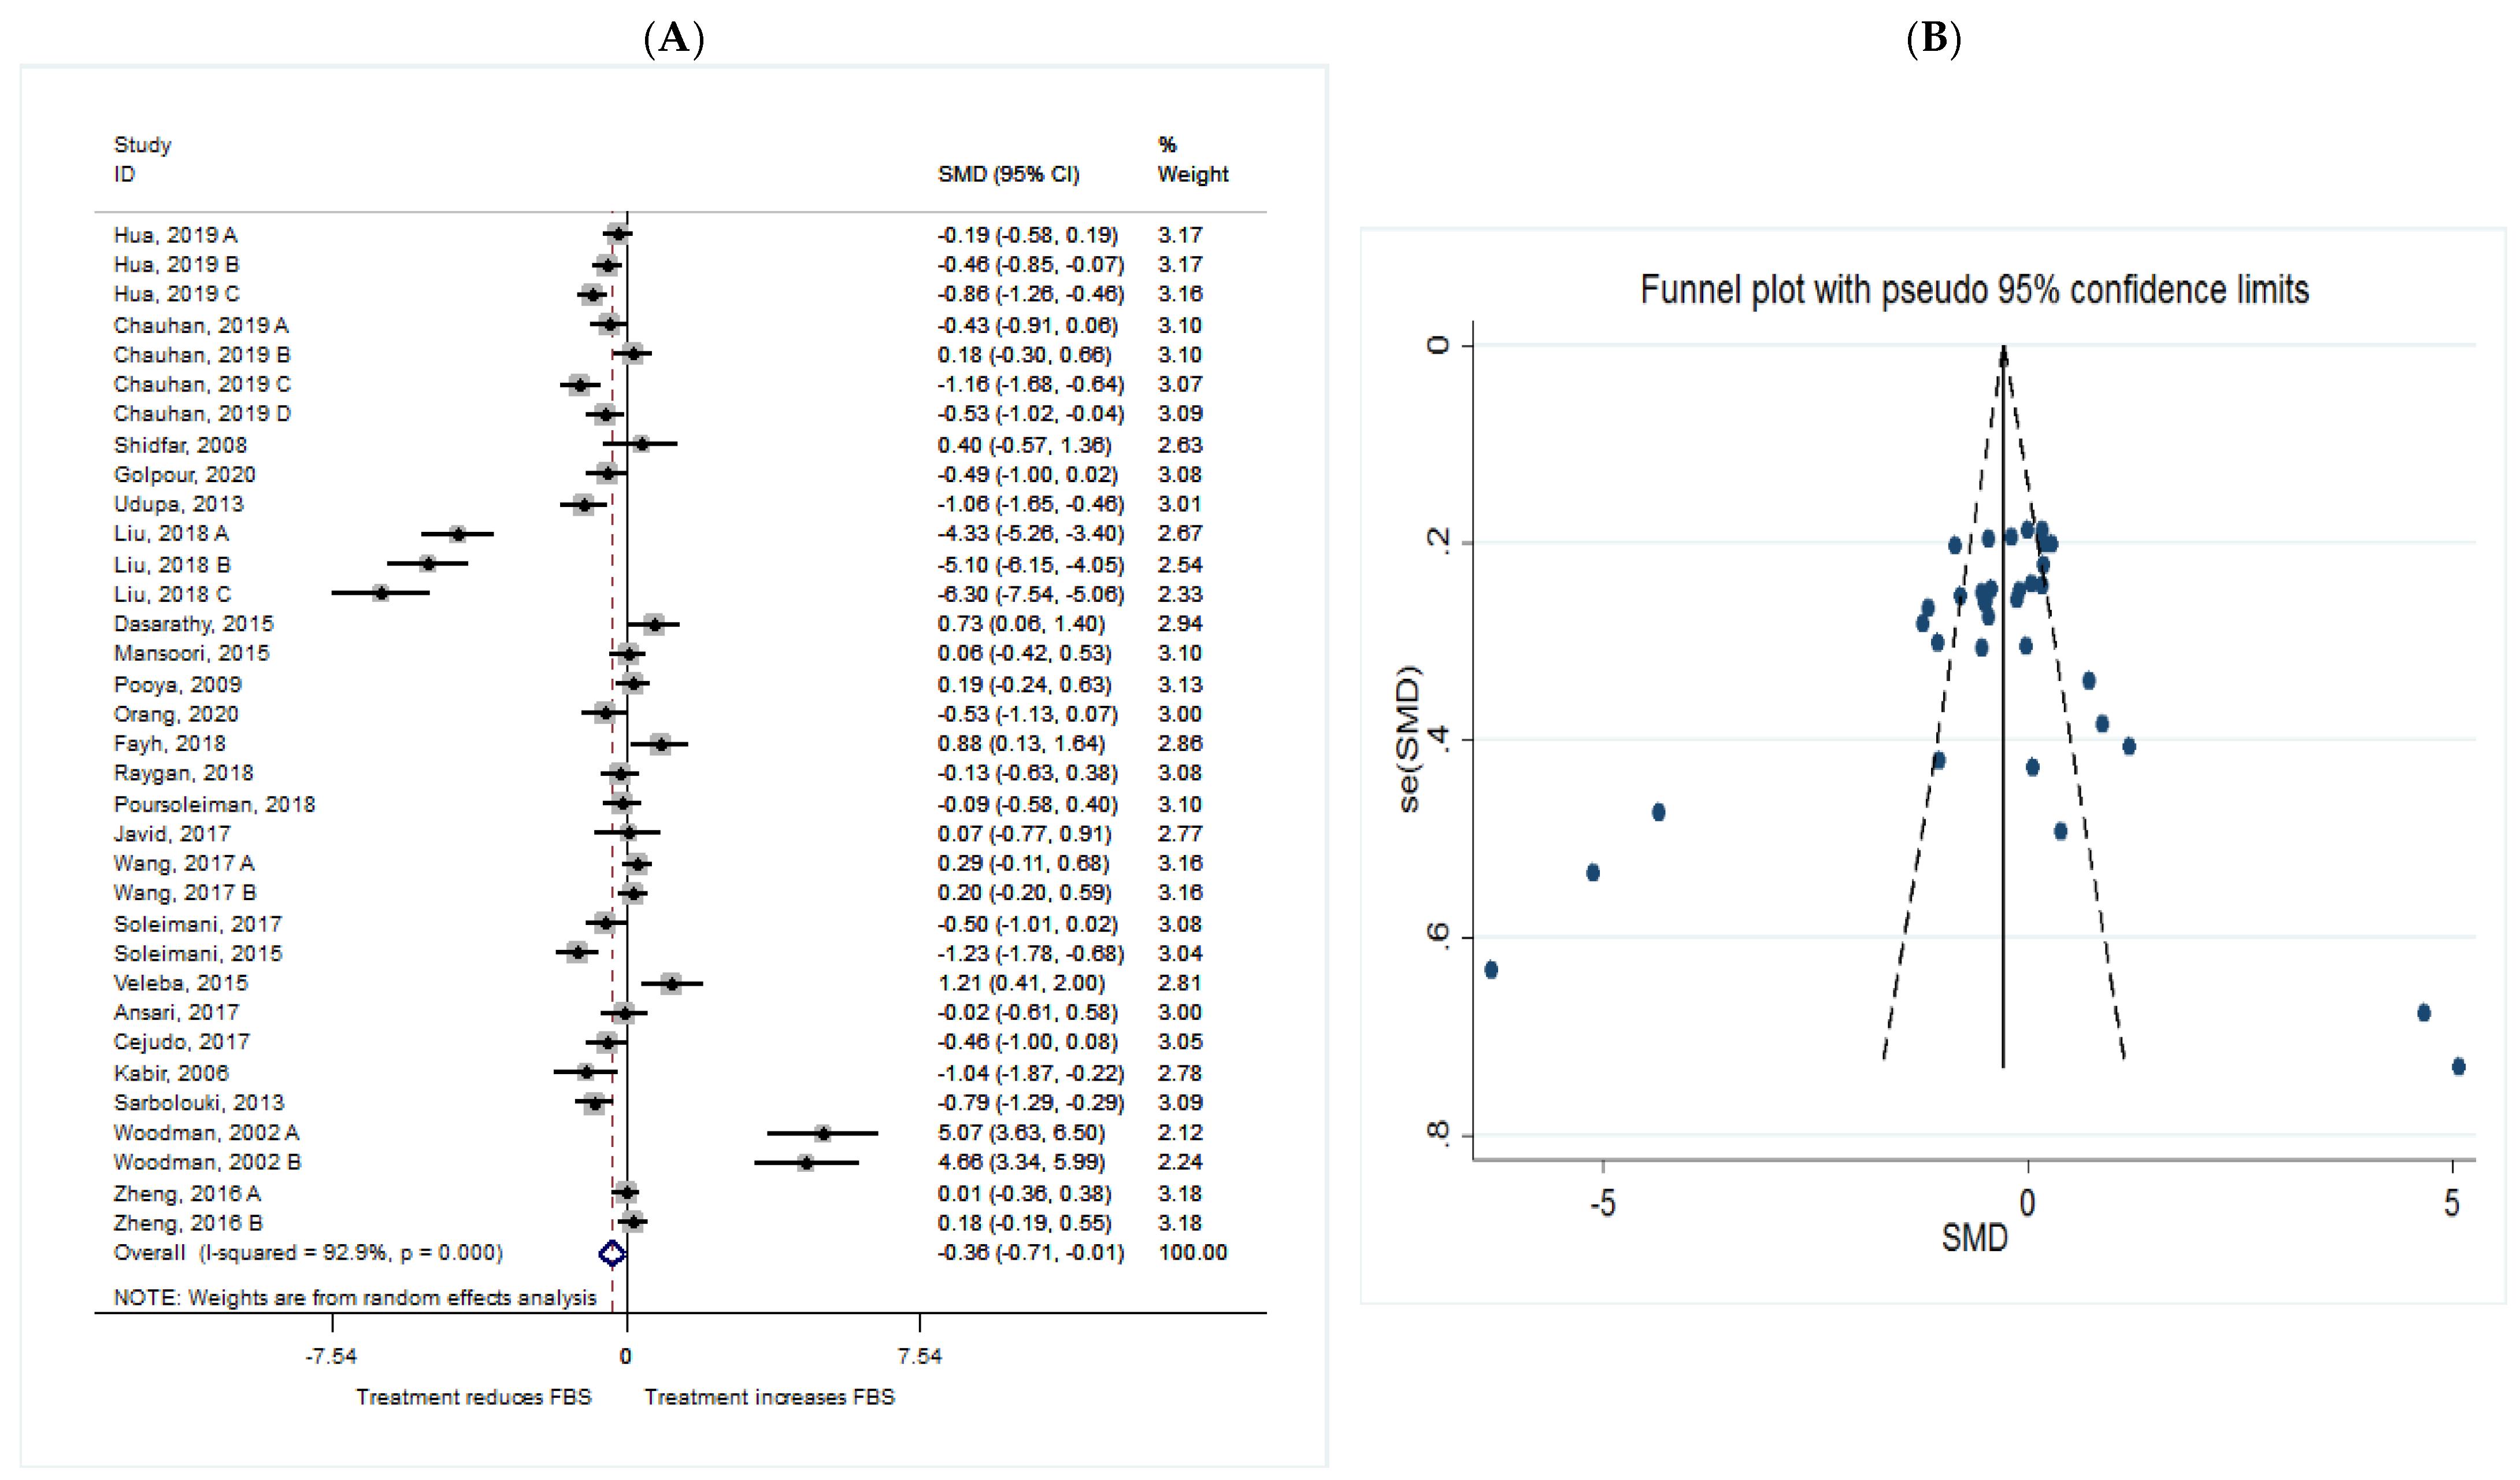
FBS
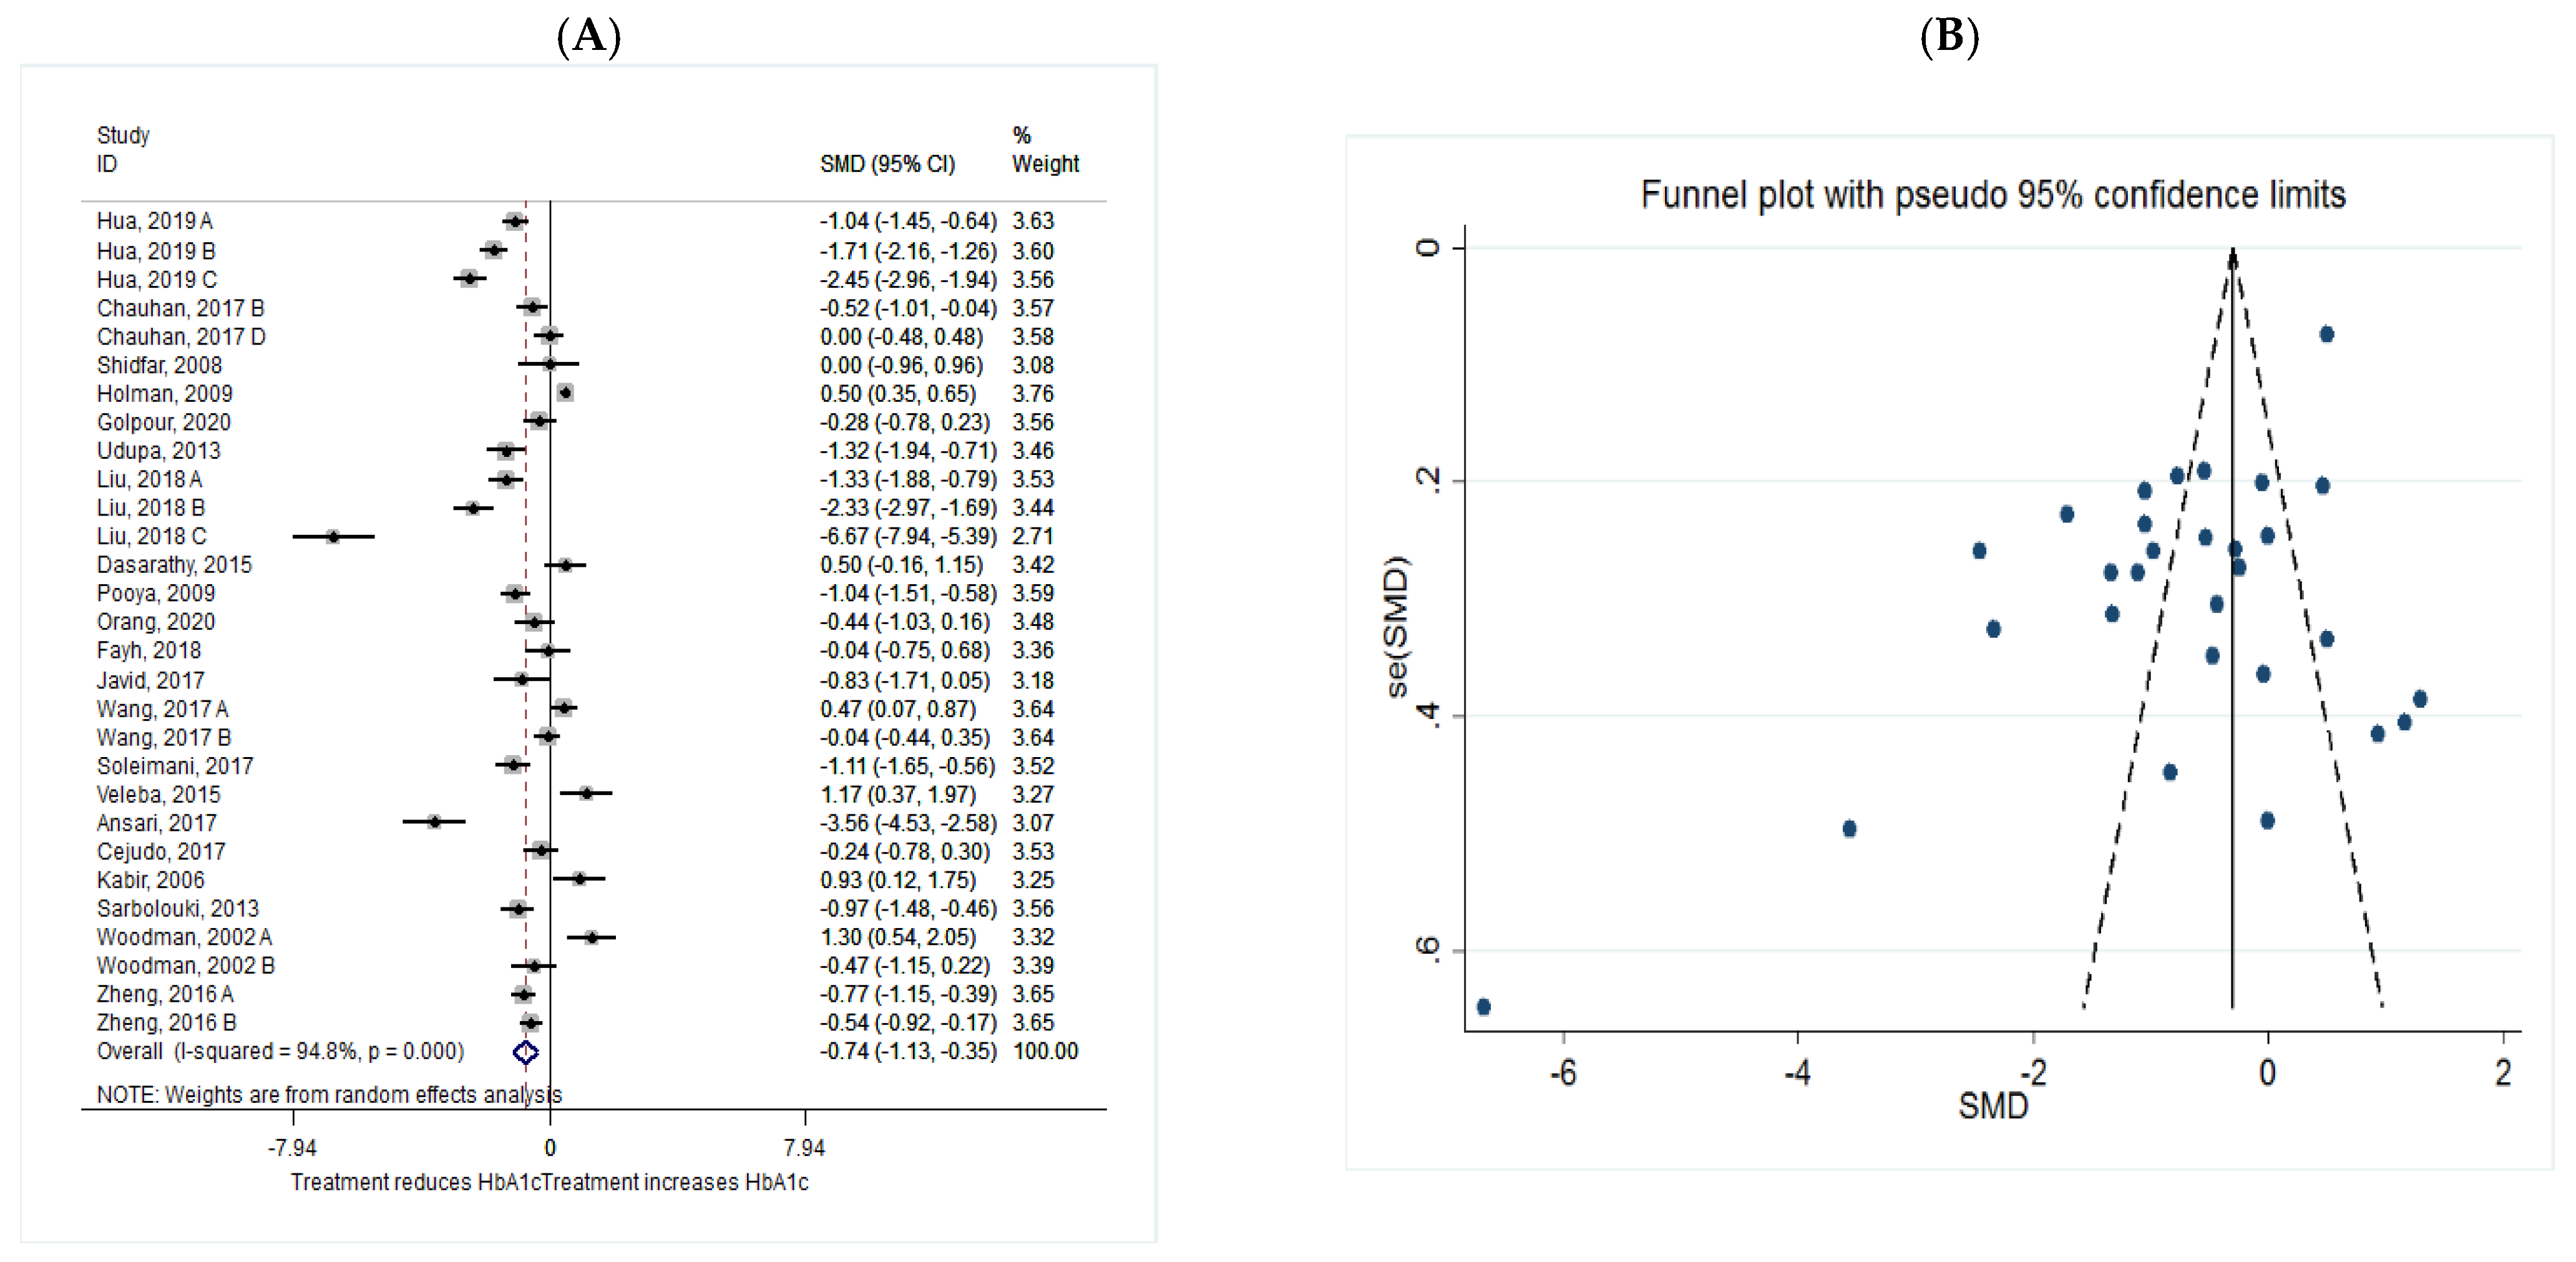
HbA1c
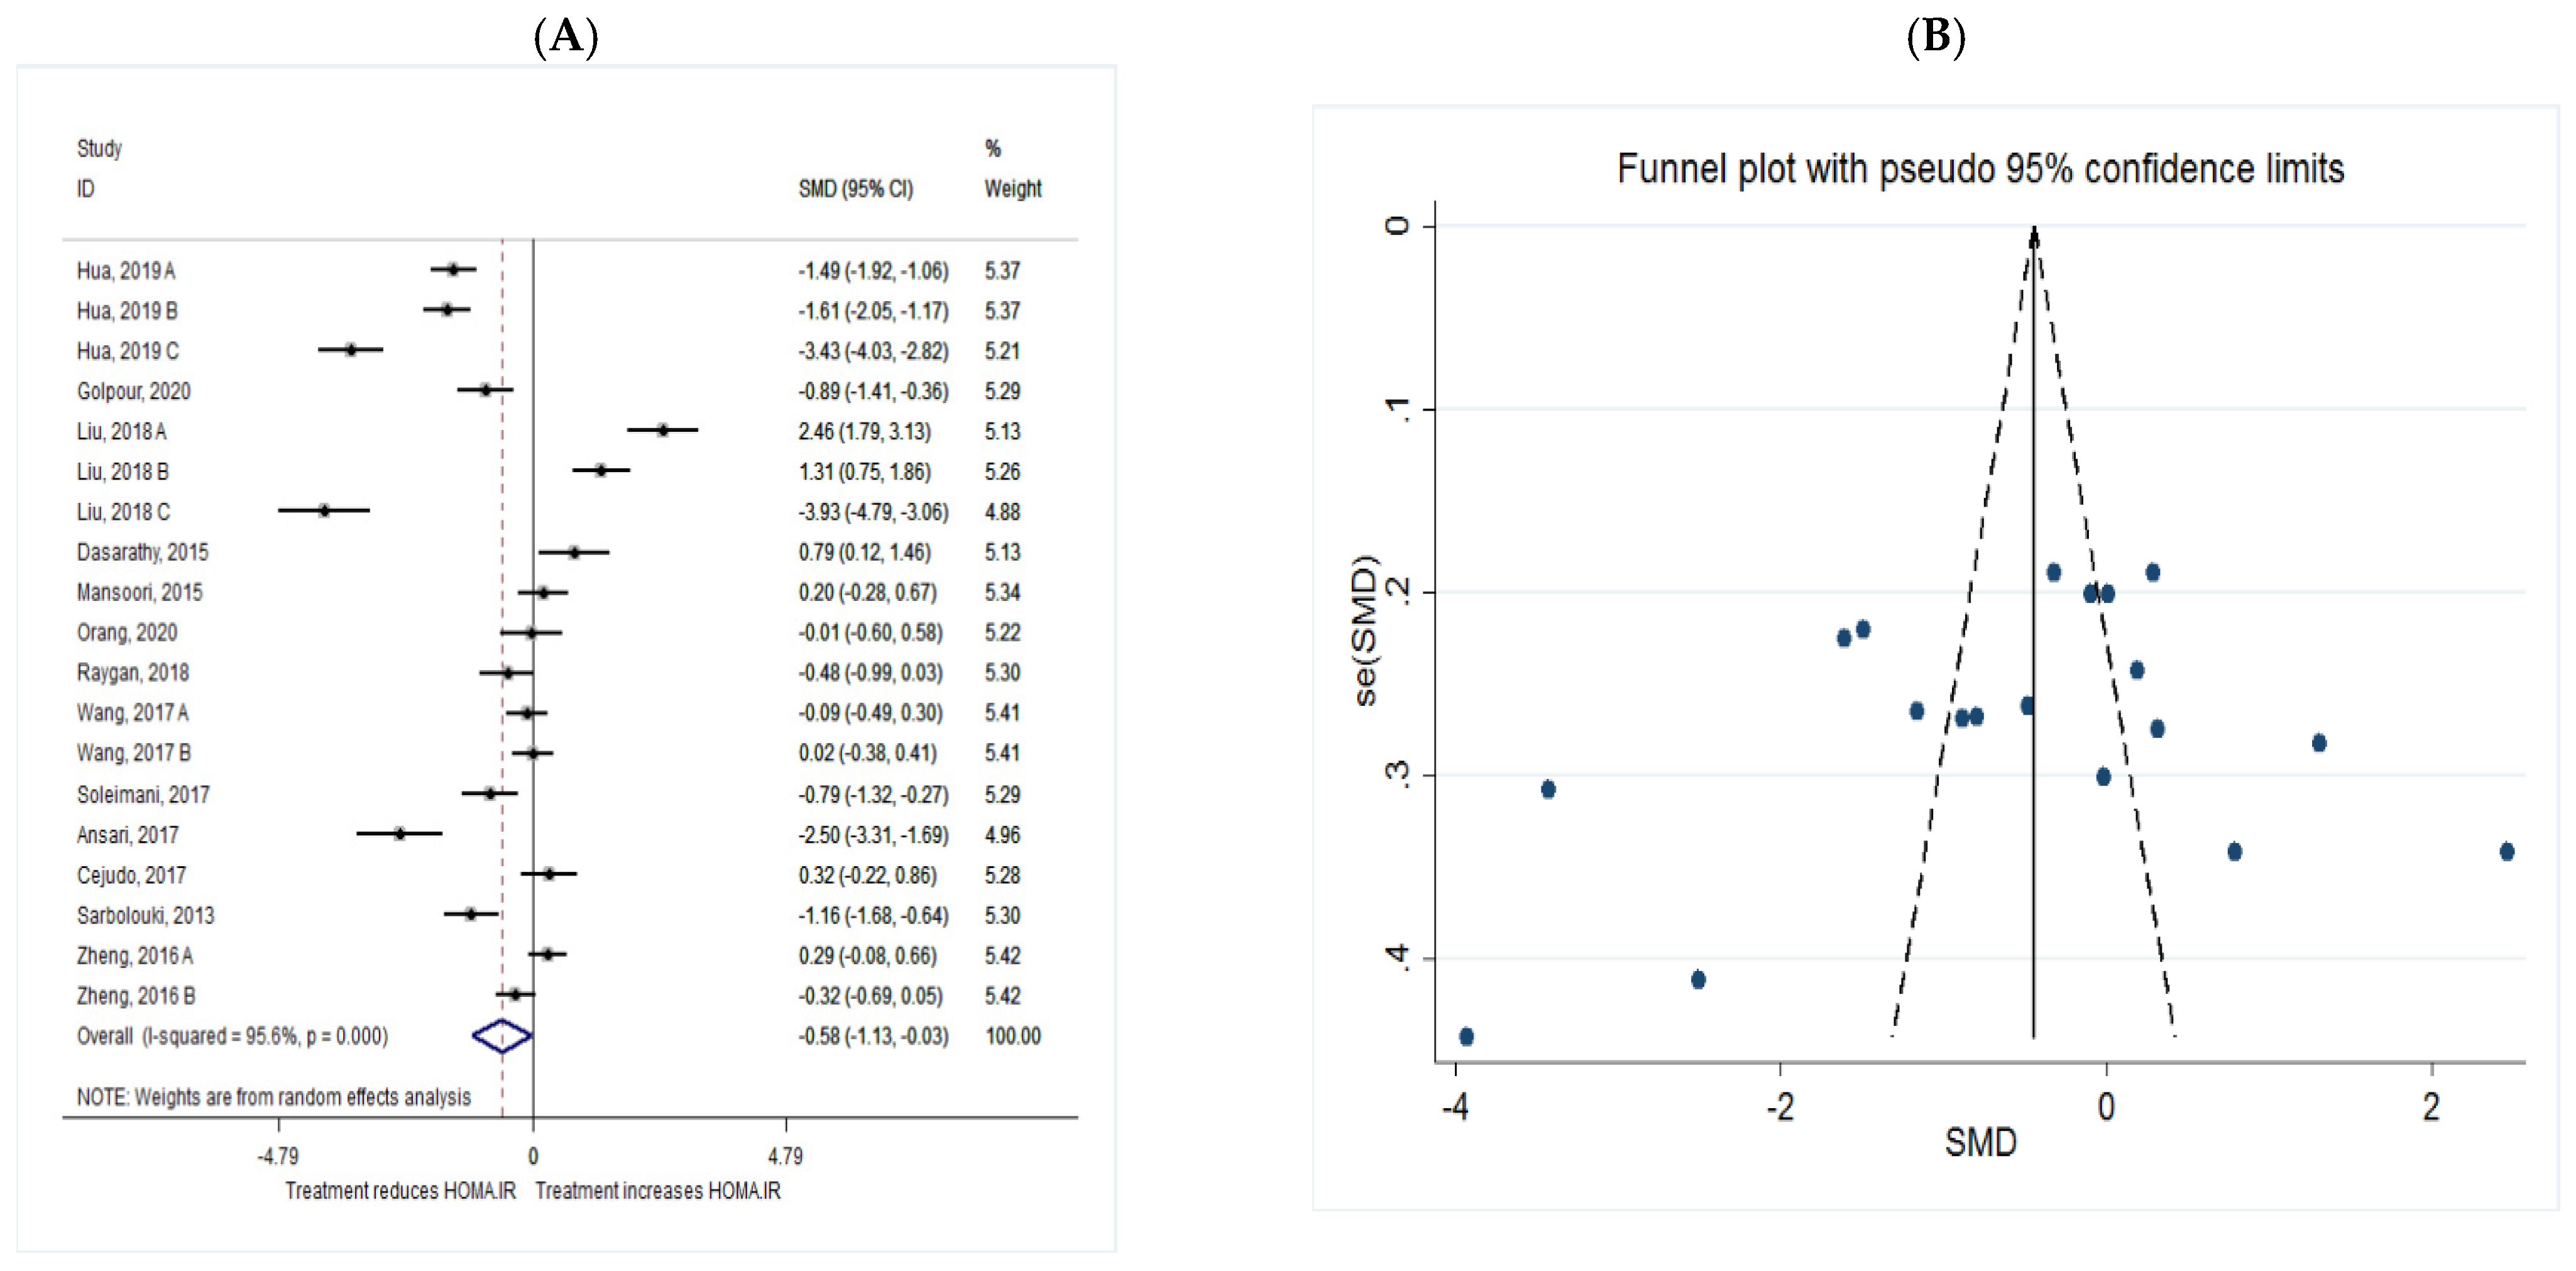
HOMA.IR
2.2.2. Lipid Profile
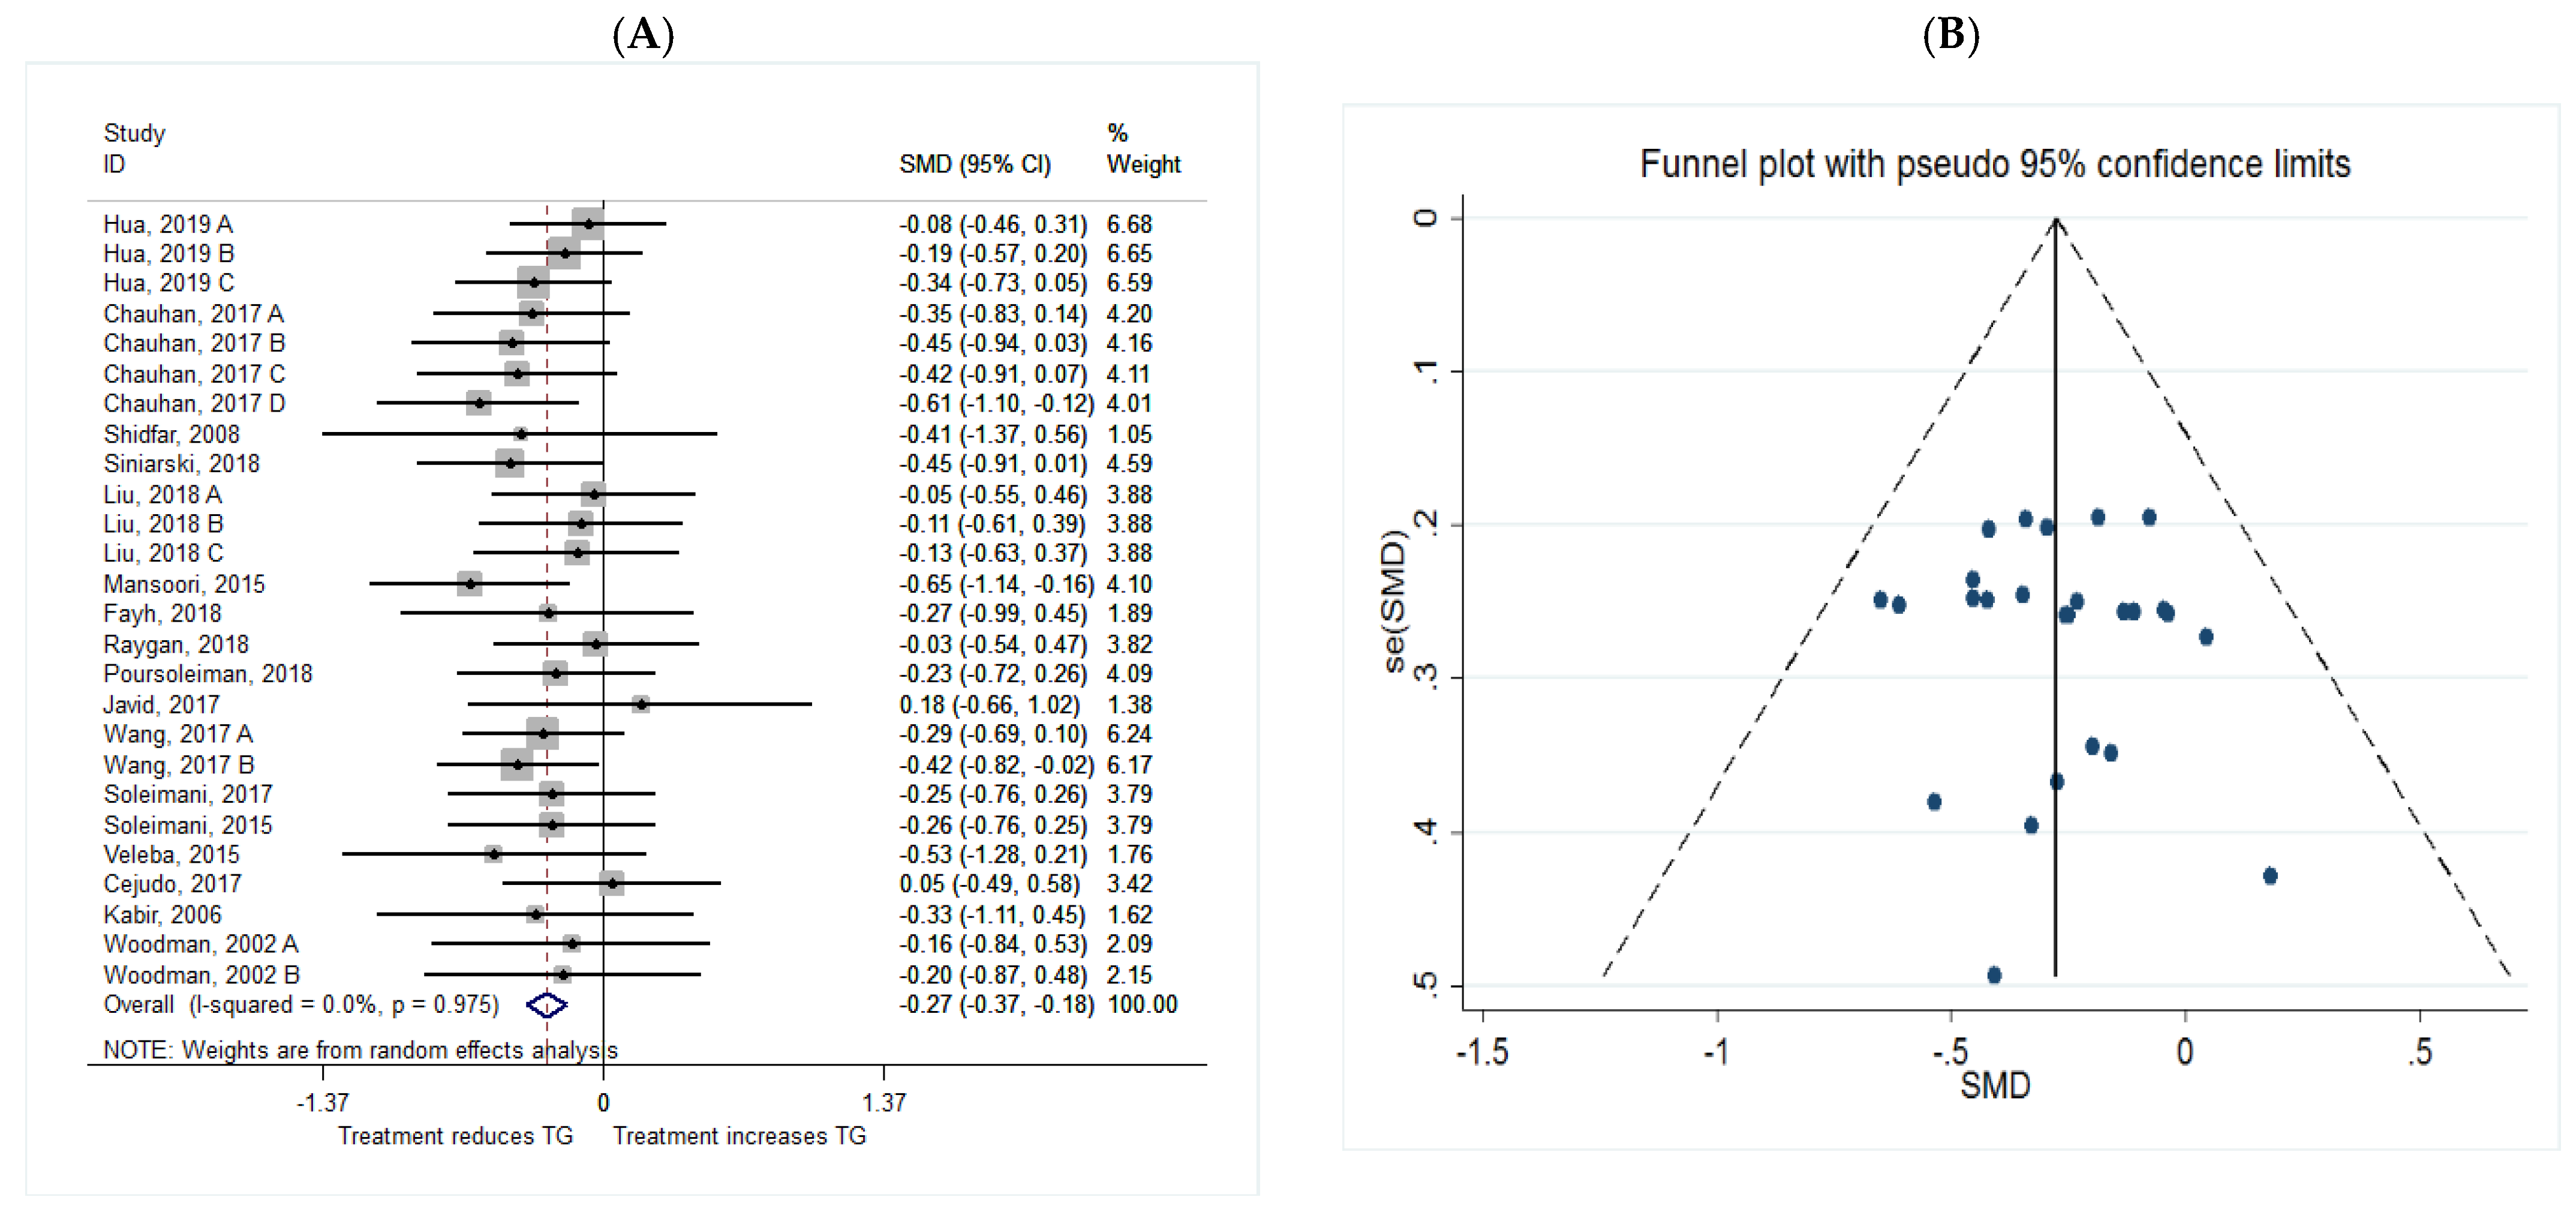
TG
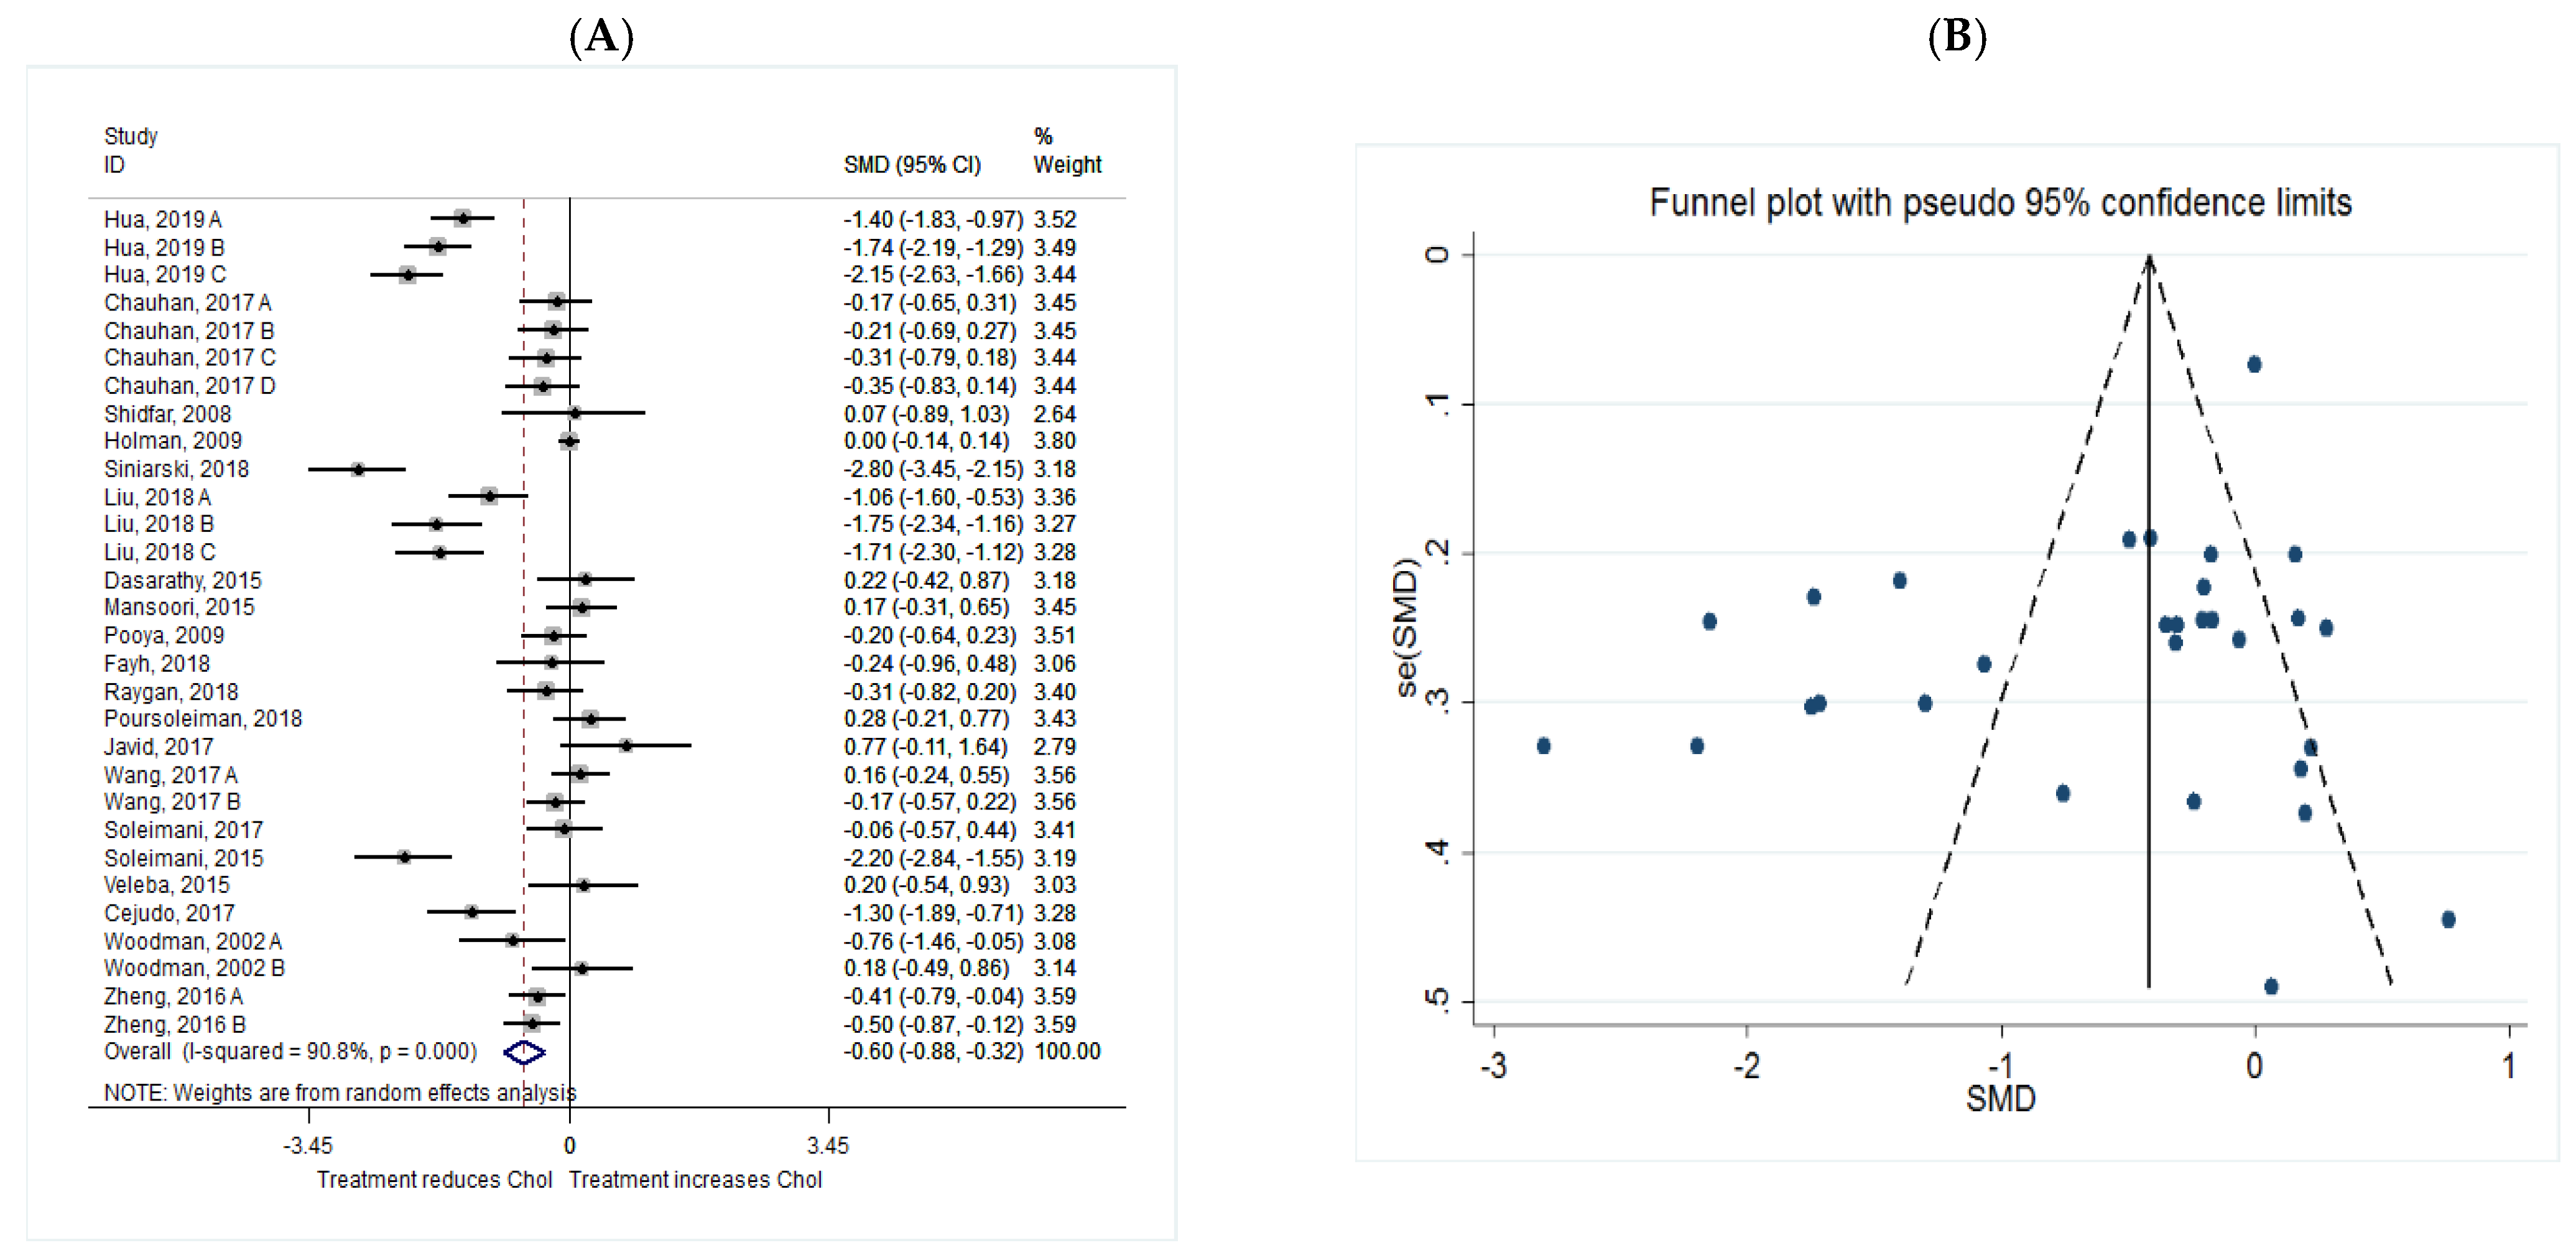
Cholesterol
LDL
HDL
2.2.3. Inflammatory Markers
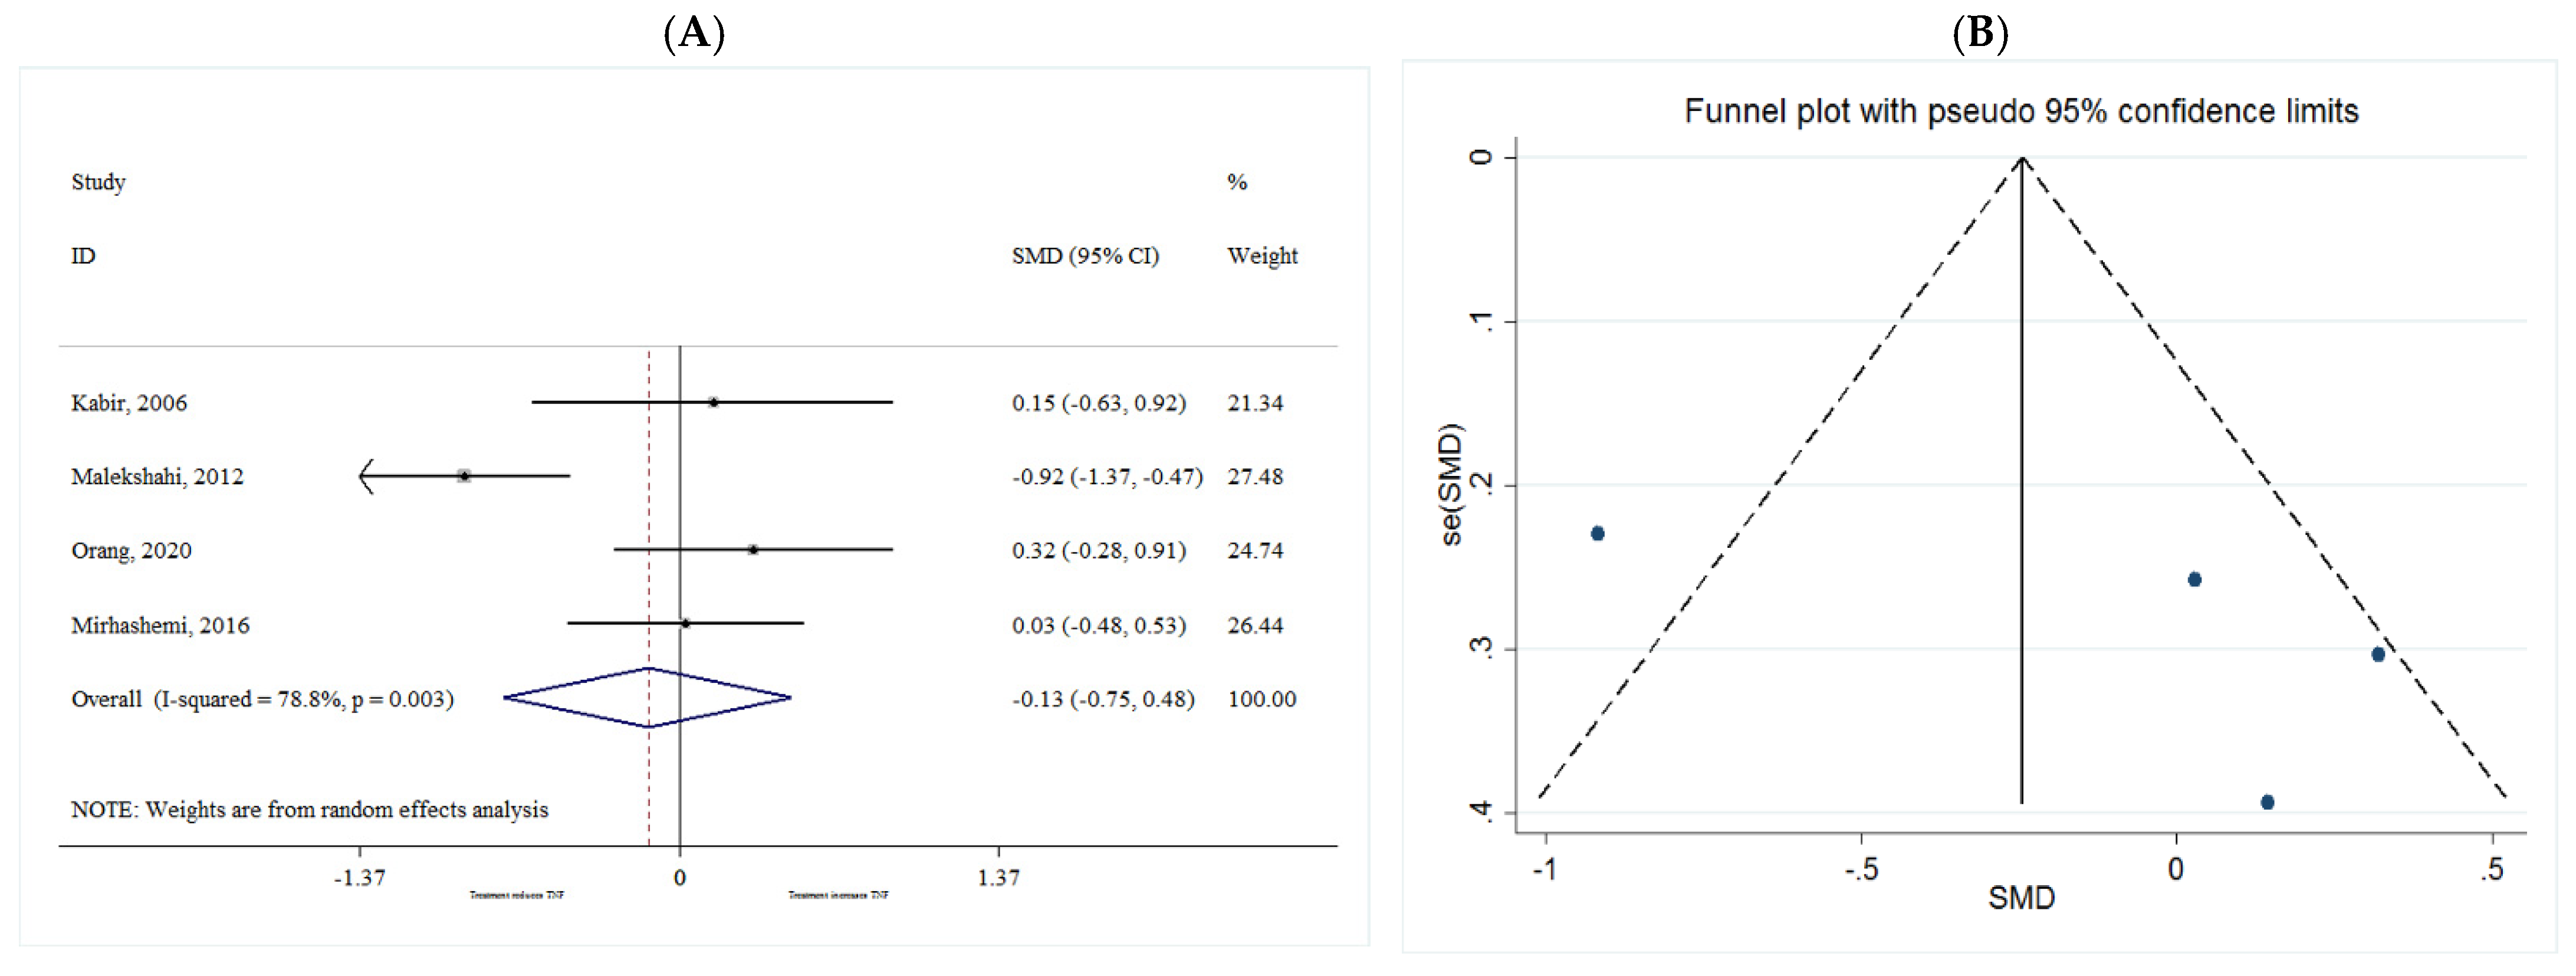
TNF-α
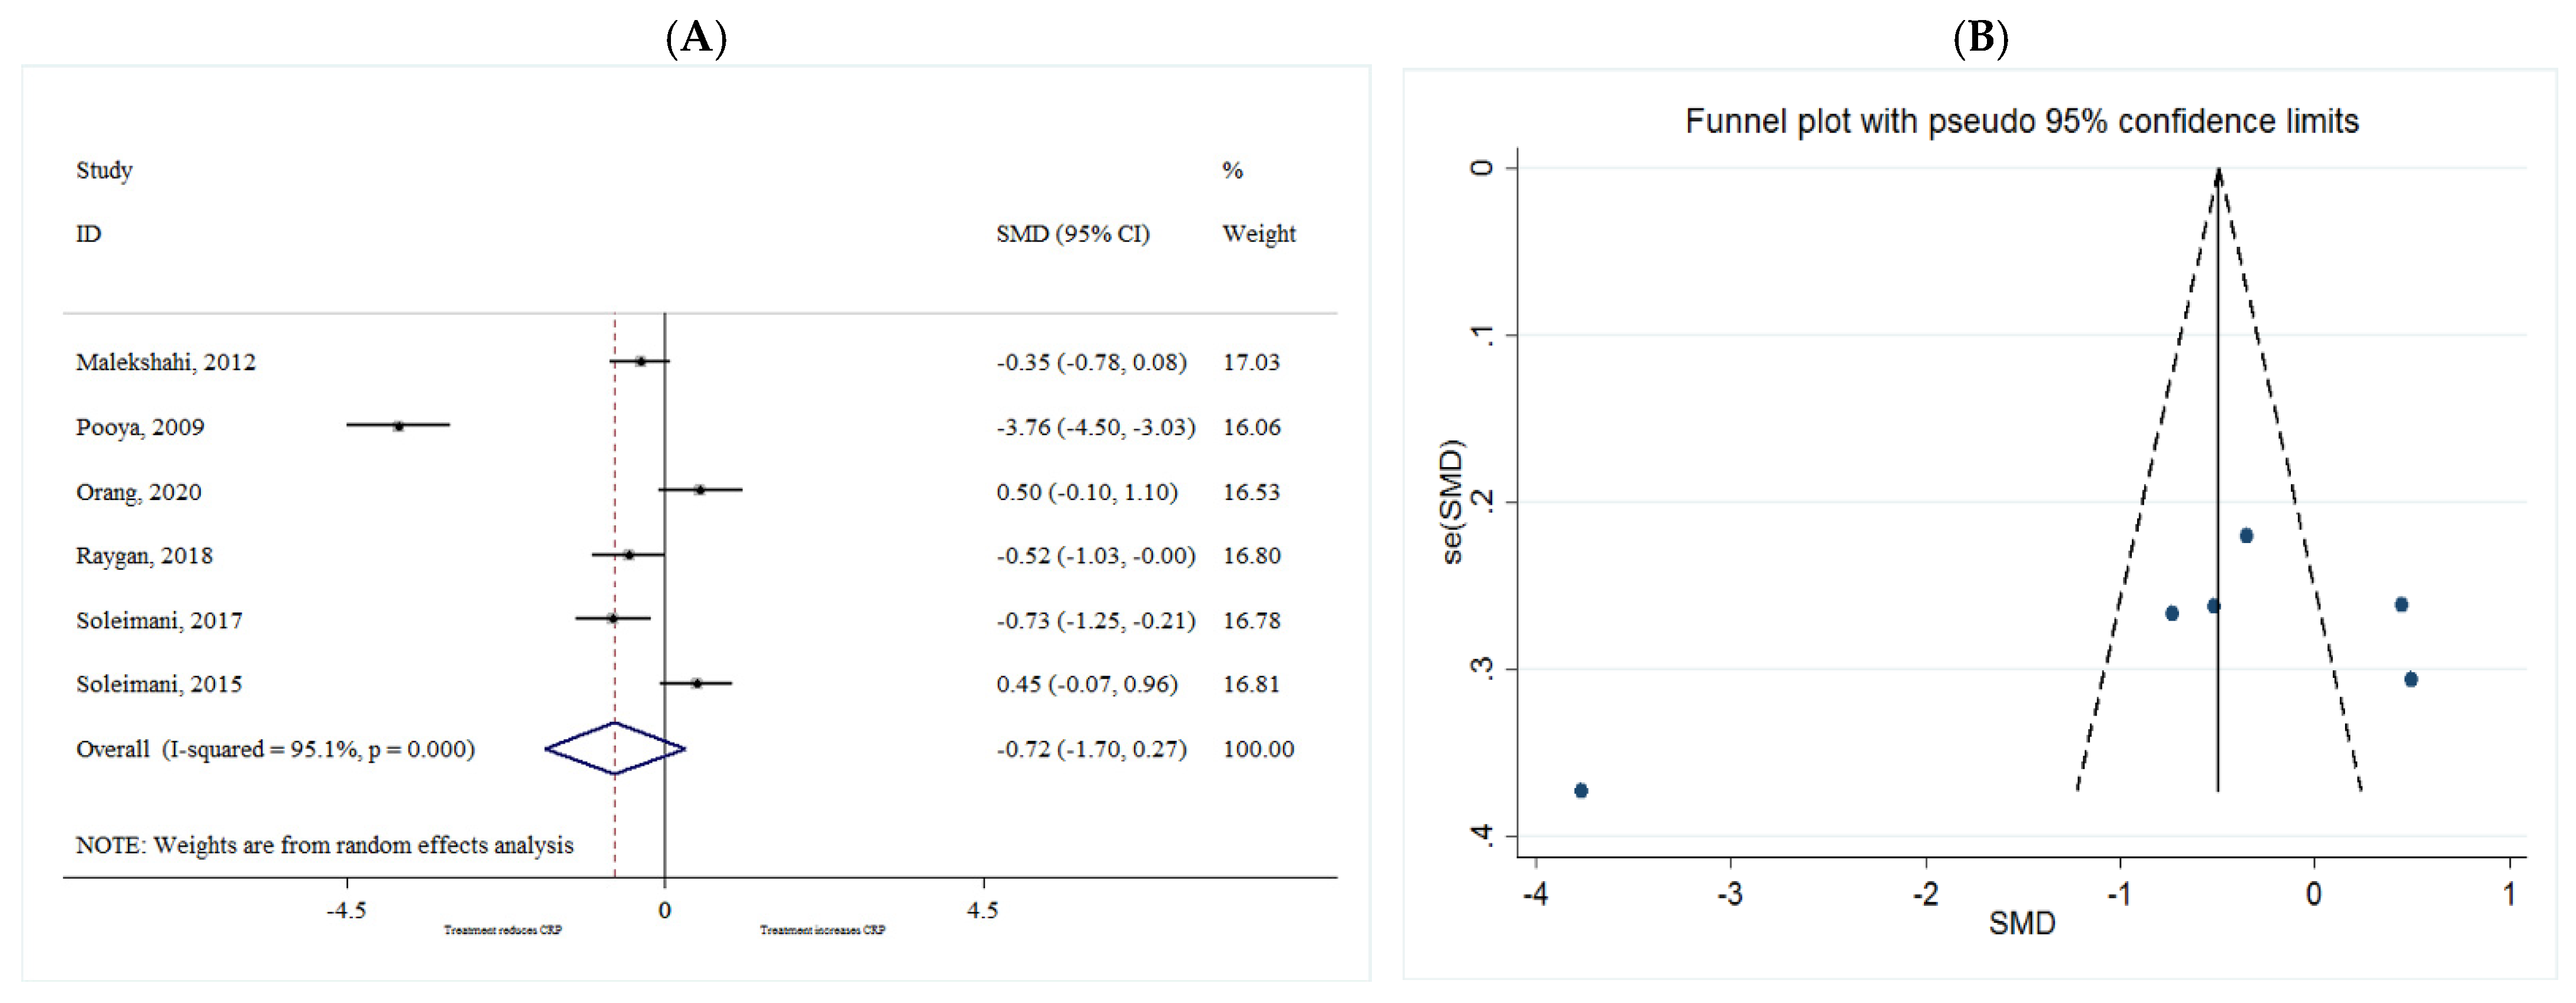
CRP
2.2.4. Anthropometric Parameters
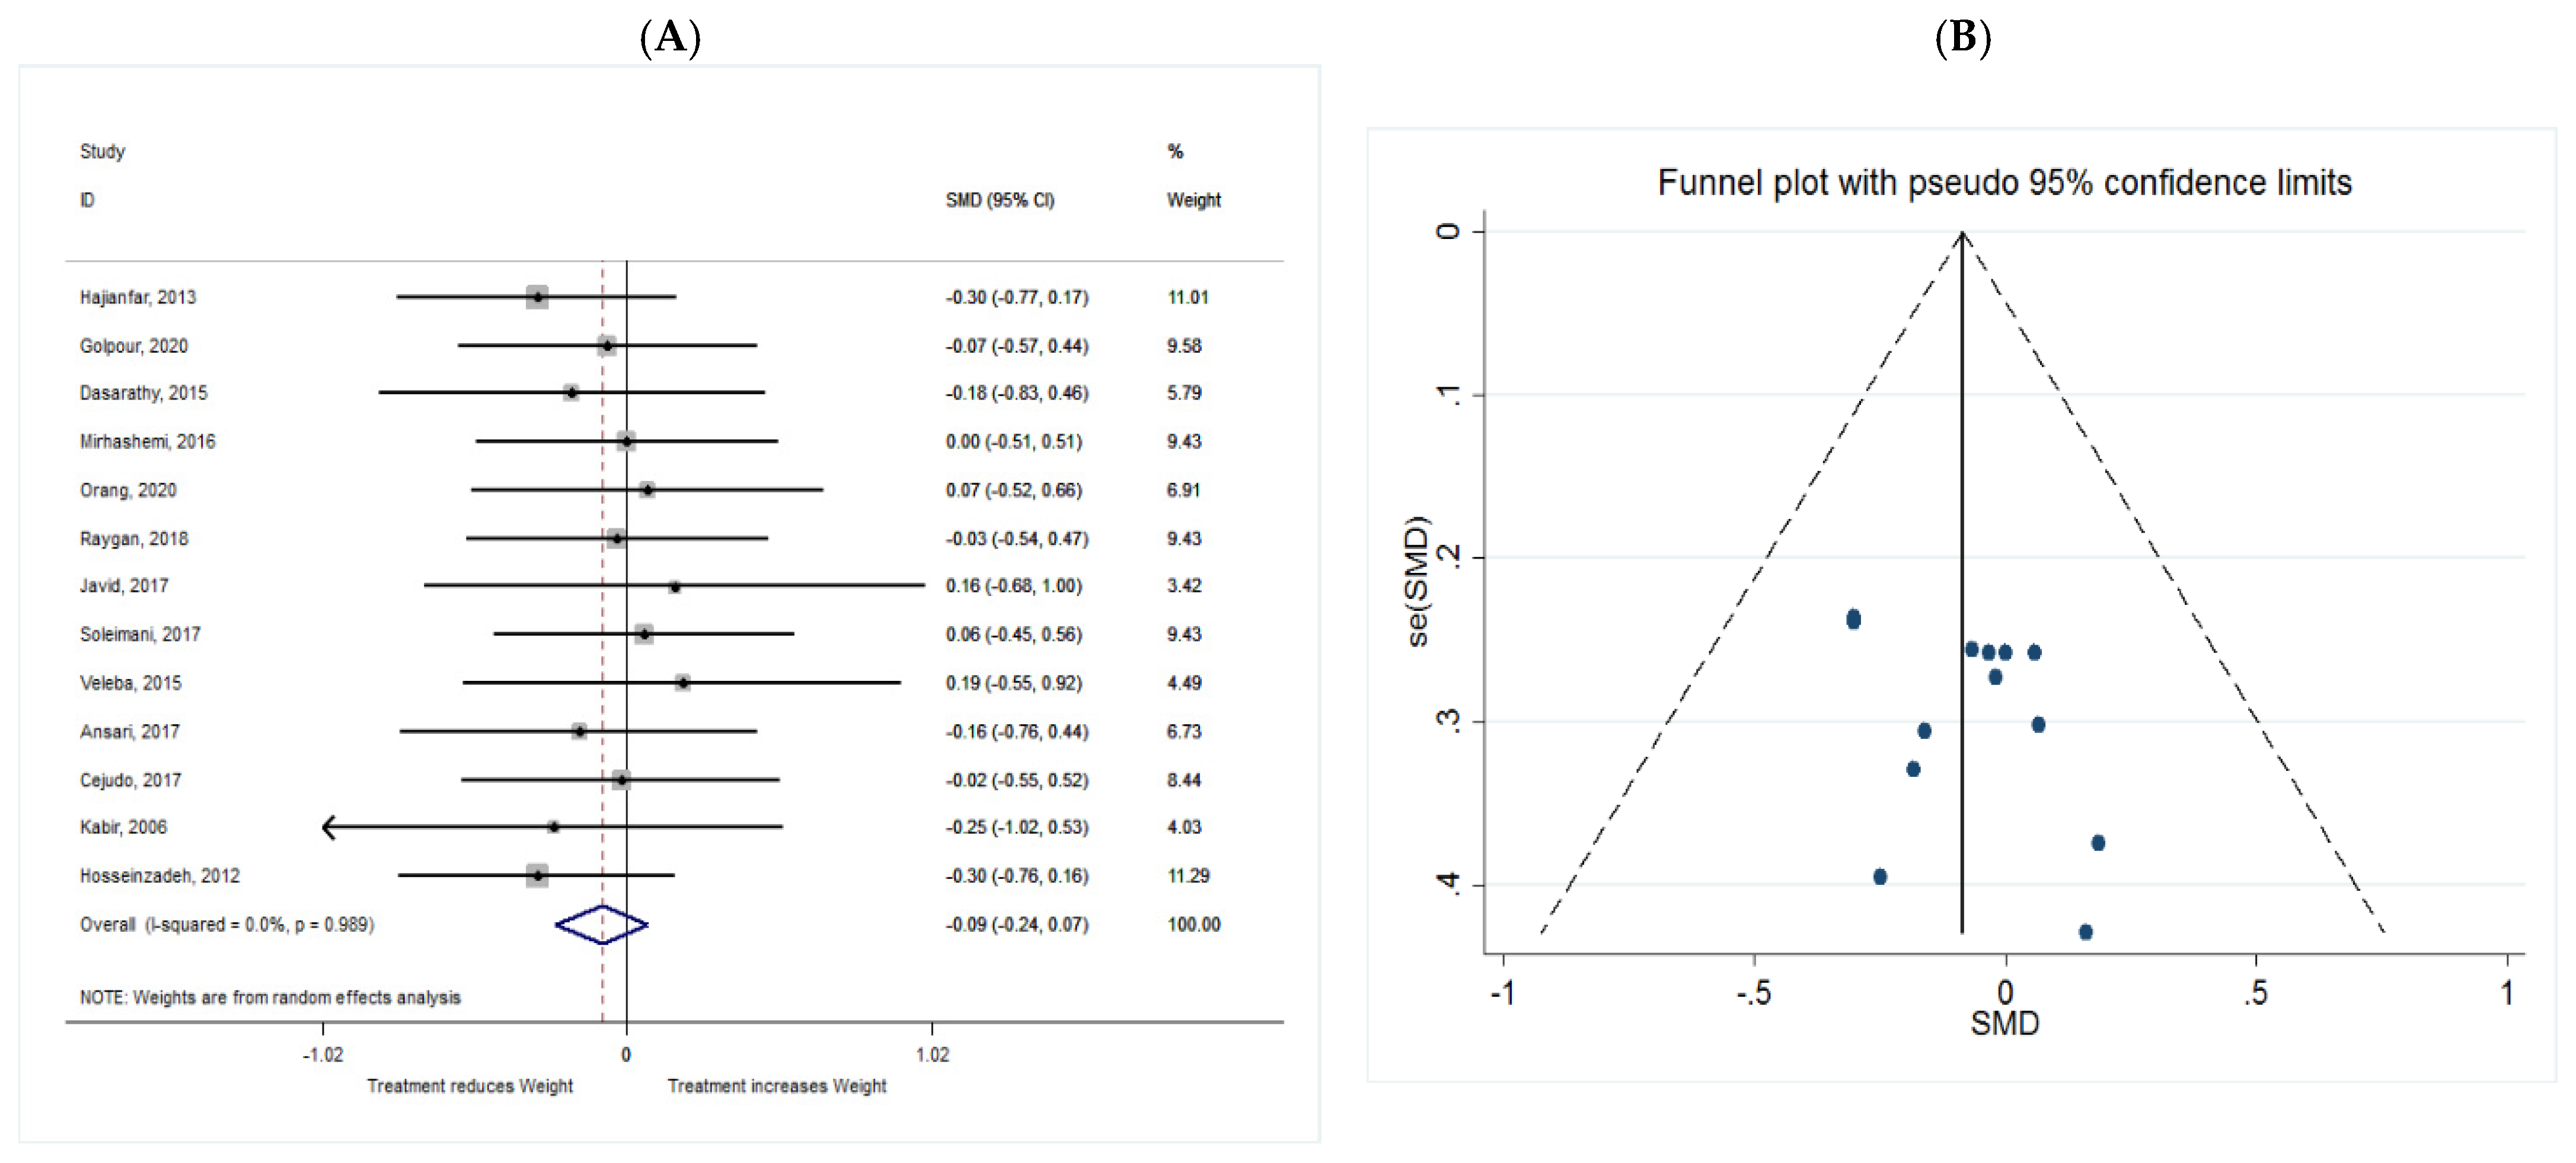
Weight
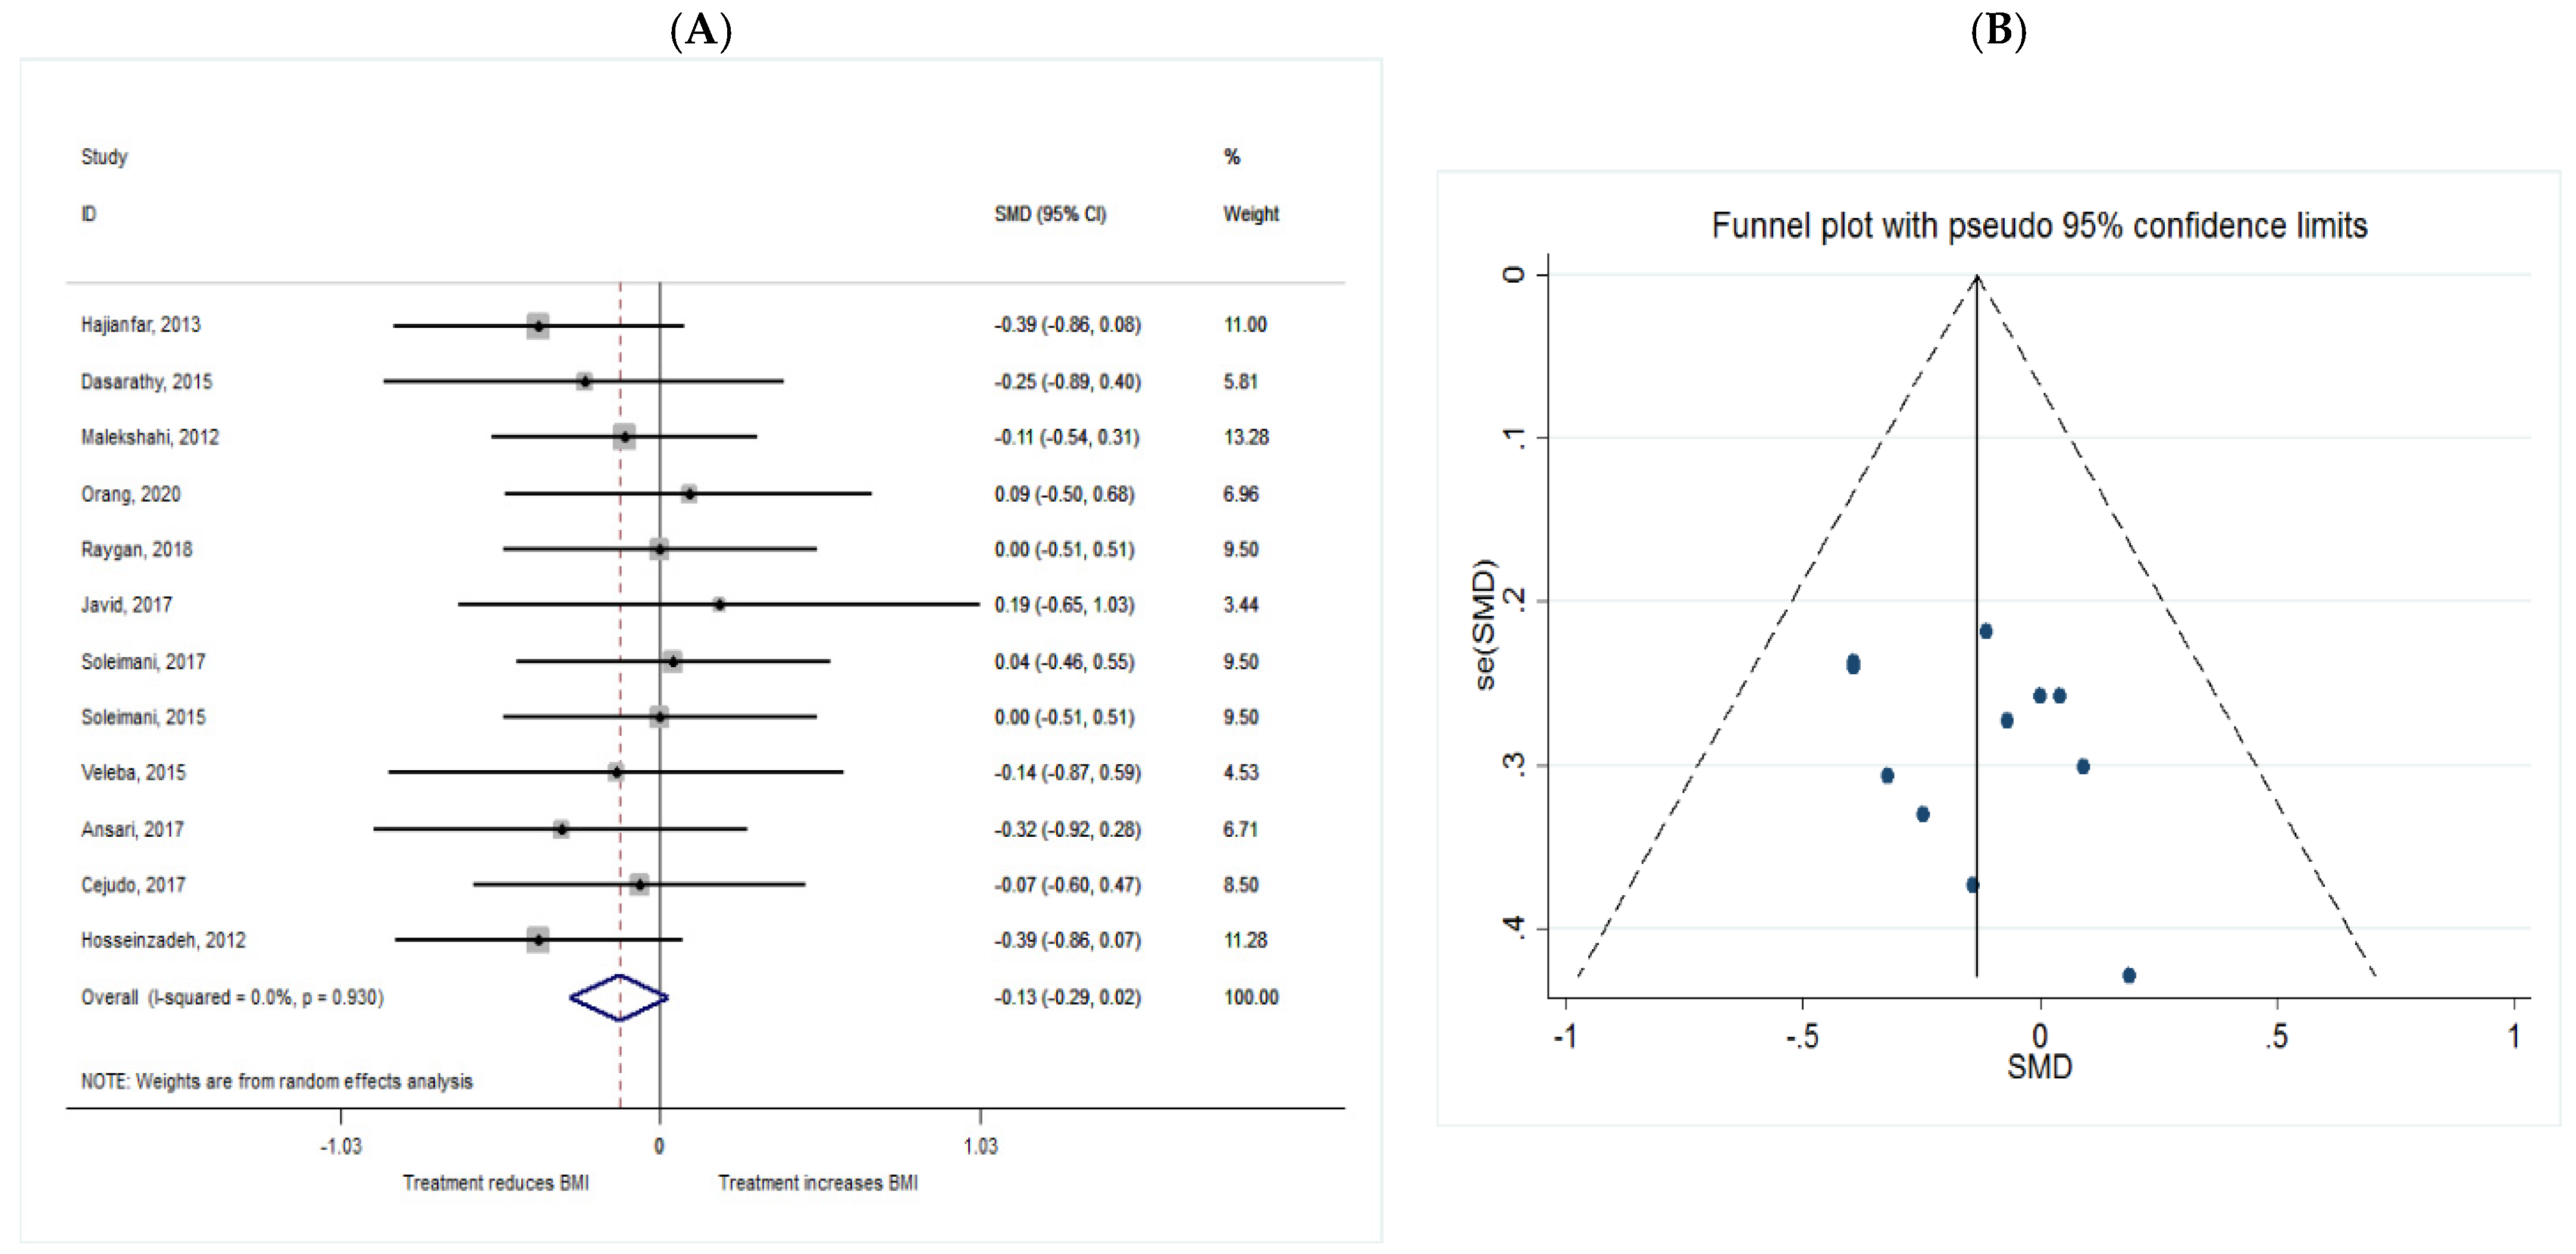
BMI
3. Discussion
4. Methods
4.1. Search Strategy
4.2. Study Selection and Inclusion and Exclusion Criteria
4.3. Data Extraction
4.4. Quality Assessment
4.5. Statistical Analysis
5. Conclusions
Author Contributions
Funding
Institutional Review Board Statement
Informed Consent Statement
Data Availability Statement
Conflicts of Interest
References
- Shaw, J.; Sicree, R.; Zimmet, P. Global estimates of the prevalence of diabetes for 2010 and 2030. Diabetes Res. Clin. Pr. 2010, 87, 4–14. [Google Scholar] [CrossRef] [PubMed]
- Gubitosi-Klug, R.A. The Diabetes Control and Complications Trial/Epidemiology of Diabetes Interventions and Complications Study at 30 Years: Summary and Future Directions. Diabetes Care 2014, 37, 44–49. [Google Scholar] [CrossRef] [Green Version]
- Association, A.D. 4. Foundations of care: Education, nutrition, physical activity, smoking cessation, psychosocial care, and immunization. Diabetes Care 2015, 38 (Suppl. 1), S20–S30. [Google Scholar] [CrossRef] [PubMed] [Green Version]
- De Caterina, R.; Bertolotto, A.; Madonna, R.; Schmidt, E.B. n-3 fatty acids in the treatment of diabetic patients: Biological rationale and clinical data. Diabetes Care 2007, 30, 1012–1026. [Google Scholar] [CrossRef] [PubMed] [Green Version]
- Bang, H.O.; Dyerberg, J.; Sinclair, H.M. The composition of the Eskimo food in north western Greenland. Am. J. Clin. Nutr. 1980, 33, 2657–2661. [Google Scholar] [CrossRef] [Green Version]
- Crochemore, I.C.C.; Souza, A.F.; de Souza, A.C.; Rosado, E.L. ω-3 Polyunsaturated Fatty Acid Supplementation Does Not Influence Body Composition, Insulin Resistance, and Lipemia in Women with Type 2 Diabetes and Obesity. Nutr. Clin. Pract. 2012, 27, 553–560. [Google Scholar] [CrossRef] [PubMed]
- Samimi, M.; Jamilian, M.; Asemi, Z.; Esmaillzadeh, A. Effects of omega-3 fatty acid supplementation on insulin metabolism and lipid profiles in gestational diabetes: Randomized, double-blind, placebo-controlled trial. Clin. Nutr. 2015, 34, 388–393. [Google Scholar] [CrossRef] [PubMed]
- Jo, S.; An, W.-S.; Park, Y. Erythrocyte n-3 Polyunsaturated Fatty Acids and the Risk of Type 2 Diabetes in Koreans: A Case-Control Study. Ann. Nutr. Metab. 2013, 63, 283–290. [Google Scholar] [CrossRef]
- Steffen, B.T.; Steffen, L.M.; Zhou, X.; Ouyang, P.; Weir, N.L.; Tsai, M.Y. n-3 Fatty Acids Attenuate the Risk of Diabetes Associated with Elevated Serum Nonesterified Fatty Acids: The Multi-Ethnic Study of Atherosclerosis. Diabetes Care 2015, 38, 575–580. [Google Scholar] [CrossRef] [Green Version]
- Browning, L.M.; Krebs, J.D.; Moore, C.S.; Mishra, G.D.; O’Connell, M.; Jebb, S.A. The impact of long chain n-3 polyunsaturated fatty acid supplementation on inflammation, insulin sensitivity and CVD risk in a group of overweight women with an inflammatory phenotype. Diabetes Obes. Metab. 2007, 9, 70–80. [Google Scholar] [CrossRef]
- Giacco, R.; Cuomo, V.; Vessby, B.; Uusitupa, M.; Hermansen, K.; Meyer, B.J.; Riccardi, G.; Rivellese, A.A.; KANWU Study Group. Fish oil, insulin sensitivity, insulin secretion and glucose tolerance in healthy people: Is there any effect of fish oil supplementation in relation to the type of background diet and habitual dietary intake of n-6 and n-3 fatty acids? Nutr. Metab. Cardiovasc. Dis. 2007, 17, 572–580. [Google Scholar] [CrossRef] [PubMed]
- Jamilian, M.; Samimi, M.; Kolahdooz, F.; Khalaji, F.; Razavi, M.; Asemi, Z. Omega-3 fatty acid supplementation affects pregnancy outcomes in gestational diabetes: A randomized, double-blind, placebo-controlled trial. J. Matern. Neonatal Med. 2016, 29, 669–675. [Google Scholar] [CrossRef]
- Pappalardo, G.; Almeida, A.; Ravasco, P. Eicosapentaenoic acid in cancer improves body composition and modulates metabolism. Nutrition 2015, 31, 549–555. [Google Scholar] [CrossRef]
- Hajianfar, H.; Paknahad, Z.; Bahonar, A. The Effect of Omega-3 Supplements on Antioxidant Capacity in Patients with Type 2 Diabetes. Int. J. Prev. Med. 2013, 4 (Suppl. 2), S234–S238. [Google Scholar] [PubMed]
- Golpour, P.; Nourbakhsh, M.; Mazaherioun, M.; Janani, L.; Nourbakhsh, M.; Yaghmaei, P. Improvement of NRF2 gene expression and antioxidant status in patients with type 2 diabetes mellitus after supplementation with omega-3 polyunsaturated fatty acids: A double-blind randomised placebo-controlled clinical trial. Diabetes Res. Clin. Pr. 2020, 162, 108120. [Google Scholar] [CrossRef]
- Dasarathy, S.; Dasarathy, J.; Khiyami, A.; Yerian, L.; Hawkins, C.; Sargent, R.; McCullough, A.J. Double-blind Randomized Placebo-controlled Clinical Trial of Omega 3 Fatty Acids for the Treatment of Diabetic Patients with Nonalcoholic Steatohepatitis. J. Clin. Gastroenterol. 2015, 49, 137–144. [Google Scholar] [CrossRef] [Green Version]
- Mirhashemi, S.M.; Rahimi, F.; Soleimani, A.; Asemi, Z. Effects of Omega-3 Fatty Acid Supplementation on Inflammatory Cytokines and Advanced Glycation End Products in Patients with Diabetic Nephropathy: A Randomized Controlled Trial. Iran. J. Kidney Dis. 2016, 10, 197–204. [Google Scholar] [PubMed]
- Orang, Z.; Mohsenpour, M.A.; Mozaffari-Khosravi, H. Effect of Omega-3 fatty acid supplementation on inflammatory markers and insulin resistance indices in patient with type 2 diabetes and nonalcoholic fatty liver: A randomized double-blind clinical trial. Obes. Med. 2020, 19, 100278. [Google Scholar] [CrossRef]
- Raygan, F.; Taghizadeh, M.; Mirhosseini, N.; Akbari, E.; Bahmani, F.; Memarzadeh, M.R.; Sharifi, N.; Jafarnejad, S.; Banikazemi, Z.; Asemi, Z. A comparison between the effects of flaxseed oil and fish oil supplementation on cardiovascular health in type 2 diabetic patients with coronary heart disease: A randomized, double-blinded, placebo-controlled trial. Phytother. Res. 2019, 33, 1943–1951. [Google Scholar] [CrossRef] [PubMed]
- Zare Javid, A.; Maghsoumi-Norouzabad, L.; Ashrafzadeh, E.; Yousefimanesh, H.A.; Zakerkish, M.; Ahmadi Angali, K.; Ravanbakhsh, M.; Babaei, H. Impact of cranberry juice enriched with omega-3 fatty acids adjunct with nonsurgical periodontal treatment on metabolic control and periodontal status in type 2 patients with diabetes with periodontal disease. J. Am. Coll. Nutr. 2018, 37, 71–79. [Google Scholar] [CrossRef]
- Soleimani, Z.; Hashemdokht, F.; Bahmani, F.; Taghizadeh, M.; Memarzadeh, M.R.; Asemi, Z. Clinical and metabolic response to flaxseed oil omega-3 fatty acids supplementation in patients with diabetic foot ulcer: A randomized, double-blind, placebo-controlled trial. J. Diabetes Its Complicat. 2017, 31, 1394–1400. [Google Scholar] [CrossRef]
- Zheng, J.; Lin, M.; Fang, L.; Yu, Y.; Yuan, L.; Jin, Y.; Feng, J.; Wang, L.; Yang, H.; Chen, W.; et al. Effects of n-3 fatty acid supplements on glycemic traits in Chinese type 2 diabetic patients: A double-blind randomized controlled trial. Mol. Nutr. Food Res. 2016, 60, 2176–2184. [Google Scholar] [CrossRef] [PubMed]
- Veleba, J.; Kopecky, J.; Janovska, P.; Kuda, O.; Horakova, O.; Malinska, H.; Kazdova, L.; Oliyarnyk, O.; Skop, V.; Trnovska, J.; et al. Combined intervention with pioglitazone and n-3 fatty acids in metformin-treated type 2 diabetic patients: Improvement of lipid metabolism. Nutr. Metab. 2015, 12, 52. [Google Scholar] [CrossRef] [PubMed]
- Ansari, S.; Djalali, M.; Honarvar, N.M.; Mazaherioun, M.; Zarei, M.; Agh, F.; Gholampour, Z.; Javanbakht, M.H. The Effect of n-3 Polyunsaturated Fatty Acids Supplementation on Serum Irisin in Patients with Type 2 Diabetes: A Randomized, Double-Blind, Placebo-Controlled Trial. Int. J. Endocrinol. Metab. 2017, 15, e40614. [Google Scholar] [CrossRef] [PubMed] [Green Version]
- Jacobo-Cejudo, M.G.; Valdés-Ramos, R.; Guadarrama-López, A.L.; Pardo-Morales, R.-V.; Martínez-Carrillo, B.E.; Harbige, L.S. Effect of n-3 Polyunsaturated Fatty Acid Supplementation on Metabolic and Inflammatory Biomarkers in Type 2 Diabetes Mellitus Patients. Nutrients 2017, 9, 573. [Google Scholar] [CrossRef] [PubMed] [Green Version]
- Kabir, M.; Skurnik, G.; Naour, N.; Pechtner, V.; Meugnier, E.; Rome, S.; Quignard-Boulangé, A.; Vidal, H.; Slama, G.; Clément, K. Treatment for 2 mo with n− 3 polyunsaturated fatty acids reduces adiposity and some atherogenic factors but does not improve insulin sensitivity in women with type 2 diabetes: A randomized controlled study. Am. J. Clin. Nutr. 2007, 86, 1670–1679. [Google Scholar] [CrossRef] [PubMed]
- Atar, M.J.H.; Hajianfar, H.; Bahonar, A. The effects of omega-3 on blood pressure and the relationship between serum visfatin level and blood pressure in patients with type II diabetes. ARYA Atheroscler. 2012, 8, 27–31. [Google Scholar]
- Moghadam, A.M.; Saedisomeolia, A.; Djalali, M.; Djazayery, A.; Pooya, S.; Sojoudi, F. Efficacy of omega-3 fatty acid supplementation on serum levels of tumour necrosis factor-alpha, C-reactive protein and interleukin-2 in type 2 diabetes mellitus patients. Singap. Med. J. 2012, 53, 615–619. [Google Scholar]
- Hua, L.; Lei, M.; Xue, S.; Li, X.; Li, S.; Xie, Q. Effect of fish oil supplementation combined with high-intensity interval training in newly diagnosed non-obese type 2 diabetes: A randomized controlled trial. J. Clin. Biochem. Nutr. 2019, 66, 146–151. [Google Scholar] [CrossRef]
- Chauhan, S.; Kodali, H.; Noor, J.; Ramteke, K.; Gawai, V. Role of Omega-3 Fatty Acids on Lipid Profile in Diabetic Dyslipidaemia: Single Blind, Randomised Clinical Trial. J. Clin. Diagn. Res. 2017, 11, OC13–OC16. [Google Scholar] [CrossRef]
- Shidfar, F.; Keshavarz, A.; Hosseyni, S.; Ameri, A.; Yarahmadi, S. Effects of omega-3 fatty acid supplements on serum lipids, apolipoproteins and malondialdehyde in type 2 diabetes patients. East. Mediterr. Health J. 2008, 14, 305–313. [Google Scholar]
- Nahar, P.; Shah, S.; Kshirsagar, M.; Ghongane, B.; Udupa, A. A comparative study of effects of omega-3 fatty acids, alpha lipoic acid and vitamin E in type 2 diabetes mellitus. Ann. Med. Health Sci. Res. 2013, 3, 442–446. [Google Scholar] [CrossRef]
- Liu, K.; Wang, B.; Zhou, R.; Lang, H.-D.; Ran, L.; Wang, J.; Li, L.; Kang, C.; Zhu, X.-H.; Zhang, Q.-Y.; et al. Effect of combined use of a low-carbohydrate, high-protein diet with omega-3 polyunsaturated fatty acid supplementation on glycemic control in newly diagnosed type 2 diabetes: A randomized, double-blind, parallel-controlled trial. Am. J. Clin. Nutr. 2018, 108, 256–265. [Google Scholar] [CrossRef]
- Mansoori, A.; Sotoudeh, G.; Djalali, M.; Eshraghian, M.R.; Keramatipour, M.; Nasli-Esfahani, E.; Shidfar, F.; Alvandi, E.; Toupchian, O.; Koohdani, F. Effect of DHA-rich fish oil on PPARγ target genes related to lipid metabolism in type 2 diabetes: A randomized, double-blind, placebo-controlled clinical trial. J. Clin. Lipidol. 2015, 9, 770–777. [Google Scholar] [CrossRef] [PubMed] [Green Version]
- Pooya, S.; Jalali, M.D.; Jazayery, A.D.; Saedisomeolia, A.; Eshraghian, M.R.; Toorang, F. The efficacy of omega-3 fatty acid supplementation on plasma homocysteine and malondialdehyde levels of type 2 diabetic patients. Nutr. Metab. Cardiovasc. Dis. 2010, 20, 326–331. [Google Scholar] [CrossRef]
- Fayh, A.P.T.; Borges, K.; Cunha, G.D.S.; Krause, M.; Rocha, R.; de Bittencourt, P.I.H., Jr.; Moreira, J.C.F.; Friedman, R.; Rossato, J.D.S.; Fernandes, J.R.; et al. Effects of n-3 fatty acids and exercise on oxidative stress parameters in type 2 diabetic: A randomized clinical trial. J. Int. Soc. Sports Nutr. 2018, 15, 18. [Google Scholar] [CrossRef] [PubMed] [Green Version]
- Poursoleiman, F.; Mozaffari-Khosravi, H.; Naghdipour Biregani, A. Does omega-3 fatty acid supplementation have beneficial effects on plasma homocysteine, insulin resistance and lipid profile of type 2 diabetic patients? A randomized clinical trial. J. Nutr. Food Secur. 2018, 3, 40–50. [Google Scholar]
- Wang, F.; Wang, Y.; Zhu, Y.; Liu, X.; Xia, H.; Yang, X.; Sun, G. Treatment for 6 months with fish oil-derived n-3 polyunsaturated fatty acids has neutral effects on glycemic control but improves dyslipidemia in type 2 diabetic patients with abdominal obesity: A randomized, double-blind, placebo-controlled trial. Eur. J. Nutr. 2017, 56, 2415–2422. [Google Scholar] [CrossRef]
- Sarbolouki, S.; Javanbakht, M.H.; Derakhshanian, H.; Hosseinzadeh, P.; Zareei, M.; Hashemi, S.B.; Dorosty-Motlagh, A.-R.; Eshraghian, M.R.; Djalali, M. Eicosapentaenoic acid improves insulin sensitivity and blood sugar in overweight type 2 diabetes mellitus patients: A double-blind randomised clinical trial. Singap. Med. J. 2013, 54, 387–390. [Google Scholar] [CrossRef] [PubMed]
- Woodman, R.; A Mori, T.; Burke, V.; Puddey, I.B.; Watts, G.; Beilin, L.J. Effects of purified eicosapentaenoic and docosahexaenoic acids on glycemic control, blood pressure, and serum lipids in type 2 diabetic patients with treated hypertension. Am. J. Clin. Nutr. 2002, 76, 1007–1015. [Google Scholar] [CrossRef] [PubMed] [Green Version]
- Holman, R.R.; Paul, S.; Farmer, A.; Tucker, L.; Stratton, I.M.; Neil, H.A.W.; on behalf of the AFORRD study group. Atorvastatin in Factorial with Omega-3 EE90 Risk Reduction in Diabetes (AFORRD): A randomised controlled trial. Diabetologia 2009, 52, 50–59. [Google Scholar] [CrossRef] [PubMed]
- Siniarski, A.; Haberka, M.; Mostowik, M.; Gołębiowska-Wiatrak, R.; Poręba, M.; Malinowski, K.; Gąsior, Z.; Konduracka, E.; Nessler, J.; Gajos, G. Treatment with omega-3 polyunsaturated fatty acids does not improve endothelial function in patients with type 2 diabetes and very high cardiovascular risk: A randomized, double-blind, placebo-controlled study (Omega-FMD). Atherosclerosis 2018, 271, 148–155. [Google Scholar] [CrossRef] [PubMed]
- O’Mahoney, L.; Matu, J.; Price, O.J.; Birch, K.M.; Ajjan, R.A.; Farrar, D.; Tapp, R.; West, D.J.; Deighton, K.; Campbell, M.D. Omega-3 polyunsaturated fatty acids favourably modulate cardiometabolic biomarkers in type 2 diabetes: A meta-analysis and meta-regression of randomized controlled trials. Cardiovasc. Diabetol. 2018, 17, 1–13. [Google Scholar] [CrossRef]
- Valdés-Ramos, R.; Guadarrama-López, A.L.; Martínez-Carrillo, B.E.; Harbige, L.S. n-3 Polyunsaturated Fatty Acids in Type 2 Diabetes Mellitus. In Bioactive Food as Dietary Interventions for Diabetes; Elsevier: Amsterdam, The Netherlands, 2019; pp. 193–209. [Google Scholar]
- Borkman, M.; Storlien, L.H.; Pan, D.A.; Jenkins, A.; Chisholm, D.J.; Campbell, L.V. The Relation between Insulin Sensitivity and the Fatty-Acid Composition of Skeletal-Muscle Phospholipids. N. Engl. J. Med. 1993, 328, 238–244. [Google Scholar] [CrossRef]
- Calder, P.C. Mechanisms of Action of (n-3) Fatty Acids. J. Nutr. 2012, 142, 592S–599S. [Google Scholar] [CrossRef] [Green Version]
- Aas, V.; Rokling-Andersen, M.H.; Kase, E.T.; Thoresen, G.H.; Rustan, A.C. Eicosapentaenoic acid (20:5 n-3) increases fatty acid and glucose uptake in cultured human skeletal muscle cells. J. Lipid Res. 2006, 47, 366–374. [Google Scholar] [CrossRef] [Green Version]
- Oh, D.Y.; Talukdar, S.; Bae, E.J.; Imamura, T.; Morinaga, H.; Fan, W.; Li, P.; Lu, W.J.; Watkins, S.M.; Olefsky, J.M. GPR120 Is an Omega-3 Fatty Acid Receptor Mediating Potent Anti-inflammatory and Insulin-Sensitizing Effects. Cell 2010, 142, 687–698. [Google Scholar] [CrossRef] [Green Version]
- Kalupahana, N.S.; Claycombe, K.; Newman, S.; Stewart, T.; Siriwardhana, N.; Matthan, N.; Lichtenstein, A.H.; Moustaid-Moussa, N. Eicosapentaenoic Acid Prevents and Reverses Insulin Resistance in High-Fat Diet-Induced Obese Mice via Modulation of Adipose Tissue Inflammation. J. Nutr. 2010, 140, 1915–1922. [Google Scholar] [CrossRef] [Green Version]
- Le Foll, C.; Corporeau, C.; Le Guen, V.; Gouygou, J.-P.; Bergé, J.-P.; Delarue, J. Long-chain n-3 polyunsaturated fatty acids dissociate phosphorylation of Akt from phosphatidylinositol 3′-kinase activity in rats. Am. J. Physiol. Endocrinol. Metab. 2007, 292, E1223–E1230. [Google Scholar] [CrossRef] [Green Version]
- Corporeau, C.; Le Foll, C.; Taouis, M.; Gouygou, J.-P.; Bergé, J.-P.; Delarue, J. Adipose tissue compensates for defect of phosphatidylinositol 3′-kinase induced in liver and muscle by dietary fish oil in fed rats. Am. J. Physiol. Metab. 2006, 290, E78–E86. [Google Scholar] [CrossRef] [PubMed] [Green Version]
- Kuda, O.; Jelenik, T.; Jilkova, Z.; Flachs, P.; Rossmeisl, M.; Hensler, M.; Kazdova, L.; Ogston, N.; Baranowski, M.; Gorski, J.; et al. n-3 fatty acids and rosiglitazone improve insulin sensitivity through additive stimulatory effects on muscle glycogen synthesis in mice fed a high-fat diet. Diabetologia 2009, 52, 941–951. [Google Scholar] [CrossRef] [PubMed] [Green Version]
- Puhakainen, I.; Ahola, I.; Yki-Järvinen, H. Dietary supplementation with n−3 fatty acids increases gluconeogenesis from glycerol but not hepatic glucose production in patients with non-insulin-dependent diabetes mellitus. Am. J. Clin. Nutr. 1995, 61, 121–126. [Google Scholar] [CrossRef]
- Lapillonne, A.; Clarke, S.D.; Heird, W.C. Polyunsaturated fatty acids and gene expression. Curr. Opin. Clin. Nutr. Metab. Care. 2004, 7, 151–156. [Google Scholar] [CrossRef] [PubMed]
- Friedman, A.; Moe, S. Review of the Effects of Omega-3 Supplementation in Dialysis Patients. Clin. J. Am. Soc. Nephrol. 2006, 1, 182–192. [Google Scholar] [CrossRef] [Green Version]
- Farmer, A.; Montori, V.; Dinneen, S.; Clar, C. Fish oil in people with type 2 diabetes mellitus. Cochrane Database Syst. Rev. 2001, 3. [Google Scholar] [CrossRef]
- Hartweg, J.; Farmer, A.J.; Perera, R.; Holman, R.R.; Neil, H.A.W. Meta-analysis of the effects of n-3 polyunsaturated fatty acids on lipoproteins and other emerging lipid cardiovascular risk markers in patients with type 2 diabetes. Diabetologia 2007, 50, 1593–1602. [Google Scholar] [CrossRef] [Green Version]
- Hartweg, J.; Perera, R.; Montori, V.M.; Dinneen, S.F.; Neil, A.H.; Farmer, A.J. Omega-3 polyunsaturated fatty acids (PUFA) for type 2 diabetes mellitus. Cochrane Database Syst. Rev. 2008, 1. [Google Scholar] [CrossRef] [PubMed]
- Hartweg, J.; Farmer, A.J.; Holman, R.R.; Neil, A. Potential impact of omega-3 treatment on cardiovascular disease in type 2 diabetes. Curr. Opin. Lipidol. 2009, 20, 30–38. [Google Scholar] [CrossRef]
- Schmidt, M.I.; Saad, M.J.; Duncan, B.B. Subclinical inflammation and obesity, diabetes and related disorders. Drug Discov. Today Dis. Mech. 2005, 2, 307–312. [Google Scholar] [CrossRef]
- Langin, D.; Arner, P. Importance of TNFα and neutral lipases in human adipose tissue lipolysis. Trends Endocrinol. Metab. 2006, 17, 314–320. [Google Scholar] [CrossRef] [PubMed]
- Tilg, H.; Moschen, A. Adipocytokines: Mediators linking adipose tissue, inflammation and immunity. Nat. Rev. Immunol. 2006, 6, 772–783. [Google Scholar] [CrossRef] [PubMed]
- Jump, D.B. Dietary polyunsaturated fatty acids and regulation of gene transcription. Curr. Opin. Lipidol. 2002, 13, 155–164. [Google Scholar] [CrossRef] [PubMed]
- Adkins, Y.; Kelley, D.S. Mechanisms underlying the cardioprotective effects of omega-3 polyunsaturated fatty acids. J. Nutr. Biochem. 2010, 21, 781–792. [Google Scholar] [CrossRef] [PubMed]
- Wanten, G.J.; Calder, P.C. Immune modulation by parenteral lipid emulsions. Am. J. Clin. Nutr. 2007, 85, 1171–1184. [Google Scholar] [CrossRef] [PubMed] [Green Version]
- Serhan, C.N.; Chiang, N.; Van Dyke, T.E. Resolving inflammation: Dual anti-inflammatory and pro-resolution lipid mediators. Nat. Rev. Immunol. 2008, 8, 349–361. [Google Scholar] [CrossRef] [Green Version]
- Arita, M.; Bianchini, F.; Aliberti, J.; Sher, A.; Chiang, N.; Hong, S.; Yang, R.; Petasis, N.; Serhan, C.N. Stereochemical assignment, antiinflammatory properties, and receptor for the omega-3 lipid mediator resolvin E1. J. Exp. Med. 2005, 201, 713–722. [Google Scholar] [CrossRef] [PubMed]
- Rangel-Huerta, O.D.; Aguilera, C.M.; Mesa, M.D.; Gil, A. Omega-3 long-chain polyunsaturated fatty acids supplementation on inflammatory biomakers: A systematic review of randomised clinical trials. Br. J. Nutr. 2012, 107 (Suppl. 2), S159–S170. [Google Scholar] [CrossRef] [PubMed] [Green Version]
- Li, K.; Huang, T.; Zheng, J.; Wu, K.; Li, D. Effect of Marine-Derived n-3 Polyunsaturated Fatty Acids on C-Reactive Protein, Interleukin 6 and Tumor Necrosis Factor α: A Meta-Analysis. PLoS ONE 2014, 9, e88103. [Google Scholar] [CrossRef] [Green Version]
- Buckley, J.D.; Howe, P. Anti-obesity effects of long-chain omega-3 polyunsaturated fatty acids. Obes. Rev. 2009, 10, 648–659. [Google Scholar] [CrossRef]
- Parra, D.; Ramel, A.; Bandarra, N.; Kiely, M.; Martínez, J.A.; Thorsdottir, I. A diet rich in long chain omega-3 fatty acids modulates satiety in overweight and obese volunteers during weight loss. Appetite 2008, 51, 676–680. [Google Scholar] [CrossRef]
- Takahashi, Y.; Ide, T. Dietary n-3 fatty acids affect mRNA level of brown adipose tissue uncoupling protein 1, and white adipose tissue leptin and glucose transporter 4 in the rat. Br. J. Nutr. 2000, 84, 175–184. [Google Scholar] [CrossRef] [PubMed] [Green Version]
- Pérez-Matute, P.; Pérez-Echarri, N.; Martínez, J.A.; Marti, A.; Moreno-Aliaga, M.J. Eicosapentaenoic acid actions on adiposity and insulin resistance in control and high-fat-fed rats: Role of apoptosis, adiponectin and tumour necrosis factor-α. Br. J. Nutr. 2007, 97, 389–398. [Google Scholar] [CrossRef] [PubMed] [Green Version]
- Chen, C.; Yu, X.; Shao, S. Effects of omega-3 fatty acid supplementation on glucose control and lipid levels in type 2 diabetes: A metaanalysis. PLoS ONE 2015, 10, e0139565. [Google Scholar] [CrossRef] [PubMed] [Green Version]
- Brown, T.J.; Brainard, J.; Song, F.; Wang, X.; Abdelhamid, A.; Hooper, L. Omega-3, omega-6, and total dietary polyunsaturated fat for prevention and treatment of type 2 diabetes mellitus: Systematic review and meta-analysis of randomised controlled trials. BMJ 2019, 366, l4697. [Google Scholar] [CrossRef] [Green Version]
- Natto, Z.S.; Yaghmoor, W.; Alshaeri, H.; Van Dyke, T.E. Omega-3 Fatty Acids Effects on Inflammatory Biomarkers and Lipid Profiles among Diabetic and Cardiovascular Disease Patients: A Systematic Review and Meta-Analysis. Sci. Rep. 2019, 9, 18867. [Google Scholar] [CrossRef] [Green Version]
- Gao, C.; Liu, Y.; Gan, Y.; Bao, W.; Peng, X.; Xing, Q.; Gao, H.; Lai, J.; Liu, L.; Wang, Z.; et al. Effects of fish oil supplementation on glucose control and lipid levels among patients with type 2 diabetes mellitus: A Meta-analysis of randomized controlled trials. Lipids Health Dis. 2020, 19, 1–10. [Google Scholar] [CrossRef] [PubMed]
- Caughey, G.; Mantzioris, E.; Gibson, R.; Cleland, L.G.; James, M.J. The effect on human tumor necrosis factor alpha and interleukin 1 beta production of diets enriched in n-3 fatty acids from vegetable oil or fish oil. Am. J. Clin. Nutr. 1996, 63, 116–122. [Google Scholar] [CrossRef] [PubMed]
- Forouhi, N.G.; Imamura, F.; Sharp, S.J.; Koulman, A.; Schulze, M.B.; Zheng, J.; Ye, Z.; Sluijs, I.; Guevara, M.; Huerta, J.M.; et al. Association of plasma phospholipid n-3 and n-6 polyunsaturated fatty acids with type 2 diabetes: The EPIC-InterAct case-cohort study. PLoS Med. 2016, 13, e1002094. [Google Scholar] [CrossRef] [Green Version]
- ERA-JUMP Study Group; Choo, J.; Ueshima, H.; Curb, J.D.; Shin, C.; Evans, R.W.; El-Saed, A.; Kadowaki, T.; Okamura, T.; Nakata, K.; et al. Serum n−6 fatty acids and lipoprotein subclasses in middle-aged men: The population-based cross-sectional ERA-JUMP Study. Am. J. Clin. Nutr. 2010, 91, 1195–1203. [Google Scholar] [CrossRef] [PubMed] [Green Version]
- Wu, J.H.Y.; Marklund, M.; Imamura, F.; Tintle, N.; Korat, A.V.A.; de Goede, J.; Zhou, X.; Yang, W.-S.; Otto, M.C.D.O.; Kröger, J.; et al. Omega-6 fatty acid biomarkers and incident type 2 diabetes: Pooled analysis of individual-level data for 39 740 adults from 20 prospective cohort studies. Lancet Diabetes Endocrinol. 2017, 5, 965–974. [Google Scholar] [CrossRef] [Green Version]
- Harbige, L.S. Fatty acids, the immune response, and autoimmunity: A question of n− 6 essentiality and the balance between n-6 and n-3. Lipids 2003, 38, 323–341. [Google Scholar] [CrossRef] [PubMed]
- Khalili, L.; Alipour, B.; Jafarabadi, M.A.; Hassanalilou, T.; Abbasi, M.M.; Faraji, I. Probiotic assisted weight management as a main factor for glycemic control in patients with type 2 diabetes: A randomized controlled trial. Diabetol. Metab. Syndr. 2019, 11, 5. [Google Scholar] [CrossRef] [PubMed]



| N | ID | Supplement Type | Duration (Weeks) | Dose (mg/d) | Analysis | |||||||||||
|---|---|---|---|---|---|---|---|---|---|---|---|---|---|---|---|---|
| Glycemic Factors | Lipid Profile | Inflammatory Markers | Weight | BMI | ||||||||||||
| FBS | HbA1c | HOMA.IR | TG | Chol | LDL | HDL | TNF-α | CRP | ||||||||
| 1 | Hajianfar, [14] | n-3 capsules | 8 | - | ✓ | ✓ | ||||||||||
| 2 | Golpour, [15] | n-3 capsules | 10 | 2700 | ✓ | ✓ | ✓ | ✓ | ✓ | |||||||
| 3 | Dasarathy, [16] | EPA/DHA supplement | 48 | 3600 | ✓ | ✓ | ✓ | ✓ | ✓ | ✓ | ✓ | |||||
| 4 | Mirhashemi, [17] | flaxseed oil | 12 | 1000 | ✓ | ✓ | ||||||||||
| 5 | Orang, [18] | n-3 capsules | 12 | 2000 | ✓ | ✓ | ✓ | ✓ | ✓ | ✓ | ✓ | |||||
| 6 | Raygan, [19] | fish oil | 12 | 1000 | ✓ | ✓ | ✓ | ✓ | ✓ | ✓ | ✓ | ✓ | ✓ | |||
| 7 | Javid, [20] | n-3 capsules | 8 | 2000 | ✓ | ✓ | ✓ | ✓ | ✓ | ✓ | ✓ | ✓ | ||||
| 8 | Soleimani, [21] | flaxseed oil | 12 | 1000 | ✓ | ✓ | ✓ | ✓ | ✓ | ✓ | ✓ | ✓ | ✓ | ✓ | ||
| 9 | Soleimani, [22] | flaxseed oil | 12 | 1000 | ✓ | ✓ | ✓ | ✓ | ✓ | ✓ | ||||||
| 10 | Veleba, [23] | EPA + DHA concentrate | 24 | 5000 | ✓ | ✓ | ✓ | ✓ | ✓ | ✓ | ✓ | ✓ | ||||
| 11 | Ansari, [24] | n-3 capsules | 10 | 3750 | ✓ | ✓ | ✓ | ✓ | ✓ | |||||||
| 12 | Jacobo-Cejudo, [25] | fish-oil | 24 | 520 | ✓ | ✓ | ✓ | ✓ | ✓ | ✓ | ✓ | ✓ | ✓ | |||
| 13 | Kabir, [26] | fish-oil | 8 | 3000 | ✓ | ✓ | ✓ | ✓ | ✓ | ✓ | ✓ | |||||
| 14 | Hosseinzadeh, [27] | n-3 capsules | 8 | 2000 | ✓ | ✓ | ||||||||||
| 15 | Malekshahi, [28] | n-3 capsules | 8 | 2714 | ✓ | ✓ | ✓ | |||||||||
| 16 | Hua, [29] | A | Fish oil | 4 | 2000 | ✓ | ✓ | ✓ | ✓ | ✓ | ✓ | ✓ | ||||
| B | 8 | ✓ | ✓ | ✓ | ✓ | ✓ | ✓ | ✓ | ||||||||
| C | 12 | ✓ | ✓ | ✓ | ✓ | ✓ | ✓ | ✓ | ||||||||
| 17 | Chauhan, [30] | A | n-3 capsule | 6 | 1000 | ✓ | ✓ | ✓ | ✓ | |||||||
| B | 12 | 2000 | ✓ | ✓ | ✓ | ✓ | ✓ | ✓ | ||||||||
| C | 6 | 1000 | ✓ | ✓ | ✓ | ✓ | ||||||||||
| D | 12 | 2000 | ✓ | ✓ | ✓ | ✓ | ✓ | ✓ | ||||||||
| 18 | Shidfar, [31] | Purified n-3 | 10 | 2000 | ✓ | ✓ | ✓ | ✓ | ✓ | ✓ | ||||||
| 19 | Udupa, [32] | n-3 soft gels | 13 | 300 | ✓ | ✓ | ||||||||||
| 20 | Liu, [33] | A | fish oil | 4 | 3650 | ✓ | ✓ | ✓ | ✓ | ✓ | ✓ | |||||
| B | 8 | ✓ | ✓ | ✓ | ✓ | ✓ | ✓ | ✓ | ||||||||
| C | 12 | ✓ | ✓ | ✓ | ✓ | ✓ | ✓ | ✓ | ||||||||
| 21 | Mansoori, [34] | fish oil | 8 | 1850 | ✓ | ✓ | ✓ | ✓ | ✓ | ✓ | ||||||
| 22 | Pooya, [35] | n-3 capsules | 8 | 2714 | ✓ | ✓ | ✓ | ✓ | ✓ | |||||||
| 23 | Fayh, [36] | n-3 capsules | 8 | 300 | ✓ | ✓ | ✓ | ✓ | ✓ | ✓ | ||||||
| 24 | Poursoleiman, [37] | n-3 soft gels | 6 | 2000 | ✓ | ✓ | ✓ | ✓ | ✓ | |||||||
| 25 | Wang, [38] | A | fish oil | 12 | 4000 | ✓ | ✓ | ✓ | ✓ | ✓ | ✓ | ✓ | ||||
| B | 24 | ✓ | ✓ | ✓ | ✓ | ✓ | ✓ | ✓ | ||||||||
| 26 | Sarbolouki, [39] | purified EPA | 12 | 2000 | ✓ | ✓ | ✓ | |||||||||
| 27 | Woodman, [40] | A | purified EPA | 6 | 4000 | ✓ | ✓ | ✓ | ✓ | ✓ | ✓ | |||||
| B | purified DHA | 6 | 4000 | ✓ | ✓ | ✓ | ✓ | ✓ | ✓ | |||||||
| 28 | Zheng, [22] | A | fish oil | 12 | 2000 | ✓ | ✓ | ✓ | ✓ | ✓ | ✓ | |||||
| B | 26 | ✓ | ✓ | ✓ | ✓ | ✓ | ✓ | |||||||||
| 29 | Holman, [41] | n-3 capsules | 28 | 2000 | ✓ | ✓ | ✓ | ✓ | ||||||||
| 30 | Siniarski, [42] | juice box | 12 | 2000 | ✓ | ✓ | ✓ | ✓ | ||||||||
| Variable | Group | No. of Comparisons | SMD (95% CI) | p-Value | I2 (%) | p-Heterogeneity |
|---|---|---|---|---|---|---|
| FBS | Total | 34 | −0.36 (−0.71, −0.01) | 0.047 | 92.9 | 0.000 |
| Intervention dosage (mg/d) | ||||||
| ≤1000 | 8 | −0.20 (−0.83, 0.42) | 0.084 | 40.9 | 0.084 | |
| 1000–2000 | 13 | −0.33 (−0.57, −0.09) | 0.008 * | 69.0 | 0.000 | |
| ≥2000 | 13 | −1.40 (−1.42, 0.63) | 0.448 | 96.9 | 0.000 | |
| Intervention duration (w) | ||||||
| ≤8 | 14 | −0.21 (−0.96, 0.54) | 0.588 | 95.6 | 0.000 | |
| >8 | 20 | −0.40 (−0.75, −0.05) | 0.026 * | 92.9 | 0.000 | |
| HbA1c | Total | 29 | −0.74 (−1.13, −0.35) | 0.047 | 94.8 | 0.000 |
| Intervention dosage (mg/d) | ||||||
| ≤1000 | 5 | −0.66 (−1.11, −0.20) | 0.005 * | 68.4 | 0.013 | |
| 1000–2000 | 11 | −0.75 (−1.37, −0.14) | 0.016 * | 95.9 | 0.000 | |
| ≥2000 | 13 | −0.81 (−1.58, −0.03) | 0.042 * | 95.4 | 0.000 | |
| Intervention duration (w) | ||||||
| ≤8 | 10 | −0.69 (−1.29, −0.08) | 0.025 * | 90.4 | 0.000 | |
| >8 | 19 | −0.77 (−1.25, −0.29) | 0.002 * | 95.3 | 0.000 | |
| HOMA.IR | Total | 19 | −0.58 (−1.13, −0.35) | 0.038 | 95.6 | 0.000 |
| Intervention dosage (mg/d) | ||||||
| ≤1000 | 3 | 0.32 (−0.96, 0.32) | 0.324 | 77.5 | 0.012 | |
| 1000–2000 | 8 | −0.93 (−1.71, −0.16) | 0.019 * | 95.6 | 0.000 | |
| ≥2000 | 8 | −0.33 (−1.40, 0.74) | 0.546 | 96.6 | 0.000 | |
| Intervention duration (w) | ||||||
| ≤8 | 5 | 0.16 (−1.28, 1.60) | 0.828 | 97.6 | 0.000 | |
| >8 | 14 | −0.84 (−1.42, −0.26) | 0.005 * | 94.5 | 0.000 | |
| Variable | Group | No. of Comparisons | SMD (95% CI) | p-Value | I2 (%) | p-Heterogeneity |
|---|---|---|---|---|---|---|
| TG | Total | 26 | −0.27 (−0.37, −0.18) | 0.038 | 0.0 | 0.958 |
| Intervention dosage (mg/d) | ||||||
| ≤1000 | 7 | −0.23 (−0.43, 0.03) | 0.023 * | 0.0 | 0.851 | |
| 1000–2000 | 10 | −0.32 (−0.47, −0.17) | 0.000 * | 0.0 | 0.621 | |
| ≥2000 | 9 | −0.24 (−0.42, −0.07) | 0.006 * | 0.0 | 0.958 | |
| Intervention duration (w) | ||||||
| ≤8 | 13 | −0.23 (−0.37, −0.08) | 0.002 * | 0.0 | 0.909 | |
| >8 | 13 | −0.23 (−0.45, −0.18) | 0.000 * | 0.0 | 0.904 | |
| CHOL | Total | 30 | −0.60 (−0.88, −0.32) | 0.038 | 90.8 | 0.000 |
| Intervention dosage (mg/d) | ||||||
| ≤1000 | 7 | −0.62 (−1.16, −0.08) | 0.024 * | 85.3 | 0.000 | |
| 1000–2000 | 13 | −0.66 (−1.14, −0.18) | 0.007 * | 94.2 | 0.000 | |
| ≥2000 | 10 | −0.49 (−0.95, −0.03) | 0.037 * | 86.0 | 0.000 | |
| Intervention duration (w) | ||||||
| ≤8 | 13 | −0.50 (−0.93, −0.07) | 0.024 * | 88.1 | 0.000 | |
| >8 | 17 | −0.67 (−1.05, −0.29) | 0.001 * | 92.3 | 0.000 | |
| LDL | Total | 28 | −0.54 (−0.85, −0.23) | 0.047 | 91.8 | 0.000 |
| Intervention dosage (mg/d) | ||||||
| ≤1000 | 6 | −0.31 (−0.65, 0.03) | 0.073 | 58.2 | 0.035 | |
| 1000–2000 | 12 | −0.51 (−1.01, −0.02) | 0.042 * | 93.9 | 0.000 | |
| ≥2000 | 10 | −0.72 (−1.38, −0.07) | 0.029 * | 93.1 | 0.000 | |
| Intervention duration (w) | ||||||
| ≤8 | 12 | −0.43 (−0.98, 0.13) | 0.132 | 91.8 | 0.000 | |
| >8 | 16 | −0.62 (−1.01, −0.23) | 0.002 * | 92.2 | 0.000 | |
| HDL | Total | 29 | 0.60 (0.23, 0.96) | 0.001 | 94.0 | 0.000 |
| Intervention dosage (mg/d) | ||||||
| ≤1000 | 7 | 0.27 (−0.01, 0.55) | 0.063 | 48.8 | 0.069 | |
| 1000–2000 | 13 | 0.63 (0.04, 1.22) | 0.036 * | 96.0 | 0.000 | |
| ≥2000 | 9 | 0.81 (0.14, 1.49) | 0.001 * | 91.1 | 0.000 | |
| Intervention duration (w) | ||||||
| ≤8 | 12 | 0.52 (0.03, 1.01) | 0.036 * | 88.9 | 0.000 | |
| >8 | 17 | 0.65 (0.15, 1.16) | 0.012 * | 95.5 | 0.000 | |
Publisher’s Note: MDPI stays neutral with regard to jurisdictional claims in published maps and institutional affiliations. |
© 2021 by the authors. Licensee MDPI, Basel, Switzerland. This article is an open access article distributed under the terms and conditions of the Creative Commons Attribution (CC BY) license (https://creativecommons.org/licenses/by/4.0/).
Share and Cite
Khalili, L.; Valdes-Ramos, R.; Harbige, L.S. Effect of n-3 (Omega-3) Polyunsaturated Fatty Acid Supplementation on Metabolic and Inflammatory Biomarkers and Body Weight in Patients with Type 2 Diabetes Mellitus: A Systematic Review and Meta-Analysis of RCTs. Metabolites 2021, 11, 742. https://doi.org/10.3390/metabo11110742
Khalili L, Valdes-Ramos R, Harbige LS. Effect of n-3 (Omega-3) Polyunsaturated Fatty Acid Supplementation on Metabolic and Inflammatory Biomarkers and Body Weight in Patients with Type 2 Diabetes Mellitus: A Systematic Review and Meta-Analysis of RCTs. Metabolites. 2021; 11(11):742. https://doi.org/10.3390/metabo11110742
Chicago/Turabian StyleKhalili, Leila, Roxana Valdes-Ramos, and Laurence S. Harbige. 2021. "Effect of n-3 (Omega-3) Polyunsaturated Fatty Acid Supplementation on Metabolic and Inflammatory Biomarkers and Body Weight in Patients with Type 2 Diabetes Mellitus: A Systematic Review and Meta-Analysis of RCTs" Metabolites 11, no. 11: 742. https://doi.org/10.3390/metabo11110742
APA StyleKhalili, L., Valdes-Ramos, R., & Harbige, L. S. (2021). Effect of n-3 (Omega-3) Polyunsaturated Fatty Acid Supplementation on Metabolic and Inflammatory Biomarkers and Body Weight in Patients with Type 2 Diabetes Mellitus: A Systematic Review and Meta-Analysis of RCTs. Metabolites, 11(11), 742. https://doi.org/10.3390/metabo11110742


