Article

The Impact of Microbiome and Microbiota-Derived Sodium Butyrate on Drosophila Transcriptome and Metabolome Revealed by Multi-Omics Analysis

1
Guangdong Provincial Key Laboratory of Insect Developmental Biology and Applied Technology, Institute of Insect Science and Technology, School of Life Sciences, South China Normal University, Guangzhou 510631, China
2
State Key Laboratory of Biocontrol, School of Life Sciences, Sun Yat-sen University, Guangzhou 510275, China
*
Authors to whom correspondence should be addressed.
These authors have contributed equally to this work.
Metabolites 2021, 11(5), 298; https://doi.org/10.3390/metabo11050298
Submission received: 19 March 2021 / Revised: 15 April 2021 / Accepted: 20 April 2021 / Published: 6 May 2021
(This article belongs to the Special Issue Metabolic Research in Drosophila melanogaster)

Abstract

:
The host microbiome plays an important role in regulating physiology through microbiota-derived metabolites during host-microbiome interactions. However, molecular mechanism underly host-microbiome interactions remains to be explored. In this study, we used Drosophila as the model to investigate the influence of microbiome and microbiota-derived metabolite sodium butyrate on host transcriptome and metabolome. We established both a sterile Drosophila model and a conventional Drosophila model to demonstrate the role of sodium butyrate. Using multi-omics analysis, we found that microbiome and sodium butyrate could impact host gene expression patterns in both the sterile Drosophila model and the conventional Drosophila model. The analysis of gut microbial using 16S rRNA sequencing showed sodium butyrate treatment also influenced Drosophila bacterial structures. In addition, Drosophila metabolites identified by ultra-high performance liquid chromatography-MS/MS were shown to be affected by sodium butyrate treatment with lipids as the dominant changed components. Our integrative analysis of the transcriptome, the microbiome, and the metabolome data identified candidate transcripts that are coregulated by sodium butyrate. Taken together, our results reveal the impact of the microbiome and microbiota-derived sodium butyrate on host transcriptome and metabolome, and our work provides a better understanding of host-microbiome interactions at the molecular level with multi-omics data.

1. Introduction

The host microbiome plays an important role in digesting complex diets, synthesizing nutrients, and maintenance of the immune system to facilitate the survival of the host [1,2]. The number of microbial populations inhabiting the intestines is large and diverse depending on the host species. Intestinal microbes can communicate with the host through metabolites, mainly including short-chain fatty acids (e.g., acetate, propionate, and sodium butyrate). Short-chain fatty acids are the most abundant metabolites produced by the fermentation of undigested dietary fiber by intestinal microorganisms and provide the main energy source for the host intestinal cells [3]. Of all the short-chain fatty acids, sodium butyrate has received special attention because it is a key regulator that mediates the metabolic control of the microbiota [4]. In fruit fly Drosophila melanogaster, it has been reported that adding sodium butyrate to the diet can effectively reduce the susceptibility or short-term mortality risk during aging [5]. Thus, sodium butyrate plays a non-negligible role in the dynamic relationship between diet, gut microbiome composition, and metabolic health for all animals [6,7].
Drosophila has been used as a model organism for the study of host-microbiome interactions in the gut. Increasing evidence has shown that the gut microbiome can affect Drosophila’s physiological functions such as nutrition, metabolism and immunity [8,9]. However, the molecular mechanism underlying host-microbiome interactions in the Drosophila model remains to be explored. In the present study, we used D. melanogaster as the model to investigate the influence of microbiome and microbiota-derived metabolite sodium butyrate on host transcriptome and metabolome. We examined the impact of sodium butyrate on the host in both sterile Drosophila (also referred to as axenic Drosophila in the literature) and conventional Drosophila. In order to further investigate the effects of sodium butyrate on Drosophila at the molecular level, we detected the abundance and composition of gut microbial colonies using 16S rRNA sequencing analysis and analyzed the overall structure and metabolic activities of host transcriptional networks by integrating transcriptome and metabolome data. Finally, we carried out an integrative analysis of the transcriptome, the microbiome, and the metabolome data regulated by sodium butyrate to figure out the correlations. Our results demonstrate the impact of the microbiome- and microbiota-derived sodium butyrate on host transcriptome and metabolome, and our work provides new insights into the mechanism of host-microbiome interactions at the molecular level with multi-omics data.

2. Results

2.1. Drosophila Microbiome and Metabolites Regulate Host Gene Expression under Sterile Condition

To examine the influence of the microbiome on Drosophila gene expression, we first established a sterile Drosophila model from the embryonic stage to remove the intestinal microbes, and in parallel, we bred conventional Drosophila with normal intestinal microbes. To understand the potential role of sodium butyrate in Drosophila, we further treated the sterile Drosophila with or without sodium butyrate. RNA samples from conventional Drosophila, sterile Drosophila, and sterile Drosophila treated with sodium butyrate were extracted for RNA sequencing and data analysis.
Principal component analysis of RNA sequencing data showed that three biological replicates from different groups were well clustered, and samples from conventional Drosophila and sterile Drosophila were clearly grouped (Figure 1A), suggesting that the sterile Drosophila model was successfully established. The Pearson correlation analysis showed gene expression patterns from conventional Drosophila and sterile Drosophila were clearly different (Figure 1B). As an important microbiota-derived metabolite, sodium butyrate treatment in the sterile Drosophila model caused a linear compensation effect between conventional Drosophila and sterile Drosophila (Figure 1B). A total of 4737 genes were found to be differentially expressed between sterile Drosophila and sterile Drosophila treated with sodium butyrate. We further analyzed functional pathways with differentially expressed genes; many key pathways in Drosophila were affected, such as biosynthetic process, metabolic process, immune response, and development process (Figure 1C). We performed quantitative RT-PCR validation of differentially expressed genes (Figure 2), and the results were generally consistent with RNA sequencing data. Specifically, genes involved in metabolic and immune pathways (both downregulated and upregulated) were differentially expressed between conventional Drosophila and sterile Drosophila (Figure 2).

2.2. Drosophila Microbiome and Metabolites Regulate Host Gene Expression under Conventional Condition

Based on our findings in sterile Drosophila, microbiome and microbiota-derived sodium butyrate showed an obvious influence on Drosophila gene expression pattern when intestinal microbes were completely removed. We wondered if the effect could be observed when Drosophila were grown under conventional conditions, and we were encouraged to explore potential mechanisms underlying the host-microbiome interactions at the molecular level. We treated conventional Drosophila with or without sodium butyrate, and we first collected Drosophila midgut components for bacterial analysis.
For gut microbiome analysis, 16S rDNA sequencing was used to analyze the bacterial structure upon sodium butyrate treatment compared to conventional Drosophila. Principal component analysis showed three biological replicates from two groups could be well clustered (Figure 3A), indicating a visible effect of sodium butyrate on Drosophila microbiome components. At the phylum level, the dominant effect of sodium butyrate was shown to promote Firmicutes and suppress Proteobacteria (Figure 3B). The bacterial structure was also analyzed at the class, order, family, genus, and species level, respectively (Supplementary Figure S1). Functional prediction of bacterial structure showed that the relative abundance of Gram-positive bacteria was increased and Gram-negative bacteria was decreased by sodium butyrate treatment (Figure 3C), which was consistent with bacterial structure at the phylum level (Figure 3B). In addition, sodium butyrate treatment increased the abundance of aerobic bacteria and decreased the abundance of anaerobic bacteria. Microbiome phenotypes predictions results showed that those changed bacteria species might be involved in many phenotypes with metabolism as the dominant function (Figure 3D).
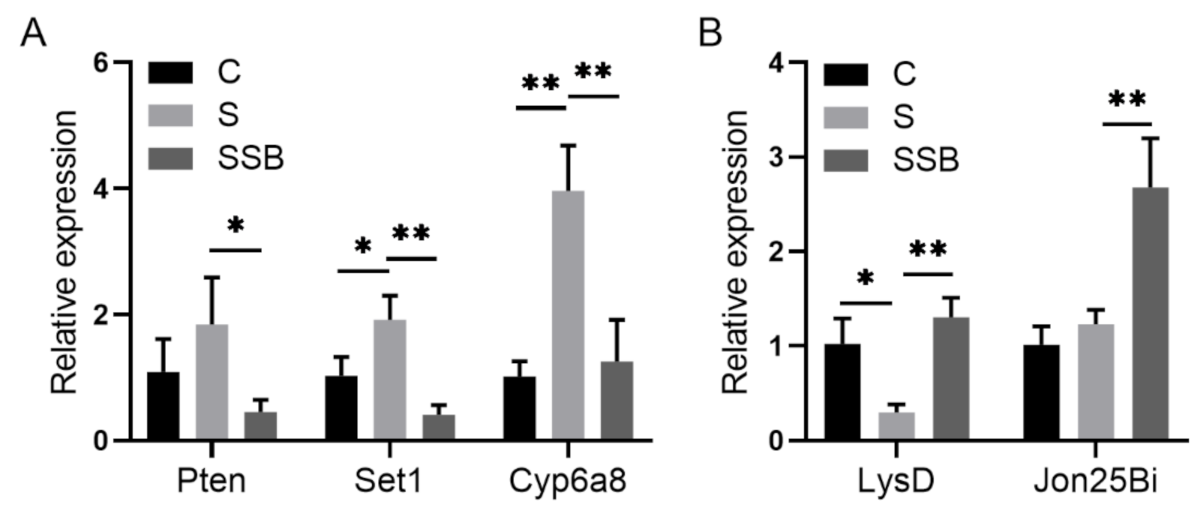
After we confirmed the effect of sodium butyrate on Drosophila intestinal microbes, we further performed RNA sequencing of Drosophila treated with or without sodium butyrate. Principal component analysis of RNA sequencing data showed that gene expression patterns from different groups could be well clustered (Figure 4A). Volcano plot analysis showed sodium butyrate treatment under conventional conditions could also regulate Drosophila gene expression in both up- and downregulation patterns (Figure 4B). The most significant upregulated genes coding for these transcripts were Met75Ca, CG42866, and the most significant downregulated genes were CG30025, CG33502, Cpr49Ah, and CG17298. Gene ontology analysis showed that most differentially expressed genes regulated by sodium butyrate were enriched in key biological processes (Figure 4C). Overall, sodium butyrate treatment showed an inhibitive effect on host gene expression under both conventional conditions (Figure 4C) and sterile conditions (Figure 1C). We also performed quantitative RT-PCR validation of differentially expressed genes, and genes with different functions were selected for validation experiments (Figure 5 and Supplementary Figure S2). The results were similar with RNA sequencing data, suggesting that sodium butyrate treatment for conventional Drosophila could affect gene expression, especially genes encoding metabolic enzymes (Figure 5A) and lysozyme family proteins (Figure 5B).
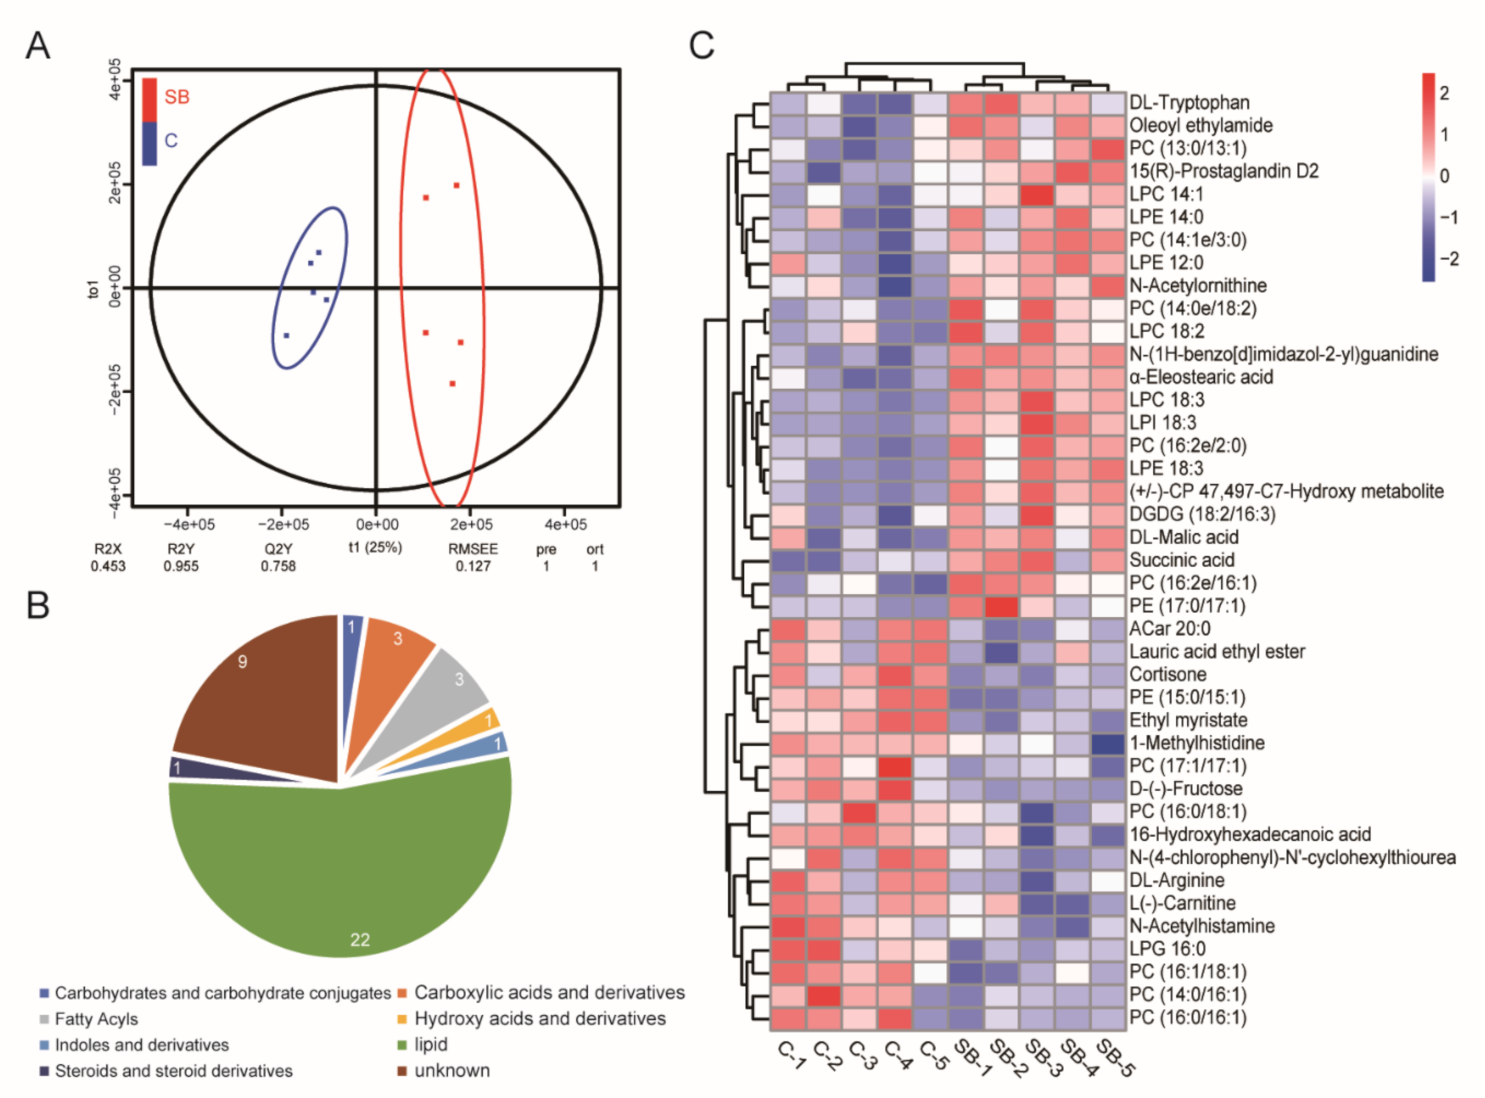
Our gut microbiome data and transcriptome data suggested the dominant role of sodium butyrate in metabolism. Next, we performed non-target analysis using UPLC-MS/MS and obtained the metabolome data of Drosophila treated with or without sodium butyrate. Orthogonal partial least squares discriminant analysis showed five biological replicates could be clustered and samples from two groups could be separated (Figure 6A). Pie chart analysis of the proportion of different metabolites components showed lipids were the main components of different metabolites between conventional Drosophila and sodium butyrate-treated Drosophila (Figure 6B). Heat map analysis of metabolites with different abundance also indicated the clustering of biological replicates between two groups. The results showed that sodium butyrate treatment indeed could influence the abundance of metabolites, with lipids as the dominant change (Figure 6C).
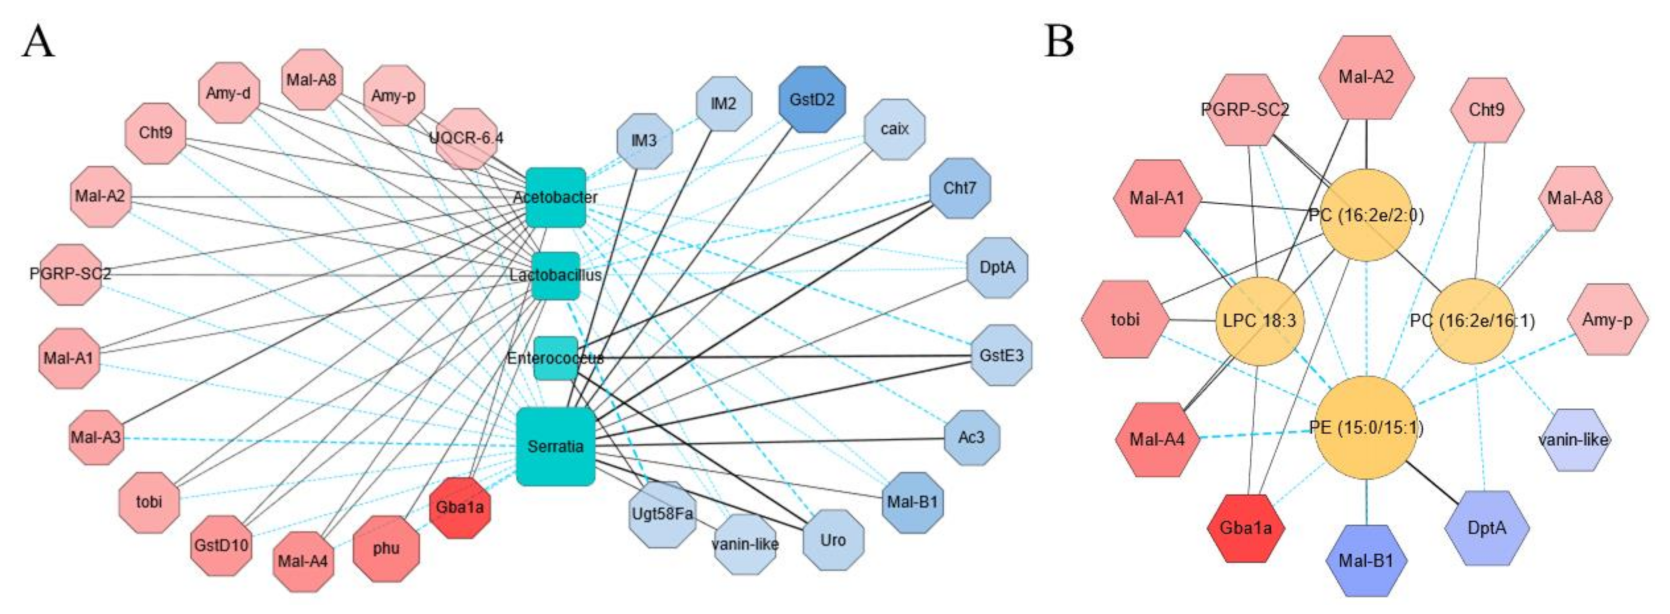
To understand the relationship among the transcriptome, the microbiome, and the metabolome with the impact of sodium butyrate, we first carried out a correlation analysis between transcriptome and microbiome with metabolic immunity-related transcripts and the most abundant bacteria in the microbiome analysis results selected in the correlation analysis (Figure 7A). At genus level, the most enriched bacteria affecting the transcriptome pattern were Acetobacter and Lactobacillus. They were positively correlated with the upregulated genes and negatively correlated with the downregulated genes, while Serratia and Enterococcus were shown to have the contrary role. Among the upregulated genes, Gba1a was involved in lipid metabolism and glycan biosynthesis, while Mal-A1, Mal-A2, Mal-A3, Mal-A4, and Mal-A8 were involved in carbohydrate metabolism and were positively correlated with Acetobacter and Lactobacillus (Figure 7A). We also performed correlation analysis between transcriptome and metabolome (Figure 7B). The majority of changed metabolites upon sodium butyrate treatment were lipids, such as Phosphatidylcholine (PC), Phosphatidylethanolamine (PE), and lysophosphatidylcholine (LPC). The representative differential metabolites LPC 18:3, PC (16:2e/2:0), PC (16:2e/16:1), and PE (15:0/15:1) were screened out by Cytoscap, and it was obvious that PE (15:0/15:1) was negatively correlated with metabolism-related genes Mal-A1, Mal-A2, Mal-A4, and Mal-A8, while the antimicrobial peptide gene DptA was positively correlated. Meanwhile, PC (16:2E 2:0), PC (16:2E/16:1), and LPC 18:3 were positively correlated with PGRP-SC2, a gene that could promote intestinal immune homeostasis (Figure 7B).

3. Discussion

Host microbiome has been increasingly recognized to play an important role in shaping the health of animals, and the conception that intestinal bacteria communities can affect host physiology has been largely acknowledged [10,11]. Recent advances indicate that the microbiota is involved in the energy balance and metabolic homeostasis of host animals. In mammals, the connection between gut microbiota and energy metabolism is well established to be an area of intense research [12]. However, our current understanding of the impact of gut microbiota on host is generally descriptive, due to technical difficulties associated with integrated analysis of both the microbes and the host [8]. Most research on the impact of the microbiome on animals is designed to identify the effects of single microbial taxa and single metabolite of microbial origin, while the networks of host-microbiome interactions at different layers in nature are much more complicated than we thought [13]. A comprehensive understanding of host-microbiome interactions that integrates multi-omics data information is currently expected in the field.
Recently, there has been growing interest in using Drosophila melanogaster to elucidate the mechanisms underlying the complex relationships between the host and its microbiota [14,15], and increasing evidence using Drosophila showed that the microbiome can influence many aspects of the host, including the metabolism, the immune system and the behavior [16,17]. In principle, the relative simplicity of the Drosophila microbiota makes it a useful model to study host-microbiota interactions. In this context, the fruit fly Drosophila is considered a key model for understanding microbiota’s influence on animal health. In the present study, we used Drosophila as the model to investigate the impact of microbiome and microbiota-derived metabolite sodium butyrate on host transcriptome and metabolome. Using multi-omics analysis, we found that microbiome and sodium butyrate could impact host gene expression patterns in both sterile Drosophila model (Figure 1) and conventional Drosophila model (Figure 4). At the molecular level, sodium butyrate is likely to affect host lipid metabolism through gene expression regulation. Our results demonstrated that the microbiome and sodium butyrate of Drosophila can significantly alter gene expression, bacterial structure, and metabolites composition of the host.
Among the short-chain fatty acids from microbiota, sodium butyrate received specific attention because it has been proven to directly activate specific G protein-coupled receptors on enteroendocrine cells and stimulate the synthesis of intestinal endocrine peptides to regulate lipid and carbohydrate metabolism [18,19]. In addition, sodium butyrate was also confirmed as an effective histone deacetylases inhibitor to subsequently regulate the expression of a variety of homeostasis-related genes [20,21]. More importantly, sodium butyrate has been used in aging-related disease therapy since it can improve the memory function in animal models [22]. In our study, we supplemented the Drosophila food with sodium butyrate under sterile conditions and conventional conditions. The gene expression patterns of two conditions collectively suggest the effect of sodium butyrate on the host transcriptome with the effect more pronounced in the sterile condition where the background level of sodium butyrate was depleted. Under conventional conditions where Drosophila has normal microbiota, sodium butyrate treatment still leads to hundreds of differentially expressed genes and dozens of differential metabolites. Specifically, the most significant upregulated genes are Met75Ca, CG42866, and the most downregulated genes are CG30025, CG33502, Cpr49Ah, CG17298. The microbiome analysis showed that the relative abundance of Gram-positive bacteria was increased and that of Gram-negative bacteria was decreased by sodium butyrate treatment (Figure 3). The results are consistent with the literature in which Gram-positive firmicutes are the main sodium butyrate-producing bacteria [23,24]. In our study, Acetobacter and Lactobacillus showed a dominant role in the intestinal flora of Drosophila treated by sodium butyrate, and the metabolites from these bacteria could be used to maintain an acidic environment in the intestinal tract, thereby inhibiting the growth of harmful bacteria. The negative correlation between these two types of bacteria and antimicrobial peptide genes IM2, IM3, and DptA (Figure 7A) could also support the effect of sodium butyrate on Acetobacter and Lactobacillus. The metabolites composition in our study showed that sodium butyrate supplement can dramatically cause lipid accumulation (Figure 6); this is also consistent with the previous report that sodium butyrate can regulate lipid metabolism [25,26]. Our work can serve as launching points for future work, and additional investigations are warranted to understand the effects of sodium butyrate on host metabolism, including the specific functions of differentially expressed genes in Drosophila.
In this study, we took advantage of Drosophila as the model to study host-microbiome interactions and carried out experiments including RNA sequencing, 16S rRNA sequencing, and metabolites profiling. Our integrative analysis of the transcriptome, the microbiome and the metabolome data suggested several candidate transcripts that are coregulated by sodium butyrate. The results from this study provide molecular evidence for host-microbiome interactions with multi-omics data. Our work also validated Drosophila as a valuable model for microbiome research, especially as it was very simple to establish the sterile Drosophila model with low cost and short time. In our study, we used the entire organism of Drosophila for our transcriptome and metabolome. We appreciate that the entire organism may be complex. However, we used the entire organism for both experimental Drosophila and control Drosophila; thus, the influence of the complexity of different cell types has been minimized. Overall, we believe that the Drosophila model will offer a valuable alternative to mammalian models for the fundamental discovery of microbiome functions as indicated in the literature [27,28,29]. Although there are differences between the Drosophila and the mammalian model—for example, Drosophila lacks an adaptive immune system [30]—the overall immune metabolic pathways that maintain intestinal homeostasis, function, and integrity are still highly conserved [31,32]. Moreover, the host-microbiota interactions are most likely conserved across the animal kingdom and are important for all animal health [31]. The long application record as a successful model for discovering fundamental biological mechanisms has proved Drosophila as a valuable system for understanding host-microbiome interactions, and we will continue to carry out systematical investigation on Drosophila-microbiome interactions in our future study.

4. Materials and Methods

4.1. Conventional Drosophila and Sterile Drosophila

For conventional Drosophila, Drosophila melanogaster w1118 was reared at 25 °C under 12 h light/12 h dark cycles on yeast-glucose medium (1 L water, 100 g yeast, 100 g glucose, 1.2% agar, 0.1% potassium sorbate) [33,34]. Sodium butyrate (molecular formula: C4H7NaO2, Sigma, 100 mM dissolved in water) -supplemented food was prepared in yeast-glucose basis medium. Grape juice agar plates were made by microwaving the mixture (100 mL water, 10 g yeast, 10 g glucose, and 1 g of agar), the diet was boiled three times, and grape juice was added to increase the visibility of eggs on the agar plate when we collected eggs [29]. The agar was cooled down and poured into clean Petri dishes, and the yeast was spread on the agar surface. The eggs were collected from the plastic cage by rinsing the agar plate with distilled water and gently poured into the cell strainer. To establish the sterile Drosophila model, fresh eggs were dechorionated in 2.7% sodium hypochlorite followed by twice with washes with 70% ethanol for 2 min in the biosafety cabinet. After washing the surface of the eggs with sterile water, a sterilized paintbrush was used to transfer the eggs to a pre-sterilized tube containing food. Sodium butyrate was included in the sterilized food for the treatment group. The protocol for animal experiment was reviewed and approved by the Institutional Animal Care and Use Committee of South China Normal University at Guangzhou, China (protocol code SCNU-SLS-2021-015).

4.2. Gut Microbiome Analysis

After 3–4 days of eclosion, Drosophila adults were anesthetized with CO2 gas followed by surface disinfected with 70% ethanol, washed three times with sterile PBS, and dissected to collect midguts. Equal numbers of males and females were used to ensure no gender differences in the bacterial content (40 flies per replicate). The bacterial DNA was purified using TIANamp Bacteria DNA kit (Tiangen Biotech Inc., Beijing, China), following the manufacturer’s protocols. A region encompassing the V3–V4 hypervariable regions of the 16S rRNA gene was amplified using the primers 341F (CCTACGGGNGGCWGCAG) and 806R (GGACTACHVGGGTATCTAAT). The 16S amplicon sequencing was performed on the Illumina Hiseq2500 platform by Guangzhou Genedenovo Biotechnology.
For microbiome data analysis, raw data containing adapters or low-quality reads were further filtered using FASTP (https://github.com/OpenGene/fastp, accessed on 7 January 2021), and paired-end clean reads were merged as raw tags using FLSAH [35], with a minimum overlap of 10bp and mismatch error rates of 2%. Clean tags were searched against the reference database to perform reference-based chimera checking using the UCHIME algorithm (http://www.drive5.com/usearch/manual/uchime_algo.html, accessed on 8 January 2021). All chimeric tags were removed, and finally, obtained effective tags were used for further analysis. The effective tags were clustered into operational taxonomic units (OTUs) of  ≥  97% similarity using UPARSE [36]. The tag sequence with the highest abundance was selected as the representative sequence within each cluster. Between-groups Venn analysis was performed in R project (version 3.4.1) to identify unique and common OTUs. The representative sequences were classified into organisms by a naive Bayesian model using RDP [37] based on SILVA database (https://www.arb-silva.de/, accessed on 8 January 2021). Chao1, Simpson, and all other alpha diversity indexes were calculated in QIIME. OTU rarefaction curve and rank abundance curves were plotted in QIIME. Multivariate statistical techniques were calculated and plotted in R project. The KEGG pathway analysis of the OTUs was inferred using PICRUSt [38] and Tax4Fun [39]. Microbiome phenotypes were classified using BugBase.

4.3. RNA Sequencing and Data Analysis

After total RNA was extracted, the enriched mRNA by Oligo(dT) beads were fragmented using fragmentation buffer and reverse transcripted into cDNA with random primers using the NEBNext® Ultra™ RNA library prep kit for Illumina following manufacturer’s instructions. For first-strand cDNA synthesis, the fragmented and primed mRNA was reversed into cDNA using ProtoScript IIReverse Transcriptase in a 20 µL reaction with the procedure of 10 min at 25 °C and 15 min at 42 °C followed by 15 min at 70 °C. For second-strand cDNA synthesis, the Second Strand Synthesis Enzyme Mix was added to the First-Strand Synthesis reaction to react at 16 °C for 1 h in an 80 µL reaction. Then, the cDNA fragments were purified with QiaQuick PCR extraction kit (Qiagen, Germany), end-repaired, poly(A) added, and ligated to Illumina sequencing adapters. The ligation products were size selected by agarose gel electrophoresis, PCR-amplified, and sequenced using Illumina HiSeq2500 by Genedenovo Biotechnology Co, Ltd (Guangzhou, China). For RNA sequencing of Drosophila samples under sterile conditions, libraries were sequenced on Illumina HiSeq Xten platform.
For data processing, quality control of sequencing data was assessed with fastqc (www.bioinformatics.babraham.ac.uk/projects/fastqc/, accessed on 12 January 2021). Adaptor sequences were trimmed by cutadapt [40] with at least 30 nt remaining length, and clean reads were mapped to the dm6 reference genome using HISAT2 [41]. FeatureCounts [42] was used to count the number of reads that mapped to a gene. Gene expression level was calculated by R package DESeq2 [43]. Hierarchical clustering and principal component analysis were used to visualize the effect of different groups. Differentially expressed genes between two groups were identified by the false discovery rate corrected p-value < 0.05 and log2|fold change| > 1. In order to obtain the biological annotation of differentially expressed genes, gene ontology analysis was performed by clusterProfiler [44]. The p-value < 0.05 and q-value < 0.01 were considered a significant enrichment, and GO (Gene Ontology) terms redundancy were removed by REVIGO [45].

4.4. Metabolites Extraction, UHPLC-MS/MS and Metabolome Analysis

Drosophila samples three days after feathering were ground separately with liquid nitrogen and homogenized with 80% methanol and 0.1% formic acid precooled resuspended in the vortex well, incubated on ice for 5 min at 4 °C, and centrifuged for 20 min. The supernatant portion was diluted with LC-MS grade water to a final concentration of 53% methanol. The samples were transferred to tubes and centrifuged at 5000× g at 4 °C for 20 min. Finally, the supernatant was injected into the LC-MS/MS system for analysis. Ultra-high performance liquid chromatography-MS/MS (UHPLC-MS/MS) was performed using the Vanquish UHPLC system (ThermoFisher Scientific, Waltham, MA, USA) and Orbitrap Q ExactiveTM HF-X mass spectrometer (ThermoFisher) in Genedenovo Biotechnology Co., Ltd.
The raw data files generated by UHPLC-MS/MS were processed using the Compound Discoverer 3.1 (ThermoFisher) to perform peak alignment, peak picking, and quantitation for each metabolite. Peak intensities were normalized to the total spectral intensity. The normalized data were used to predict the molecular formula based on additive ions, molecular ion peaks, and fragment ions; then, the peaks were matched with the mzCloud (https://www.mzcloud.org/, accessed on 20 January 2021) to obtain the accurate qualitative and relative quantitative results. Statistical analyses were performed using the statistical software R, Python and CentOS.

4.5. RNA Preparation and RT-qPCR Analysis

According to the manufacturer’s instructions, Drosophila adults were homogenized in 1 mL TRIzol (Accurate Biotechnology, Hunan, China) with sterilized steel balls. The RNA samples were dissolved in an appropriate amount of DEPC water. NanoDrop 2000 spectrophotometer (ThermoFisher) was used to quantify the concentration and purity of total RNA in each sample at a wavelength of 260 nm. The HiFiScript gDNA Removal cDNA Synthesis Kit (CWBIO, Jiangsu, China) was used to synthesize cDNA. Three biological replicates were used for quantitative reverse transcription PCR analysis using MagicSYBR Mixture (CWBIO). The relative mRNA level of gene expression was measured with Rp49 as internal control by calculating the values of ΔCtGene/ΔCtRp49 and analyzed by the 2−ΔΔCt method. Primers used in this study are listed in Supplementary Table S1.

5. Conclusions

This study investigated the role of the microbiome and microbiota-derived metabolite sodium butyrate in regulating host transcriptome and metabolome. To validate our hypothesis, we established both the sterile Drosophila model and the conventional Drosophila model treated with or without sodium butyrate. Our transcriptome data and qRT-PCR validation results showed that microbiome and sodium butyrate can impact host gene expression patterns in both sterile Drosophila model and conventional Drosophila model. By 16S rRNA sequencing analysis, we showed that sodium butyrate treatment can affect bacterial structure with the dominant effect on Firmicutes and suppress Proteobacteria. Functional prediction of bacterial structure showed that the relative abundance of Gram-positive bacteria was increased and Gram-negative bacteria was decreased by sodium butyrate treatment, respectively. We also identified Drosophila metabolites by ultra-high performance liquid chromatography-MS/MS; the results showed sodium butyrate influenced the composition of host metabolites with lipids as the dominant changed components. Our integrative analysis of the transcriptome, the microbiome, and the metabolome data in this study identified candidate transcripts that are coregulated by sodium butyrate. Taken together, our work reveals the impact of microbiome and microbiota-derived sodium butyrate on host transcriptome and metabolome and provides evidence for a better understanding of host-microbiome interactions with multi-omics data.

Supplementary Materials

The following are available online at https://www.mdpi.com/article/10.3390/metabo11050298/s1, Supplementary Table S1. Primer sequences used for RT-qPCR analysis in this study. Supplementary Figure S1. Gut microbiome analysis of bacterial structure at the class, order, family, genus, species level, respectively. 16S rDNA sequencing data from conventional Drosophila (C) and sodium butyrate-treated Drosophila (SB) were used, n=3. Supplementary Figure S2. Quantitative RT-PCR validation of genes from conventional Drosophila (C) and sodium butyrate-treated Drosophila (SB). (A) Relative expression of up-regulated transcripts in the transcriptome data. (B) Relative expression of down-regulated transcripts in the transcriptome data. Significant differences are determined by the unpaired Student’s t-test. * p < 0.05, ** p < 0.01.

Author Contributions

X.W. conceived the work; F.Z. and X.L. performed the experiment; B.L., Y.L., G.L., J.H., and L.W. analyzed the data; F.Z., X.W., and B.L. wrote the paper. All authors have read and agreed to the published version of the manuscript.

Funding

This research was funded by the National Natural Science Foundation of China (32070615) and Guangdong Provincial Natural Science Foundation (2021A1515010823), and Guangdong Province Universities and Colleges Pearl River Scholar Funded Scheme to X.Y.W.

Institutional Review Board Statement

The protocol for this experiment was reviewed and approved by the Institutional Animal Care and Use Committee of South China Normal University (protocol code SCNU-SLS-2021-015).

Informed Consent Statement

Not applicable.

Data Availability Statement

The raw sequencing data analyzed in the current study have been deposited in the NCBI Gene Expression Omnibus database, available under accession number GSE169135.

Conflicts of Interest

The authors declare no conflict of interest.

References

  1. Koh, A.; De Vadder, F.; Kovatcheva-Datchary, P.; Bäckhed, F. From Dietary Fiber to Host Physiology: Short-Chain Fatty Acids as Key Bacterial Metabolites. Cell 2016, 165, 1332–1345. [Google Scholar] [CrossRef] [PubMed] [Green Version]
  2. Fraune, S.; Bosch, T.C. Why bacteria matter in animal development and evolution. Bioessays 2010, 32, 571–580. [Google Scholar] [CrossRef] [PubMed]
  3. Donohoe, D.R.; Garge, N.; Zhang, X.; Sun, W.; O’Connell, T.M.; Bunger, M.K.; Bultman, S.J. The microbiome and butyrate regulate energy metabolism and autophagy in the mammalian colon. Cell Metab. 2011, 13, 517–526. [Google Scholar] [CrossRef] [PubMed] [Green Version]
  4. Zhang, L.; Liu, C.; Jiang, Q.; Yin, Y. Butyrate in Energy Metabolism: There Is Still More to Learn. Trends Endocrinol. Metabol. 2021, 32, 159–169. [Google Scholar] [CrossRef] [PubMed]
  5. Vaiserman, A.M.; Kolyada, A.K.; Koshel, N.M.; Simonenko, A.V.; Pasyukova, E.G. Effect of histone deacetylase inhibitor sodium butyrate on viability and life span in Drosophila melanogaster. Adv. Gerontol. 2013, 3, 30–34. [Google Scholar] [CrossRef]
  6. Brahe, L.K.; Astrup, A.; Larsen, L.H. Is butyrate the link between diet, intestinal microbiota and obesity-related metabolic diseases? Obes. Rev. 2013, 14, 950–959. [Google Scholar] [CrossRef]
  7. Wang, H.; Ren, E.; Xiang, X.; Su, Y.; Zhu, W. Dynamic Changes in Serum Metabolomic Profiles of Growing Pigs Induced by Intravenous Infusion of Sodium Butyrate. Metabolites 2020, 10, 20. [Google Scholar] [CrossRef] [PubMed] [Green Version]
  8. Shin, S.C.; Kim, S.H.; You, H.; Kim, B.; Kim, A.C.; Lee, K.A.; Yoon, J.H.; Ryu, J.H.; Lee, W.J. Drosophila Microbiome Modulates Host Developmental and Metabolic Homeostasis via Insulin Signaling. Science 2011, 334, 670–674. [Google Scholar] [CrossRef] [Green Version]
  9. Sonnenburg, J.L.; Bäckhed, F. Diet-microbiota interactions as moderators of human metabolism. Nature 2016, 535, 56–64. [Google Scholar] [CrossRef]
  10. Lee, W.-J.; Brey, P.T. How Microbiomes Influence Metazoan Development:Insights from History and Drosophila Modeling of Gut-Microbe Interactions. Ann. Rev. Cell Dev. Biol. 2013, 29, 571–592. [Google Scholar] [CrossRef]
  11. Lee-Sarwar, K.A.; Lasky-Su, J.; Kelly, R.S.; Litonjua, A.A.; Weiss, S.T. Metabolome-Microbiome Crosstalk and Human Disease. Metabolites 2020, 10, 181. [Google Scholar] [CrossRef] [PubMed]
  12. Cani, P.D. Human gut microbiome: Hopes, threats and promises. Gut 2018, 67, 1716–1725. [Google Scholar] [CrossRef] [PubMed]
  13. McMullen, J.G., 2nd; Peters-Schulze, G.; Cai, J.; Patterson, A.D.; Douglas, A.E. How gut microbiome interactions affect nutritional traits of Drosophila melanogaster. J. Exp. Biol. 2020, 223, jeb227843. [Google Scholar] [CrossRef] [PubMed]
  14. Heys, C.; Lizé, A.; Blow, F.; White, L.; Darby, A.; Lewis, Z.J. The effect of gut microbiota elimination in Drosophila melanogaster: A how-to guide for host-microbiota studies. Ecol. Evol. 2018, 8, 4150–4161. [Google Scholar] [CrossRef]
  15. Douglas, A.E. The Drosophila model for microbiome research. Lab. Anim. (NY) 2018, 47, 157–164. [Google Scholar] [CrossRef]
  16. Erkosar, B.; Leulier, F. Transient adult microbiota, gut homeostasis and longevity: Novel insights from the Drosophila model. FEBS Lett. 2014, 588, 4250–4257. [Google Scholar] [CrossRef] [Green Version]
  17. Broderick, N.A.; Buchon, N.; Lemaitre, B.; McFall-Ngai, M.J. Microbiota-Induced Changes in Drosophila melanogaster Host Gene Expression and Gut Morphology. mBio 2014, 5, e01117-14. [Google Scholar] [CrossRef] [Green Version]
  18. Yang, G.; Chen, S.; Deng, B.; Tan, C.; Deng, J.; Zhu, G.; Yin, Y.; Ren, W. Implication of G Protein-Coupled Receptor 43 in Intestinal Inflammation: A Mini-Review. Front. Immunol. 2018, 9, 1434. [Google Scholar] [CrossRef]
  19. Miyamoto, J.; Hasegawa, S.; Kasubuchi, M.; Ichimura, A.; Nakajima, A.; Kimura, I. Nutritional Signaling via Free Fatty Acid Receptors. Int. J. Mol. Sci. 2016, 17, 450. [Google Scholar] [CrossRef]
  20. Flint, H.J.; Scott, K.P.; Louis, P.; Duncan, S.H. The role of the gut microbiota in nutrition and health. Nat. Rev. Gastroenterol. Hepatol. 2012, 9, 577–589. [Google Scholar] [CrossRef]
  21. Wu, S.E.; Hashimoto-Hill, S.; Woo, V.; Eshleman, E.M.; Whitt, J.; Engleman, L.; Karns, R.; Denson, L.A.; Haslam, D.B.; Alenghat, T. Microbiota-derived metabolite promotes HDAC3 activity in the gut. Nature 2020, 586, 108–112. [Google Scholar] [CrossRef]
  22. Reolon, G.K.; Maurmann, N.; Werenicz, A.; Garcia, V.A.; Schröder, N.; Wood, M.A.; Roesler, R. Posttraining systemic administration of the histone deacetylase inhibitor sodium butyrate ameliorates aging-related memory decline in rats. Behav. Brain Res. 2011, 221, 329–332. [Google Scholar] [CrossRef] [Green Version]
  23. Liu, H.; Wang, J.; He, T.; Becker, S.; Zhang, G.; Li, D.; Ma, X. Butyrate: A Double-Edged Sword for Health? Adv. Nutr. 2018, 9, 21–29. [Google Scholar] [CrossRef] [PubMed] [Green Version]
  24. Louis, P.; Flint, H.J. Diversity, metabolism and microbial ecology of butyrate-producing bacteria from the human large intestine. FEMS Microbiol. Lett. 2009, 294, 1–8. [Google Scholar] [CrossRef] [PubMed] [Green Version]
  25. Zhou, J.; Gao, S.; Chen, J.; Zhao, R.; Yang, X. Maternal sodium butyrate supplement elevates the lipolysis in adipose tissue and leads to lipid accumulation in offspring liver of weaning-age rats. Lipids Health Dis. 2016, 15, 119. [Google Scholar] [CrossRef] [PubMed] [Green Version]
  26. Yu, C.; Liu, S.; Chen, L.; Shen, J.; Niu, Y.; Wang, T.; Zhang, W.; Fu, L. Effect of exercise and butyrate supplementation on microbiota composition and lipid metabolism. J. Endocrinol. 2019, 243, 125–135. [Google Scholar] [CrossRef] [PubMed]
  27. Douglas, A.E. Simple animal models for microbiome research. Nat. Rev. Microbiol. 2019, 17, 764–775. [Google Scholar] [CrossRef] [Green Version]
  28. Broderick, N.A.; Lemaitre, B. Gut-associated microbes of Drosophila melanogaster. Gut Microbes. 2012, 3, 307–321. [Google Scholar] [CrossRef] [Green Version]
  29. Koyle, M.L.; Veloz, A.M.; Judd, A.M.; Wong, A.C.N.; Newell, P.D.; Douglas, A.E.; Chaston, J.M. Rearing the Fruit Fly Drosophila melanogaster Under Axenic and Gnotobiotic Conditions. JoVE 2016. [Google Scholar] [CrossRef]
  30. Lemaitre, B.; Hoffmann, J. The host defense of Drosophila melanogaster. Annu. Rev. Immunol. 2007, 25, 697–743. [Google Scholar] [CrossRef] [Green Version]
  31. Dobson, A.J.; Chaston, J.M.; Newell, P.D.; Donahue, L.; Hermann, S.L.; Sannino, D.R.; Westmiller, S.; Wong, A.C.N.; Clark, A.G.; Lazzaro, B.P.; et al. Host genetic determinants of microbiota-dependent nutrition revealed by genome-wide analysis of Drosophila melanogaster. Nat. Commun. 2015, 6, 6312. [Google Scholar] [CrossRef] [Green Version]
  32. Bergman, P.; Seyedoleslami Esfahani, S.; Engström, Y. Drosophila as a Model for Human Diseases-Focus on Innate Immunity in Barrier Epithelia. Curr. Top. Dev. Biol. 2017, 121, 29–81. [Google Scholar]
  33. Wong, A.C.; Dobson, A.J.; Douglas, A.E. Gut microbiota dictates the metabolic response of Drosophila to diet. J. Exp. Biol. 2014, 217, 1894–1901. [Google Scholar] [CrossRef] [Green Version]
  34. Walters, A.W.; Hughes, R.C.; Call, T.B.; Walker, C.J.; Wilcox, H.; Petersen, S.C.; Rudman, S.M.; Newell, P.D.; Douglas, A.E.; Schmidt, P.S.; et al. The microbiota influences the Drosophila melanogaster life history strategy. Mol. Ecol. 2020, 29, 639–653. [Google Scholar] [CrossRef]
  35. Magoč, T.; Salzberg, S.L. FLASH: Fast length adjustment of short reads to improve genome assemblies. Bioinformatics 2011, 27, 2957–2963. [Google Scholar] [CrossRef]
  36. Edgar, R.C. UPARSE: Highly accurate OTU sequences from microbial amplicon reads. Nat. Methods 2013, 10, 996–998. [Google Scholar] [CrossRef] [PubMed]
  37. Wang, Q.; Garrity, G.M.; Tiedje, J.M.; Cole, J.R. Naive Bayesian classifier for rapid assignment of rRNA sequences into the new bacterial taxonomy. Appl. Environ. Microbiol. 2007, 73, 5261–5267. [Google Scholar] [CrossRef] [Green Version]
  38. Langille, M.G.; Zaneveld, J.; Caporaso, J.G.; McDonald, D.; Knights, D.; Reyes, J.A.; Clemente, J.C.; Burkepile, D.E.; Vega Thurber, R.L.; Knight, R.; et al. Predictive functional profiling of microbial communities using 16S rRNA marker gene sequences. Nat. Biotechnol. 2013, 31, 814–821. [Google Scholar] [CrossRef]
  39. Aßhauer, K.P.; Wemheuer, B.; Daniel, R.; Meinicke, P. Tax4Fun: Predicting functional profiles from metagenomic 16S rRNA data. Bioinformatics 2015, 31, 2882–2884. [Google Scholar] [CrossRef] [PubMed]
  40. Martin, M. CUTADAPT removes adapter sequences from high-throughput sequencing reads. EMBnet. J. 2011, 17, 10–12. [Google Scholar] [CrossRef]
  41. Kim, D.; Langmead, B.; Salzberg, S.L. HISAT: A fast spliced aligner with low memory requirements. Nat. Methods 2015, 12, 357–360. [Google Scholar] [CrossRef] [Green Version]
  42. Liao, Y.; Smyth, G.K.; Shi, W. featureCounts: An efficient general purpose program for assigning sequence reads to genomic features. Bioinformatics 2014, 30, 923–930. [Google Scholar] [CrossRef] [Green Version]
  43. Love, M.I.; Huber, W.; Anders, S. Moderated estimation of fold change and dispersion for RNA-seq data with DESeq2. Genome Biol. 2014, 15, 550. [Google Scholar] [CrossRef] [PubMed] [Green Version]
  44. Yu, G.; Wang, L.G.; Han, Y.; He, Q.Y. clusterProfiler: An R package for comparing biological themes among gene clusters. Omics 2012, 16, 284–287. [Google Scholar] [CrossRef] [PubMed]
  45. Supek, F.; Bošnjak, M.; Škunca, N.; Šmuc, T. REVIGO summarizes and visualizes long lists of gene ontology terms. PLoS ONE 2011, 6, e21800. [Google Scholar] [CrossRef] [PubMed] [Green Version]
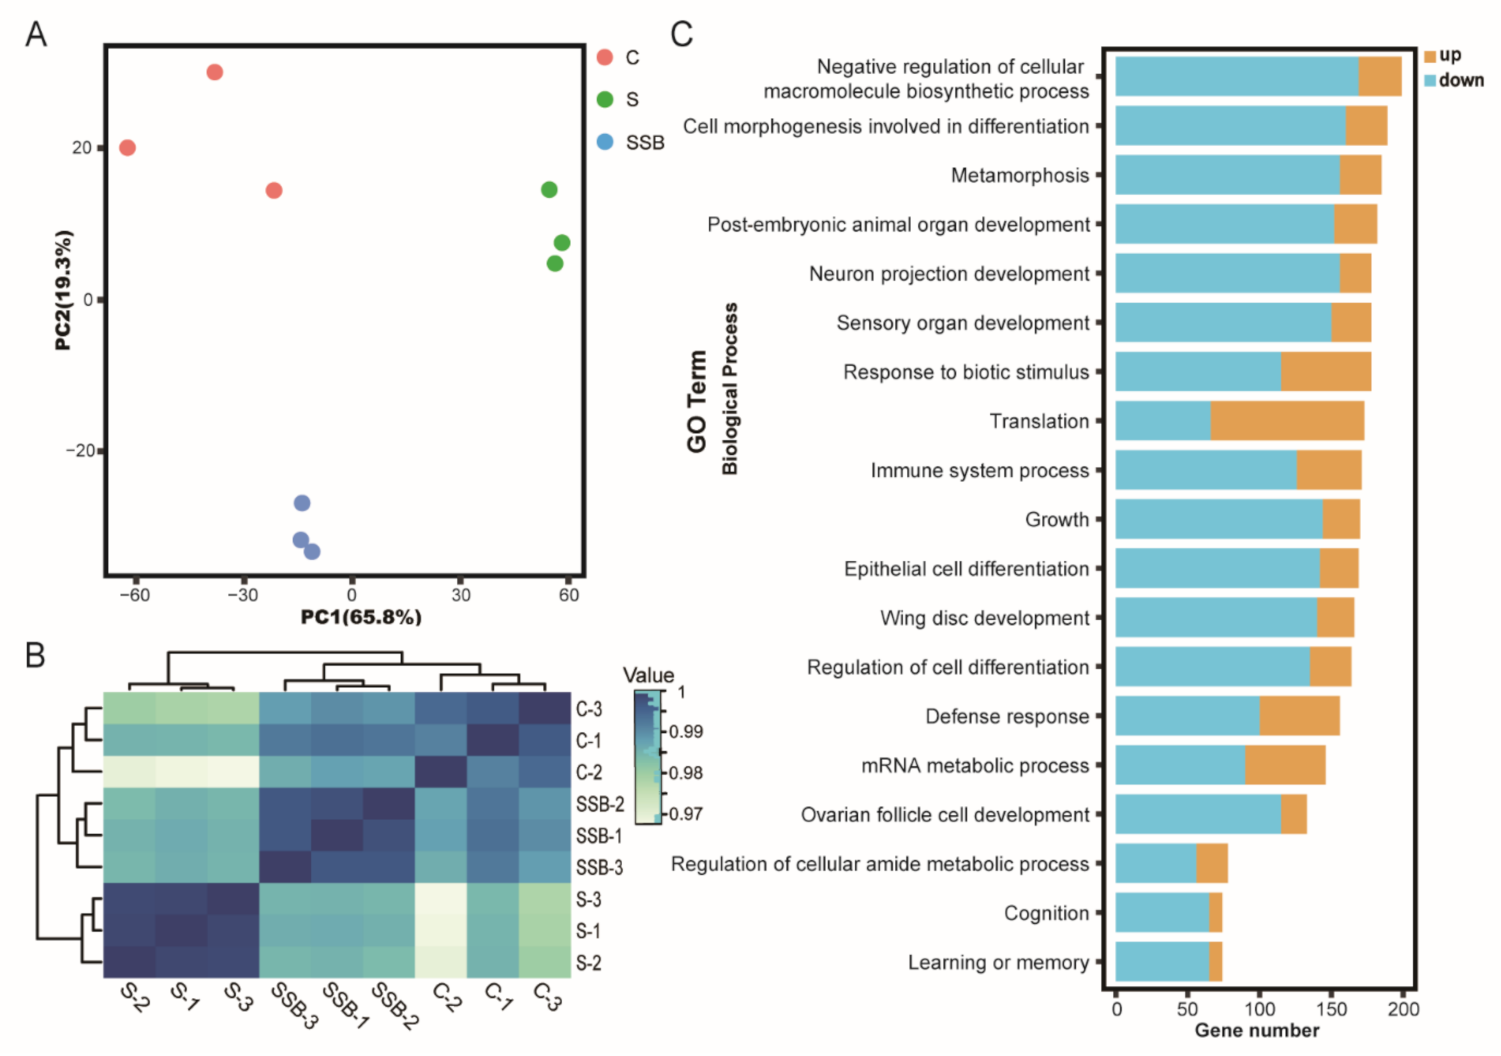
Figure 1. RNA sequencing analysis of conventional Drosophila (C), sterile Drosophila (S) and sterile Drosophila treated with sodium butyrate (SSB). (A) Principal component analysis of RNA sequencing data from three groups, n = 3. (B) Pearson correlation heat map of RNA sequencing data from three groups, white to blue, indicates an increase in correlation. (C) Gene ontology enrichment of RNA sequencing data from sterile Drosophila compared to sterile Drosophila treated with sodium butyrate. The x-axis represents gene numbers upregulated or downregulated, and the y-axis represents different pathways in biological process.
Metabolites 11 00298 g001
Figure 2. Quantitative RT-PCR validation of genes from sterile Drosophila (S) and sterile Drosophila treated with sodium butyrate (SSB). (A) Relative expression of downregulated transcripts (SSB compared to S) in the transcriptome data. (B) Relative expression of upregulated transcripts (SSB compared to S) in the transcriptome data. Significant differences are determined by the unpaired Student’s t-test. * p < 0.05, ** p < 0.01.
Metabolites 11 00298 g002
Figure 3. Gut microbiome analysis of 16S rDNA sequencing data from conventional Drosophila (C) and sodium butyrate-treated Drosophila (SB). (A) Principal component analysis of samples from two groups, n = 3. (B) Microbiome analysis shown at phylum level. (C) Organism level microbiome phenotypes predicted with Bugbase. (D) Functional prediction heat map with PICRUSt.
Metabolites 11 00298 g003
Figure 4. RNA sequencing analysis of conventional Drosophila (C) and sodium butyrate-treated Drosophila (SB). (A) Principal component analysis of samples from two groups, n = 2. (B) Volcano plot showing transcriptional regulation of genes. (C) Gene ontology enrichment of RNA sequencing data from conventional Drosophila compared to sodium butyrate-treated Drosophila. The x-axis represents gene numbers upregulated or downregulated, and the y-axis represents different pathways in the biological process.
Metabolites 11 00298 g004
Figure 5. Quantitative RT-PCR validation of genes from conventional Drosophila (C) and sodium butyrate-treated Drosophila (SB). (A) Relative expression of transcripts encoding metabolic enzymes in qRT-PCR experiments. (B) Relative expression of transcripts encoding lysozyme family proteins in qRT-PCR experiments. Significant differences are determined by the unpaired Student’s t-test. * p < 0.05, ** p < 0.01, *** p < 0.001.
Metabolites 11 00298 g005
Figure 6. Non-target analysis of metabolites from conventional Drosophila (C) and sodium butyrate-treated Drosophila (SB). (A) Orthogonal partial least squares discriminant analysis of two groups samples, n = 5. (B) Pie chart showing the proportion of different metabolites components. (C) Heat map analysis of metabolites from two groups in both positive and negative electrospray ionization modes. Blue to red indicates an increase in metabolite abundance.
Metabolites 11 00298 g006
Figure 7. Integrative analysis of the transcriptome, the microbiome, and the metabolome data from conventional Drosophila (C) and sodium butyrate-treated Drosophila (SB). (A) Correlation analysis between the transcriptome and the microbiome data in upregulated and downregulated manner, respectively. (B) Correlation analysis between the transcriptome and the metabolome data in an upregulated and downregulated manner, respectively. Upregulated and downregulated transcripts were selected to analyze the correlation with the microbiome and the metabolome data. The correlation analysis was performed using igraph (version 1.1.1) in R package and networks with significant correlations were drawn using Cytoscape software. Red indicates the transcripts with log2(fold change) < 0, and blue indicates the transcripts with log2(fold change) > 0, an increase of color indicated the extend of fold change. The solid line and dashed line indicated positive correlation and negative correlation, respectively.
Metabolites 11 00298 g007
Publisher’s Note: MDPI stays neutral with regard to jurisdictional claims in published maps and institutional affiliations.