1. Introduction
Metabolomics can provide valuable insights into the biochemical processes underlying the developmental responses of plants [
1]; however, to date metabolomics research has largely focused on the responses of individual plants [
2]. Applied to populations of plants, the emphasis has been on the development of markers to assist in molecular breeding [
2]; understanding major issues in agronomy such as drought acclimation, and responses to salinity [
3,
4]; or the biochemistry underlying the quality and postharvest behaviour of important plant products such as fruits [
5]. There has been less emphasis on using metabolomics to understand the responses of field-grown perennial or woody plants to in-field manipulations aimed at improving plant health, productivity or responses to environmental stressors.
The translation of plant metabolomics research from model species grown under controlled environment conditions to field, orchard or forest plant production systems faces a number of challenges, both analytical [
6] and arising from the uncontrolled field environment and the real-time diurnal and seasonal growth cycles of perennial, annual and woody plants. Experimental designs for the metabolomics of forest trees [
7] including birch (
Betula pendula Roth) [
8], poplar (
Populus balsamifera) [
9], pine (
Pinus radiata and
P. pinaster) [
10,
11] and for the comparison of the foliar metabolomes of tropical trees [
12] have been described. In contrast, orchards and vineyards offer more intensively managed environments and commonly feature regular repeated arrangements of clonal plants groomed and trained onto permanent trellis or pergola structures and specifically orientated with respect to the sun and the local topography. Each orchard, vineyard (or equivalent) is, however, located in a specific environment and plant performance is dependent on a site-specific history of cultivation, fertilization, and management. Within the fabric of the orchard itself, individual plants, leaves, stems, and branches experience different environments, resulting in opportunities for differing metabolic responses, and experimental and analytical challenges [
6] of obtaining representative metabolomics data. Orchards and field-based plant production systems are also real time, and often high-value, food production systems, which may limit the opportunities for experimental manipulation and the collection of samples.
The importance of appropriate sample collection, processing and analysis protocols when working with new, variable or multiple tissue types has been repeatedly emphasized [
6,
7,
13]. A number of sampling strategies have been reported for obtaining representative samples of grapes from vineyards for metabolite analyses. In an analysis of the effect of vine vigour on skin procyanidin composition of
Vitis vinifera L. Pinot noir growing in a commercial vineyard of the same clone, rootstock, age and management practices, triplicate samples consisting of 150 berries each were used [
14]. Within-vineyard variability of the pepper flavouring sesquiterpene rotundone was shown to relate to the land underlying the vineyard [
15] using 100-g subsamples obtained from three bunches. In an experiment set up to favour genetic determinism, LC-MS based metabolomics differentiated eight
V. vinifera grape varieties based on stem polyphenolics, with metabolic distance between cultivars related to genetic distance based on microsatellite DNA markers [
16]. To overcome intra-plot variability, a randomized draw was used constitute each of the five pseudo-biological replicates analyzed. In a metabolomic investigation of
terroir using a single clone of Corvina in seven vineyards over three years [
17], 30 grape clusters were randomly collected along two vine rows, three berries were selected from each cluster, and subsamples used to make a ten-berry pool for chemical analysis. While successful in enabling differentiation of experimental treatments, the rationales for the above sampling regimes are not explicit. To enable metabolomics analysis in such situations, obvious responses are to increase environmental control or effect size differences through experimental manipulation; to increase the sampling rate; or to invoke ‘big data’ and the use of more sophisticated data analysis methods. An alternative approach is to seek to a better understanding of the sources of metabolic variability, resulting in more effective experimental design and sample collection strategies.
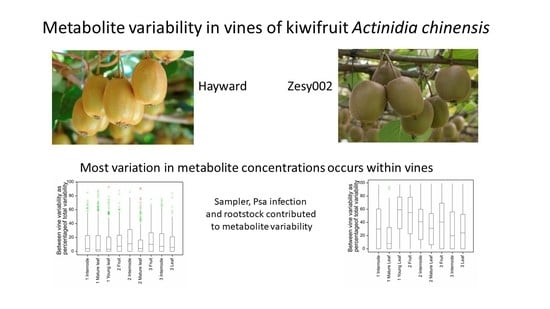
Kiwifruit, cultivars of
Actinidia chinensis (Planch)
and A. arguta (Planch), are vigorous dioecious perennial vines, originally from eastern Asia, and now cultivated worldwide for their edible fruit [
18]. Commonly grown New Zealand cultivars include the green-fleshed cultivar
A. chinensis var.
deliciosa ‘Hayward’ and the yellow-fleshed cultivar
A.
chinensis var.
chinensis ‘Zesy002’. Kiwifruit are commonly grown as clonal material grafted onto clonal or seedling rootstocks and trained onto horizontal pergola structures. Vines are managed intensively to balance fruit yield and quality [
19], vegetative growth [
20] and year-on-year productivity [
21,
22]. Typical on-orchard management practices include reduction of excessive vegetative growth, thinning of leaves (Thorp 2003) and girdling of the trunk, or root pruning, to temporarily cut the phloem and redirect the flow of photosynthate from the leaves to the fruit rather than to the roots [
23,
24]. Kiwifruit vines are also susceptible to bacterial canker arising from infection with the pathogenic bacterium
Pseudomonas syringae pv.
actinidiae (Psa) [
25]. Infections can be managed though on-orchard cultural practices [
26], biocontrol agents such as endophytic bacteria [
27], or by the use of synthetic elicitors such as Actigard
™ (acibenzolar-S-methyl, ASM), which enhance natural resistance pathways and modulate the metabolism of the vines [
28].
Understanding how these chemical and physiological tools affect the metabolism and performance of kiwifruit vines requires the development of new experimental protocols and a better understanding of the sources of metabolic variability (within plant and within orchard), the dynamics of metabolite responses (appropriate sampling times and tissues), and of the key metabolites involved. Surprisingly, between-vine variation accounted for only a minor part of the total variability in fruit dry weight, soluble solids and firmness for ‘Hayward’ fruit harvested from two different pergola systems, describing only 0% or 2.2%, 13.8% or 19.0% and 7.1% or 15.5% of the total variance respectively [
29]. Variability within ‘zones’ of the vine canopy itself made significant contributions to the total variance for these parameters [
30]. Information on the extent and sources of variability of individual plant metabolites is not readily available from the kiwifruit metabolomics literature [
31,
32,
33,
34,
35,
36,
37].
In this paper we describe the metabolomics analysis of mature and immature leaf, fruit, and internode shoot samples collected from multiple canes on multiple ‘Hayward’ and ‘Zesy002’ kiwifruit vines at three physiologically significant time points throughout the growing season. We identify sources of metabolic variability including the contribution of between-vine variation, sampler, Psa infection and rootstock effects, and discuss the implications for the design of metabolomics experiments to better understand changes in plant metabolism in response to orchard manipulations to improve plant performance.
3. Discussion
While metabolomics can routinely measure the relative concentrations of hundreds of metabolites in biological samples, there has been limited progress in applying this technology to understanding the metabolic responses of complex biological systems such as perennial plants growing in fields or orchards. While control of environmental variability and better analytical technology may reduce metabolic variability, there are also practical limitations on the availability of materials and the number of samples that can be subjected to chemical analysis. An additional strategy is to seek to a better understanding of the sources of metabolic variability, resulting in better experimental design, more effective data collection and greater chances of observing meaningful metabolic changes.
From the metabolic variability measured in this study, we can propose some practical considerations to guide experimental design and the collection of field samples. The variability of metabolite concentrations (CV) defines how many samples are needed in order to reasonably expect to see significant differences between experimental treatments, if such exist. Power calculations conservatively estimate 20 samples per treatment are required to meaningfully measure a 1.2-fold change in metabolite concentrations with a CV of 20%. If we anticipate measuring only higher (1.5-fold) fold changes in metabolite concentrations, then smaller sample numbers are sufficient. These sample numbers, coupled with the need to consider diurnal and daily differences in metabolite concentrations, limit the time available for sample collection and the number of experimental treatments that can readily be sampled in one day from a field experiment.
The balance of between- (inter) and within- (intra) vine variability determines the best balance between the number of vines to sample and the number of replicate samples to be taken within any vine. For example, for metabolites with high within-vine variability there is little advantage or necessity for sampling from additional vines. Our analysis indicates that, generally, there is more variability in metabolite concentrations occurring within individual than between different vines. However, between-vine variability of metabolites was not zero, and differed between cultivars and tissues, and along with Psa, rootstock, sampler and time of collection, will contribute to the total sample variability. The relative importance of between- and within-vine metabolite variability may require (or permit) different sampling strategies in particular for ‘Hayward’ (inter-vine variability c. 10%) where there is little advantage, overall, in sampling from more than one vine. Sampling from only one vine, however, provides no reassurance to the researcher that that vine is representative, or insurance against random events such as vine death due to Psa infection. At a practical level, the number of samples that can be collected from one vine (for example, a sufficient number of newly expanded first leaves) may necessitate sampling from multiple vines especially if repeated sampling of the same vine is anticipated. The number of different samplers required to collect samples and whether sampling be completed in a reasonable time, without confounding effects due to diurnal fluctuations in metabolite concentrations, also needs to be considered. This suggests despite the low inter-vine variability, the best sampling strategy to fairly represent metabolite variability remains to sample from as many vines as possible but more importantly to sample within the available vines aiming primarily for sufficient biological replicates.
The increasing incidence of Psa infection and the belated discovery that the ‘Zesy002’ vines were grafted onto two different rootstock types are examples of the constraints imposed when working in real-world environments and of the requirement for robust experimental design, ideally oversampling in data collection and flexibility in data analysis. In the event, these events enabled us to test the sensitivity of our analytical methods and demonstrated additional factors affecting metabolite variability. Specific effects on individual metabolites are not easily distinguishable from statistical noise in metabolomics experiments and while statistical analysis provides evidence that most often Psa, sampler and rootstock effects were not statistically significant, they may still contribute to overall metabolite variability. Such effects might be more sensitively probed at the biochemical pathway level, using metabolite identification to look for coordinated responses in individual pathways.
A limitation for practical application of this study was the relatively low proportion of metabolites (c. 20%) for which confident or tentative identifications based on accurate mass and MS/MS analysis of isomeric compounds can be made [
42]. Actinidia is a relatively unstudied genus, and while the nutrient composition of the fruit of commercial cultivars is well known [
43], Actinidia species contain multiple other metabolites including polyphenols and their glycosides, polyhydroxylated triterpenes, carotenoids [
44,
45], procyanidins [
46] and novel norterpenoids [
47] and nitrogen-containing flavanols [
48]. A more comprehensive identification of metabolites will be required [
49] to understand the pathway-level responses of these plants to developmental and environmental changes, and this is a priority for future research [
50].
In conclusion, metabolites in multiple kiwifruit tissue samples were measured by untargeted and targeted LC-MS metabolomics with sufficient instrumental precision to measure the relative contributions of within- and between-vine variances to metabolite variability, and to demonstrate metabolic effects due to Psa infection, the sampler and the rootstock. In general, there was more variation in metabolite concentrations within vines than between vines. High within-vine metabolic variability indicates the important of obtaining sufficient replicate samples rather than sampling from multiple vines. These results provide the basis for future research to understand the effects of elicitors and other protectant chemicals, of rootstocks, and of other on-orchard practices, on kiwifruit vine metabolism and performance.
4. Materials and Methods
Actinidia chinensis Planch. var. deliciosa ‘Hayward’ and A. chinensis Planch. var. chinensis ‘Zesy002’ kiwifruit vines were sampled during the 2016/17 and 2017/18 growing seasons respectively from plants growing at the Plant and Food Research, Ruakura Research Orchard, Hamilton, New Zealand. The orchard is located at 37°46′20.5″ S 175°18′52.7″ E, with opposing male vines for pollination and rows running approximately north-south on a north facing slope. Canes (5–20 mm thick at the base and which had held fruit the previous year) were tagged and each paired with a cane from the opposite side of the vine, resulting in one to three paired canes per vine. Samples were collected from shoots on each of two paired canes as: young leaves, five young leaves just unfurled with mid rib removed; mature leaves, youngest mature leaf associated with a flower or fruit; internode tissue, the shoot internode above and below the youngest mature leaf (excluding the leaf node tissue); and fruit, one fruit per cane. At Harvest 3, a 1/8th longitudinal slice was collected from each fruit.
For the 2016/17 (southern hemisphere) season, triplicate samples of mature and young leaves, developing fruit, and shoot internodes were collected once from multiple canes from each of 10 ‘Hayward’ vines grafted onto ‘Bruno’ rootstock (
Table 6). These samples were collected at king flower calyx split (14 November, Harvest 1, H1), during rapid fruit growth (20 December, Harvest 2, H2) and during peak starch accumulation (20 February, Harvest 3, H3). In 2017–2018, samples were collected from four ‘Zesy002’ vines grafted onto ‘Bruno’ rootstock (row 14) and from ten ‘Zesy002’ vines stump-grafted to ‘Bruno’ rootstock with a ‘Hort16A’ (A. chinensis var. chinensis) inter-scion (rows 17 and 18) [
40]. Triplicate samples of mature and young leaves, developing fruit, and shoot internodes were collected once from multiple canes at king flower calyx split (6 November, H1), during rapid fruit growth (15 December, H2) and during peak starch accumulation (15 February, H3). Observations of any Psa symptoms such as spotting on leaves, the person collecting the samples (the sampler) and, for ‘Zesy002’ vines, the rootstock type of individual vines were recorded.
Samples were immediately frozen in liquid nitrogen, combined with the paired sample from the same vine, and stored at −80 °C. All sample types except fruit were freeze-dried before grinding and extraction. Fruit samples were ground while frozen with liquid nitrogen. Dry matter, starch content, and a range of phytohormones and soluble carbohydrates were also measured [
51,
52]. All samples were collected between 1030 and 1300 h on a single day. Our objective was to collect a minimum of three replicate samples from each of six vines. In the event, more ‘Hayward’ vines were available, but not all vines had sufficient canes necessary to permit the collection of three samples per vine. The numbers of ‘Zesy002′ samples available were reduced owing to losses of vines from Psa infection, and sample numbers were maintained by collecting paired samples from additional vines.
4.1. Non-Targeted LC-MS Analysis
Samples (100 mg DW or 500 mg FW) were extracted in 80% methanol (2.5 mL) or methanol (2 mL) respectively and diluted with methanol (5 fold) before analysis. At least one pair of biological replicate samples was included for each tissue harvested. Composite QC samples were measured interspersed after every tenth randomized analytical sample. The LC-MS system comprised a Dionex Ultimate® 3000 Rapid Separation LC and a micrOTOF QII high resolution mass spectrometer (Bruker Daltonics, Bremen, Germany). The LC column was either a Hypersil GOLD C18 100 × 2.1 mm, 1.9 µm (Thermo Scientific, for ‘Hayward’) or a Luna Omega C18 100 × 2.1 mm, 1.6 µm (Phenomenex, for ‘Zesy002’) maintained at 40 °C, flow 400 µL/min. Solvents were A 0.2% formic acid and B 100% acetonitrile with a gradient of 90% A 0–0.5 min; linear gradient to 60% A, 0.5–7 min; linear gradient to 5% A, 7–12 min; held at 5% A, 12–15 min; linear gradient to 90% A, 15–15.2 min to return to the initial conditions before another sample injection at 18 min. The injection volume was 1 μL. Negative ion electrospray mass spectral scans were acquired at 5 scans/s with a capillary voltage of +3500 V: temperature 225 °C; drying N2 flow 6 L/min; nebulizer N2 1.5 bar, endplate offset –500 V, mass range 100–1500 Da.
Instrument data files were processed using QuantAnalysis and MetaboScape 4.0 (Bruker Daltonics, Bremen, Germany) using standard software settings with de-replication of pseudomolecular and dimer ions, and water and formic acid adducts. The frequency of background ions was estimated from blank injections. Fourteen weak background ions were detected (Amax < 11,000 counts) compared with 295 metabolites retained in properly injected samples after data processing. Background ions were not removed from the dataset. Retention time stability was assessed by visual inspection of the overlaid chromatograms of the composite QC samples and was sufficient to allow alignment of all data by the MetaboScape software. Principal components analysis (PCA) showed close clustering of QC samples, with plant samples clustering by tissue type and no indication of run effects.
Analytical data were exported to Microsoft® Excel before statistical analysis. For each sample type, all metabolites with a detection rate of <80% were removed. Four datasets (‘Zesy002’ H3 leaf, internode and fruit, and ‘Hayward’ H3 Leaf) contained over 1000 putative metabolites and this number was reduced by excluding weaker metabolic signals (Amax < 800 counts for the ‘Hayward’ H3 Leaf QC samples, <1750 area counts for ‘Zesy002’ leaf samples). The remaining MS signals are referred to as ‘metabolites’ for the purpose of this study. Single analyses resulting from injection failure or loss of vines due to Psa infection were removed. Data were normalized to sample dry weight (or fresh weight for fruit) and summary statistics were calculated of the numbers and percentages of missed metabolites, the mean, median and distributions of CV values, and numbers and percentage of metabolites with CV values below arbitrary thresholds.
Linear mixed effects models (REML procedure, Genstat version 19, VSNi Ltd., Hemel Hempstead, UK) were used to calculate the within-vine and between-vine components of variance for each metabolite for each tissue at each sampling time, and what proportion of the total variability was due to between-vine (inter-vine) variation. The effects of the sampler, whether the vine had Psa symptoms or not, and (for ‘Zesy002’) the effect of different rootstocks, were tested by fitting these parameters in the mixed effect models and testing whether removing these parameters made the model significantly worse. The mixed models analyzed individual metabolites. To look at whether inter-vine differences, Psa symptoms, sampler and (for ‘Zesy002’) rootstock influenced the pattern of metabolites, a multivariate ANOVA-like technique (Adonis, from the R package vegan) was used. For Adonis, data were log transformed, and Euclidean distance used.
Author Contributions
D.R., H.B. and D.H. designed the research; S.C., K.H., D.J., T.P., T.T. and T.M. conducted the research; D.R., H.B., J.C., T.M. and D.H. analyzed the data, performed the statistical analysis and contributed to the manuscript; D.R. managed the project, drafted and prepared the manuscript. All authors have read and agreed to the published version of the manuscript.
Funding
This research received no external funding.
Institutional Review Board Statement
Not applicable.
Informed Consent Statement
Not applicable.
Data Availability Statement
Acknowledgments
The authors thank Darienne Voyle, Rachelle Anderson, and Hannah Jonson for technical support and Farhana Pinu and Heike Schwendel for helpful review of this manuscript.
Conflicts of Interest
The authors declare no conflict of interest.
References
- Schauer, N.; Fernie, A.R. Plant metabolomics: Towards biological function and mechanism. Trends Plant Sci. 2006, 11, 508–516. [Google Scholar] [CrossRef]
- Alseekh, S.; Bermudez, L.; de Haro, L.A.; Fernie, A.R.; Carrari, F. Crop metabolomics: From diagnostics to assisted breeding. Metabolomics 2018, 14, 148. [Google Scholar] [CrossRef] [Green Version]
- Sanchez, D.H.; Pieckenstain, F.L.; Szymanski, J.; Erban, A.; Bromke, M.; Hannah, M.A.; Kraemer, U.; Kopka, J.; Udvardi, M.K. Comparative Functional Genomics of Salt Stress in Related Model and Cultivated Plants Identifies and Overcomes Limitations to Translational Genomics. PLoS ONE 2011, 6, e17094. [Google Scholar] [CrossRef]
- Sanchez, D.H.; Schwabe, F.; Erban, A.; Udvardi, M.K.; Kopka, J. Comparative metabolomics of drought acclimation in model and forage legumes. Plant Cell Environ. 2012, 35, 136–149. [Google Scholar] [CrossRef]
- Rudell, D.R.; Mattheis, J.P.; Hertog, M.L.A.T.M. Metabolomic Change Precedes Apple Superficial Scald Symptoms. J. Agric. Food Chem. 2009, 57, 8459–8466. [Google Scholar] [CrossRef]
- Tohge, T.; Mettler, T.; Arrivault, S.; Carroll, A.; Stitt, M.; Fernie, A. From Models to Crop Species: Caveats and Solutions for Translational Metabolomics. Front. Plant Sci. 2011, 2, 61. [Google Scholar] [CrossRef] [Green Version]
- Rodrigues, A.M.; Ribeiro-Barros, A.I.; António, C. Experimental Design and Sample Preparation in Forest Tree Metabolomics. Metabolites 2019, 9, 285. [Google Scholar] [CrossRef] [Green Version]
- Ossipov, V.; Ossipova, S.; Bykov, V.; Oksanen, E.; Koricheva, J.; Haukioja, E. Application of metabolomics to genotype and phenotype discrimination of birch trees grown in a long-term open-field experiment. Metabolomics 2008, 4, 39–51. [Google Scholar] [CrossRef]
- Hamanishi, E.T.; Barchet, G.L.H.; Dauwe, R.; Mansfield, S.D.; Campbell, M.M. Poplar trees reconfigure the transcriptome and metabolome in response to drought in a genotype-and time-of-day-dependent manner. BMC Genom. 2015, 16, 329. [Google Scholar] [CrossRef] [Green Version]
- Pascual, J.; Cañal, M.J.; Escandón, M.; Meijón, M.; Weckwerth, W.; Valledor, L. Integrated Physiological, Proteomic, and Metabolomic Analysis of Ultra Violet (UV) Stress Responses and Adaptation Mechanisms in Pinus radiata. Mol. Cell. Proteom. 2017, 16, 485. [Google Scholar] [CrossRef] [Green Version]
- Fernández de Simón, B.; Sanz, M.; Sánchez-Gómez, D.; Cadahía, E.; Aranda, I. Rising [CO2] effect on leaf drought-induced metabolome in Pinus pinaster Aiton: Ontogenetic-and genotypic-specific response exhibit different metabolic strategies. Plant Physiol. Biochem. 2020, 149, 201–216. [Google Scholar] [CrossRef] [PubMed]
- Sedio, B.E.; Durant Archibold, A.; Rojas Echeverri, J.C.; Debyser, C.; Boya, P.C.A.; Wright, S.J. A comparison of inducible, ontogenetic, and interspecific sources of variation in the foliar metabolome in tropical trees. PeerJ 2019, 7, e7536. [Google Scholar] [CrossRef] [PubMed] [Green Version]
- t’Kindt, R.; Morreel, K.; Deforce, D.; Boerjan, W.; Van Bocxlaer, J. Joint GC–MS and LC–MS platforms for comprehensive plant metabolomics: Repeatability and sample pre-treatment. J. Chromatogr. B 2009, 877, 3572–3580. [Google Scholar] [CrossRef]
- Cortell, J.M.; Halbleib, M.; Gallagher, A.V.; Righetti, T.L.; Kennedy, J.A. Influence of Vine Vigor on Grape (Vitis vinifera L. Cv. Pinot Noir) and Wine Proanthocyanidins. J. Agric. Food Chem. 2005, 53, 5798–5808. [Google Scholar] [CrossRef]
- Scarlett, N.J.; Bramley, R.G.V.; Siebert, T.E. Within-vineyard variation in the ‘pepper’ compound rotundone is spatially structured and related to variation in the land underlying the vineyard. Aust. J. Grape Wine Res. 2014, 20, 214–222. [Google Scholar] [CrossRef]
- Billet, K.; Houillé, B.; Dugé de Bernonville, T.; Besseau, S.; Oudin, A.; Courdavault, V.; Delanoue, G.; Guérin, L.; Clastre, M.; Giglioli-Guivarc’h, N.; et al. Field-Based Metabolomics of Vitis vinifera L. Stems Provides New Insights for Genotype Discrimination and Polyphenol Metabolism Structuring. Front. Plant Sci. 2018, 9, 798. [Google Scholar] [CrossRef]
- Anesi, A.; Stocchero, M.; Dal Santo, S.; Commisso, M.; Zenoni, S.; Ceoldo, S.; Tornielli, G.B.; Siebert, T.E.; Herderich, M.; Pezzotti, M.; et al. Towards a scientific interpretation of the terroir concept: Plasticity of the grape berry metabolome. BMC Plant Biol. 2015, 15, 191. [Google Scholar] [CrossRef] [Green Version]
- Richardson, D.P.; Ansell, J.; Drummond, L.N. The nutritional and health attributes of kiwifruit: A review. Eur. J. Nutr. 2018, 57, 2659–2676. [Google Scholar] [CrossRef] [PubMed] [Green Version]
- Gerasopoulos, D.; Drogoudi, P.D. Summer-pruning and preharvest calcium chloride sprays affect storability and low temperature breakdown incidence in kiwifruit. Postharvest Biol. Technol. 2005, 36, 303–308. [Google Scholar] [CrossRef]
- Minchin, P.E.H.; Snelgar, W.P.; Blattmann, P.; Hall, A.J. Competition between fruit and vegetative growth in Hayward kiwifruit. N. Z. J. Crop. Hortic. Sci. 2010, 38, 101–112. [Google Scholar] [CrossRef]
- Miller, S.A.; Broom, F.D.; Thorp, T.G.; Barnett, A.M. Effects of leader pruning on vine architecture, productivity and fruit quality in kiwifruit (Actinidia deliciosa cv. Hayward). Sci. Hortic. 2001, 91, 189–199. [Google Scholar] [CrossRef]
- Snelgar, W.P.; Hopkirk, G.; Seelye, R.J.; Martin, P.J.; Manson, P.J. Relationship between canopy density and fruit quality of kiwifruit. N. Z. J. Crop. Hortic. Sci. 1998, 26, 223–232. [Google Scholar] [CrossRef] [Green Version]
- Black, M.Z.; Patterson, K.J.; Gould, K.S.; Clearwater, M.J. Physiological responses of kiwifruit vines (Actinidia chinensis Planch. var. chinensis) to trunk girdling and root pruning. N. Z. J. Crop. Hortic. Sci. 2012, 40, 31–41. [Google Scholar] [CrossRef]
- Boyd, L.M.; Barnett, A.M. Manipulation of Whole-vine Carbon Allocation Using Girdling, Pruning, and Fruit Thinning Affects Fruit Numbers and Quality in Kiwifruit. Hortscience 2011, 46, 590–595. [Google Scholar] [CrossRef] [Green Version]
- Ferrante, P.; Fiorillo, E.; Marcelletti, S.; Marocchi, F.; Mastroleo, M.; Simeoni, S.; Scortichini, M. The importance of the main colonization and penetration sites of Pseudomonas syringae pv. actinidiae and prevailing weather conditions in the development of epidemics in yellow kiwifruit, recently observed in central Italy. J. Plant Pathol. 2012, 94, 455–461. [Google Scholar]
- Mauri, S.; Cellini, A.; Buriani, G.; Donati, I.; Costa, G.; Spinelli, F. Optimization of cultural practices to reduce the development of Pseudomonas syringae pv. actinidiae, causal agent of the bacterial canker of kiwifruit. J. Berry Res. 2016, 6, 355–370. [Google Scholar] [CrossRef] [Green Version]
- Wicaksono, W.A.; Jones, E.E.; Casonato, S.; Monk, J.; Ridgway, H.J. Biological control of Pseudomonas syringae pv. actinidiae (Psa), the causal agent of bacterial canker of kiwifruit, using endophytic bacteria recovered from a medicinal plant. Biol. Control 2018, 116, 103–112. [Google Scholar]
- Reglinski, T.; Vanneste, J.; Wurms, K.; Gould, E.; Spinelli, F.; Rikkerink, E. Using fundamental knowledge of induced resistance to develop control strategies for bacterial canker of kiwifruit caused by Pseudomonas syringae pv. actinidiae. Front. Plant Sci. 2013, 4, 24. [Google Scholar] [CrossRef] [Green Version]
- Smith, G.S.; Gravett, I.M.; Edwards, C.M.; Curtis, J.P.; Buwalda, J.G. Spatial Analysis of the Canopy of Kiwifruit Vines as it Relates to the Physical, Chemical and Postharvest Attributes of the Fruit. Ann. Bot. 1994, 73, 99–111. [Google Scholar] [CrossRef]
- Miles, D.; Smith, G.; Millar, S. Within plant sampling procedures-fruit variation in kiwifruit vines. Ann. Bot. 1996, 78, 289–294. [Google Scholar] [CrossRef] [Green Version]
- Commisso, M.; Negri, S.; Bianconi, M.; Gambini, S.; Avesani, S.; Ceoldo, S.; Avesani, L.; Guzzo, F. Untargeted and Targeted Metabolomics and Tryptophan Decarboxylase In Vivo Characterization Provide Novel Insight on the Development of Kiwifruits (Actinidia deliciosa). Int. J. Mol. Sci. 2019, 20, 897. [Google Scholar] [CrossRef] [Green Version]
- Salzano, A.M.; Renzone, G.; Sobolev, A.P.; Carbone, V.; Petriccione, M.; Capitani, D.; Vitale, M.; Novi, G.; Zambrano, N.; Pasquariello, M.S.; et al. Unveiling Kiwifruit Metabolite and Protein Changes in the Course of Postharvest Cold Storage. Front. Plant Sci. 2019, 10, 71. [Google Scholar] [CrossRef] [PubMed] [Green Version]
- Salzano, A.M.; Sobolev, A.; Carbone, V.; Petriccione, M.; Renzone, G.; Capitani, D.; Vitale, M.; Minasi, P.; Pasquariello, M.S.; Novi, G.; et al. A proteometabolomic study of Actinidia deliciosa fruit development. J. Proteom. 2018, 172, 11–24. [Google Scholar] [CrossRef] [PubMed]
- Boldingh, H.; Smith, G.S.; Klages, K. Seasonal concentrations of non-structural carbohydrates of five Actinidia species in fruit, leaf and fine root tissue. Ann. Bot. 2000, 85, 469–476. [Google Scholar] [CrossRef] [Green Version]
- Yu, M.; Man, Y.; Lei, R.; Lu, X.; Wang, Y. Metabolomics Study of Flavonoids and Anthocyanin-Related Gene Analysis in Kiwifruit (Actinidia chinensis) and Kiwiberry (Actinidia arguta). Plant Mol. Biol. Report. 2020, 38, 353–369. [Google Scholar] [CrossRef]
- Sciubba, F.; Di Cocco, M.E.; Angori, G.; Spagnoli, M.; De Salvador, F.R.; Engel, P.; Delfini, M. NMR-based metabolic study of leaves of three species of Actinidia with different degrees of susceptibility to Pseudomonas syringae pv. actinidiae. Nat. Prod. Res. 2020, 34, 2043–2050. [Google Scholar] [CrossRef] [PubMed]
- Li, Y.; Fang, J.; Qi, X.; Lin, M.; Zhong, Y.; Sun, L.; Cui, W. Combined Analysis of the Fruit Metabolome and Transcriptome Reveals Candidate Genes Involved in Flavonoid Biosynthesis in Actinidia arguta. Int. J. Mol. Sci. 2018, 19, 1471. [Google Scholar] [CrossRef] [PubMed] [Green Version]
- van Belle, G. Statistical Rules of Thumb, 2nd ed.; Wiley-Interscience: New York, NY, USA, 2008. [Google Scholar]
- Anderson, M.J. A new method for non-parametric multivariate analysis of variance. Austral Ecol. 2001, 26, 32–46. [Google Scholar]
- Thorp, T.G.; Boyd, L.M.; Barnett, A.M.; Lowe, R.G.; Hofstee, B.J.; Blattmann, P.J.; Clearwater, M.J. Effect of inter-specific rootstocks on inorganic nutrient concentrations and fruit quality of ‘Hort16A’ kiwifruit (Actinidia chinensis Planch. var. chinensis). J. Hortic. Sci. Biotechnol. 2007, 82, 829–838. [Google Scholar] [CrossRef]
- Raspor, M.; Motyka, V.; Ninković, S.; Dobrev, P.I.; Malbeck, J.; Ćosić, T.; Cingel, A.; Savić, J.; Tadić, V.; Dragićević, I.Č. Endogenous levels of cytokinins, indole-3-acetic acid and abscisic acid in in vitro grown potato: A contribution to potato hormonomics. Sci. Rep. 2020, 10, 3437. [Google Scholar] [CrossRef] [PubMed] [Green Version]
- Creek, D.J.; Dunn, W.B.; Fiehn, O.; Griffin, J.L.; Hall, R.D.; Lei, Z.; Mistrik, R.; Neumann, S.; Schymanski, E.L.; Sumner, L.W.; et al. Metabolite identification: Are you sure? And how do your peers gauge your confidence? Metabolomics 2014, 10, 350–353. [Google Scholar] [CrossRef]
- Sivakumaran, S.; Huffman, L.; Sivakumaran, S.; Drummond, L. The nutritional composition of Zespri® SunGold Kiwifruit and Zespri® Sweet Green Kiwifruit. Food Chem. 2018, 238, 195–202. [Google Scholar] [CrossRef] [PubMed]
- He, X.R.; Fang, J.C.; Chen, X.F.; Zhao, Z.F.; Li, Y.S.; Meng, Y.B.; Huang, L.H. Actinidia chinensis Planch.: A Review of Chemistry and Pharmacology. Front. Pharmacol. 2019, 10. [Google Scholar] [CrossRef]
- Kim, G.-D.; Lee, J.Y.; Auh, J.-H. Metabolomic Screening of Anti-Inflammatory Compounds from the Leaves of Actinidia arguta (Hardy Kiwi). Foods 2019, 8, 47. [Google Scholar] [CrossRef] [PubMed] [Green Version]
- Chai, W.-M.; Shi, Y.; Feng, H.-L.; Xu, L.; Xiang, Z.-H.; Gao, Y.-S.; Chen, Q.-X. Structure Characterization and Anti-tyrosinase Mechanism of Polymeric Proanthocyanidins Fractionated from Kiwifruit Pericarp. J. Agric. Food Chem. 2014, 62, 6382–6389. [Google Scholar] [CrossRef] [PubMed]
- Murai, F.; Tagawa, M.; Ohishi, H. Absolute structure of kiwiionoside as a precursor of loliolide and actinidiolide from Actinidia chinensis. Planta Med. 1992, 58, 112–113. [Google Scholar] [CrossRef] [PubMed]
- Jang, D.S.; Lee, G.Y.; Lee, Y.M.; Kim, Y.S.; Sun, H.; Kim, D.-H.; Kim, J.S. Flavan-3-ols having a g-lactam from the roots of Actinidia arguta inhibit the formation of advanced glycation end products in vitro. Chem. Pharm. Bull. 2009, 57, 397–400. [Google Scholar] [CrossRef] [PubMed] [Green Version]
- Wishart, D.S. Advances in metabolite identification. Bioanalysis 2011, 3, 1769–1782. [Google Scholar] [CrossRef]
- Allard, P.-M.; Genta-Jouve, G.; Wolfender, J.-L. Deep metabolome annotation in natural products research: Towards a virtuous cycle in metabolite identification. Curr. Opin. Chem. Biol. 2017, 36, 40–49. [Google Scholar] [CrossRef]
- Nardozza, S.; Cooney, J.; Boldingh, H.L.; Hewitt, K.G.; Trower, T.; Jones, D.; Thrimawithana, A.H.; Allan, A.C.; Richardson, A.C. Phytohormone and Transcriptomic Analysis Reveals Endogenous Cytokinins Affect Kiwifruit Growth under Restricted Carbon Supply. Metabolites 2020, 10, 23. [Google Scholar] [CrossRef] [Green Version]
- Burdon, J.; Pidakala, P.; Martin, P.; Billing, D.; Boldingh, H. Fruit maturation and the soluble solids harvest index for ‘Hayward’ kiwifruit. Sci. Hortic. 2016, 213, 193–198. [Google Scholar] [CrossRef]
Figure 1.
Venn diagrams showing the distribution of metabolites among different tissues of ‘Hayward’ (Harvest 1) and ‘Zesy002’ (Harvest 3) kiwifruit vines. Data are presented for 583 and 699 metabolites having greater than 80% and 100% detection thresholds in Hayward and ‘Zesy002’ kiwifruit respectively as measured in bulked QC samples. Red numbers are the total number of metabolites detected in that tissue.
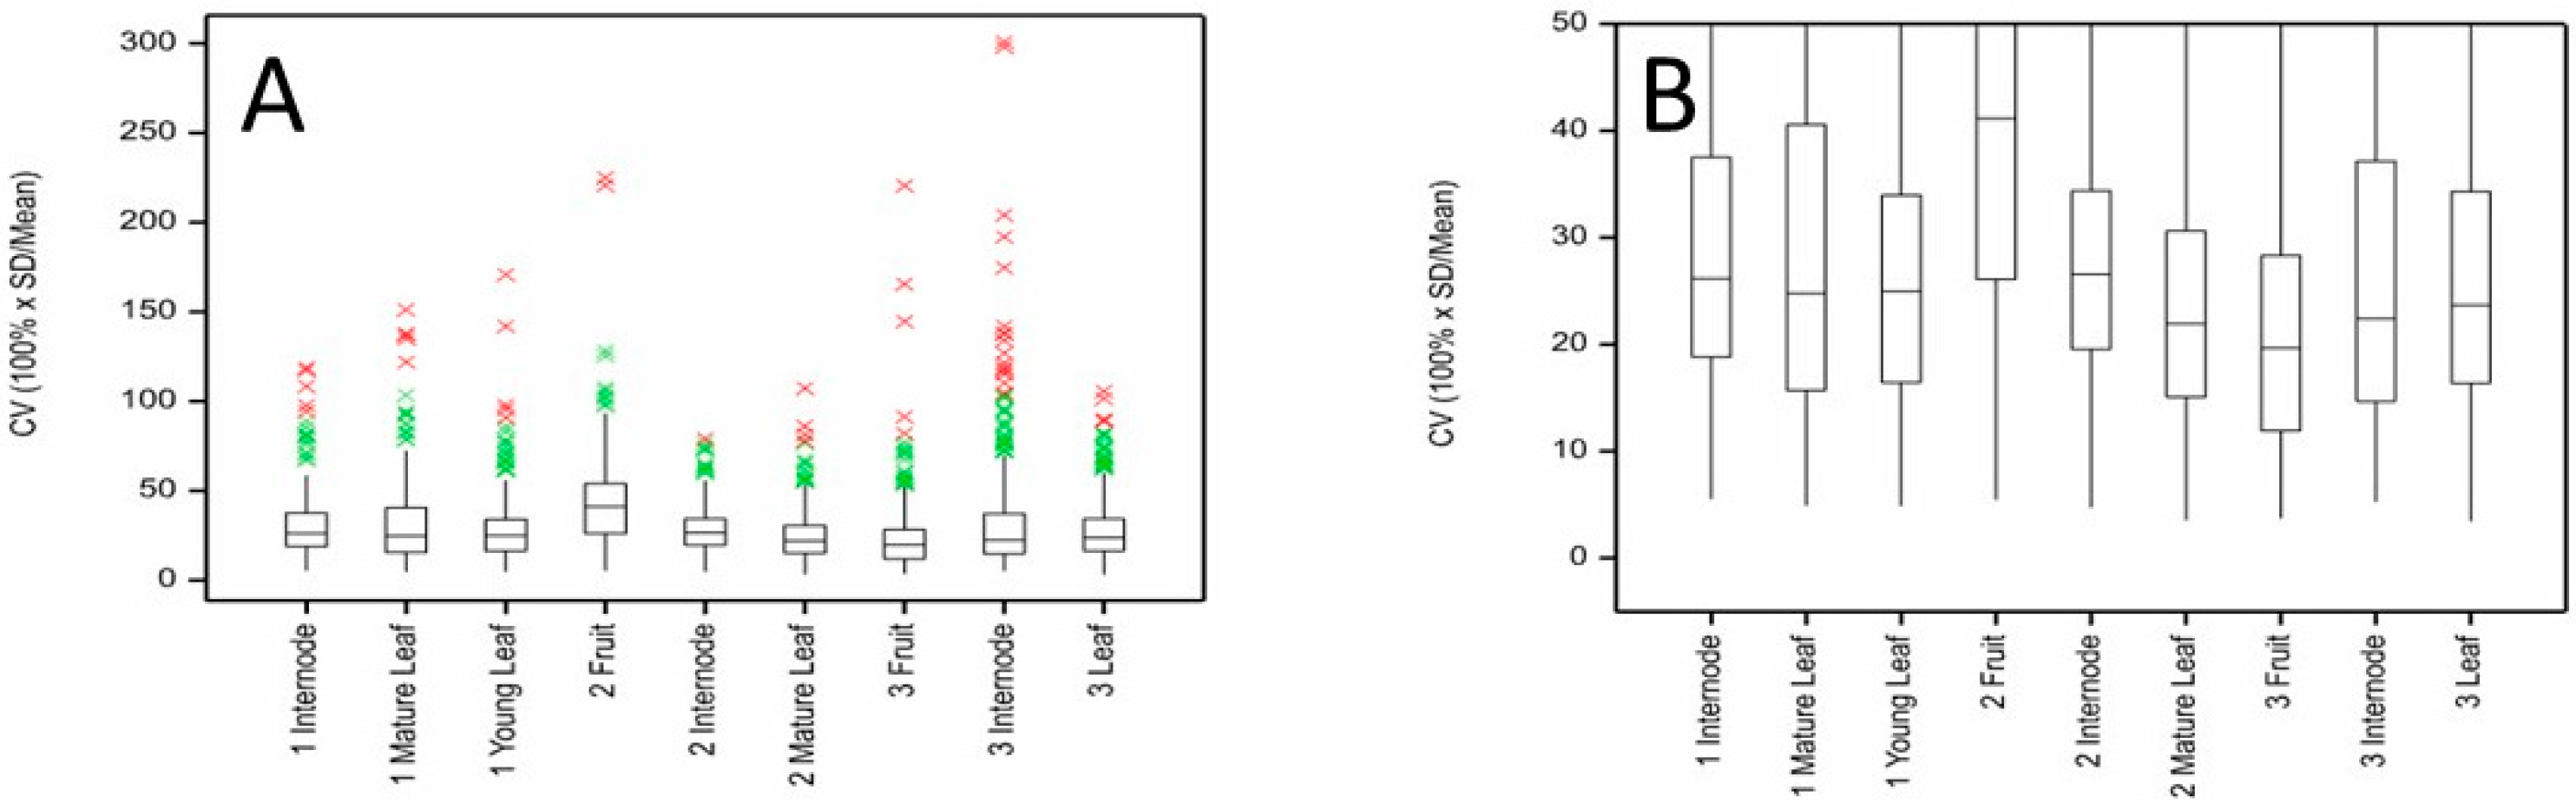
Figure 2.
Distribution of coefficients of variation (CV) for metabolites measured by LC-MS in internode, mature and young leaf, and fruit of ‘Hayward’ kiwifruit samples showing (A) the full range of values and (B) the interquartile ranges. The boxes cover the middle 50% of measurements; 25% are below the bottom of the box and 25% are above. The whiskers cover no more than 1.5× height of box above the top or below the bottom of the box. Beyond that, individual observations are shown in green (1.5× height of box to 3 × height of box) or red (more than 3× height of box beyond the box).
Figure 3.
Distributions of coefficients of variation (CV) for metabolites measured by LC-MS in ‘Zesy002’ kiwifruit internode, mature and young leaf and fruit tissues at three harvest times showing (A) the full range of CV values and (B) the interquartile ranges.
Figure 4.
Between-vine (inter-vine) variability as a percentage of total variability for kiwifruit metabolites measured in fruit, internode and leaf tissues of ‘Hayward’ kiwifruit by LC-MS at three harvest times showing the distributions of percentage variance for (A) all metabolites and (B) for only those metabolites with CV < 20%.
Figure 5.
Between-vine (inter-vine) variability as a percentage of total variability for kiwifruit metabolites measured in fruit, internode and leaf tissues of ‘Zesy002’ kiwifruit by LC-MS at three harvest times showing distributions of percentage variances for (A) all metabolites and (B) for only those metabolites with CV < 20%.
Table 1.
Technical replicates: Number of metabolites (mass tags) measured, median %CV and percentage of metabolites with CV < 20% measured in duplicate analyses of powdered or frozen samples from ‘Hayward’ and ‘Zesy002’ kiwifruit vines.
| Harvest | Cultivar | Tissue | Number of Metabolites | Median CV | Percentage Metabolites with CV ≤ 20% |
|---|
| 1 | ‘Hayward’ | Internode | 191 | 13.1 | 68 |
| 1 | ‘Hayward’ | Mature leaf | 282 | 9.3 | 73 |
| 1 | ‘Hayward’ | Young leaf | - 1 | - | - |
| 2 | ‘Hayward’ | Internode | 183 | 7.0 | 86 |
| 2 | ‘Hayward’ | Mature leaf | 254 | 8.6 | 66 |
| 2 | ‘Hayward’ | Fruit | 188 | 9.4 | 77 |
| 3 | ‘Hayward’ | Internode | 630 | 7.2 | 86 |
| 3 | ‘Hayward’ | Mature leaf | 350 | 11.3 | 79 |
| 3 | ‘Hayward’ | Fruit | 438 | 8.3 | 86 |
| 1 | ‘Zesy002’ | Internode | 220 | 5.7 | 94 |
| 1 | ‘Zesy002’ | Mature leaf | 219 | 6.3 | 92 |
| 1 | ‘Zesy002’ | Young leaf | 234 | 7.0 | 94 |
| 2 | ‘Zesy002’ | Internode | - | - | - |
| 2 | ‘Zesy002’ | Mature leaf | 326 | 8.9 | 90 |
| 2 | ‘Zesy002’ | Fruit | 205 | 9.9 | 79 |
| 3 | ‘Zesy002’ | Internode | 274 | 11.9 | 82 |
| 3 | ‘Zesy002’ | Mature leaf | 878 | 6.0 | 95 |
| 3 | ‘Zesy002’ | Fruit | 335 | 6.6 | 98 |
Table 2.
Numbers of metabolites (mass tags) measured, and numbers and percentages of metabolites with CV less than 20%, measured in ‘Hayward’ and ‘Zesy002’ internode, and mature leaf issue and fruit samples at three harvest times.
| Harvest | Cultivar | Tissue | Number of Metabolites | Number of Metabolites with CV ≤ 20% | Percentage Metabolites with CV ≤ 20% |
|---|
| 1 | ‘Hayward’ | Internode | 460 | 95 | 21% |
| 1 | ‘Hayward’ | Mature leaf | 510 | 117 | 23% |
| 1 | ‘Hayward’ | Young leaf | 518 | 247 | 48% |
| 2 | ‘Hayward’ | Internode | 447 | 138 | 31% |
| 2 | ‘Hayward’ | Mature leaf | 489 | 123 | 25% |
| 2 | ‘Hayward’ | Fruit | 404 | 87 | 22% |
| 3 | ‘Hayward’ | Internode | 611 | 298 | 49% |
| 3 | ‘Hayward’ | Mature leaf | 359 | 45 | 13% |
| 3 | ‘Hayward’ | Fruit | 440 | 190 | 43% |
| 1 | ‘Zesy002’ | Internode | 221 | 64 | 29% |
| 1 | ‘Zesy002’ | Mature leaf | 228 | 86 | 38% |
| 1 | ‘Zesy002’ | Young leaf | 228 | 87 | 38% |
| 2 | ‘Zesy002’ | Internode | 295 | 79 | 27% |
| 2 | ‘Zesy002’ | Mature leaf | 325 | 140 | 43% |
| 2 | ‘Zesy002’ | Fruit | 202 | 39 | 19% |
| 3 | ‘Zesy002’ | Internode | 531 | 219 | 41% |
| 3 | ‘Zesy002’ | Mature leaf | 912 | 350 | 38% |
| 3 | ‘Zesy002’ | Fruit | 350 | 181 | 52% |
Table 3.
Comparison of results of ANOVA and Adonis analysis of Pseudomonas syringae var. actinidiae (Psa) infection of vegetative tissue, sampler, inter-vine variation and rootstock on variability of metabolomics analysis of ‘Hayward’ kiwifruit tissues collected at three harvest times. Percentages in bold show more significant effects than expected by chance (ANOVA) or p < 0.05 (Adonis).
| Harvest | Tissue | Number Metabolites CV < 20% | Mixed Models % Metabolites with Significant Effect (Adjusted for Other Factors) | Adonis p-Value (Adjusted for Other Factors) |
|---|
| Psa | Sampler | Vine | Psa | Sampler | Vine |
|---|
| 1 | Internode | 95 | 0 | 1 | 3 | 0.32 | 0.86 | 0.50 |
| 1 | Mature leaf | 117 | 2 | 3 | 7% 1 | 0.07 | 0.29 | 0.09 |
| 1 | Young leaf | 247 | 4% 1 | 12% 1 | 7% 1 | 0.21 | 0.005 | 0.06 |
| 2 | Fruit | 87 | 0 | 2 | 1 | 0.56 | 0.001 | 0.08 |
| 2 | Internode | 138 | 1 | 0 | 3 | 0.25 | 0.16 | 0.22 |
| 2 | Mature leaf | 123 | 2 | 2 | 2 | 0.27 | 0.36 | 0.36 |
| 3 | Fruit | 190 | 1 | 3 | 3 | 0.49 | 0.04 | 0.014 |
| 3 | Internode | 298 | 1 | 1 | 2 | 0.33 | 0.70 | 0.007 |
| 3 | Mature leaf | 45 | 0 | 2 | 2 | 0.68 | 0.13 | 0.45 |
Table 4.
Comparison of results from ANOVA and Adonis analysis of effects of Pseudomonas syringae var. actinidiae (Psa), sampler, between vine variation and rootstock on variability of metabolomics analysis of ‘Zesy002’ kiwifruit tissues collected at three harvest times. Values in bold show more significant effects than expected by chance (ANOVA) or p < 0.05 (Adonis).
| Harvest | Tissue | Number Metabolites CV < 20% | Mixed Models % Metabolites with Significant Effect (Adjusted for Other Factors) | Adonis p-Value (Adjusted for Other Factors) |
|---|
| Psa | Sampler | Vine | Rootstock | Psa | Sampler | Vine | Rootstock |
|---|
| 1 | Internode | 64 | 2 | 2 | - 1 | 3 | 0.76 | 0.33 | - 1 | 0.84 |
| 1 | Mature leaf | 86 | 2 | 0 | 0 | 1 | 0.37 | 0.11 | 0.72 | 0.70 |
| 1 | Young leaf | 87 | 1 | 0 | 1 | 0 | 0.75 | 0.21 | 0.26 | 0.50 |
| 2 | Fruit | 39 | 5 | 5 | 8 2 | 5 | 0.014 | 0.48 | 0.47 | 0.31 |
| 2 | Internode | 79 | 0 | 0 | 0 | 18 2 | 0.001 | 0.09 | 0.05 | 0.003 |
| 2 | Mature leaf | 140 | 1 | 1 | 1 | 7 2 | 0.06 | 0.49 | 0.02 | 0.001 |
| 3 | Fruit | 181 | - 1 | 0 | 1 | 5 2 | - 1 | 0.02 | 0.07 | 0.10 |
| 3 | Internode | 219 | - | 0 | 1 | 4 2 | - | 0.19 | 0.86 | 0.06 |
| 3 | Mature leaf | 350 | - | 0 | 2 | 2 | - | 0.67 | 0.44 | 0.10 |
Table 5.
Mean (and range) %CV and mean %CV due to between-vine variation for soluble sugars and polyols measured, leaf and fruit of ‘Hayward’ and ‘Zesy002’ kiwifruit at three harvest times, and for nine gibberellins, cytokinins and stress phytohormones where these co-occur in selected plant tissues.
| | Soluble Sugars and Polyols | Phytohormones |
|---|
| | ‘Hayward’ | ‘Zesy002’ | ‘Hayward’ | ‘Zesy002’ |
|---|
| %CV (mean and rage) | 35.1 (11–152) | 36.1 (9–93) | 42.9 (10–104) | 47.0 (11–131) |
| % between-vine variation (mean and rage) | 22.6 (0–70) | 35.0 (0–96) | 27.5 (0–94) | 43.9 (0–93) |
Table 6.
Numbers of samples collected from each Actinidia cultivar. Fruit samples are in italics.
| Cultivar | ‘Hayward’ | ‘Zesy002’ |
|---|
| Internode | Mature Leaf | Young Leaf (Fruit) | Internode | Mature Leaf | Young Leaf (Fruit) |
|---|
| Harvest 1 | 28 | 27 | 29 | 18 | 19 | 23 |
| Harvest 2 | 29 | 30 | (28) | 21 | 23 | (23) |
| Harvest 3 | 29 | 29 | (29) | 18 | 19 | (19) |
| Publisher’s Note: MDPI stays neutral with regard to jurisdictional claims in published maps and institutional affiliations. |
© 2021 by the authors. Licensee MDPI, Basel, Switzerland. This article is an open access article distributed under the terms and conditions of the Creative Commons Attribution (CC BY) license (https://creativecommons.org/licenses/by/4.0/).


 ,
, 


