
Changes in Oxygen Availability during Glucose-Limited Chemostat Cultivations of Penicillium chrysogenum Lead to Rapid Metabolite, Flux and Productivity Responses


Abstract
:1. Introduction
2. Results
2.1. DO-Shift Experiments
2.1.1. General Observations
2.1.2. Intracellular and Extracellular Metabolites
- (a)
- Amino acids
- (b)
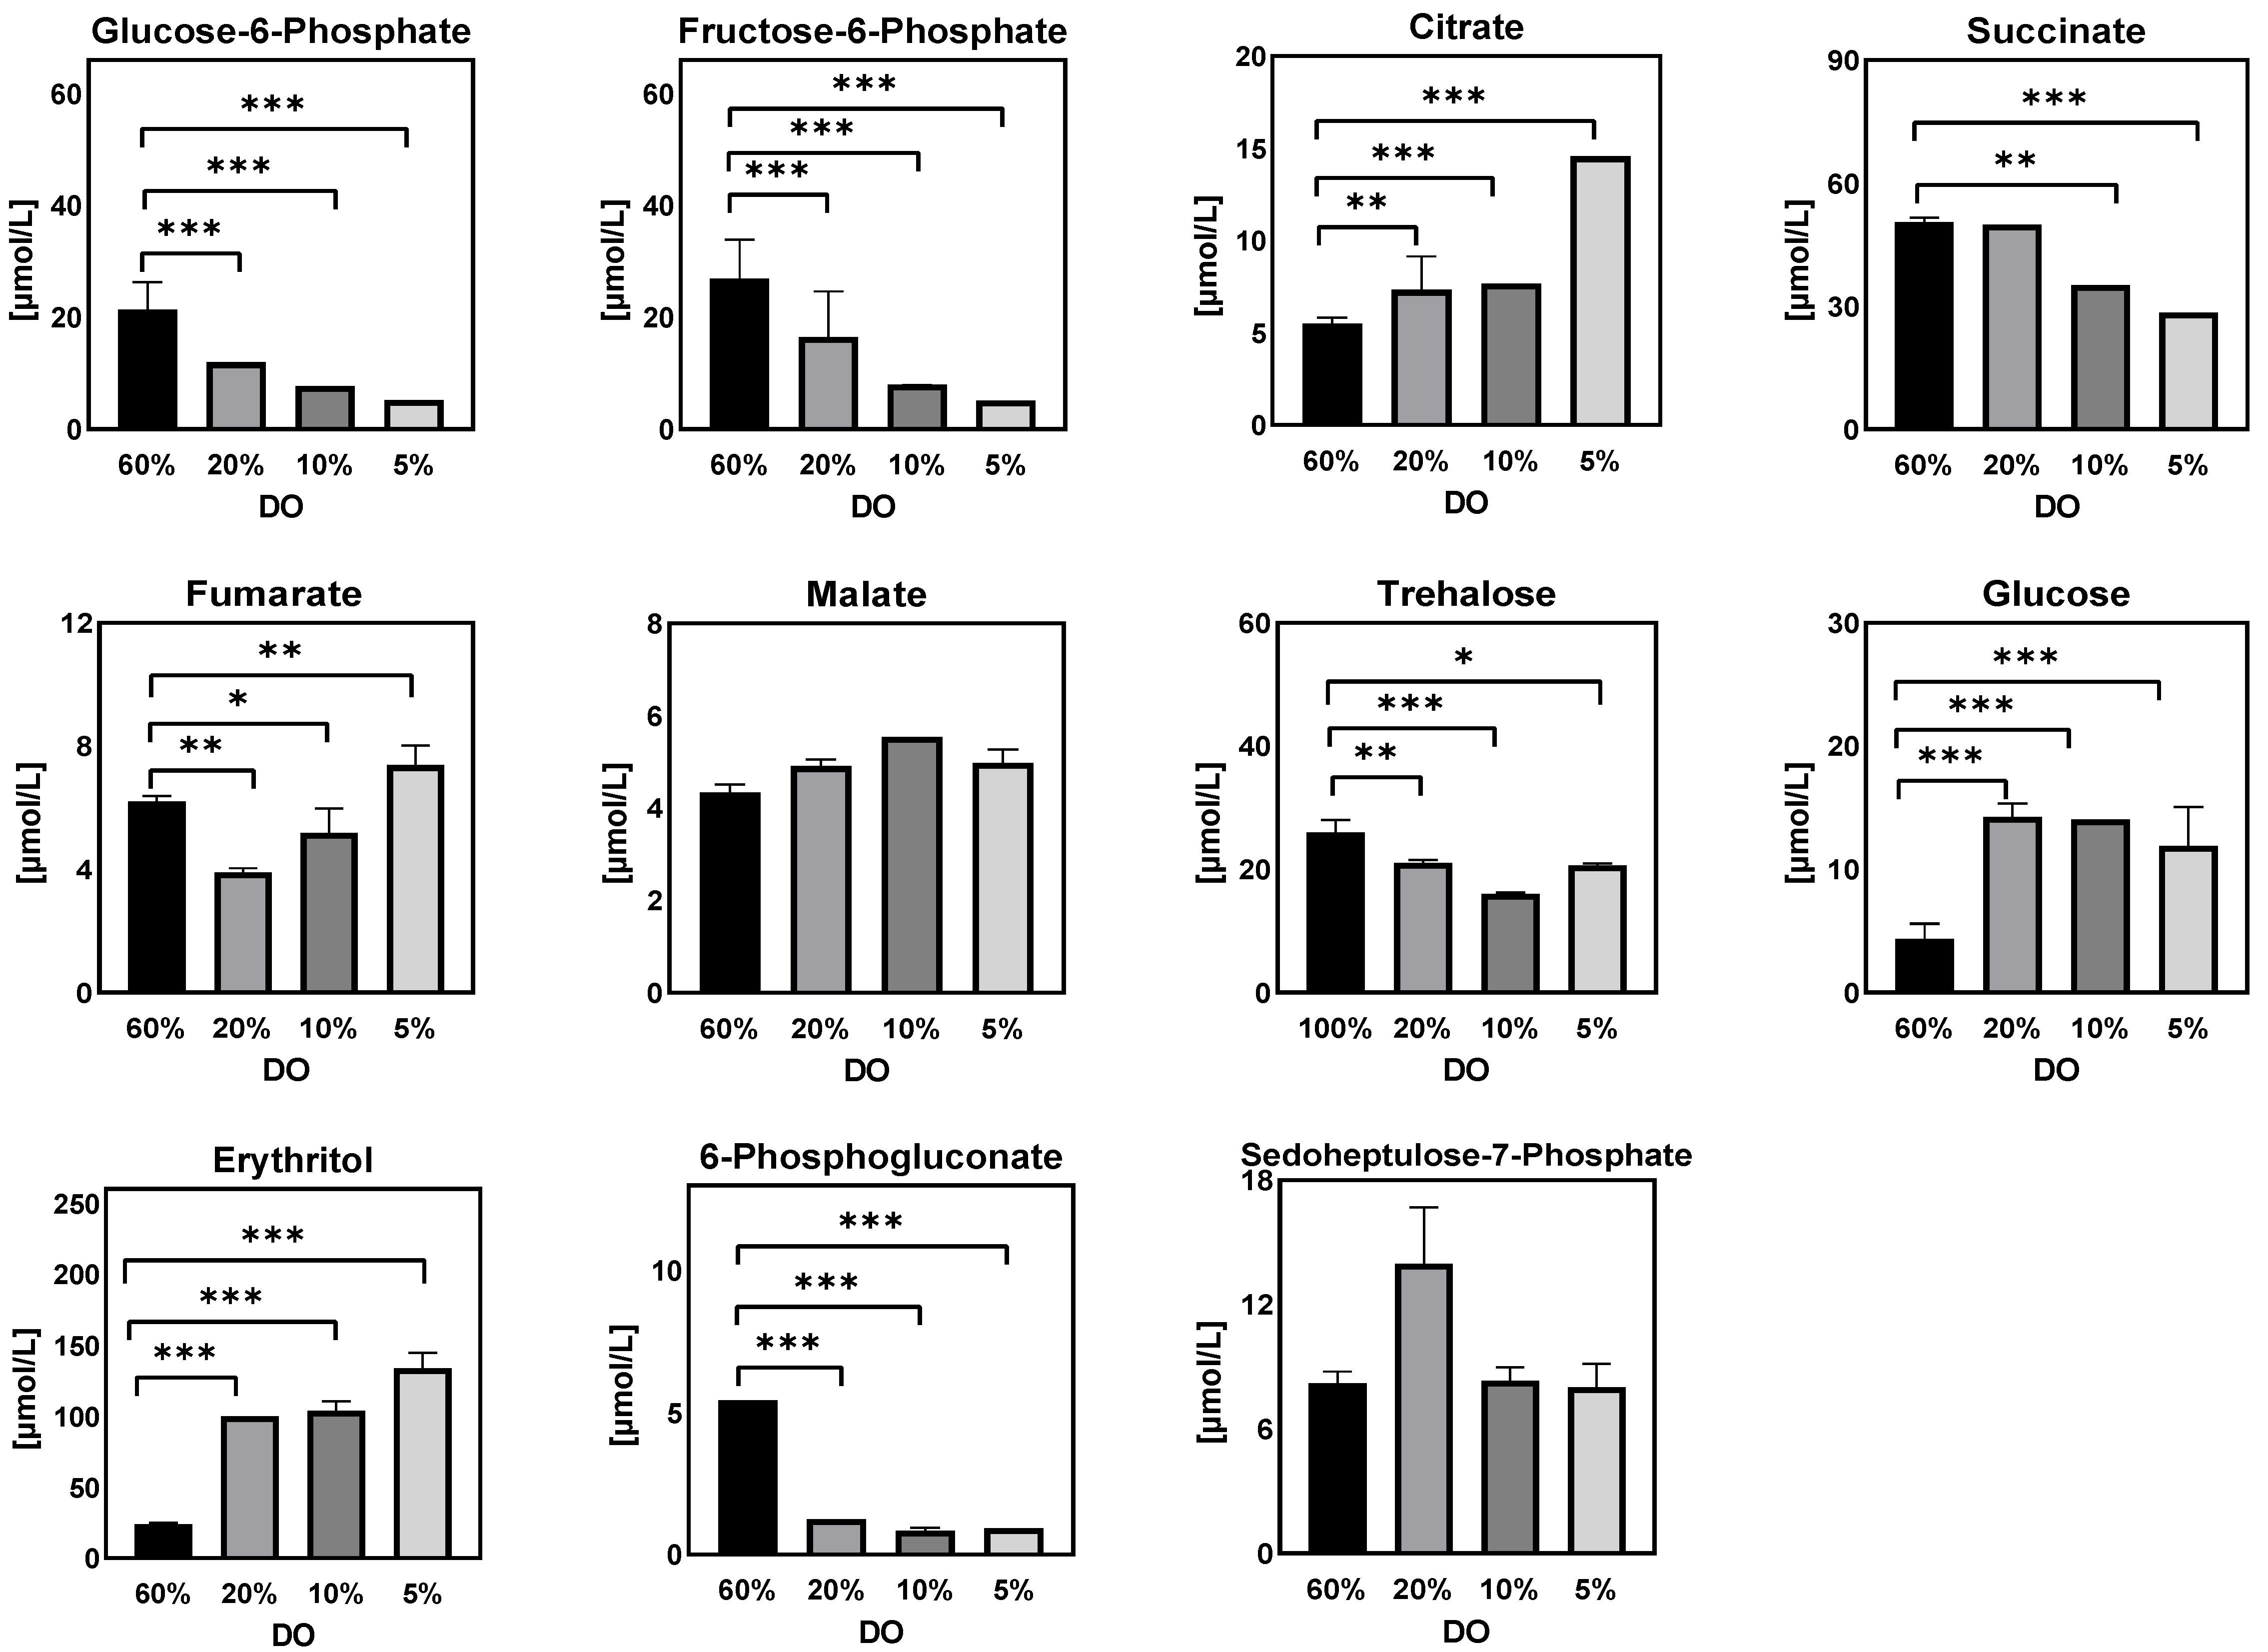
- Sugar phosphates, organic acids, and sugar alcohols
- (c)
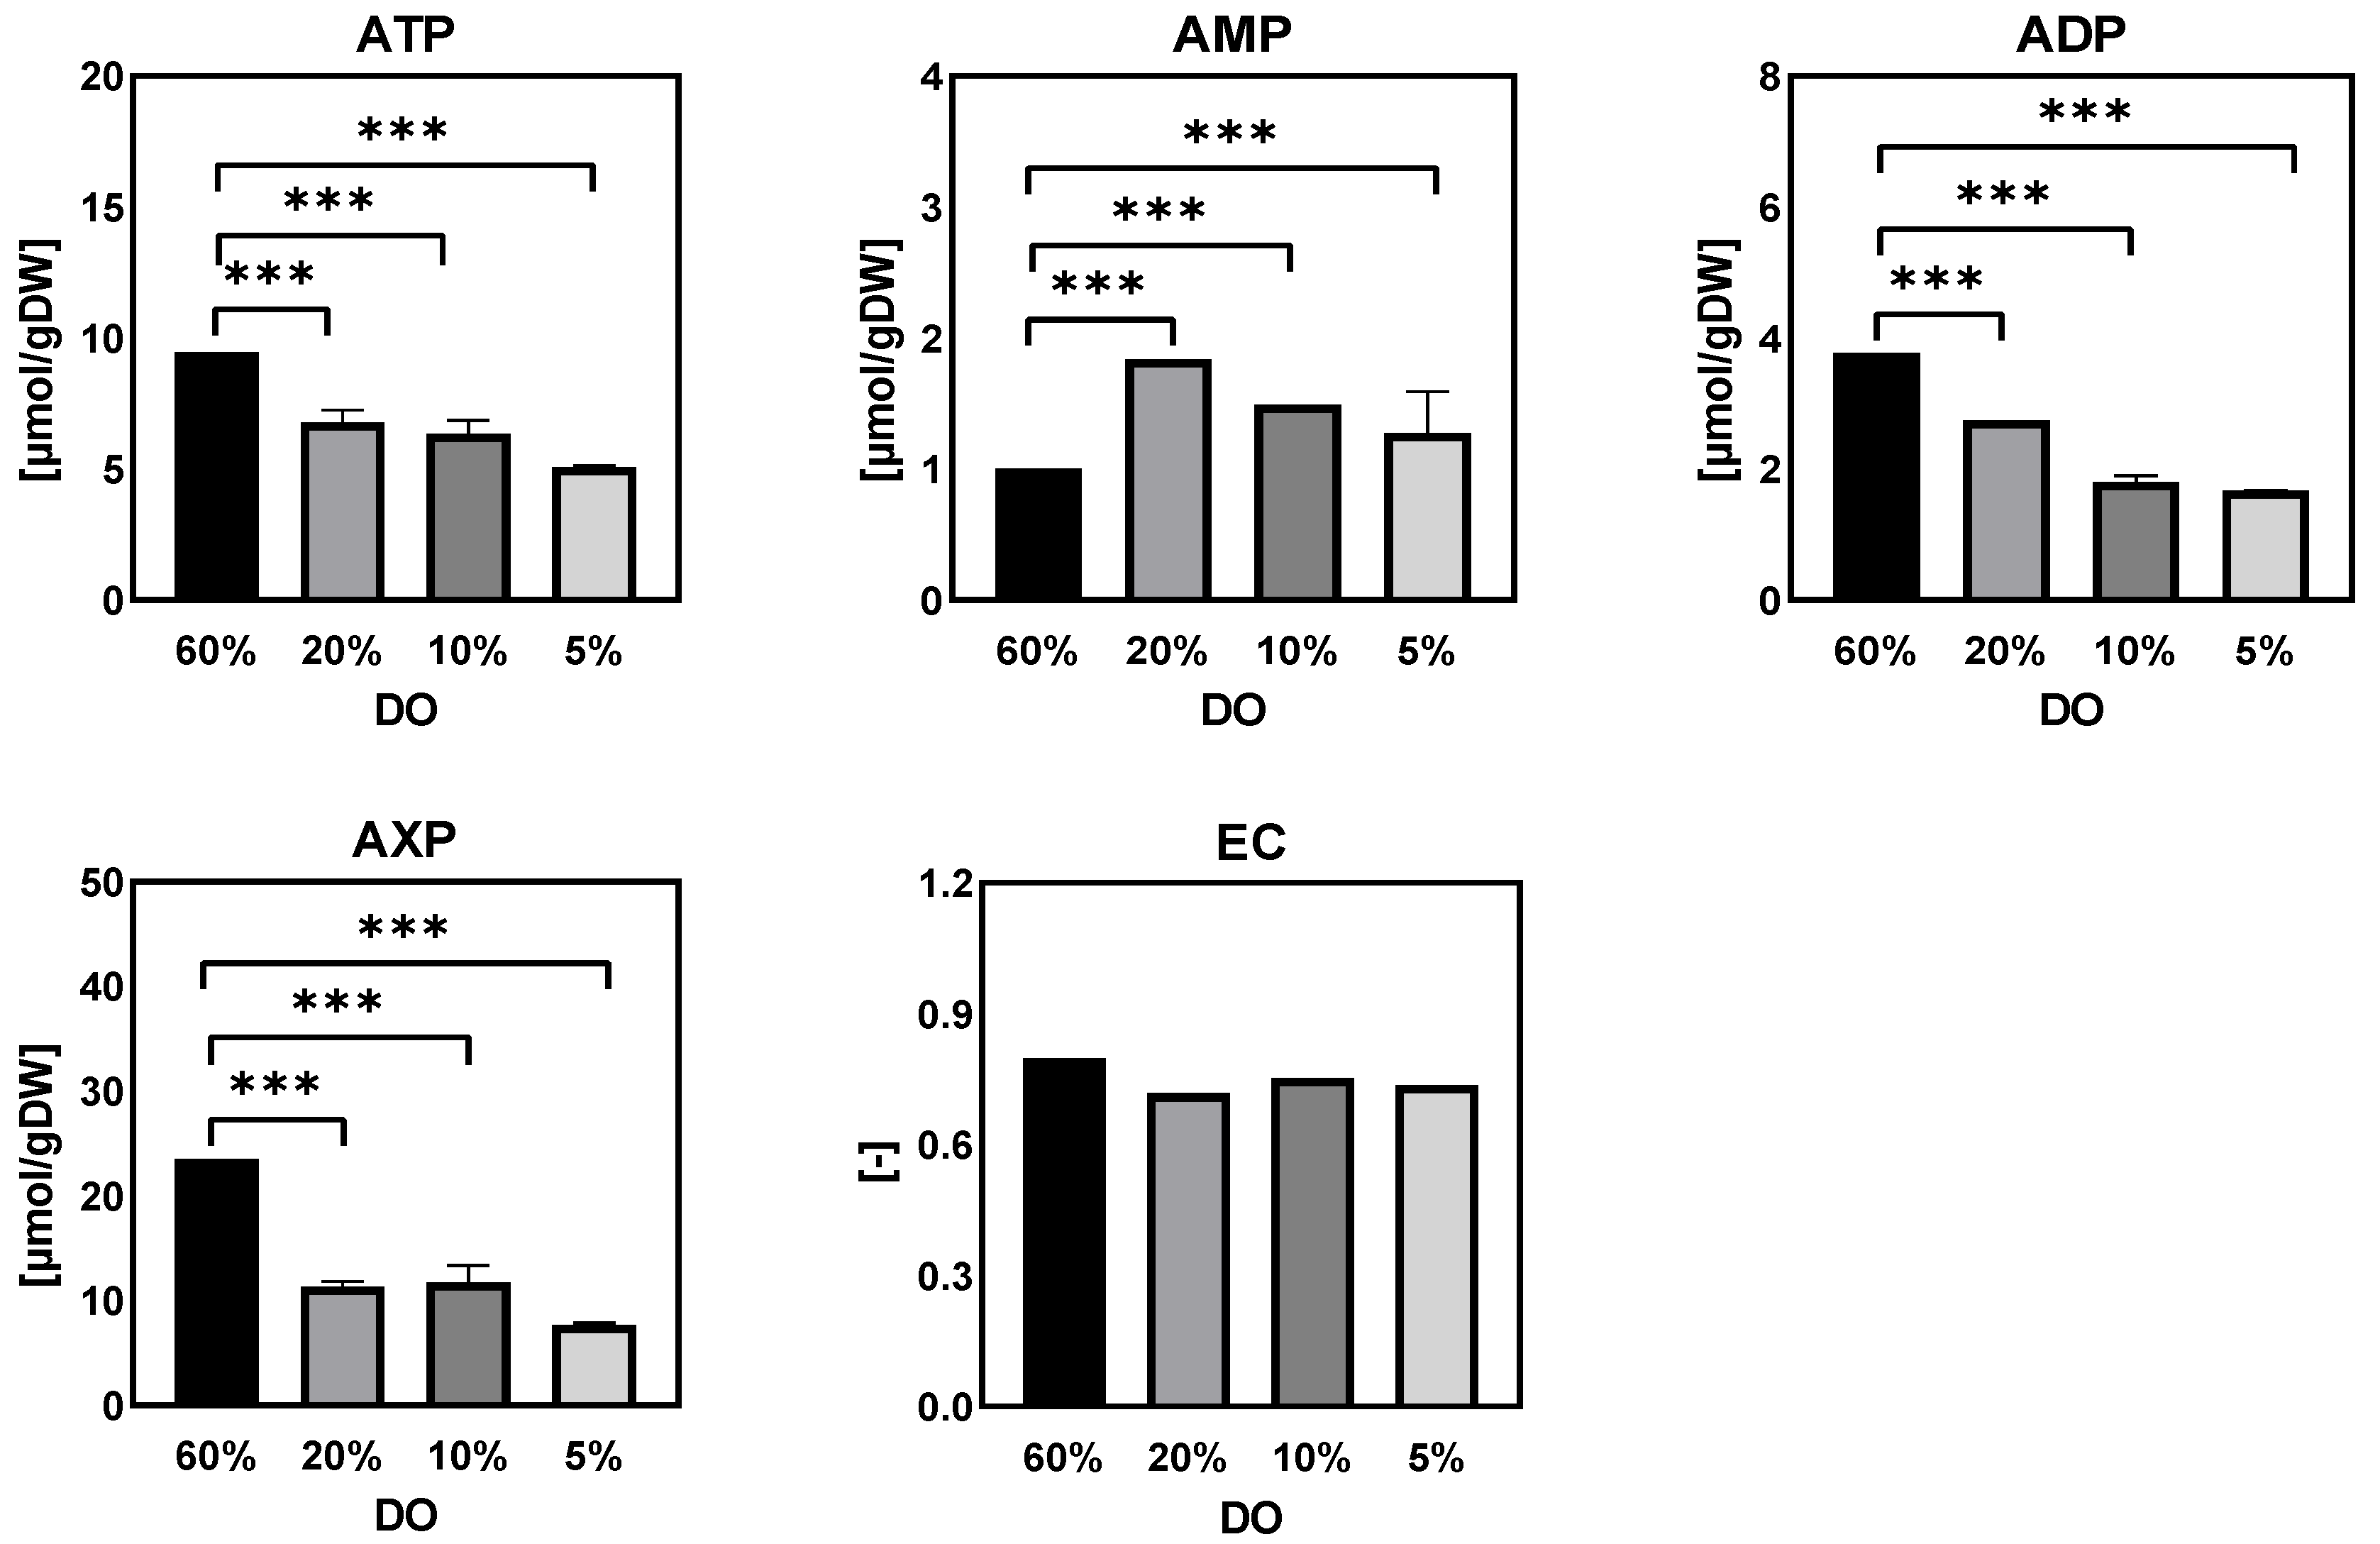
- Purine nucleotide and energy charge
- (d)
- Extracellular sugar phosphates, organic acids, and sugar alcohols
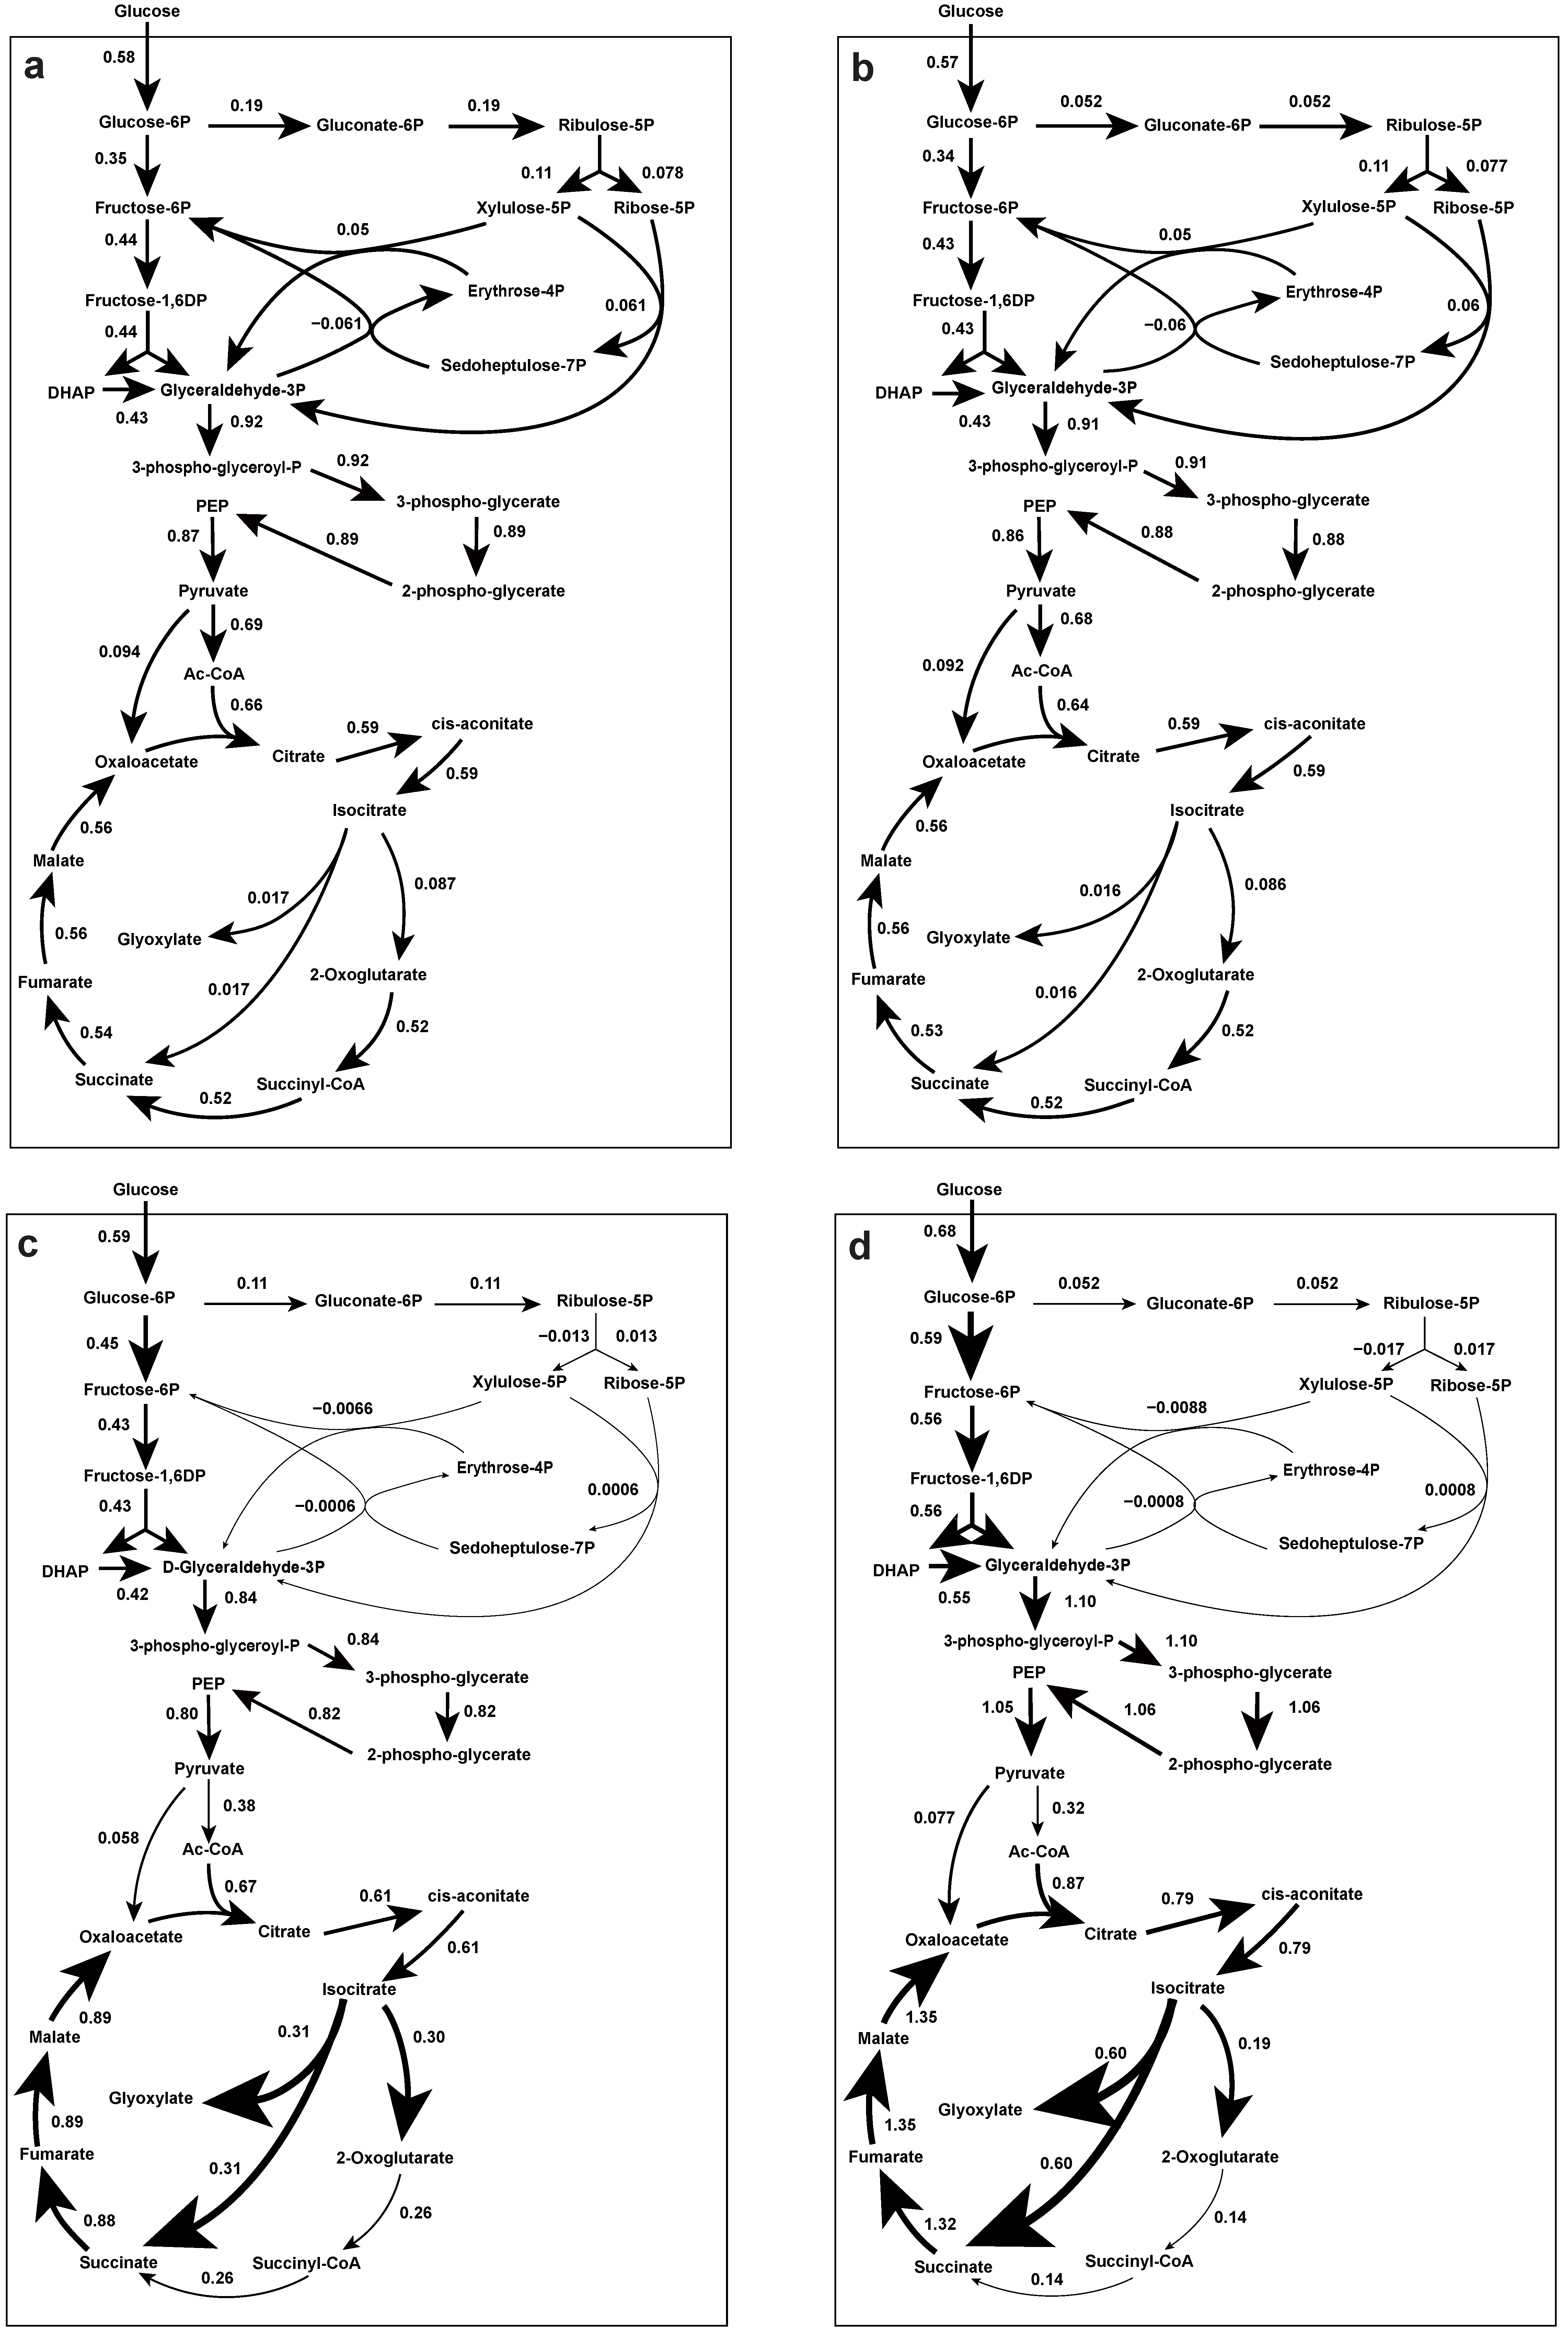
Intracellular Metabolic Flux Distribution
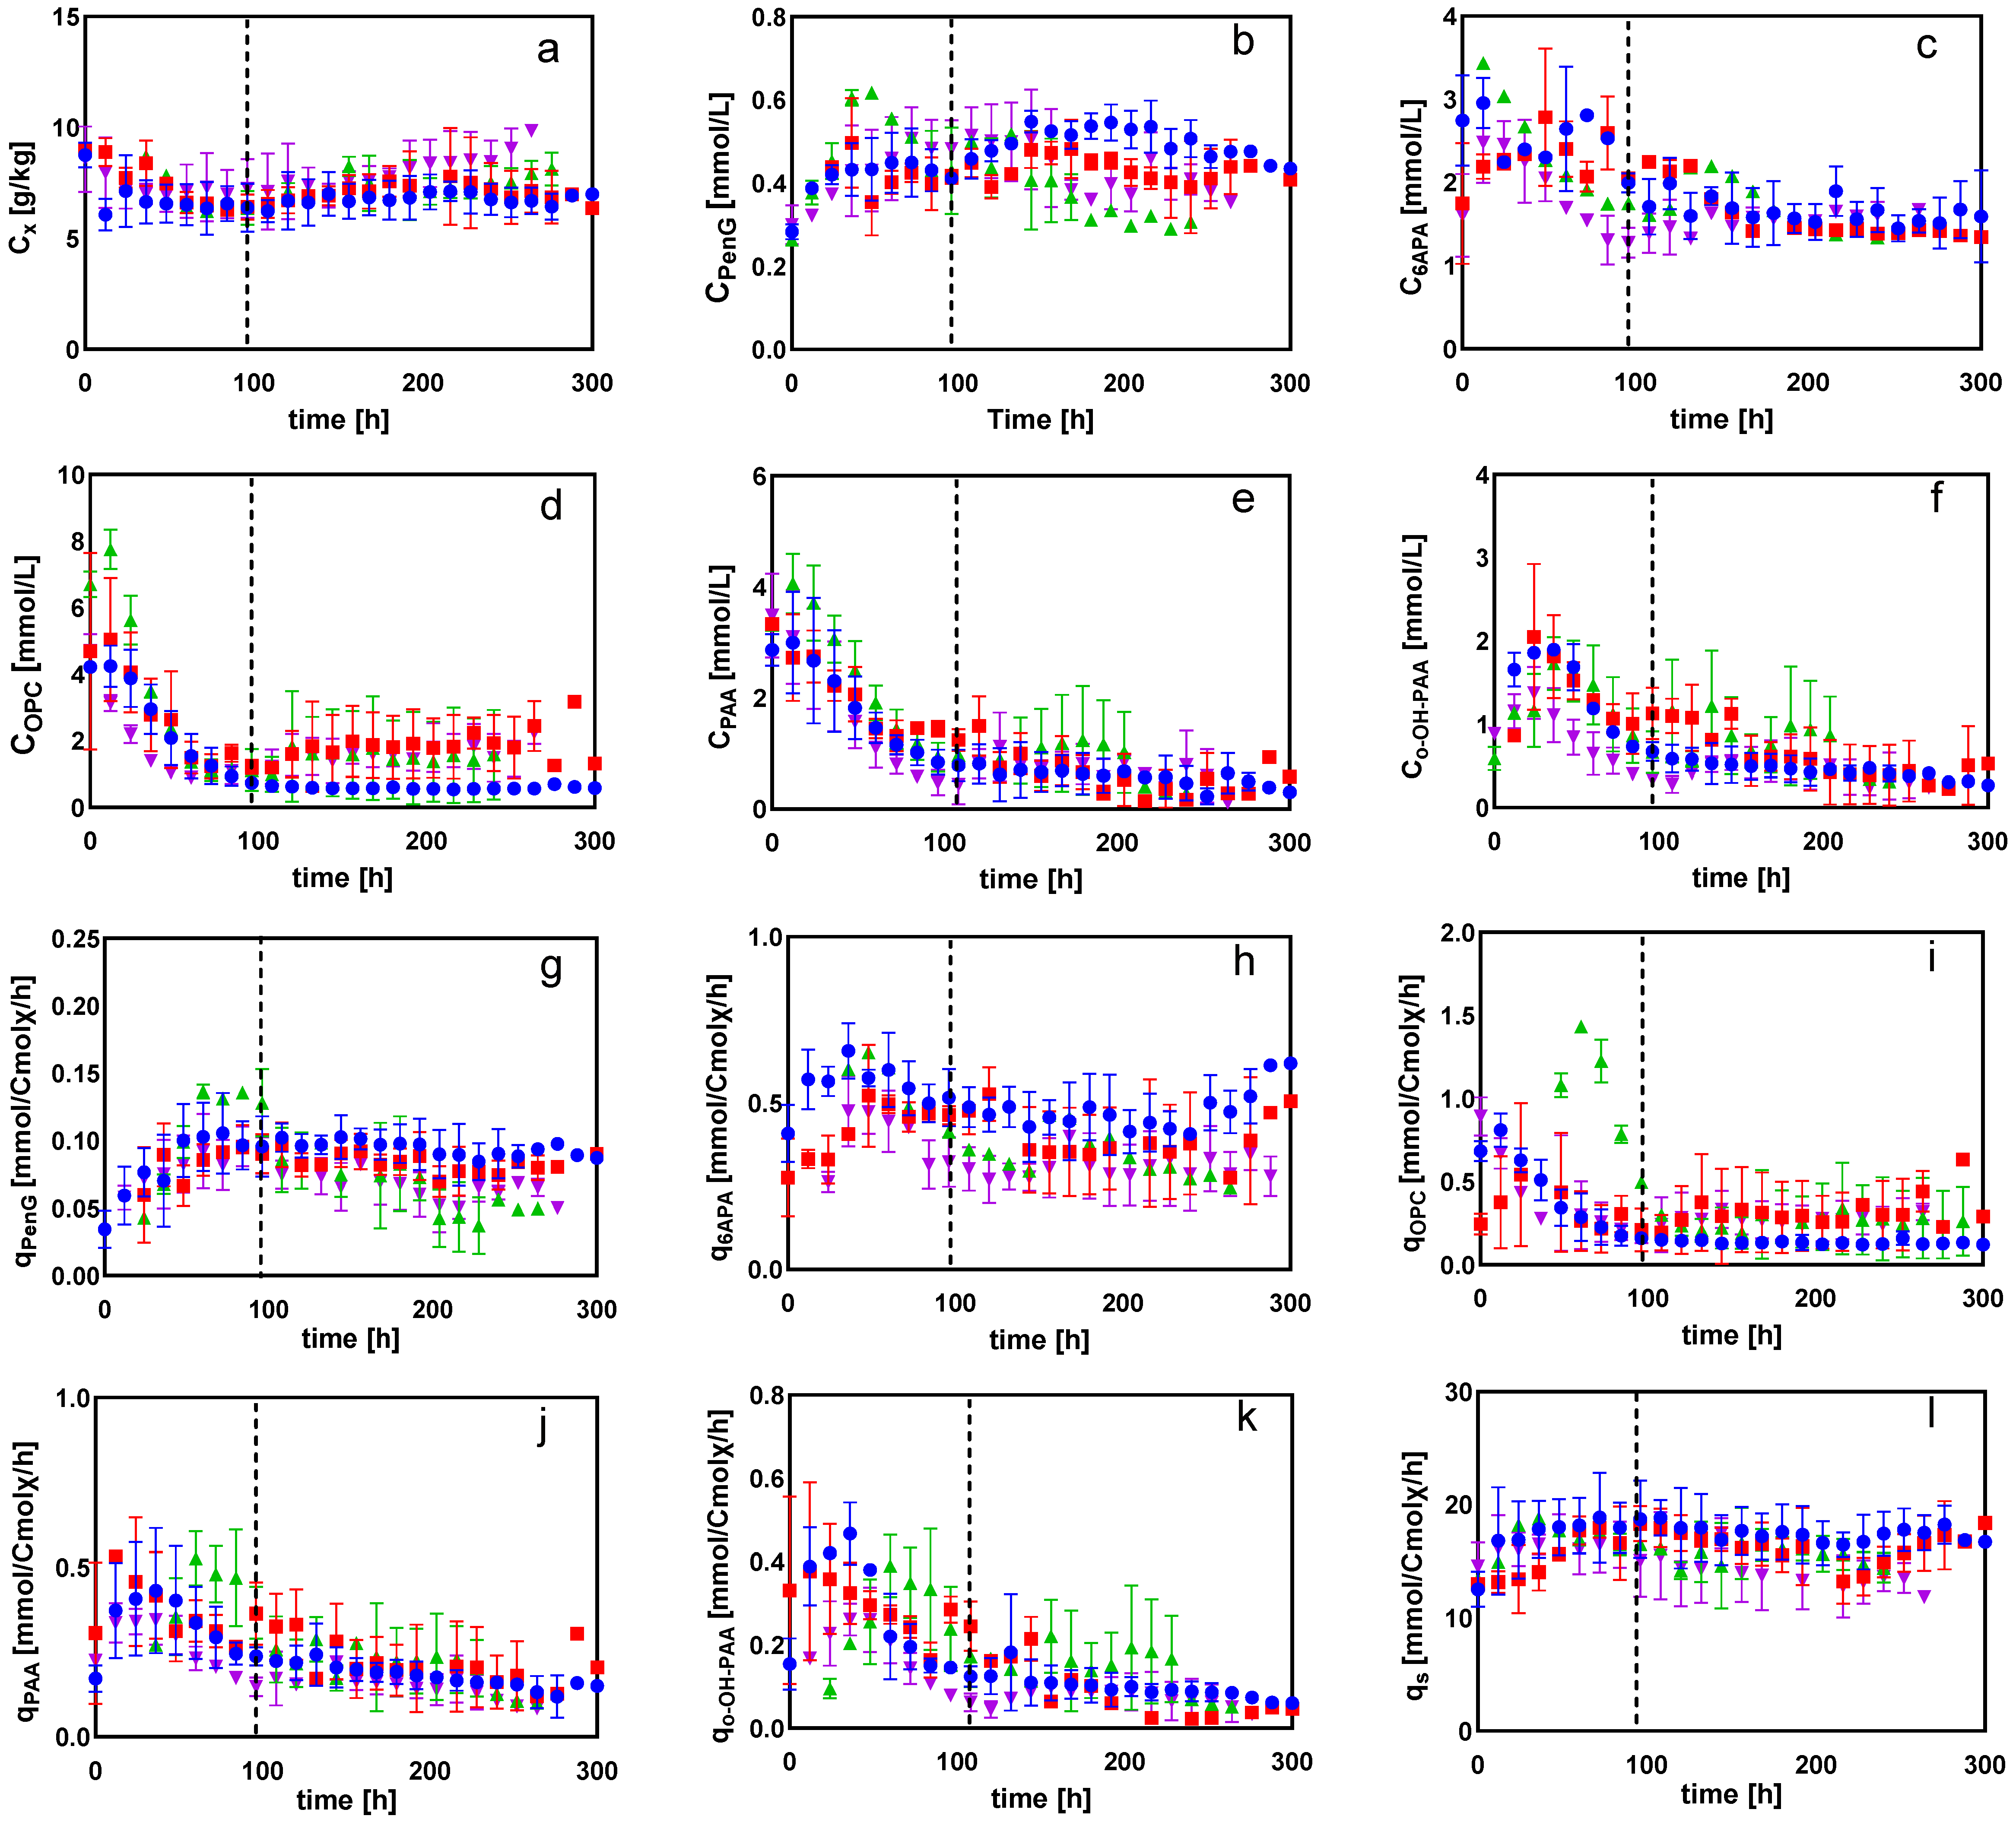
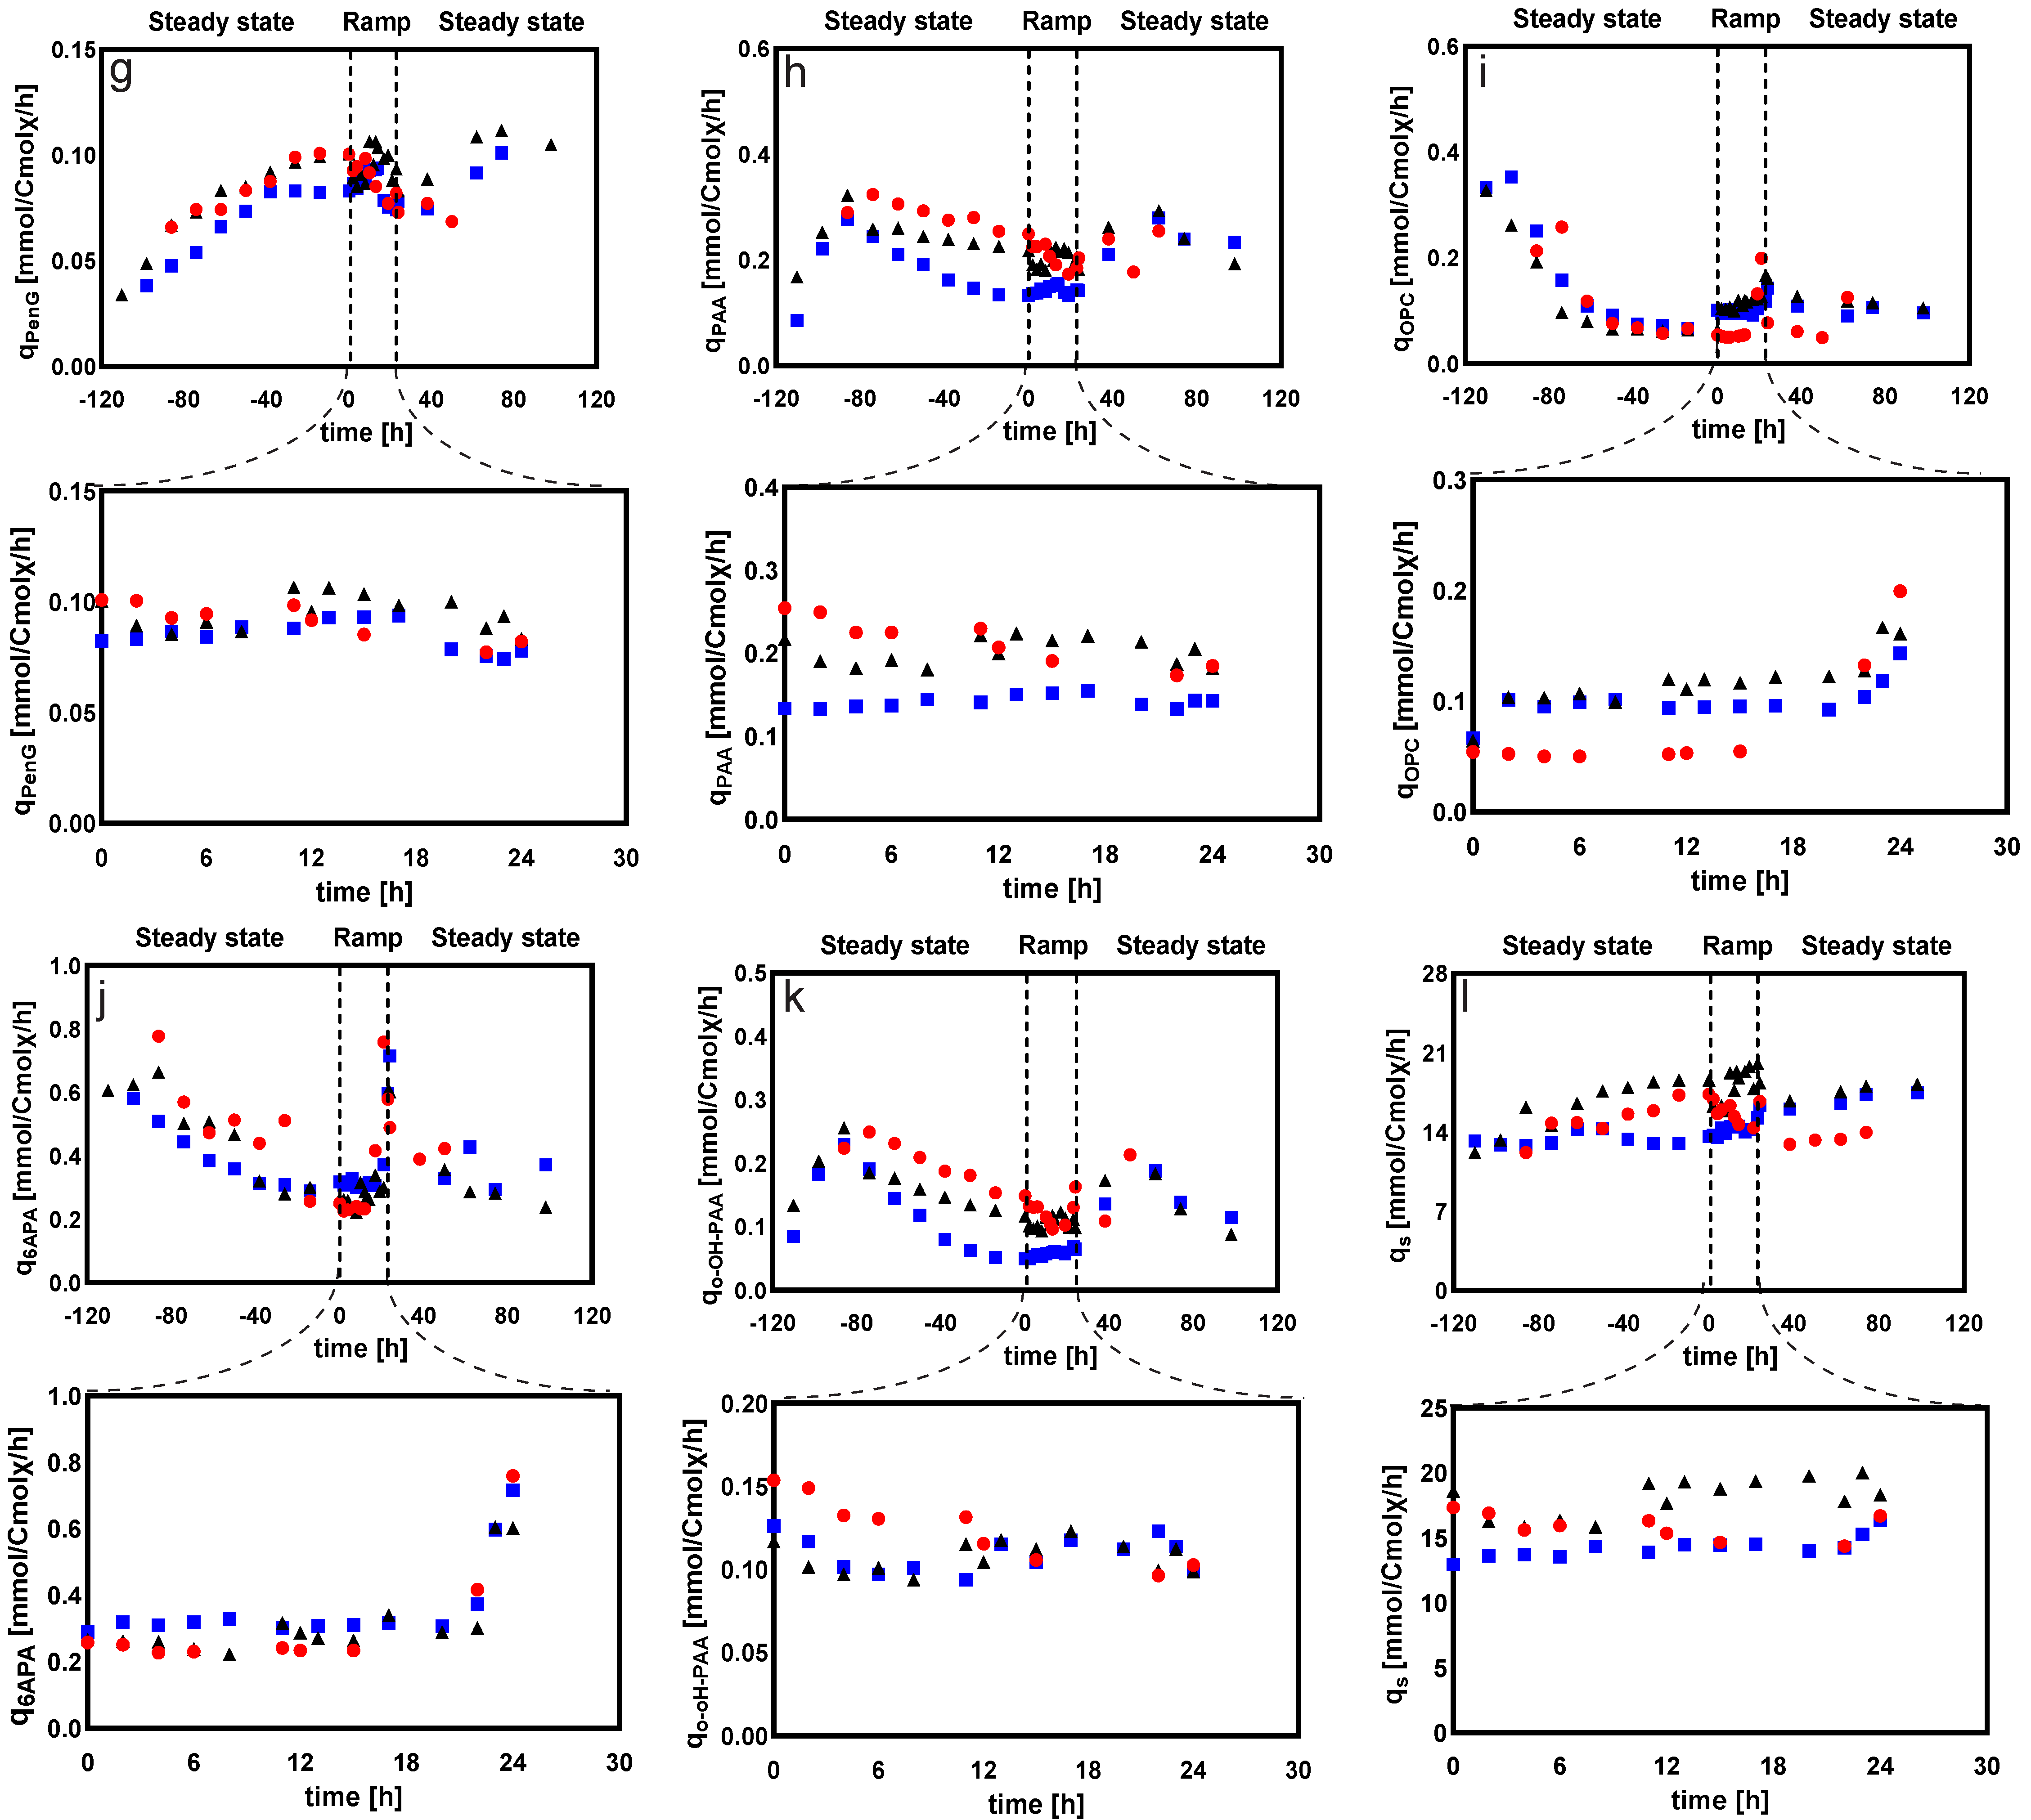
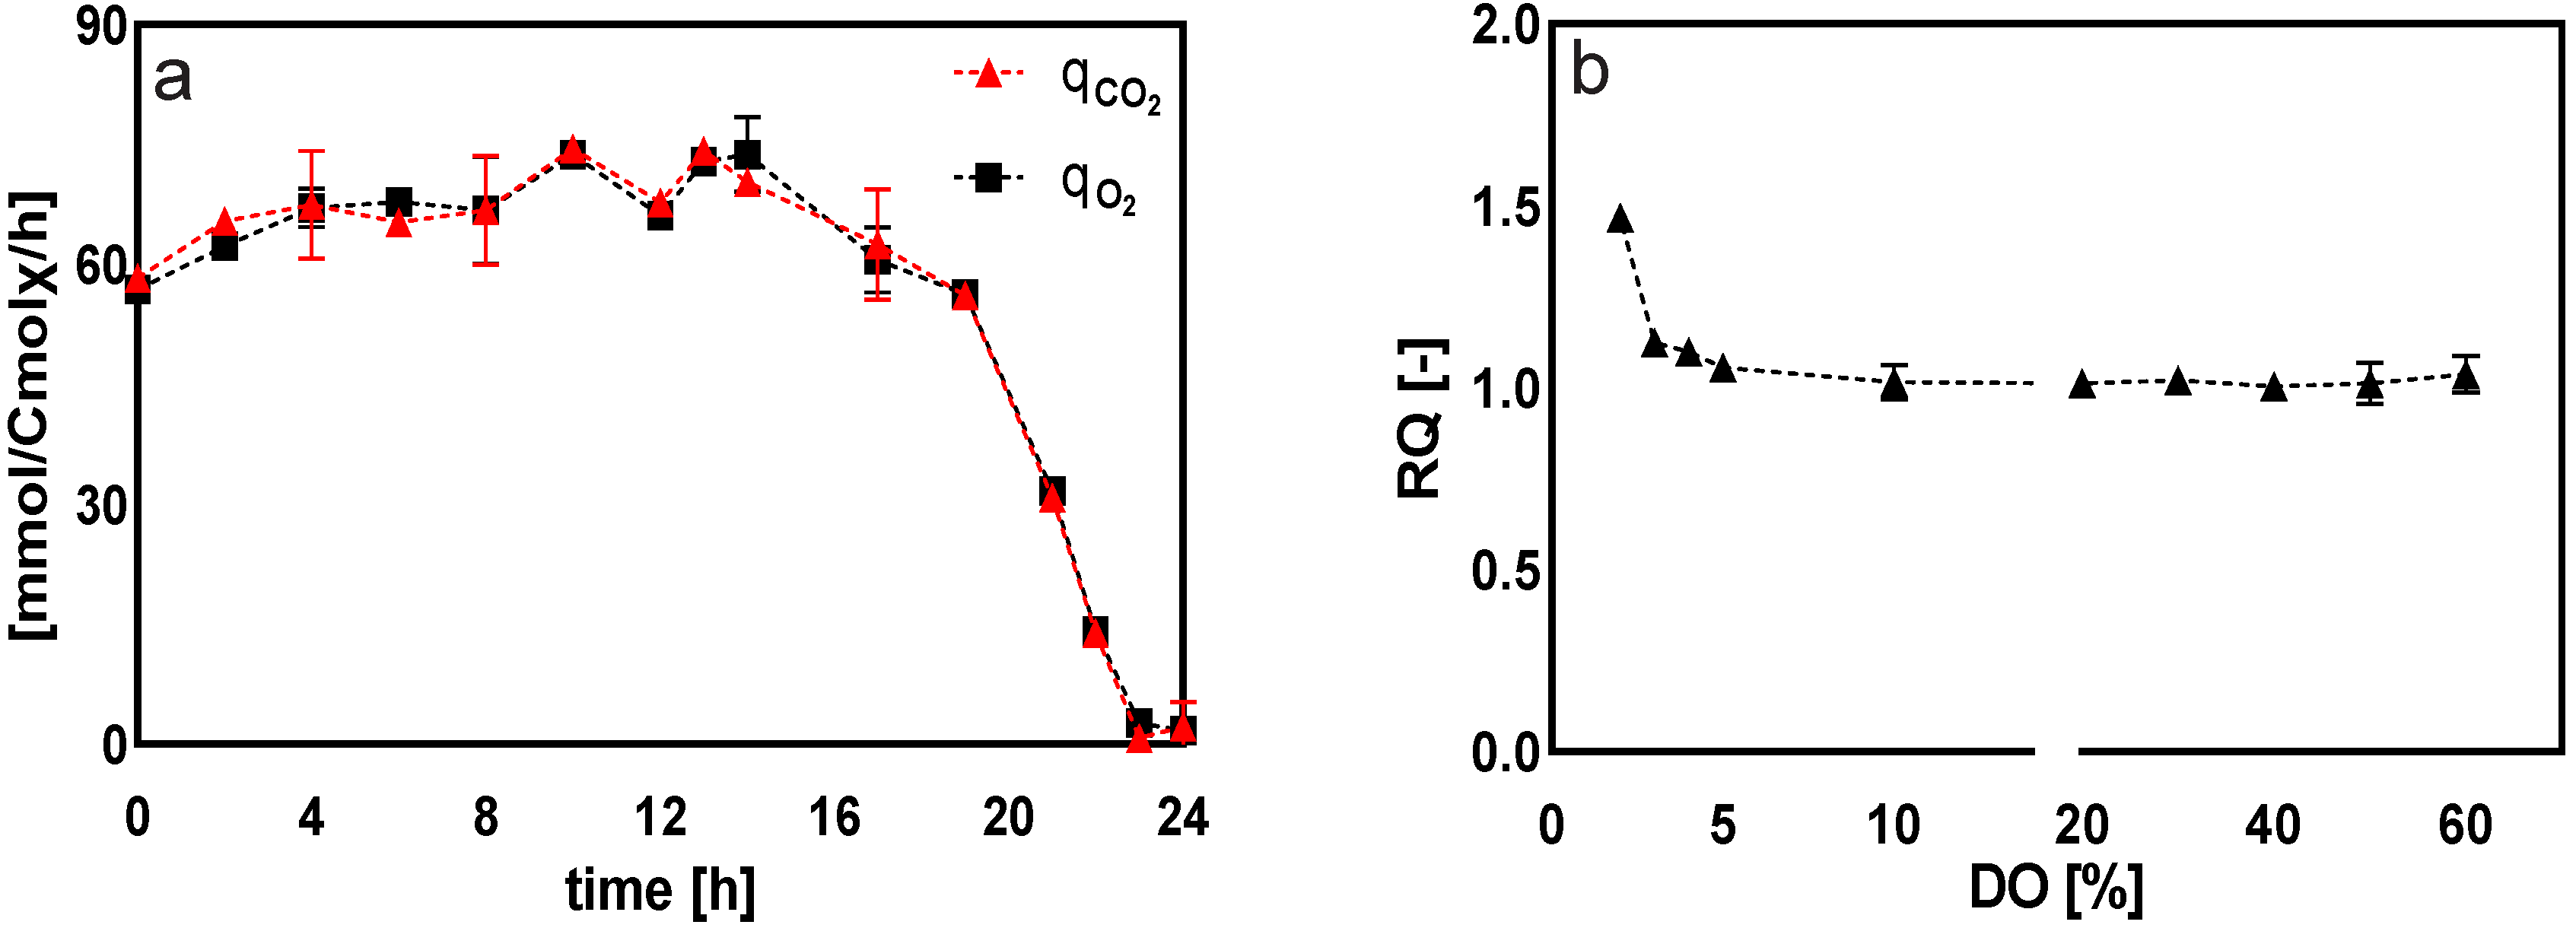
2.2. DO-Ramp Experiments
2.2.1. General Observations
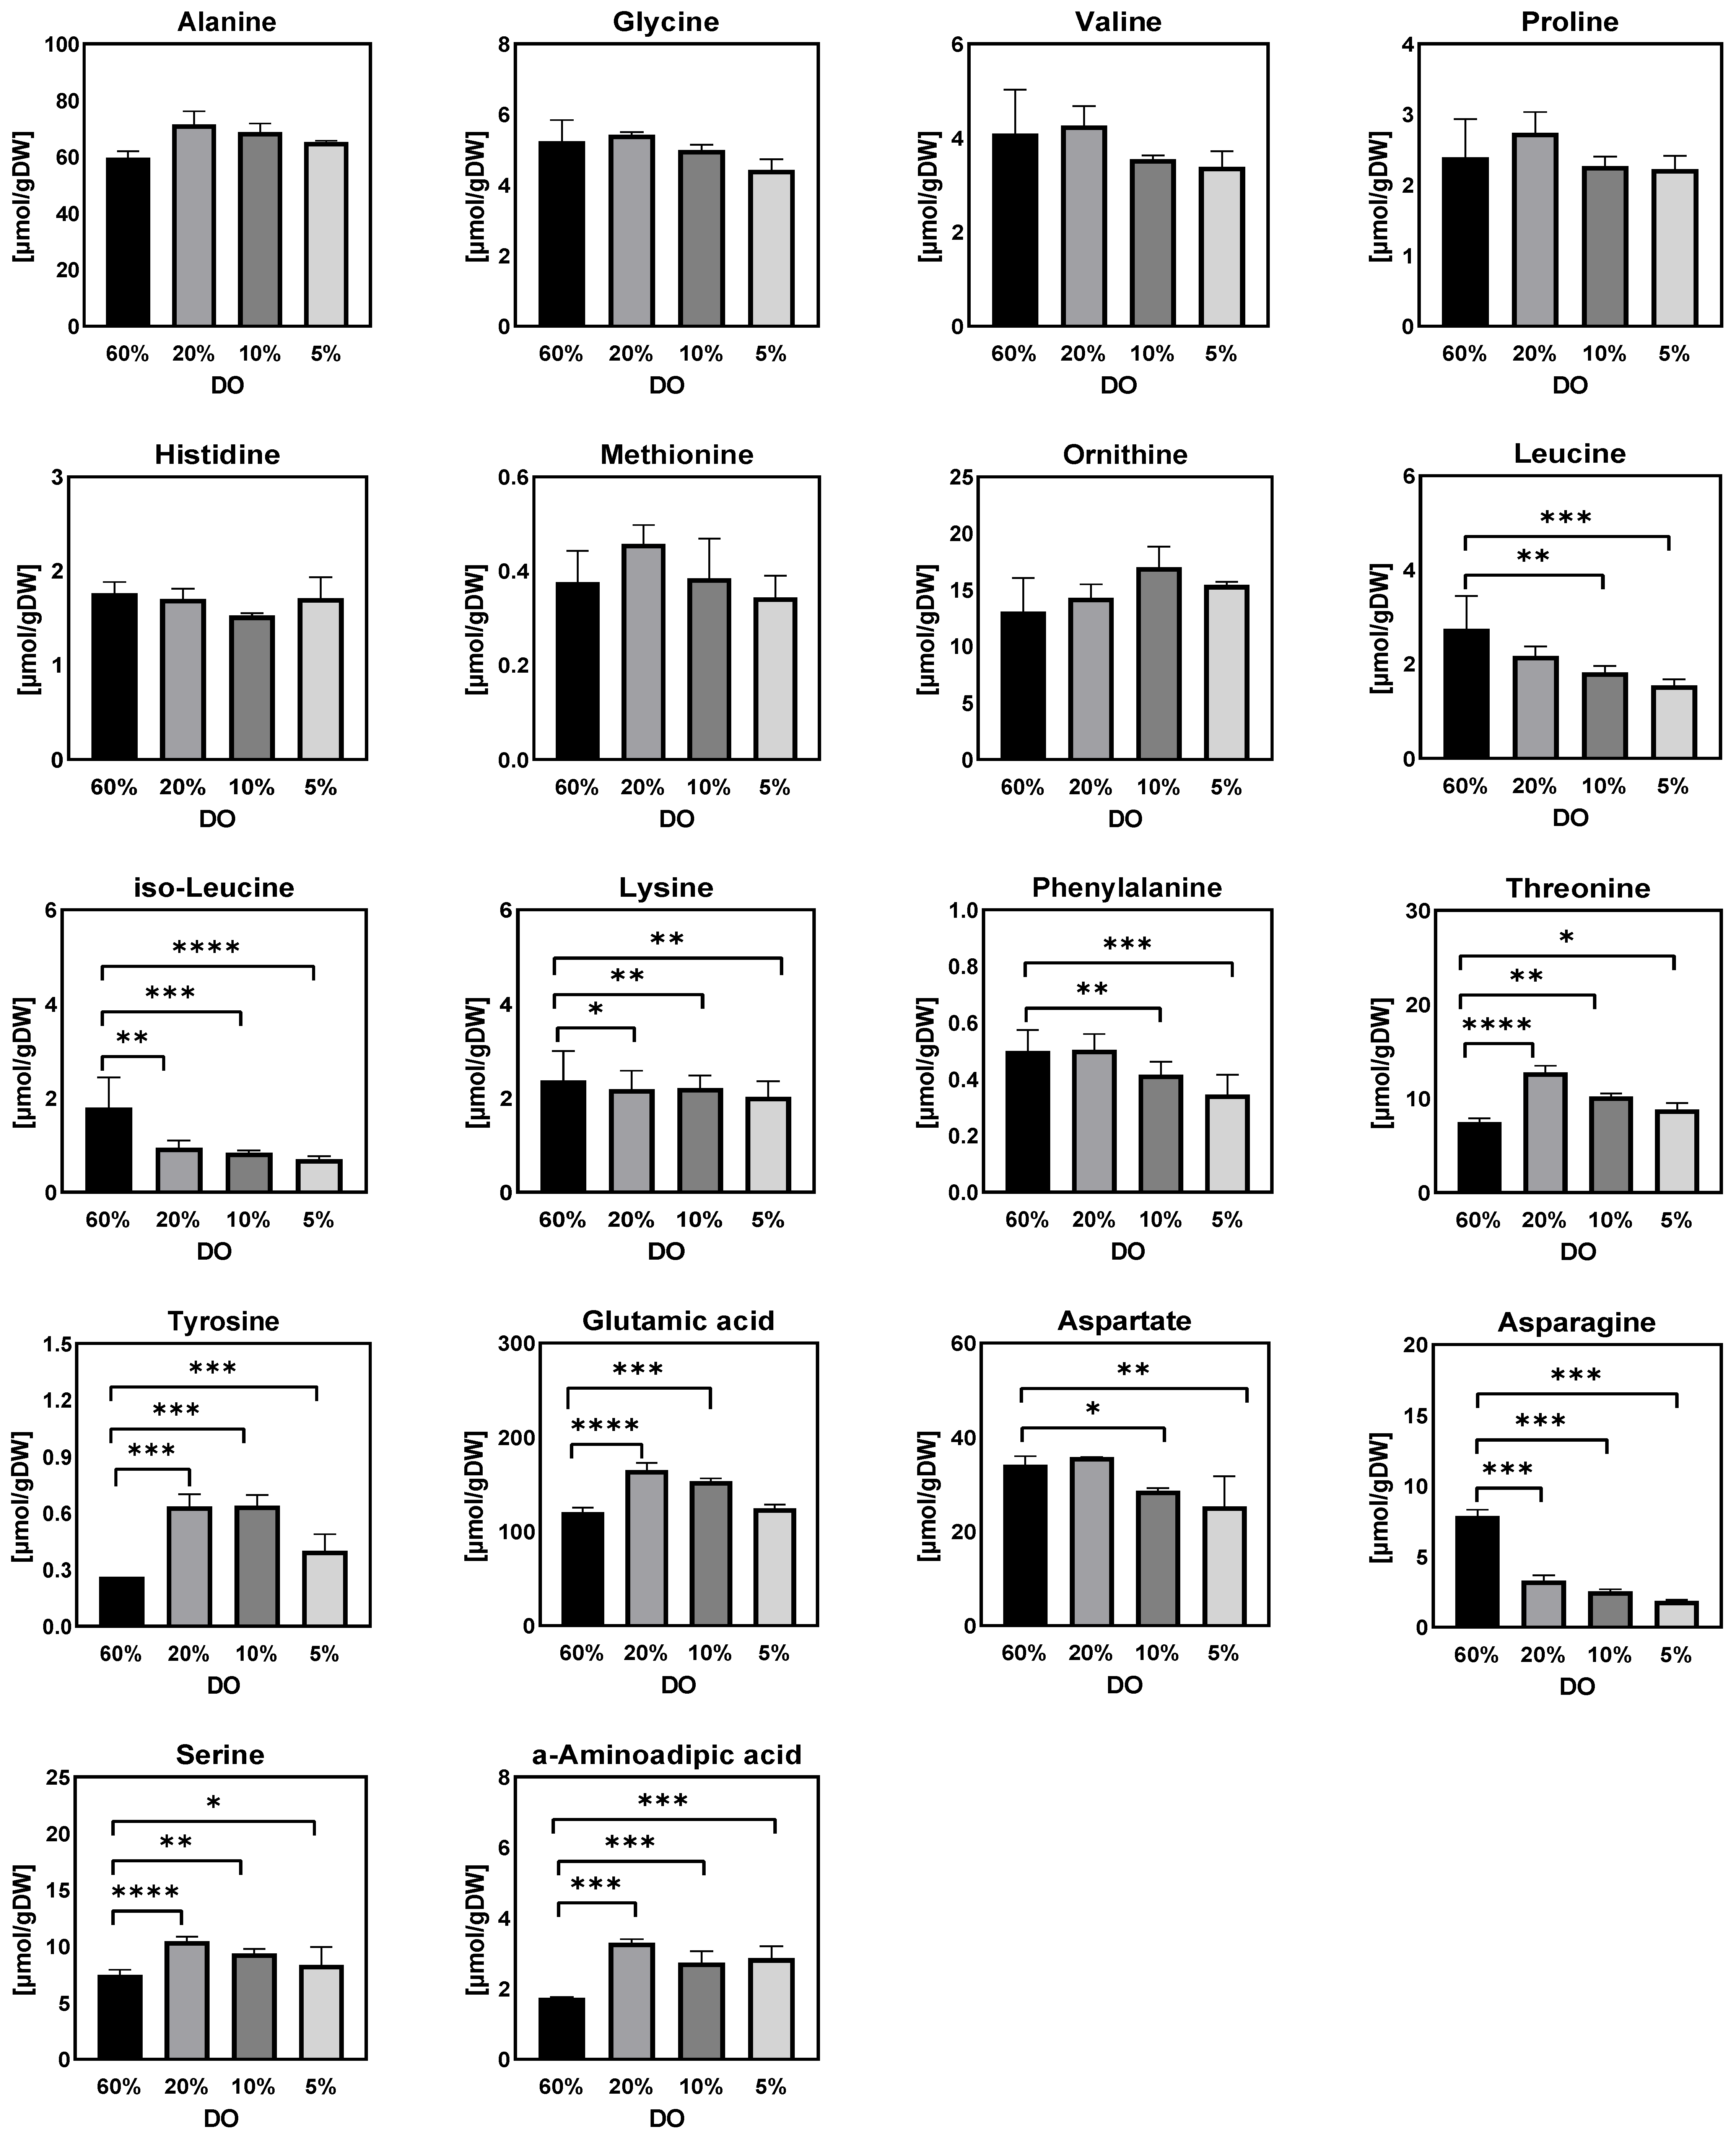
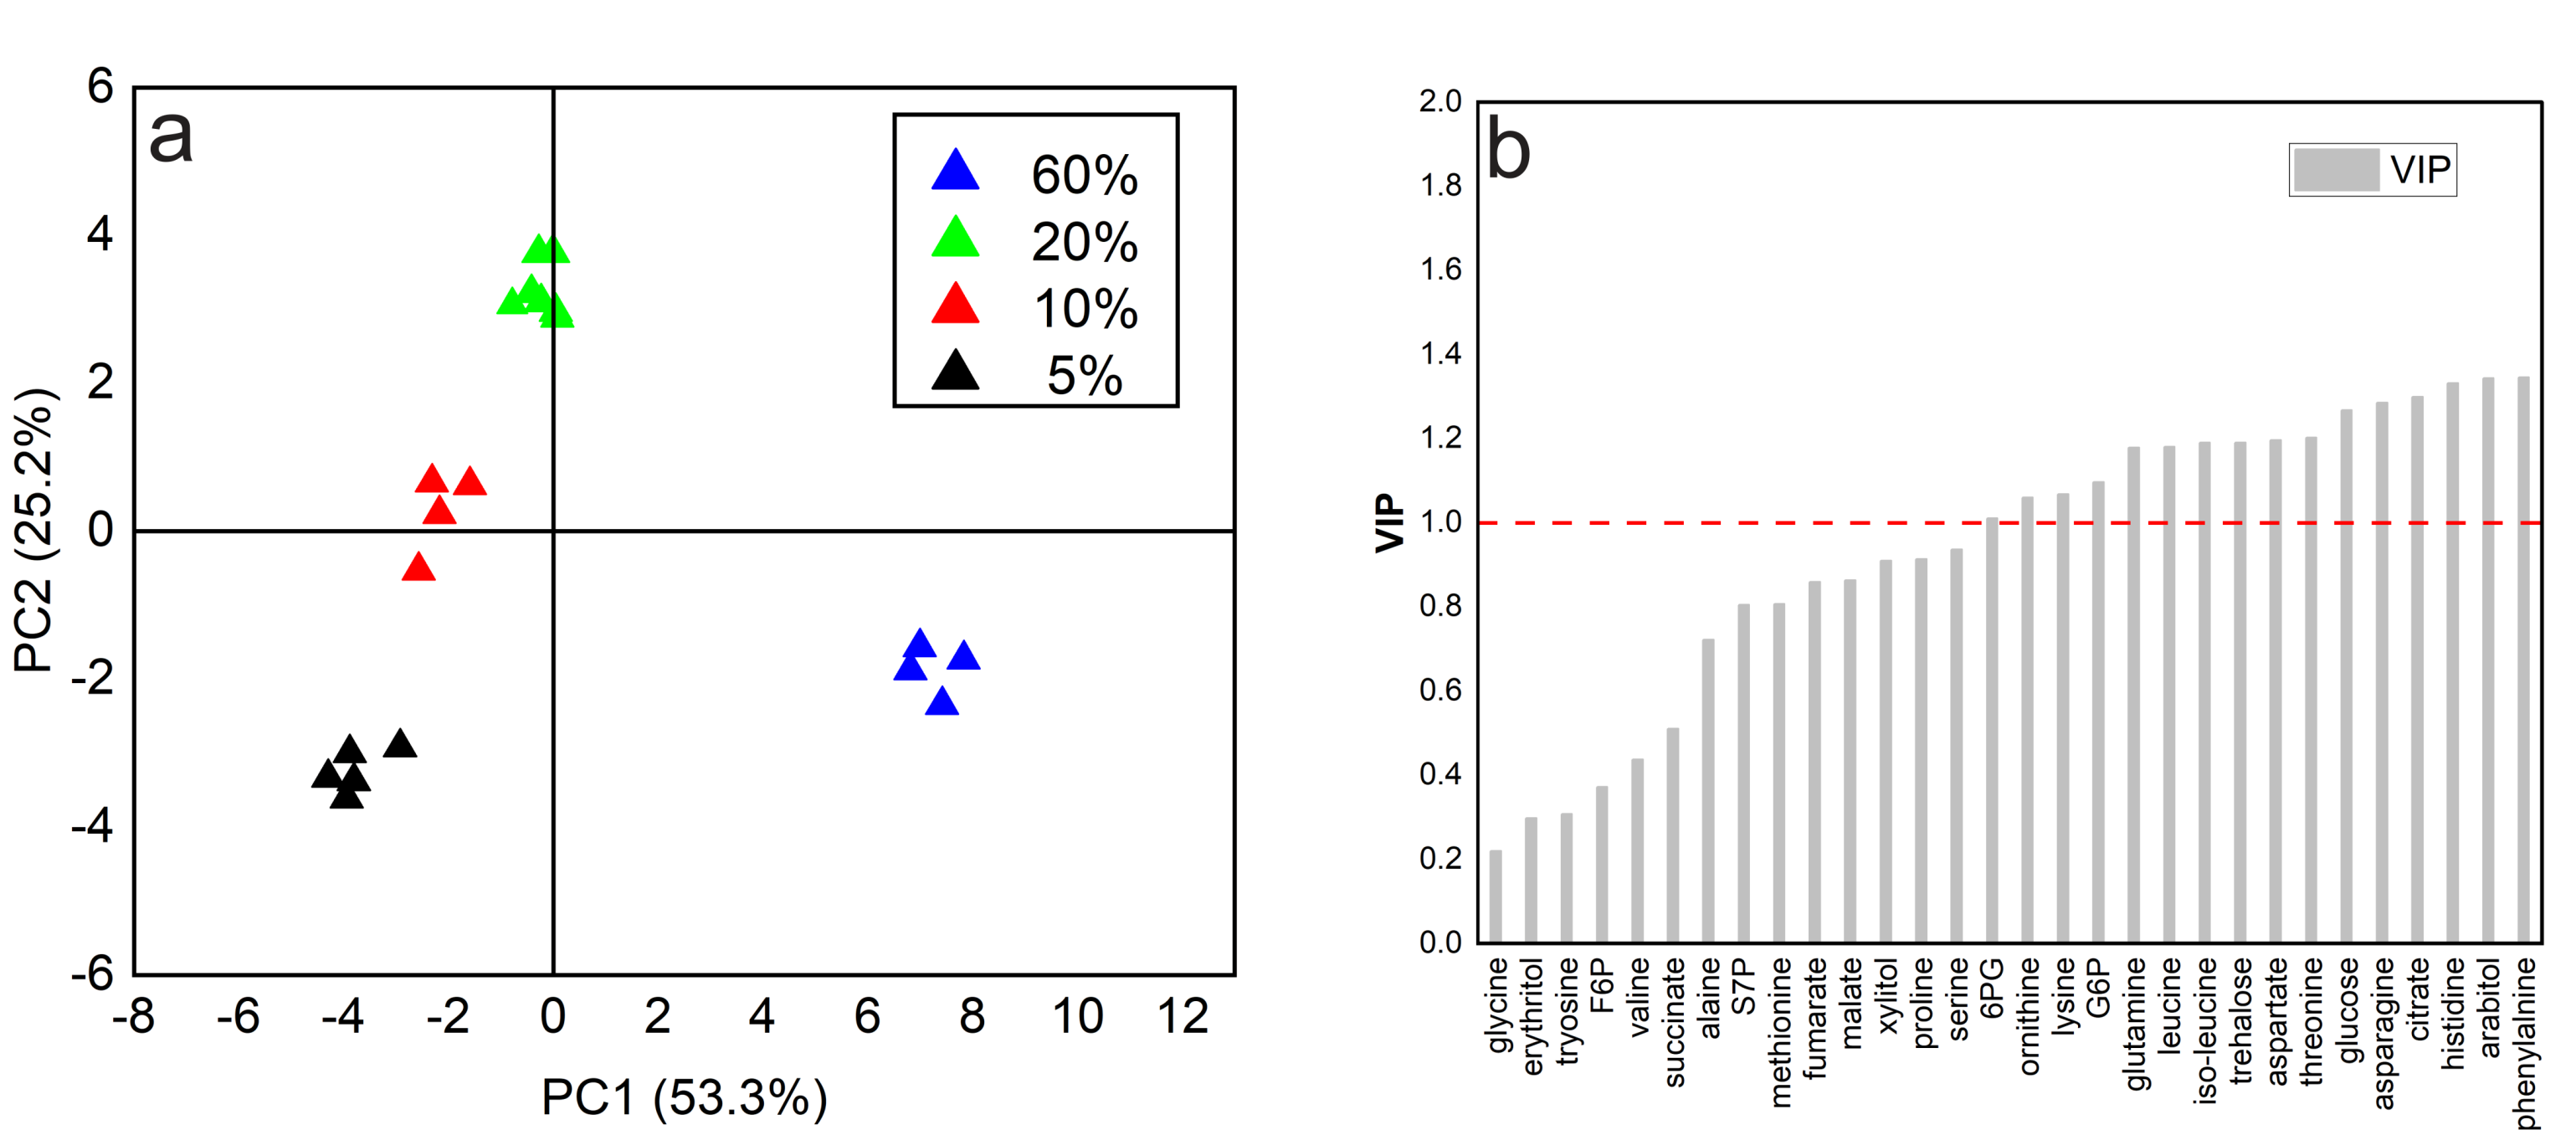
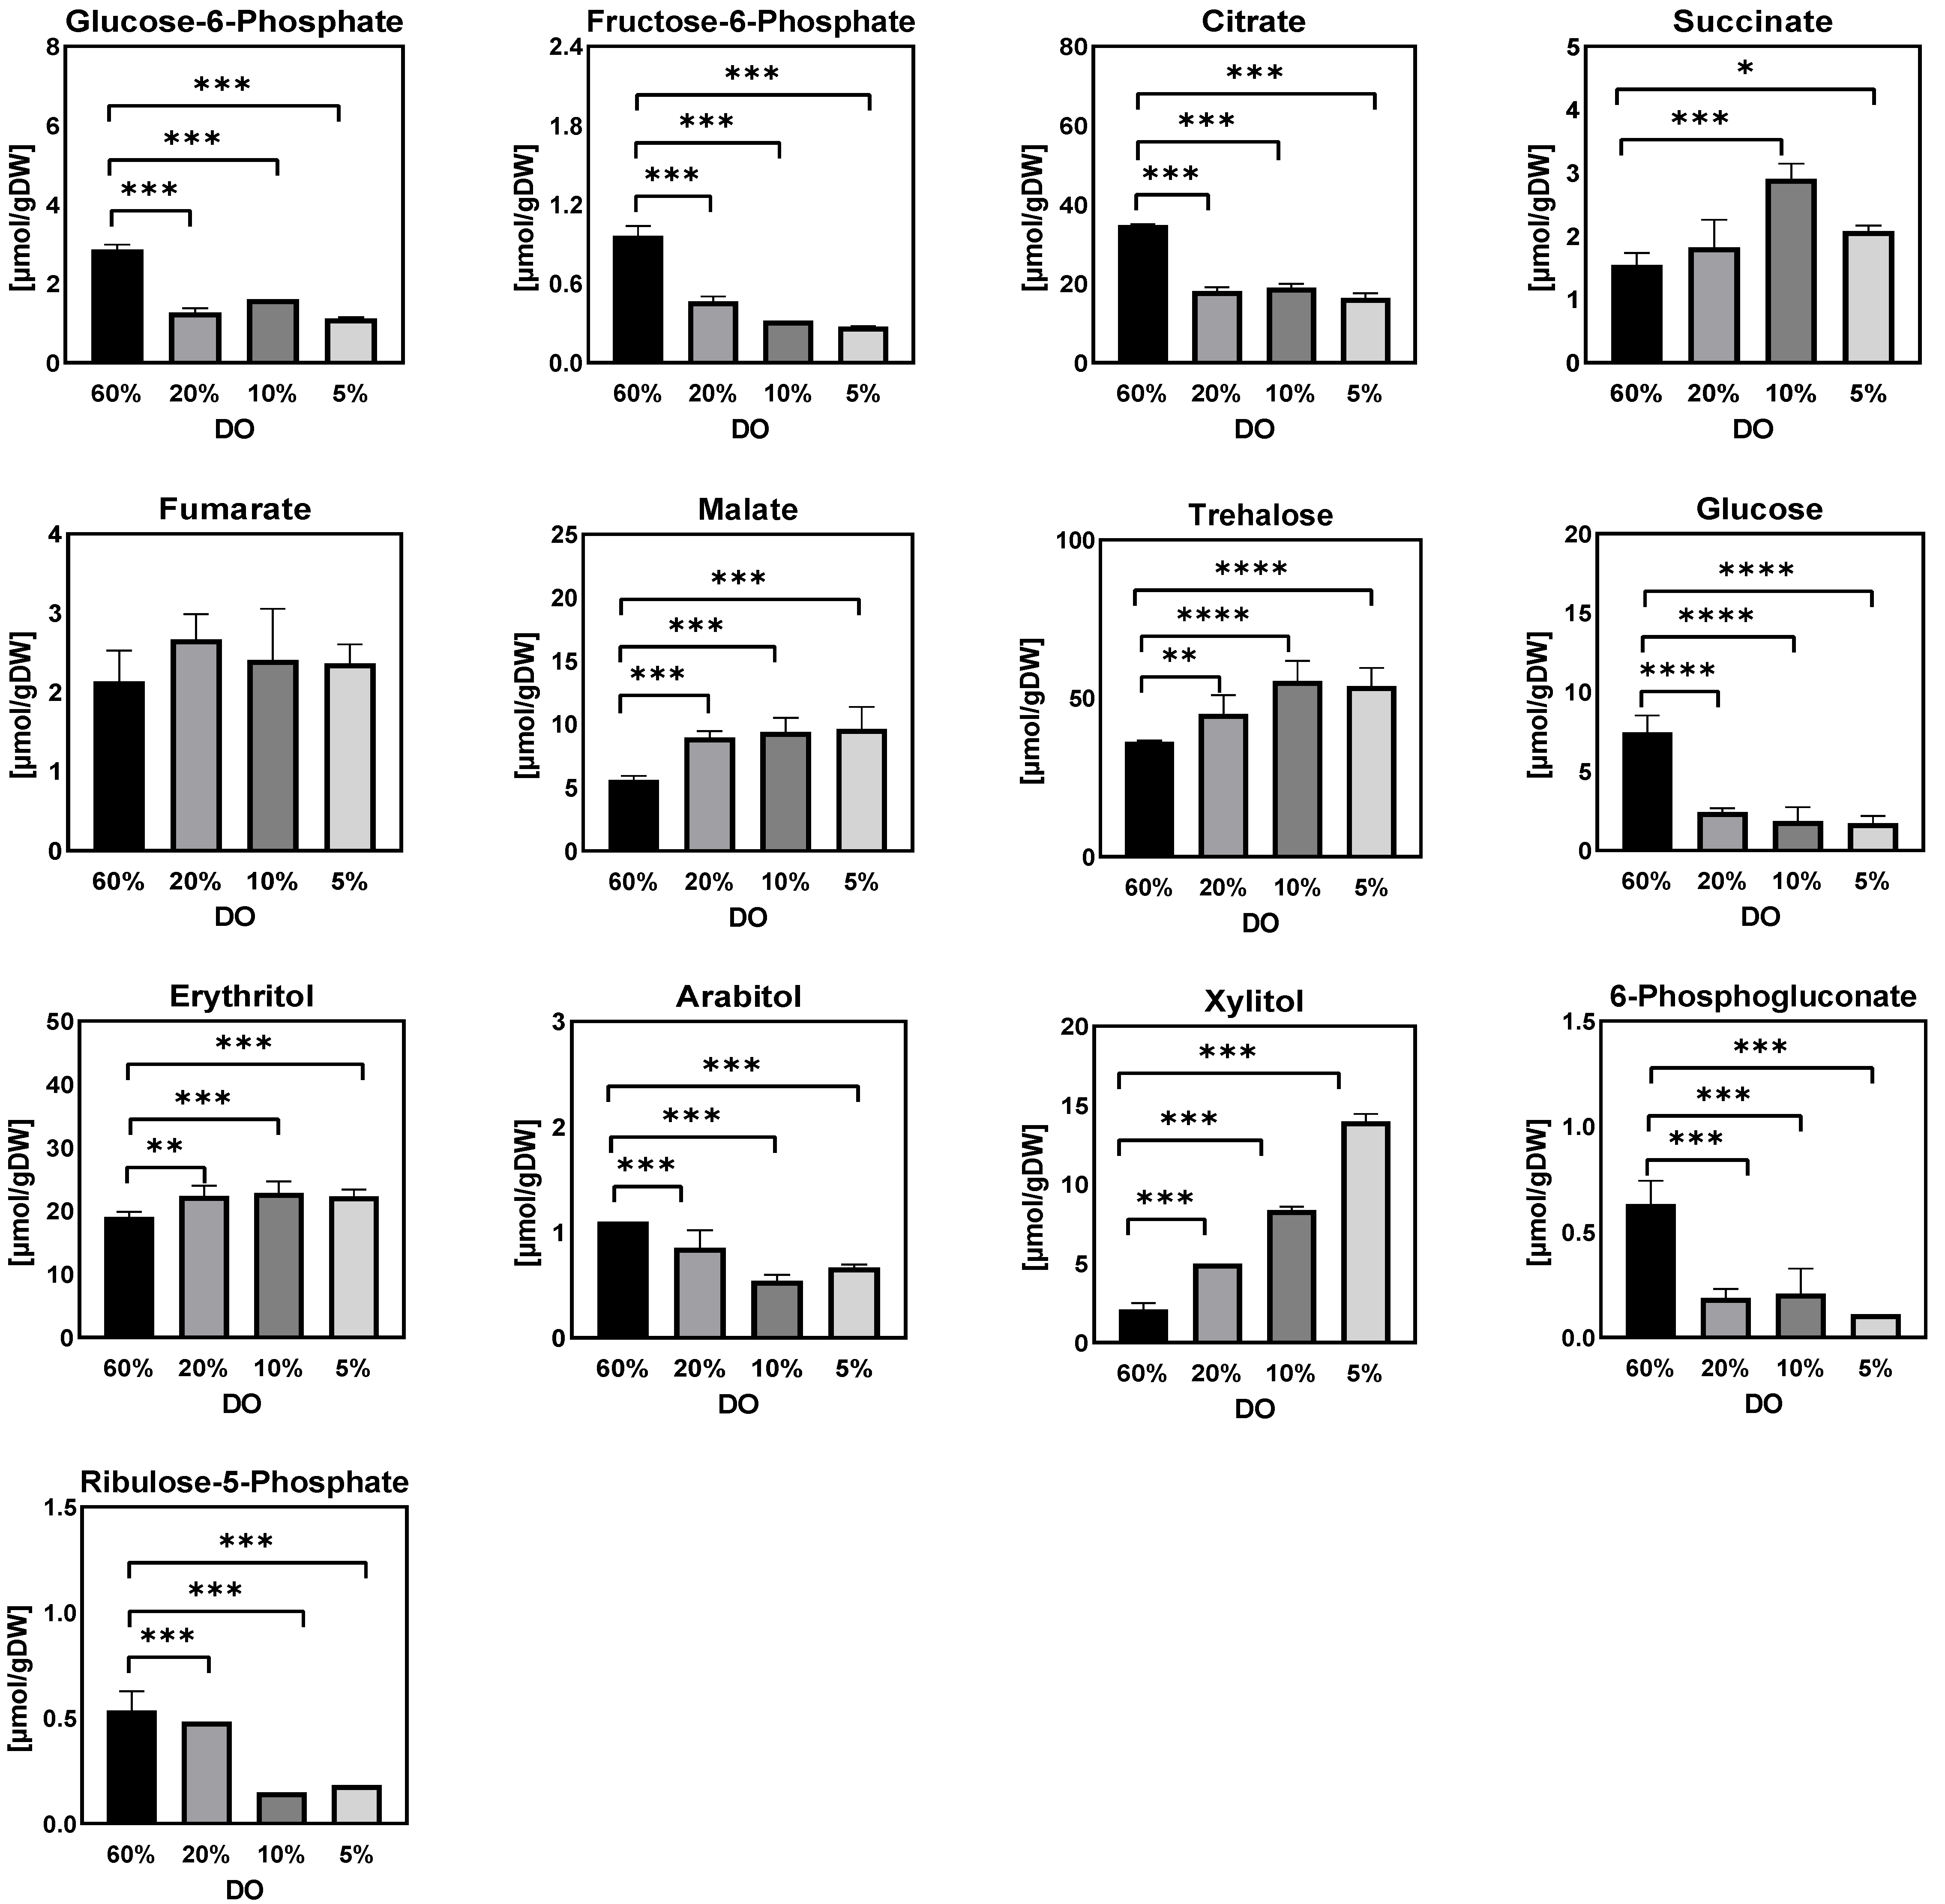
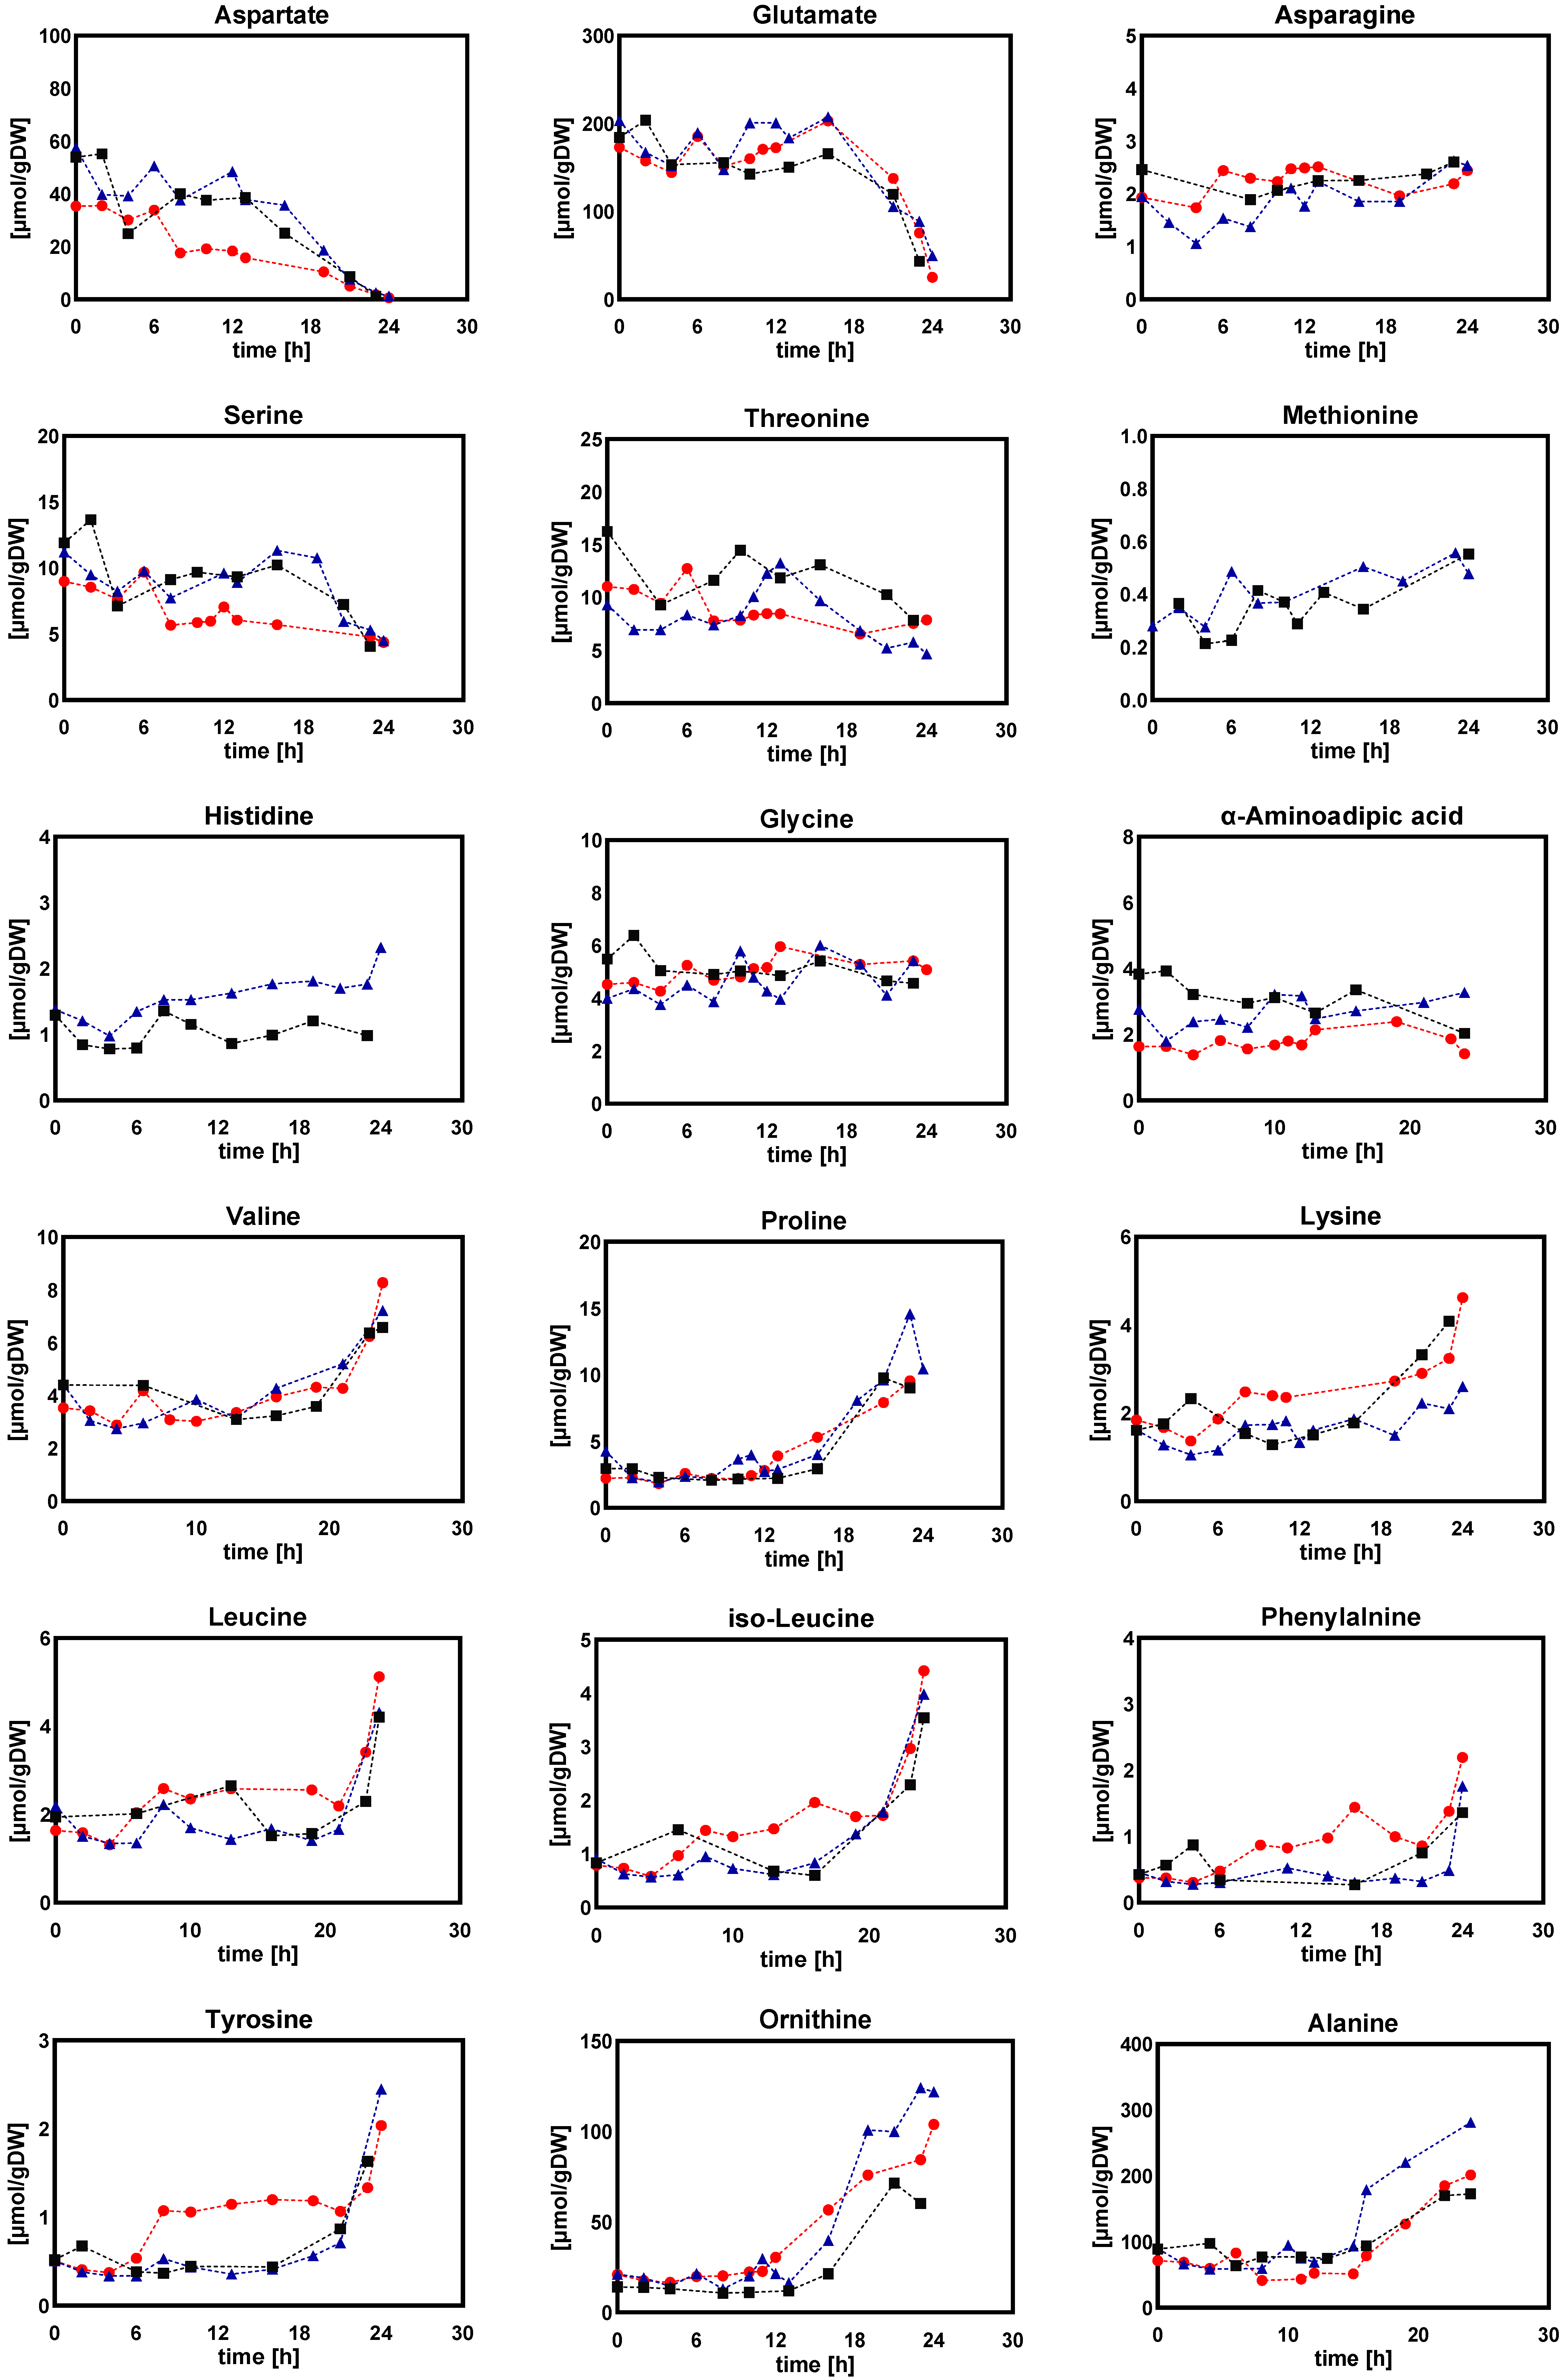
2.2.2. Intracellular and Extracellular Metabolites
Amino Acids
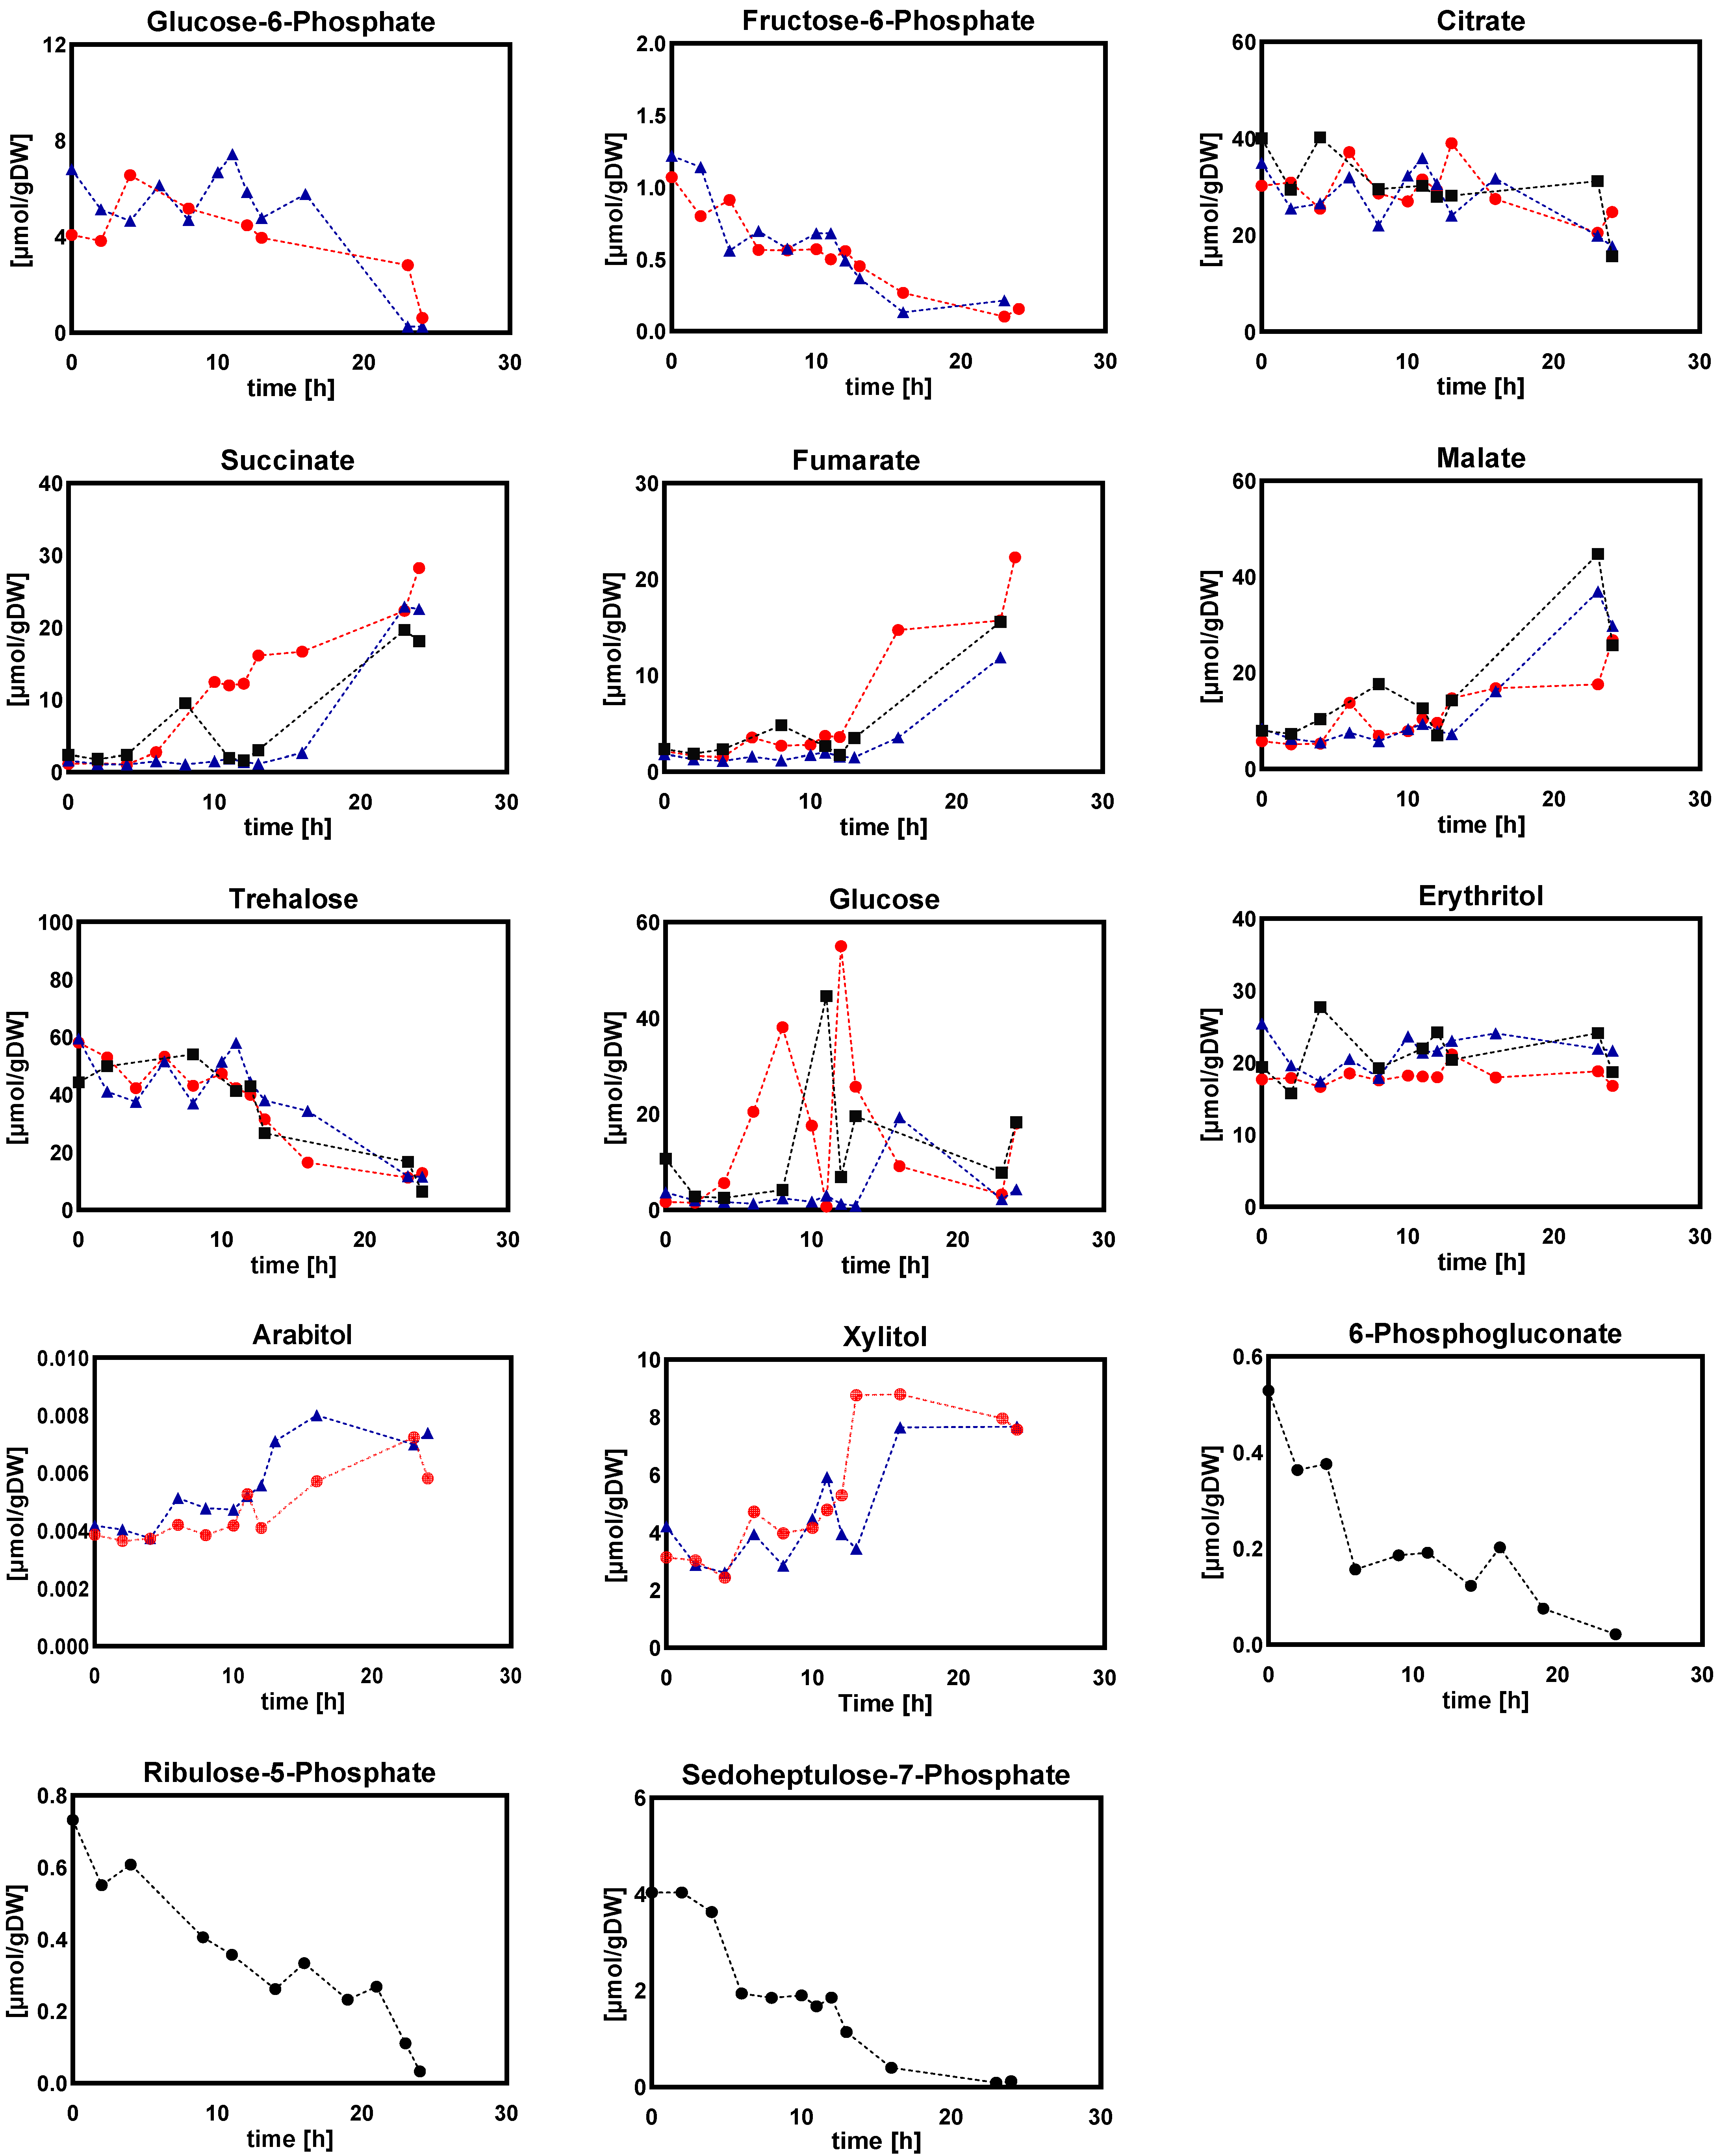
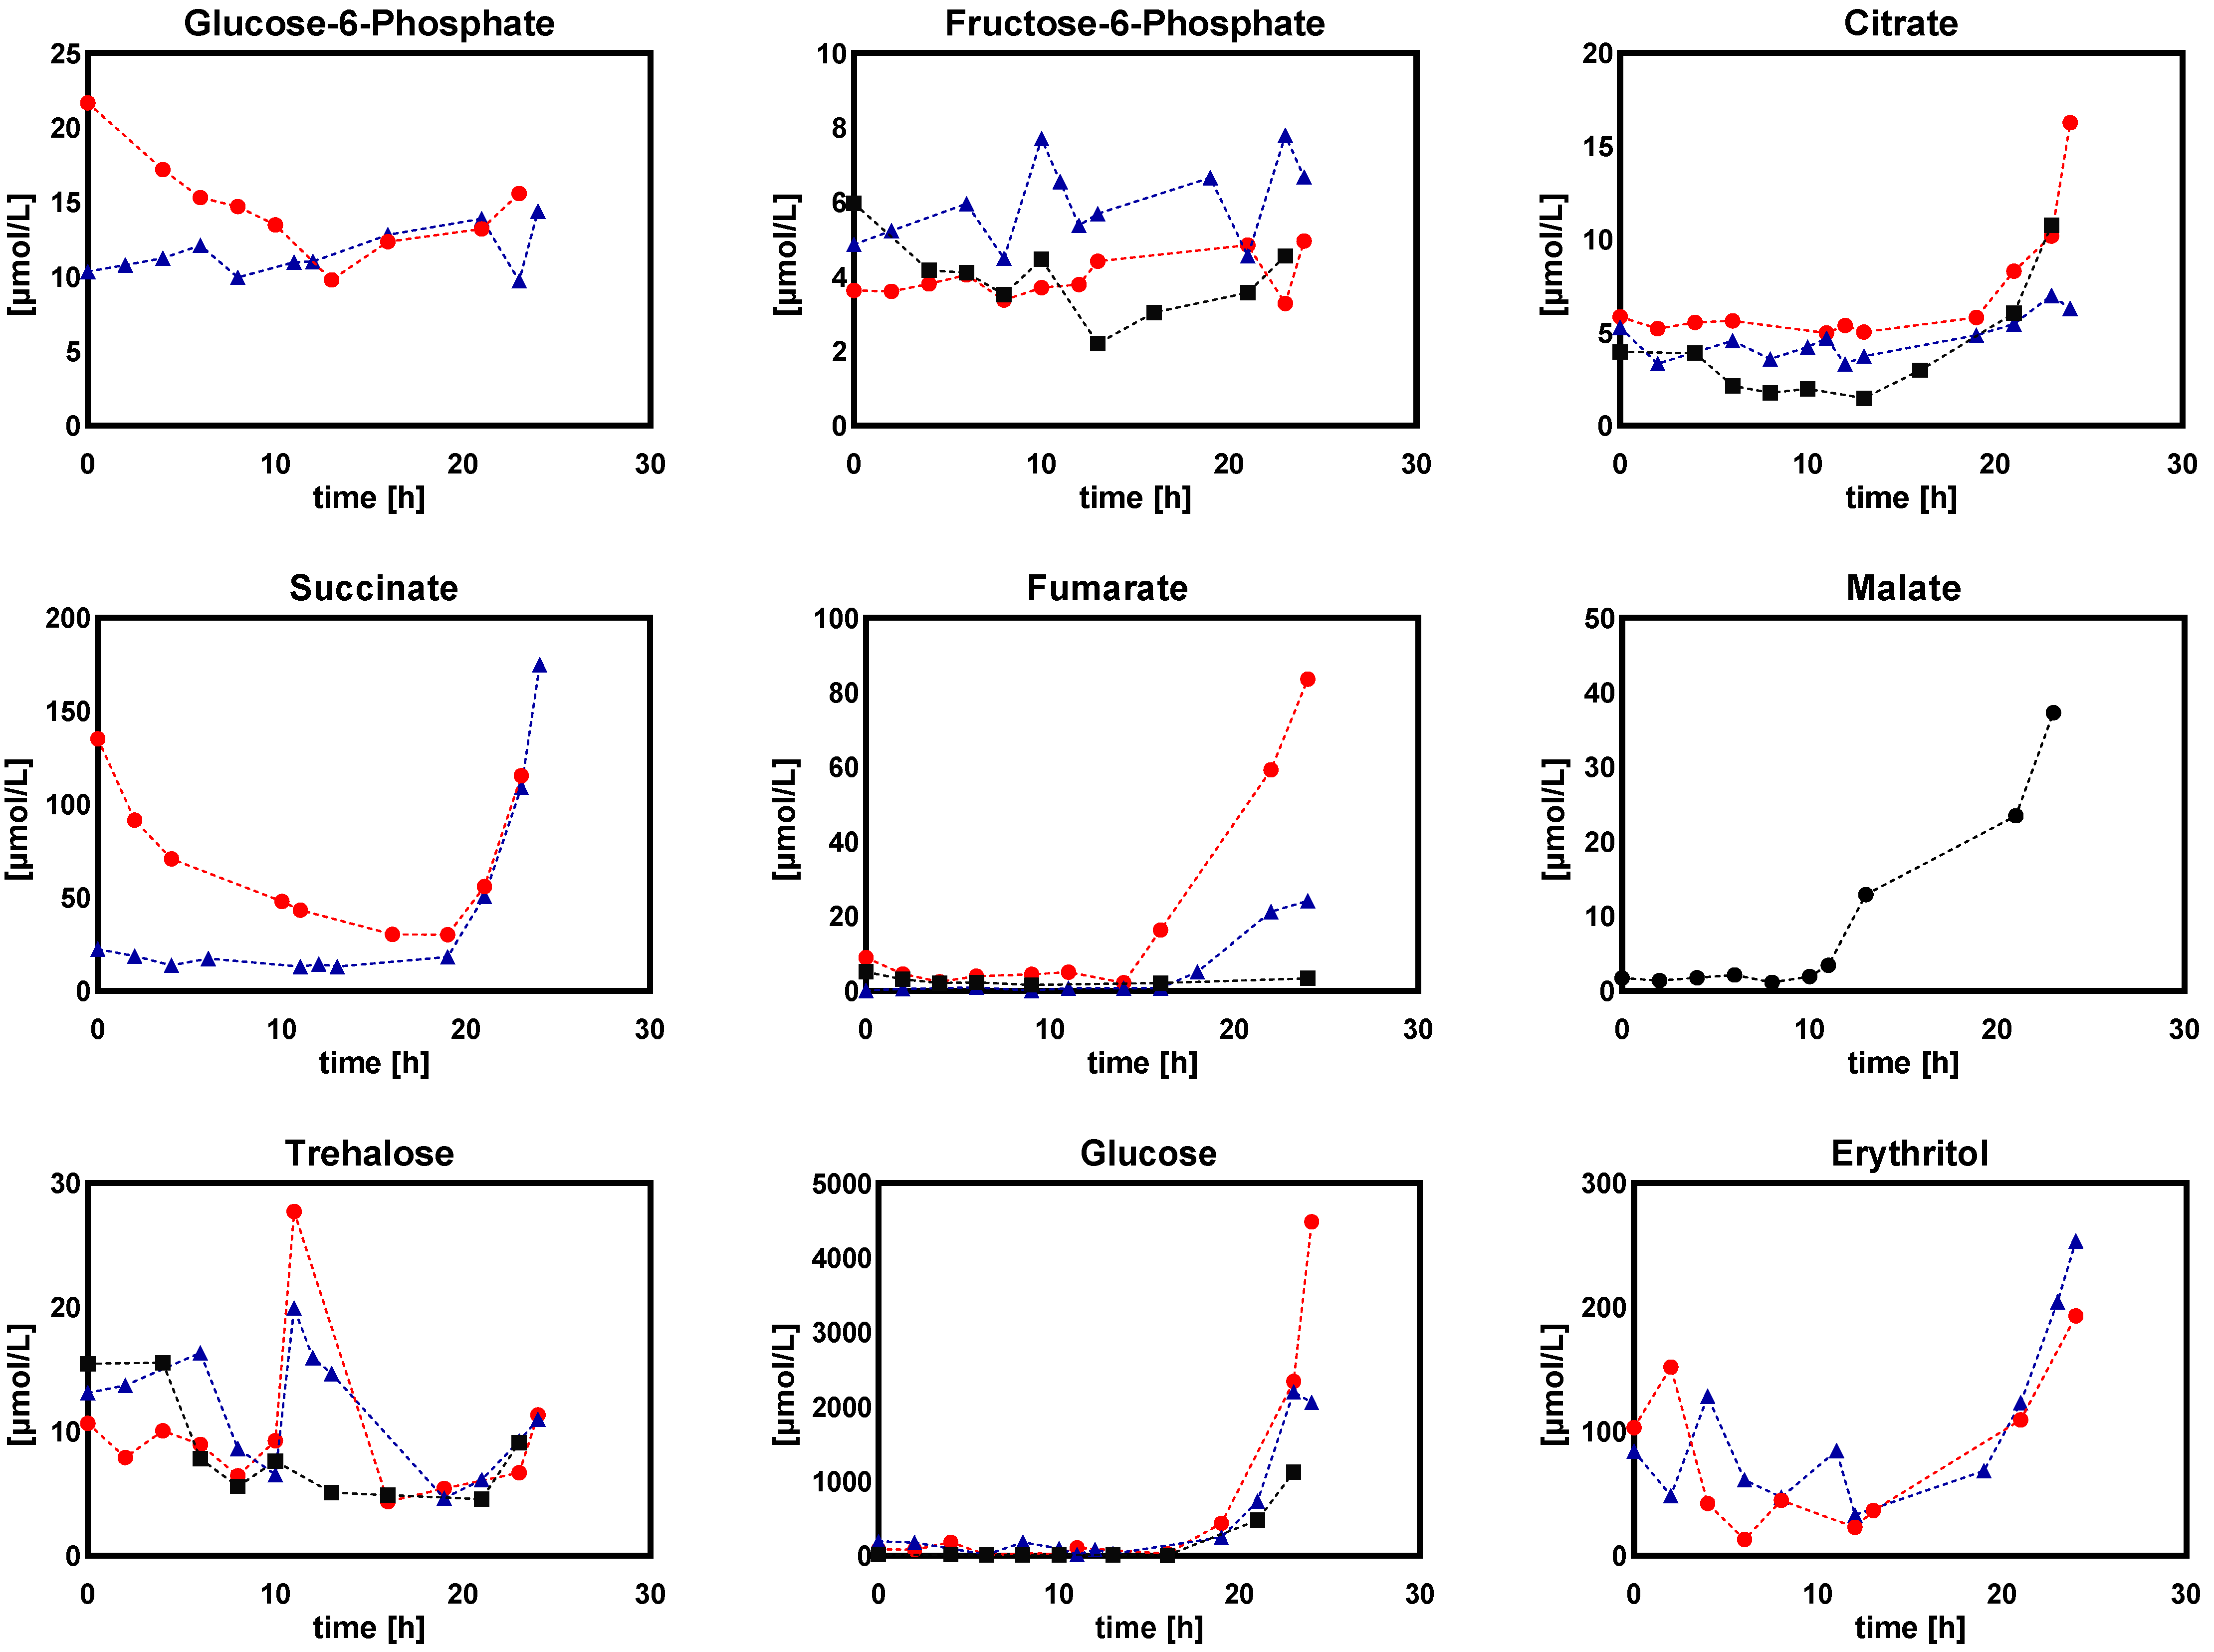
Sugar Phosphates, Organic Acids, and Sugar Alcohols
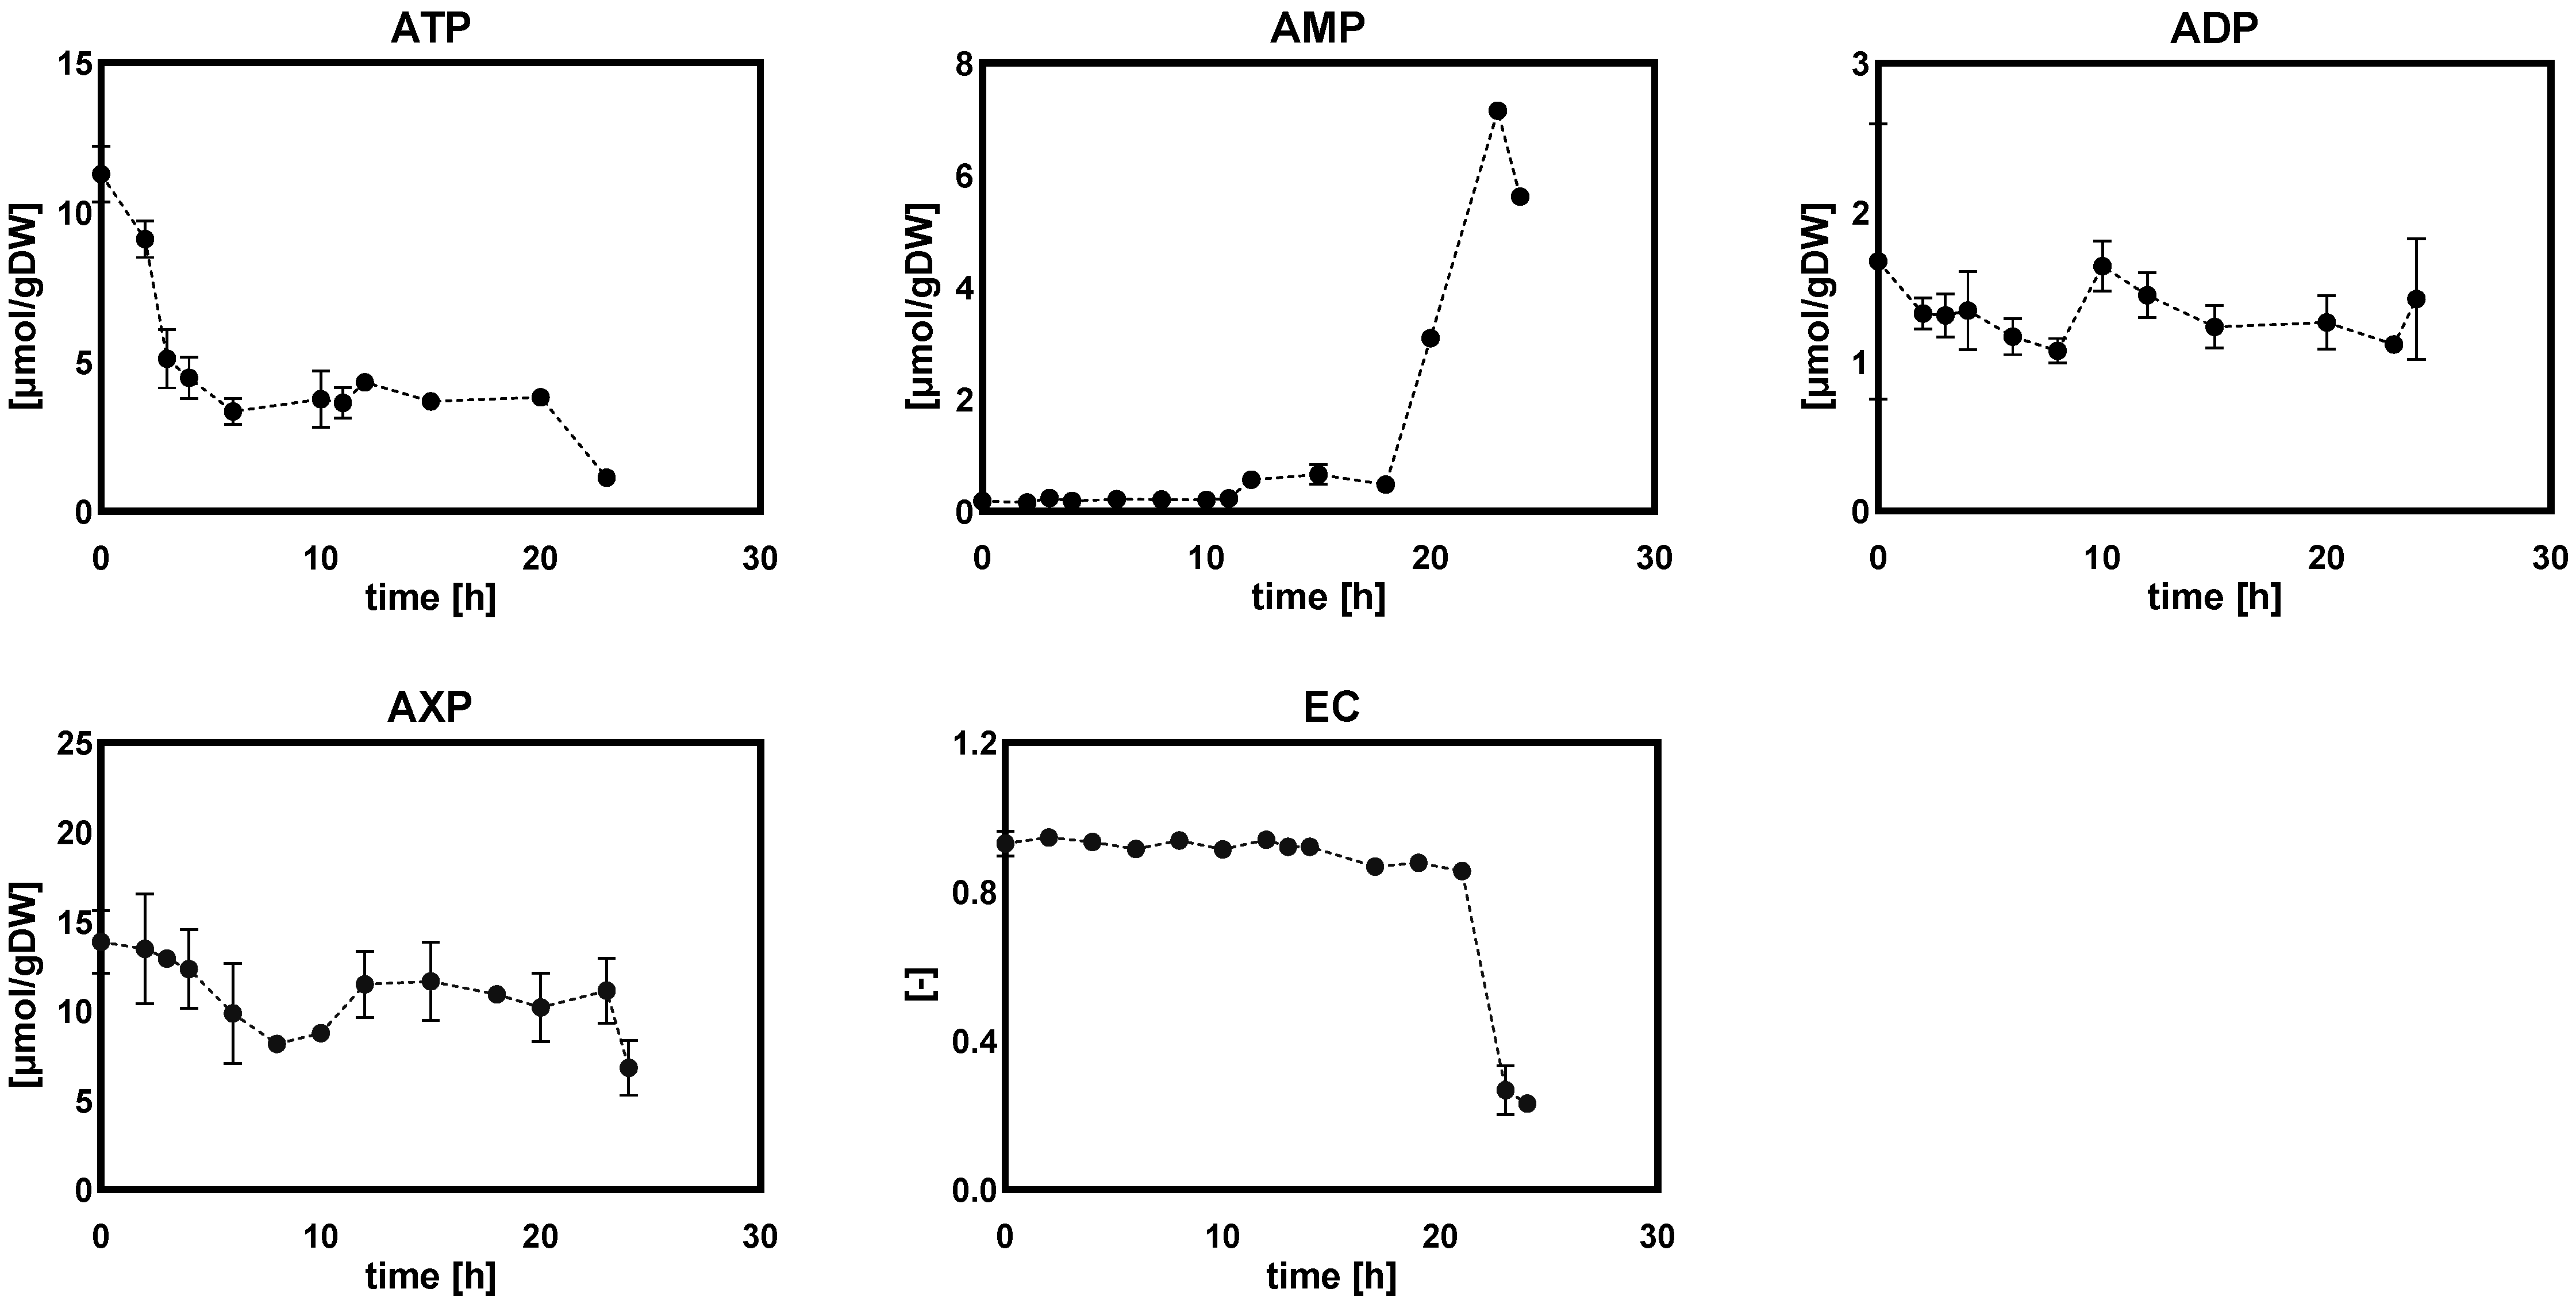
Adenine Nucleotides and Energy Charges
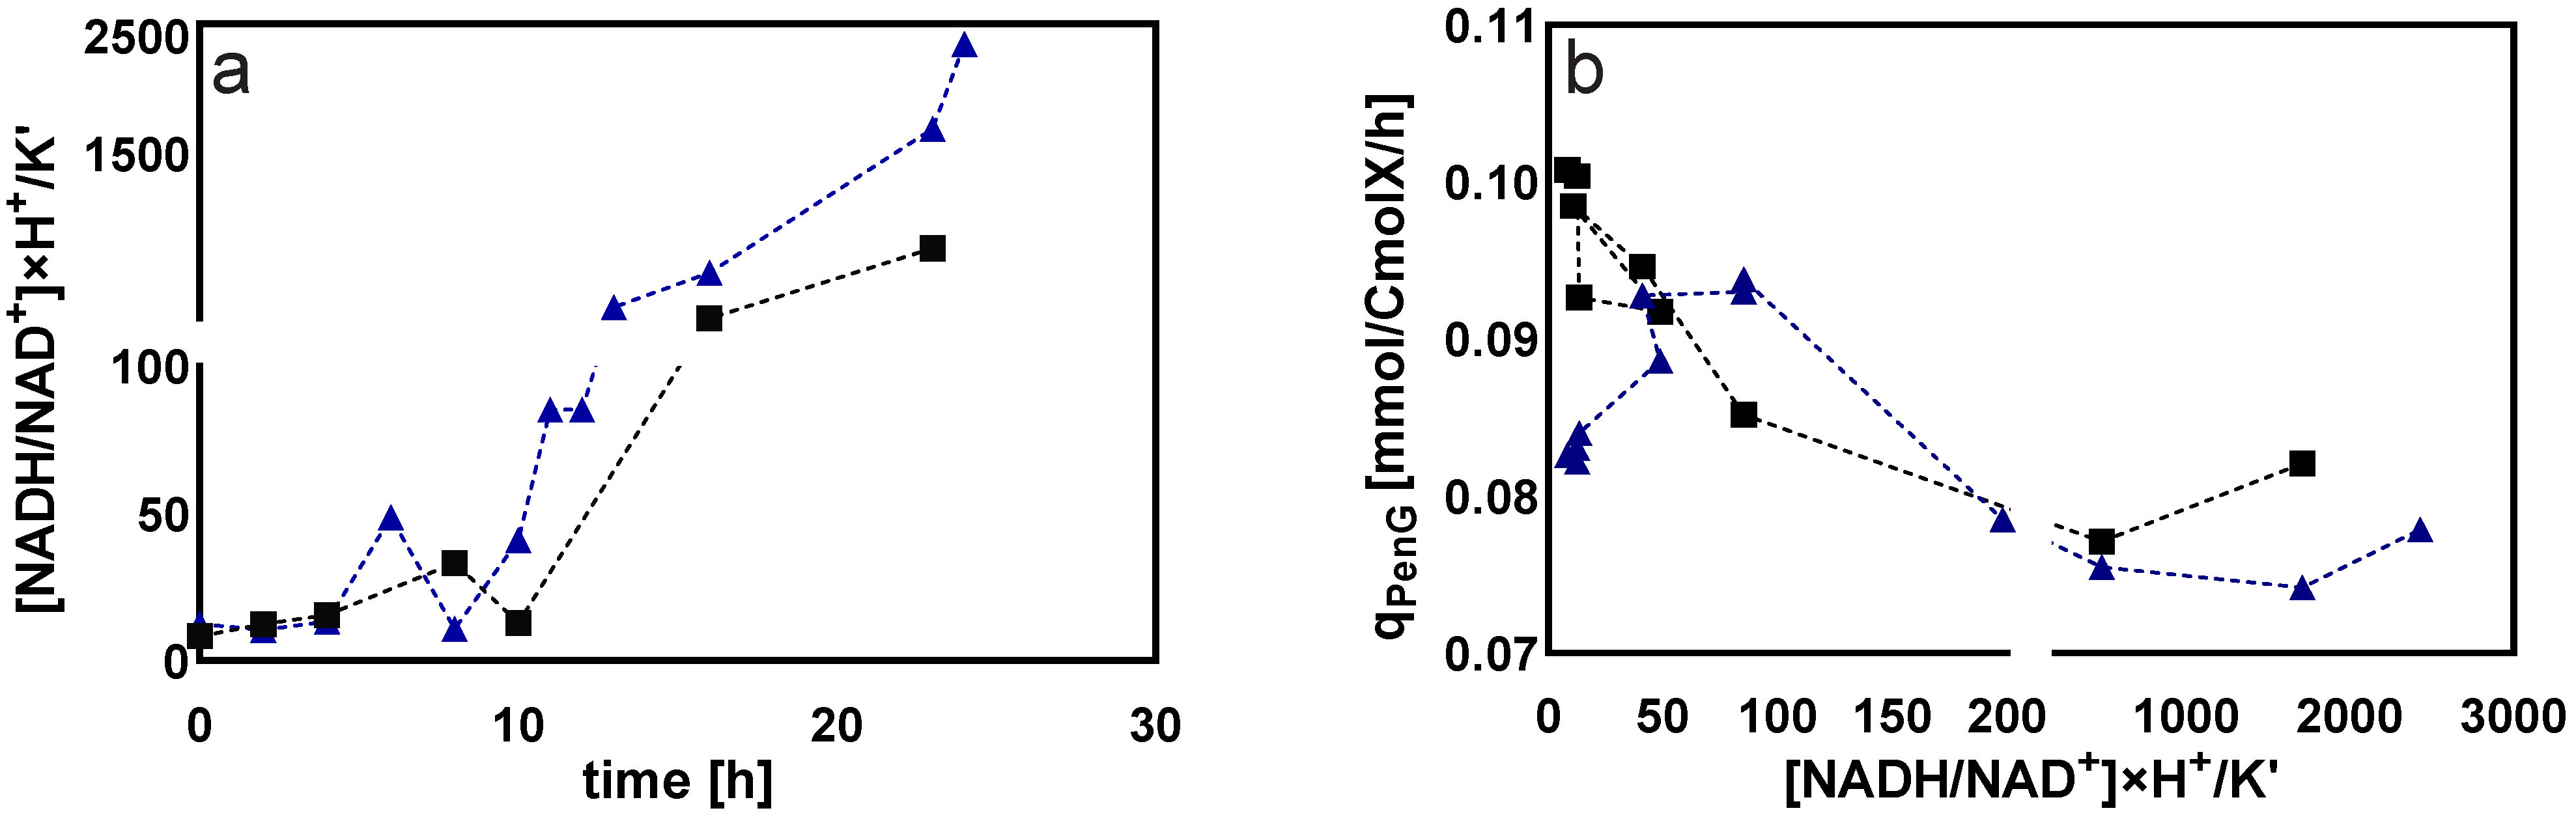
Cytosolic Redox Status
Extracellular Sugar Phosphates, Organic Acids, and Sugar Alcohols
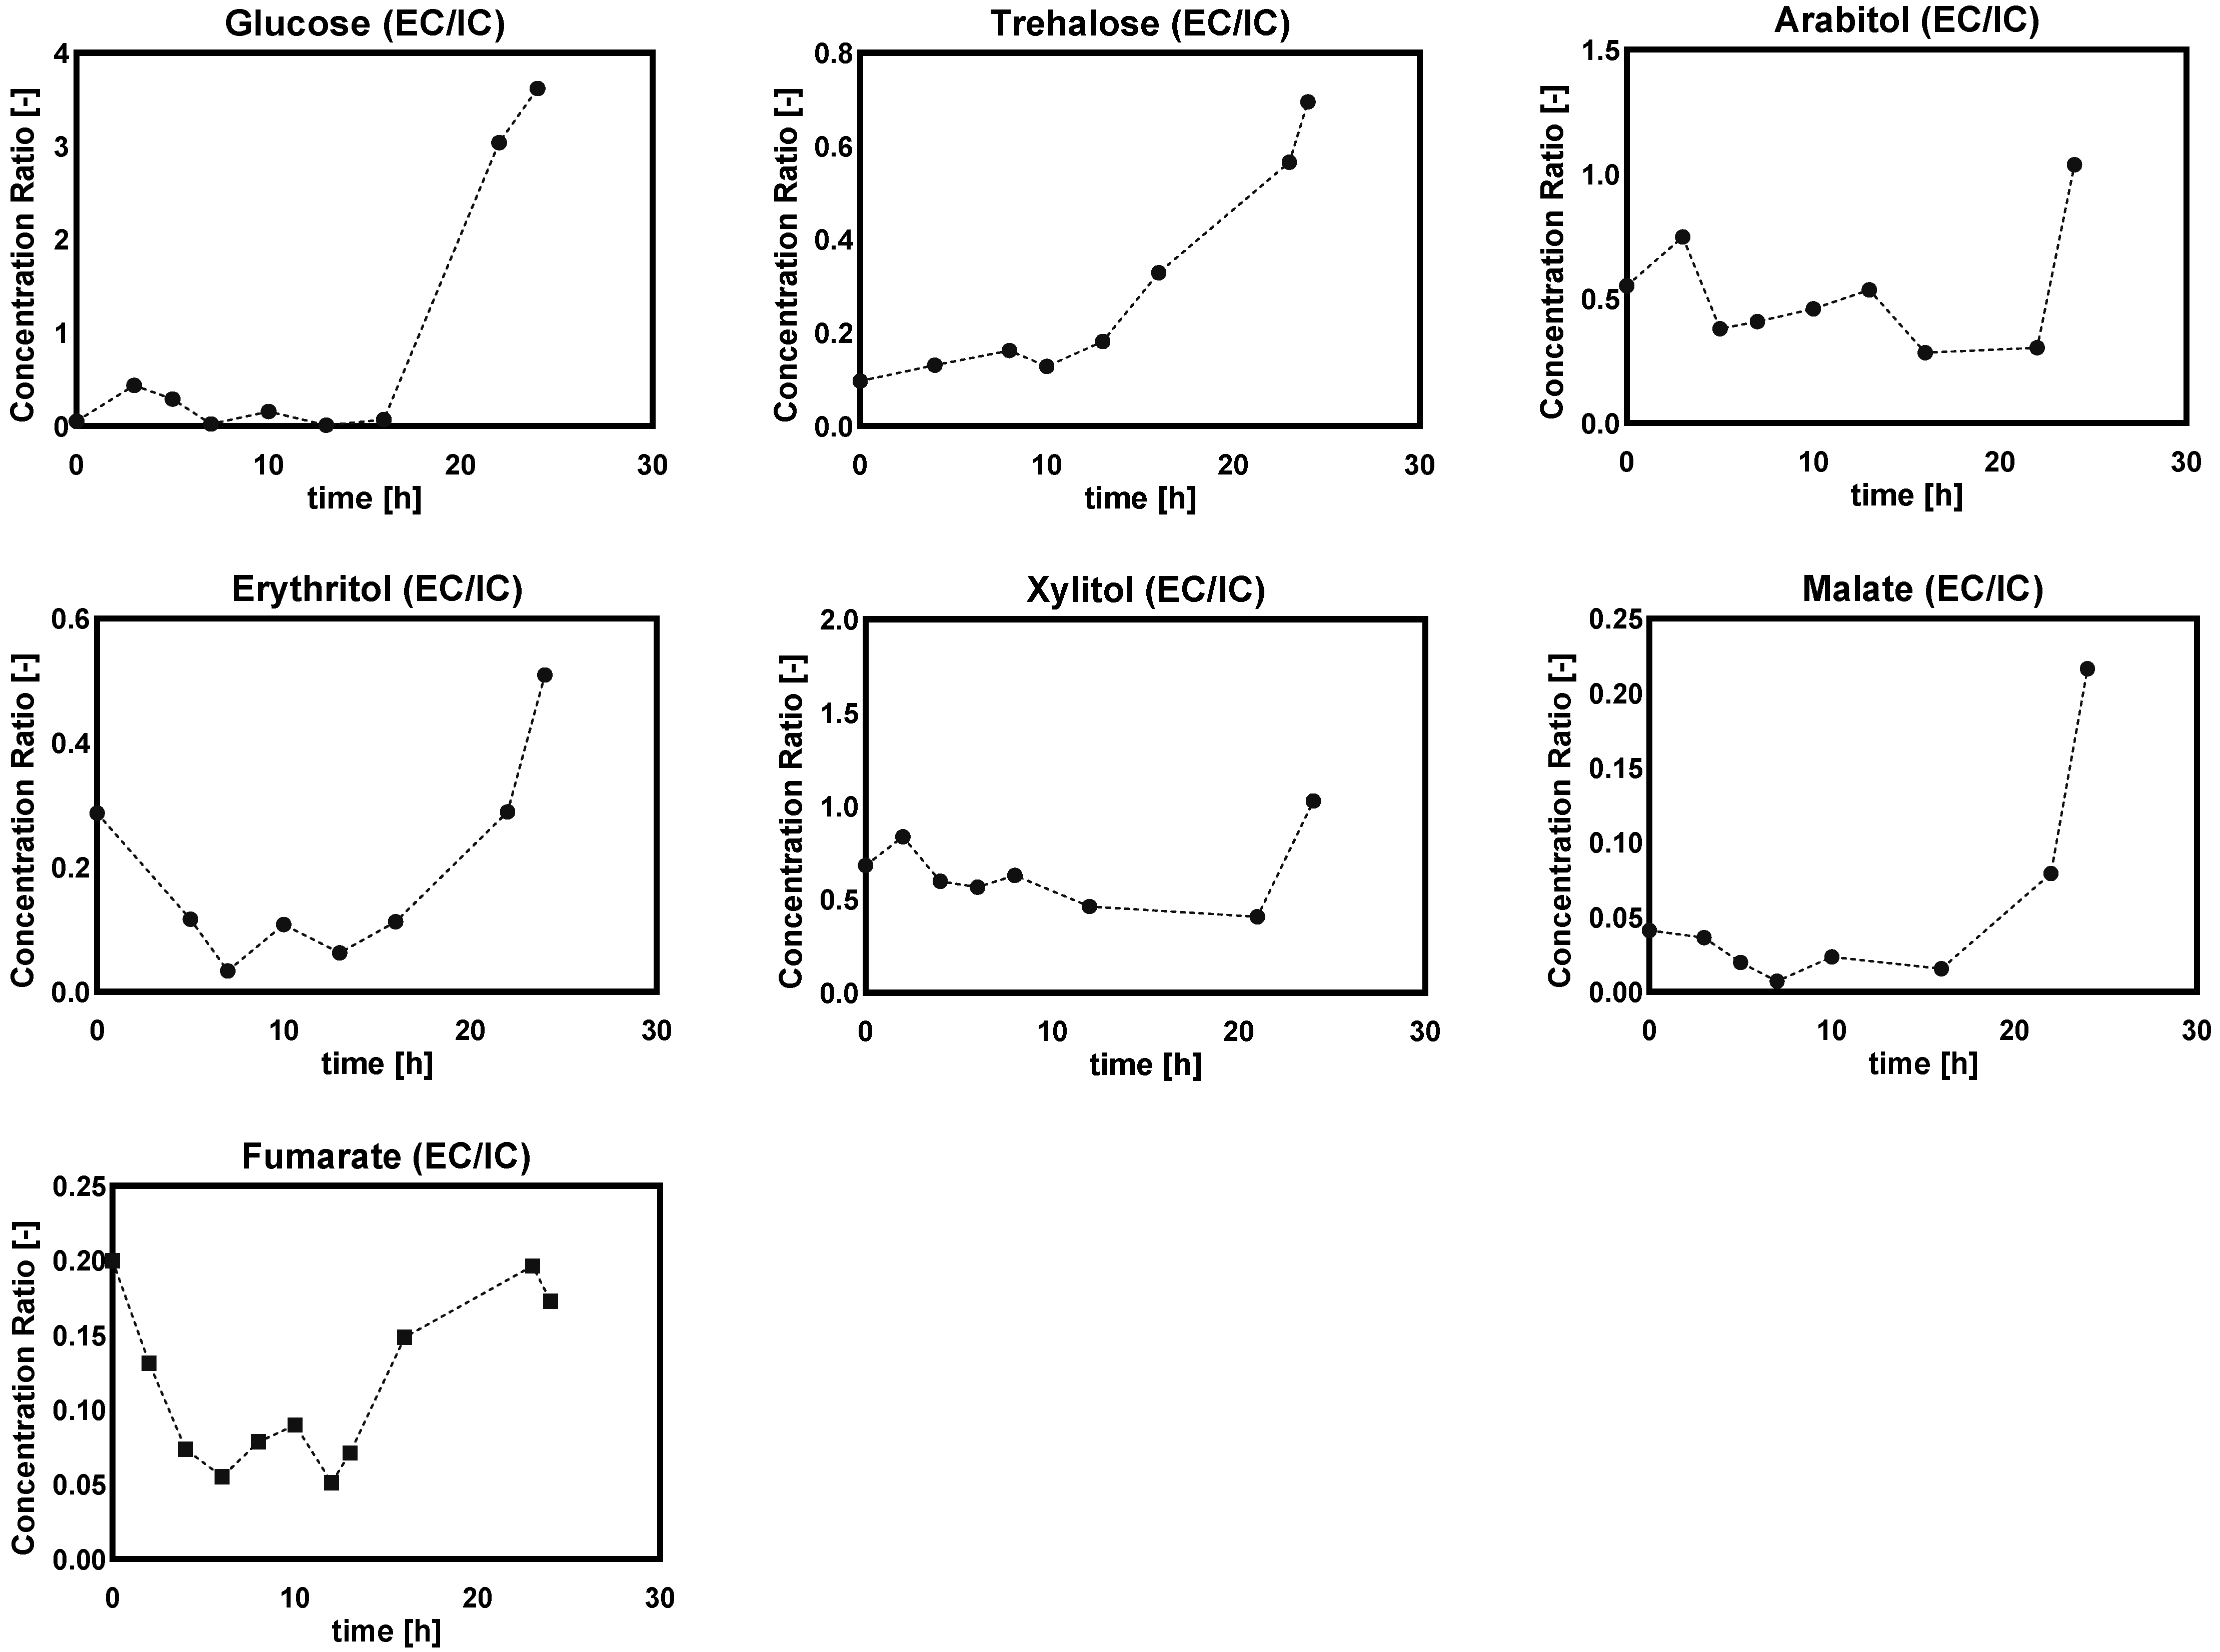
Ratio of Extra/Intracellular Metabolite Concentrations
3. Discussion
4. Materials and Methods
4.1. Materials
4.2. Fermentation Media
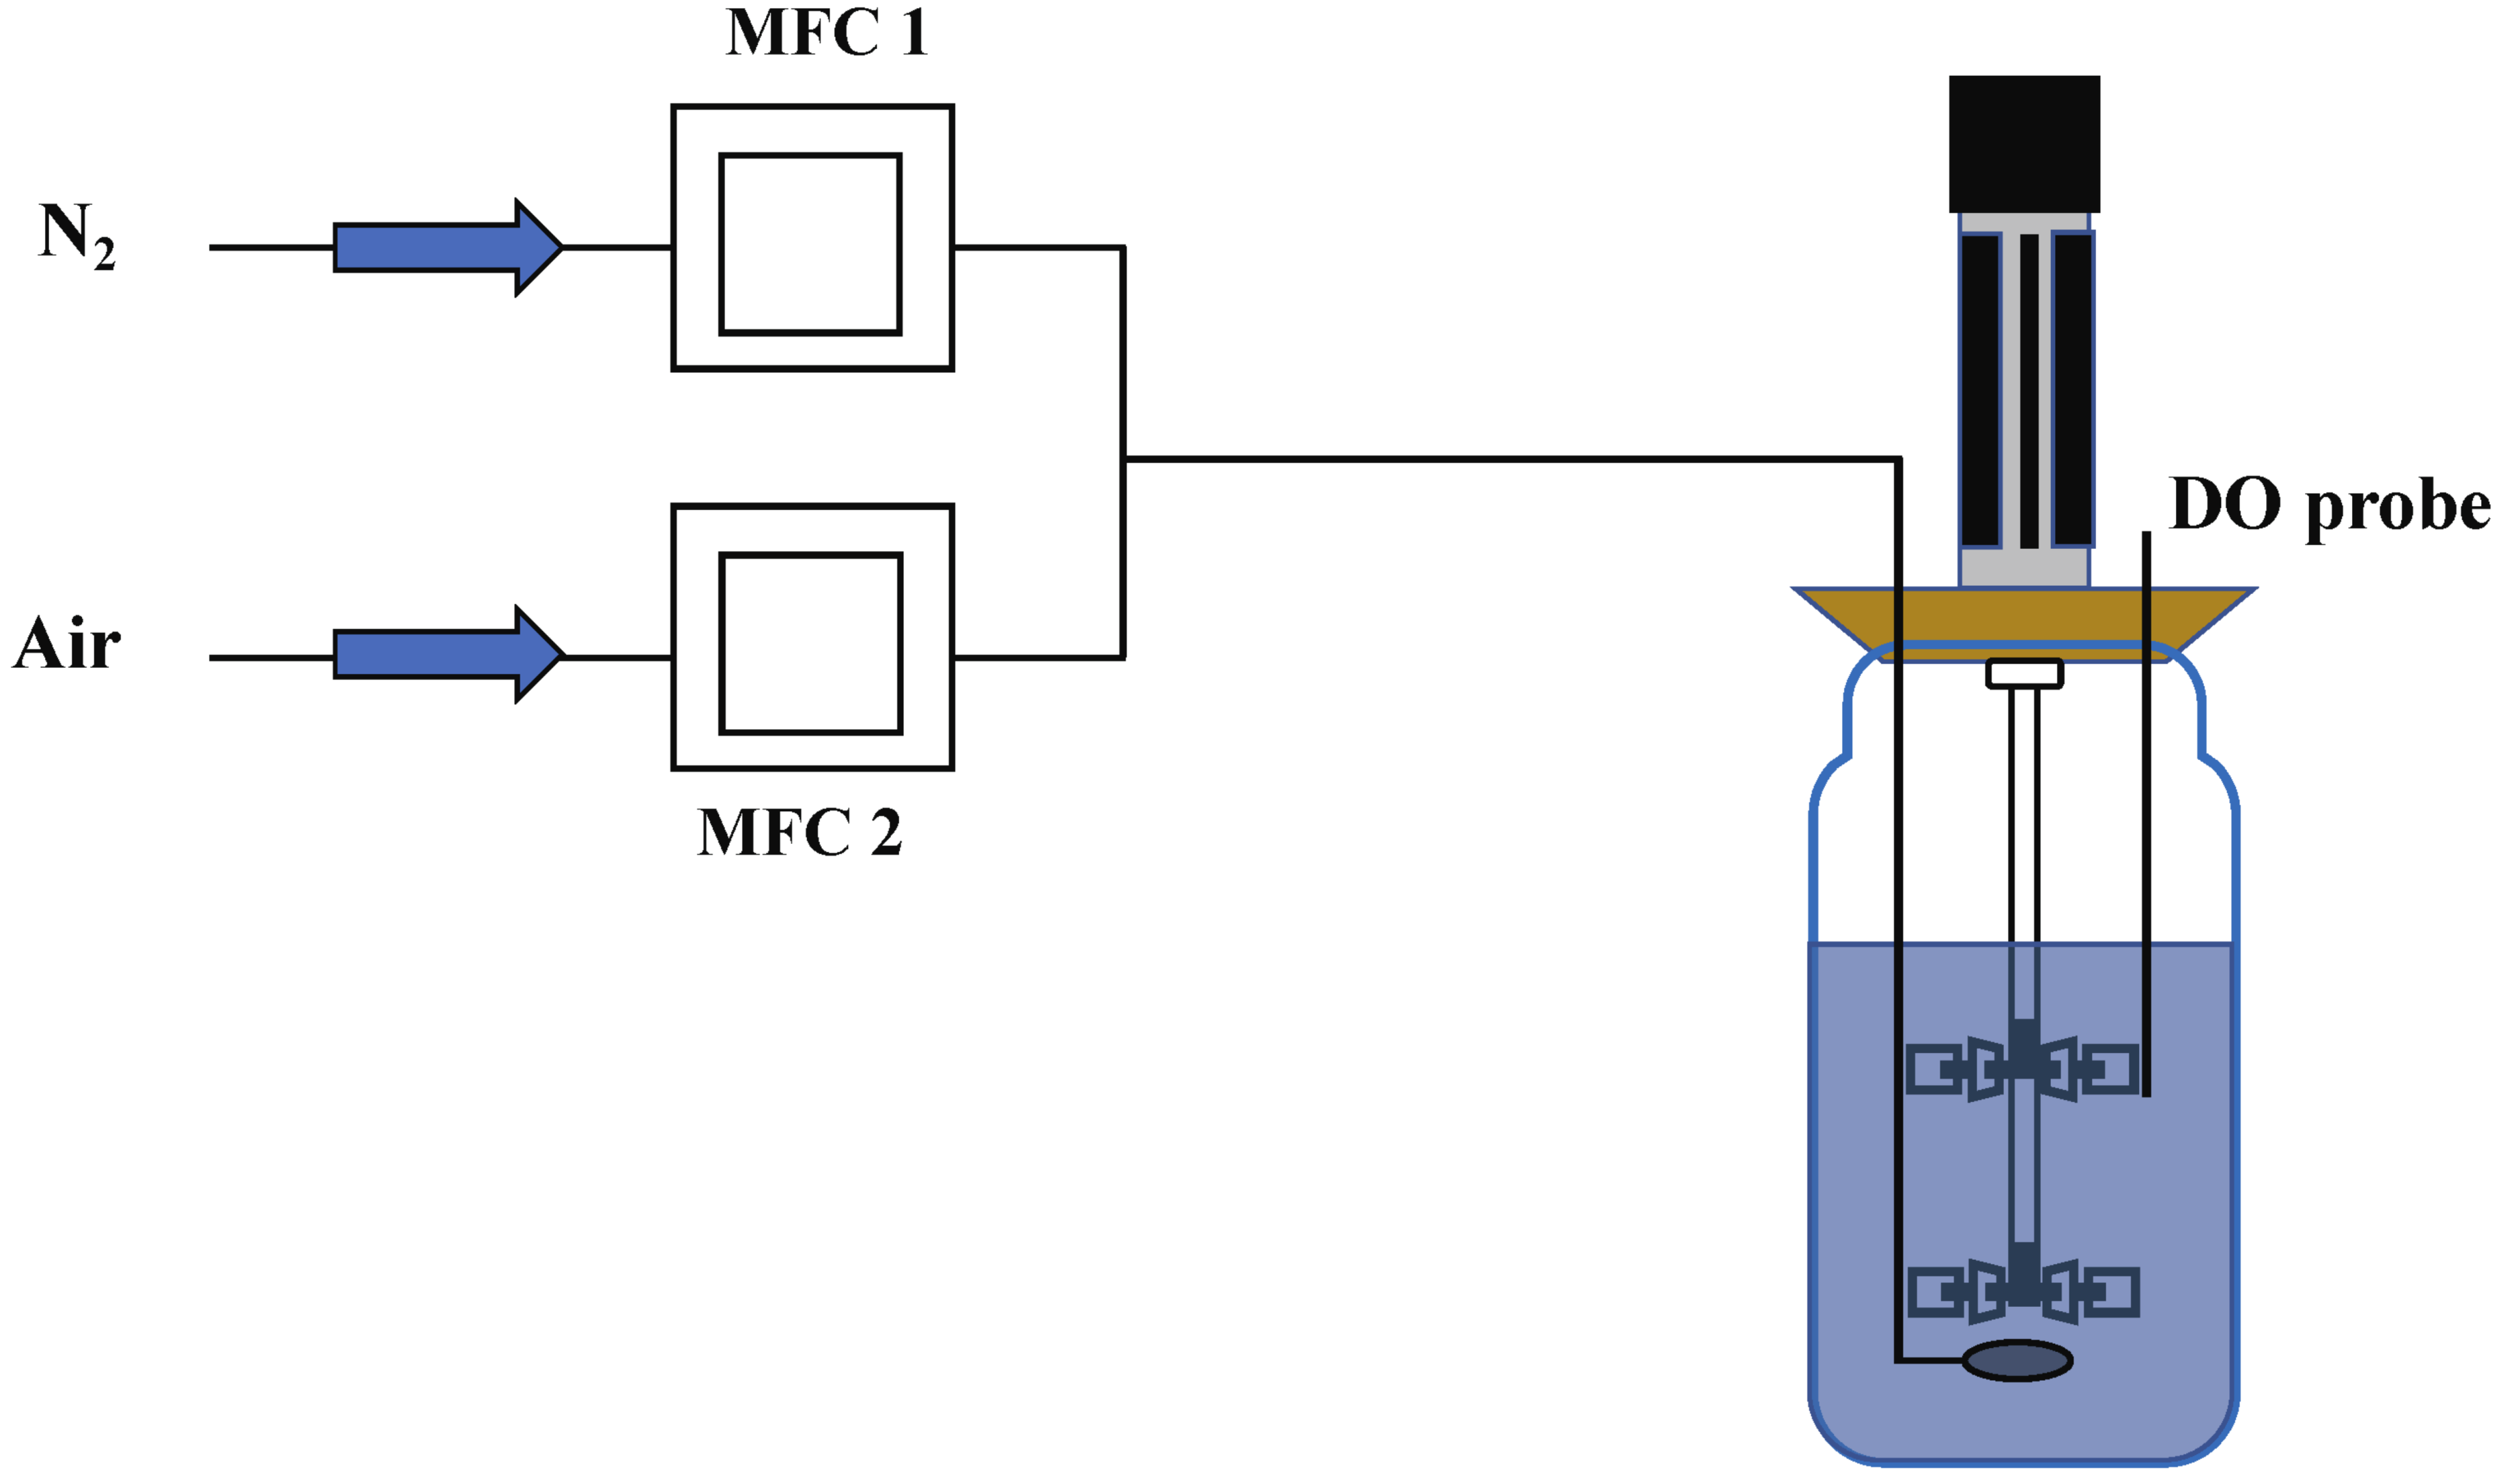
4.3. Chemostat Cultivation
- (a)
- DO shift-down experiment
- (b)
- DO ramp-down experiment
4.4. Cell Dry Weight
4.5. Rapid Sampling, Quenching and Metabolite Extraction
4.6. Analytical Methods
4.7. Adenylate Energy Charge
4.8. Cytosolic Free NADH/NAD+ Ratio
4.9. Genome-Scale Metabolic Network Model
Author Contributions
Funding
Institutional Review Board Statement
Informed Consent Statement
Data Availability Statement
Conflicts of Interest
References
- Kampers, L.F.C.; Asin-Garcia, E.; Schaap, P.J.; Wagemakers, A.; Dos Santos, V.A.P.M. From Innovation to Application: Bridging the Valley of Death in Industrial Biotechnology. Trends Biotechnol. 2021, 39, 1240–1242. [Google Scholar] [CrossRef]
- de Lorenzo, V.; Couto, J. The important versus the exciting: Reining contradictions in contemporary biotechnology. Microb. Biotechnol. 2019, 12, 32–34. [Google Scholar] [CrossRef] [PubMed] [Green Version]
- Noorman, H. An industrial perspective on bioreactor scale-down: What we can learn from combined large-scale bioprocess and model fluid studies. Biotechnol. J. 2011, 6, 934–943. [Google Scholar] [CrossRef]
- Wang, G.; Haringa, C.; Noorman, H.; Chu, J.; Zhuang, Y. Developing a Computational Framework To Advance Bioprocess Scale-Up. Trends Biotechnol. 2020, 38, 846–856. [Google Scholar] [CrossRef] [PubMed]
- Wang, G.; Tang, W.; Xia, J.; Chu, J.; Noorman, H.; van Gulik, W.M. Integration of microbial kinetics and fluid dynamics toward model-driven scale-up of industrial bioprocesses. Eng. Life Sci. 2015, 15, 20–29. [Google Scholar] [CrossRef]
- Lara, A.R.; Galindo, E.; Ramirez, O.T.; Palomares, L.A. Living with heterogeneities in bioreactors: Understanding the effects of environmental gradients on cells. Mol. Biotechnol. 2006, 34, 355–381. [Google Scholar] [CrossRef]
- Nadal-Rey, G.; McClure, D.D.; Kavanagh, J.M.; Cornelissen, S.; Fletcher, D.F.; Gernaey, K.V. Understanding gradients in industrial bioreactors. Biotechnol. Adv. 2021, 46, 107660. [Google Scholar] [CrossRef]
- Nagel, F.J.; Van As, H.; Tramper, J.; Rinzema, A. Water and glucose gradients in the substrate measured with NMR imaging during solid-state fermentation with Aspergillus oryzae. Biotechnol. Bioeng. 2002, 79, 653–663. [Google Scholar] [CrossRef]
- Galstyan, V.; Husain, K.; Xiao, F.; Murugan, A.; Phillips, R. Kinetic Proofreading using Substrate Gradients and Enzyme Diffusion. Biophys. J. 2020, 118, 573a–574a. [Google Scholar] [CrossRef]
- Vasilakou, E.; van Loosdrecht, M.C.M.; Wahl, S.A. Escherichia coli metabolism under short-term repetitive substrate dynamics: Adaptation and trade-offs. Microb. Cell Fact. 2020, 19, 116. [Google Scholar] [CrossRef]
- Taymaz-Nikerel, H.; van Gulik, W.M.; Heijnen, J.J. Escherichia coli responds with a rapid and large change in growth rate upon a shift from glucose-limited to glucose-excess conditions. Metab. Eng. 2011, 13, 307–318. [Google Scholar] [CrossRef]
- Liu, P.; Wang, S.; Li, C.; Zhuang, Y.; Xia, J.; Noorman, H. Dynamic response of Aspergillus niger to periodical glucose pulse stimuli in chemostat cultures. Biotechnol. Bioeng. 2021, 118, 2265–2282. [Google Scholar] [CrossRef] [PubMed]
- Wang, G.; Zhao, J.; Haringa, C.; Tang, W.; Xia, J.; Chu, J.; Zhuang, Y.; Zhang, S.; Deshmukh, A.T.; van Gulik, W.; et al. Comparative performance of different scale-down simulators of substrate gradients in Penicillium chrysogenum cultures: The need of a biological systems response analysis. Microb. Biotechnol. 2018, 11, 486–497. [Google Scholar] [CrossRef] [PubMed] [Green Version]
- de Jonge, L.P.; Buijs, N.A.; ten Pierick, A.; Deshmukh, A.; Zhao, Z.; Kiel, J.A.; Heijnen, J.J.; van Gulik, W.M. Scale-down of penicillin production in Penicillium chrysogenum. Biotechnol. J. 2011, 6, 944–958. [Google Scholar] [CrossRef]
- Sandoval-Basurto, E.A.; Gosset, G.; Bolivar, F.; Ramirez, O.T. Culture of Escherichia coli under dissolved oxygen gradients simulated in a two-compartment scale-down system: Metabolic response and production of recombinant protein. Biotechnol. Bioeng. 2005, 89, 453–463. [Google Scholar] [CrossRef] [PubMed]
- Serrato, J.A.; Palomares, L.A.; Meneses-Acosta, A.; Ramirez, O.T. Heterogeneous conditions in dissolved oxygen affect N-glycosylation but not productivity of a monoclonal antibody in hybridoma cultures. Biotechnol. Bioeng. 2004, 88, 176–188. [Google Scholar] [CrossRef]
- Trujillo-Roldan, M.A.; Pena, C.; Ramirez, O.T.; Galindo, E. Effect of oscillating dissolved oxygen tension on the production of alginate by Azotobacter vinelandii. Biotechnol. Prog. 2001, 17, 1042–1048. [Google Scholar] [CrossRef] [PubMed]
- Diano, A.; Bekker-Jensen, S.; Dynesen, J.; Nielsen, J. Polyol synthesis in Aspergillus niger: Influence of oxygen availability, carbon and nitrogen sources on the metabolism. Biotechnol. Bioeng. 2006, 94, 899–908. [Google Scholar] [CrossRef]
- Pedersen, L.; Hansen, K.; Nielsen, J.; Lantz, A.E.; Thykaer, J. Industrial glucoamylase fed-batch benefits from oxygen limitation and high osmolarity. Biotechnol. Bioeng. 2012, 109, 116–124. [Google Scholar] [CrossRef] [PubMed]
- Lu, H.; Cao, W.; Liu, X.; Sui, Y.; Ouyang, L.; Xia, J.; Huang, M.; Zhuang, Y.; Zhang, S.; Noorman, H.; et al. Multi-omics integrative analysis with genome-scale metabolic model simulation reveals global cellular adaptation of Aspergillus niger under industrial enzyme production condition. Sci. Rep. 2018, 8, 14404. [Google Scholar] [CrossRef] [Green Version]
- White, R.L.; John, E.M.; Baldwin, J.E.; Abraham, E.P. Stoichiometry of oxygen consumption in the biosynthesis of isopenicillin from a tripeptide. Biochem. J. 1982, 203, 791–793. [Google Scholar] [CrossRef] [PubMed] [Green Version]
- Yegneswaran, P.K.; Gray, M.R.; Thompson, B.G. Experimental simulation of dissolved oxygen fluctuations in large fermentors: Effect on Streptomyces clavuligerus. Biotechnol. Bioeng. 1991, 38, 1203–1209. [Google Scholar] [CrossRef]
- Allen, D.G.; Robinson, C.W. Measurement of rheological properties filamentous fermentation broths. Chem. Eng. Sci. 1990, 45, 37–48. [Google Scholar] [CrossRef]
- van Suijdam, J.C.; Metz, B. Influence of Engineering Variables upon the Morphology of Filamentous molds. Biotechnol. Bioeng. 1981, 23, 111–148. [Google Scholar] [CrossRef]
- Henriksen, C.M.; Nielsen, J.B.; Villadsen, J. Influence of the Dissolved Oxygen Concentration on the Penicillin Biosynthetic Pathway in Steady-State Cultures of Penicillium chrysogenum. Biotechnol. Prog. 1997, 13, 776–782. [Google Scholar] [CrossRef]
- Vardar, F.; Lilly, M.D. Effect of Cycling Dissolved Oxygen Concentrations on Product Formation in Penicillin Fermentations. Appl. Microbiol. Biotechnol. 1982, 14, 203–211. [Google Scholar] [CrossRef]
- Eriksen, S.H.; Soderblom, T.B.; Jensen, B.; Olsen, J. Uptake of phenylacetic acid by two strains of Penicillium chrysogenum. Biotechnol. Bioeng. 1998, 60, 310–316. [Google Scholar] [CrossRef]
- vanGulik, W.M.; Antoniewicz, M.R.; deLaat, W.T.; Vinke, J.L.; Heijnen, J.J. Energetics of growth and penicillin production in a high-producing strain of Penicillium chrysogenum. Biotechnol. Bioeng. 2001, 72, 185–193. [Google Scholar] [CrossRef]
- Wang, G.; Zhao, J.F.; Wang, X.X.; Wang, T.; Zhuang, Y.P.; Chu, J.; Zhang, S.L.; Noorman, H.J. Quantitative metabolomics and metabolic flux analysis reveal impact of altered trehalose metabolism on metabolic phenotypes of Penicillium chrysogenum in aerobic glucose-limited chemostats. Biochem. Eng. J. 2019, 146, 41–51. [Google Scholar] [CrossRef]
- Elbein, A.D.; Pan, Y.T.; Pastuszak, I.; Carroll, D. New insights on trehalose: A multifunctional molecule. Glycobiology 2003, 13, 17r–27r. [Google Scholar] [CrossRef] [PubMed]
- Gibney, P.A.; Schieler, A.; Chen, J.C.; Rabinowitz, J.D.; Botstein, D. Characterizing the in vivo role of trehalose in Saccharomyces cerevisiae using the AGT1 transporter. Proc. Natl. Acad. Sci. USA 2015, 112, 6116–6121. [Google Scholar] [CrossRef] [Green Version]
- Solomon, P.S.; Waters, O.D.; Oliver, R.P. Decoding the mannitol enigma in filamentous fungi. Trends Microbiol. 2007, 15, 257–262. [Google Scholar] [CrossRef] [PubMed]
- Algara, M.M.; Kuczynska-Wisnik, D.; Debski, J.; Stojowska-Swedrzynska, K.; Sominka, H.; Bukrejewska, M.; Laskowska, E. Trehalose protects Escherichia coli against carbon stress manifested by protein acetylation and aggregation. Mol. Microbiol. 2019, 112, 866–880. [Google Scholar] [CrossRef] [PubMed]
- Jang, C.; Chen, L.; Rabinowitz, J.D. Metabolomics and Isotope Tracing. Cell 2018, 173, 822–837. [Google Scholar] [CrossRef] [Green Version]
- O’Brien, E.J.; Monk, J.M.; Palsson, B.O. Using Genome-scale Models to Predict Biological Capabilities. Cell 2015, 161, 971–987. [Google Scholar] [CrossRef] [Green Version]
- Agren, R.; Liu, L.; Shoaie, S.; Vongsangnak, W.; Nookaew, I.; Nielsen, J. The RAVEN toolbox and its use for generating a genome-scale metabolic model for Penicillium chrysogenum. PLoS Comput. Biol. 2013, 9, e1002980. [Google Scholar] [CrossRef] [Green Version]
- Lara, A.R.; Leal, L.; Flores, N.; Gosset, G.; Bolivar, F.; Ramirez, O.T. Transcriptional and metabolic response of recombinant Escherichia coli to spatial dissolved oxygen tension gradients simulated in a scale-down system. Biotechnol. Bioeng. 2006, 93, 372–385. [Google Scholar] [CrossRef]
- Deshmukh, A.T.; Verheijen, P.J.T.; Seifar, R.M.; Heijnen, J.J.; van Gulik, W.M. In vivo kinetic analysis of the penicillin biosynthesis pathway using PAA stimulus response experiments. Metab. Eng. 2015, 32, 155–173. [Google Scholar] [CrossRef]
- Wang, G.; Wu, B.; Zhao, J.; Haringa, C.; Xia, J.; Chu, J.; Zhuang, Y.; Zhang, S.; Heijnen, J.J.; van Gulik, W.; et al. Power input effects on degeneration in prolonged penicillin chemostat cultures: A systems analysis at flux, residual glucose, metabolite, and transcript levels. Biotechnol. Bioeng. 2018, 115, 114–125. [Google Scholar] [CrossRef] [PubMed]
- Douma, R.D.; Deshmukh, A.T.; de Jonge, L.P.; de Jong, B.W.; Seifar, R.M.; Heijnen, J.J.; van Gulik, W.M. Novel insights in transport mechanisms and kinetics of phenylacetic acid and penicillin-G in Penicillium chrysogenum. Biotechnol. Prog. 2012, 28, 337–348. [Google Scholar] [CrossRef]
- Giles, N.M.; Watts, A.B.; Giles, G.I.; Fry, F.H.; Littlechild, J.A.; Jacob, C. Metal and Redox Modulation of Cysteine Protein Function. Chem. Biol. 2003, 10, 677–693. [Google Scholar] [CrossRef] [Green Version]
- Weber, S.S.; Polli, F.; Boer, R.; Bovenberg, R.A.; Driessen, A.J. Increased penicillin production in Penicillium chrysogenum production strains via balanced overexpression of isopenicillin N acyltransferase. Appl. Environ. Microbiol. 2012, 78, 7107–7113. [Google Scholar] [CrossRef] [Green Version]
- Brakhage, A.A. Molecular regulation of beta-lactam biosynthesis in filamentous fungi. Microbiol. Mol. Biol. Rev. 1998, 62, 547–585. [Google Scholar] [CrossRef] [Green Version]
- Feng, B.; Friedlin, E.; Marzluf, G.A. A reporter gene analysis of penicillin biosynthesis gene expression in Penicillium chrysogenum and its regulation by nitrogen and glucose catabolite repression. Appl. Environ. Microbiol. 1994, 60, 4432–4439. [Google Scholar] [CrossRef] [Green Version]
- Litzka, O.; Brulle, K.T.; Van den Brulle, J.; Steidl, S.; Brakhage, A.A. Transcriptional control of expression of fungal ß-lactam biosynthesis genes. Antonie Van Leeuwenhoek 1999, 75, 95–105. [Google Scholar] [CrossRef]
- Martin, J.F.; Casqueiro, J.; Kosalkova, K.; Marcos, A.T.; Gutierrez, S. Penicillin and cephalosporin biosynthesis: Mechanism of carbon catabolite regulation of penicillin production. Antonie Van Leeuwenhoek 1999, 75, 21–31. [Google Scholar] [CrossRef] [PubMed]
- Revilla, G.; Ramos, F.R.; Lpez-Nieto, M.J.; Alvarez, E.; Martn, J.F. Glucose Represses Formation of 5-(L-α-Aminoadipyl)-L-Cysteinyl-D-Valine and Isopenicillin N Synthase but Not Penicillin Acyltransferase in Penicillium chrysogenum. J. Bacteriol. 1986, 168, 947–952. [Google Scholar] [CrossRef] [Green Version]
- Gutierrez, S.; Marcos, A.T.; Casqueiro, J.; Kova, K.K.; Fernandez, F.J.; Velascol, J.; Martin, J.F. Transcription of the pcbAB, pcbC and penDE genes of Penicillium chrysogenum AS-P-78 is repressed by glucose and the repression is not reversed by alkaline pHs. Microbiology 1999, 145, 317–324. [Google Scholar] [CrossRef] [Green Version]
- Haringa, C.; Tang, W.; Deshmukh, A.T.; Xia, J.; Reuss, M.; Heijnen, J.J.; Mudde, R.F.; Noorman, H.J. Euler-Lagrange computational fluid dynamics for (bio)reactor scale down: An analysis of organism lifelines. Eng. Life Sci. 2016, 16, 652–663. [Google Scholar] [CrossRef] [PubMed] [Green Version]
- Douma, R.D.; Verheijen, P.J.; de Laat, W.T.; Heijnen, J.J.; van Gulik, W.M. Dynamic gene expression regulation model for growth and penicillin production in Penicillium chrysogenum. Biotechnol. Bioeng. 2010, 106, 608–618. [Google Scholar] [CrossRef] [PubMed]
- Wang, X.; Zhao, J.; Xia, J.; Wang, G.; Chu, J.; Zhuang, Y. Impact of Altered Trehalose Metabolism on Physiological Response of Penicillium chrysogenum Chemostat Cultures during Industrially Relevant Rapid Feast/Famine Conditions. Processes 2021, 9, 118. [Google Scholar] [CrossRef]
- Wang, G.; Wang, X.; Wang, T.; van Gulik, W.; Noorman, H.J.; Zhuang, Y.; Chu, J.; Zhang, S. Comparative Fluxome and Metabolome Analysis of Formate as an Auxiliary Substrate for Penicillin Production in Glucose-Limited Cultivation of Penicillium chrysogenum. Biotechnol. J. 2019, 14, e1900009. [Google Scholar] [CrossRef]
- Li, C.; Shu, W.; Wang, S.; Liu, P.; Zhuang, Y.; Zhang, S.; Xia, J. Dynamic metabolic response of Aspergillus niger to glucose perturbation: Evidence of regulatory mechanism for reduced glucoamylase production. J. Biotechnol. 2018, 287, 28–40. [Google Scholar] [CrossRef] [PubMed]
- Wang, G.; Chu, J.; Zhuang, Y.; van Gulik, W.; Noorman, H. A dynamic model-based preparation of uniformly-(13)C-labeled internal standards facilitates quantitative metabolomics analysis of Penicillium chrysogenum. J. Biotechnol. 2019, 299, 21–31. [Google Scholar] [CrossRef]
- Mashego, M.R.; Jansen, M.L.; Vinke, J.L.; van Gulik, W.M.; Heijnen, J.J. Changes in the metabolome of Saccharomyces cerevisiae associated with evolution in aerobic glucose-limited chemostats. FEMS Yeast Res. 2005, 5, 419–430. [Google Scholar] [CrossRef] [Green Version]
- Wu, L.; Mashego, M.R.; van Dam, J.C.; Proell, A.M.; Vinke, J.L.; Ras, C.; van Winden, W.A.; van Gulik, W.M.; Heijnen, J.J. Quantitative analysis of the microbial metabolome by isotope dilution mass spectrometry using uniformly 13C-labeled cell extracts as internal standards. Anal. Biochem. 2005, 336, 164–171. [Google Scholar] [CrossRef] [PubMed]
- de Jonge, L.; Buijs, N.A.; Heijnen, J.J.; van Gulik, W.M.; Abate, A.; Wahl, S.A. Flux response of glycolysis and storage metabolism during rapid feast/famine conditions in Penicillium chrysogenum using dynamic (13)C labeling. Biotechnol. J. 2014, 9, 372–385. [Google Scholar] [CrossRef] [PubMed]
- Liu, X.; Sun, X.; He, W.; Tian, X.; Zhuang, Y.; Chu, J. Dynamic changes of metabolomics and expression of candicidin biosynthesis gene cluster caused by the presence of a pleiotropic regulator AdpA in Streptomyces ZYJ-6. Bioprocess Biosyst. Eng. 2019, 42, 1353–1365. [Google Scholar] [CrossRef]
- Atkinson, D.E.; Walton, G.M. Adenosine Triphosphate Conservation in Metabolic Regulation. J. Biol. Chem. 1967, 242, 3239–3241. [Google Scholar] [CrossRef]
- Nasution, U.; van Gulik, W.M.; Kleijn, R.J.; van Winden, W.A.; Proell, A.; Heijnen, J.J. Measurement of intracellular metabolites of primary metabolism and adenine nucleotides in chemostat cultivated Penicillium chrysogenum. Biotechnol. Bioeng. 2006, 94, 159–166. [Google Scholar] [CrossRef]


| 60% | 20% | 10% | 5% | ||
|---|---|---|---|---|---|
| − | mmol/CmolX/h | 18.06 ± 1.89 | 16.10 ± 0.95 | 16.05 ± 0.56 | 14.88 ± 0.76 |
| − | mmol/CmolX/h | 73.09 ± 9.44 | 68.84 ± 1.1 | 70.52 ± 4.55 | 61.65 ± 4.24 |
| mmol/CmolX/h | 77.16 ± 10.3 | 72.68 ± 1.1 | 70.49± 3.80 | 61.73 ± 3.84 | |
| − | mmol/CmolX/h | 0.23 ± 0.03 | 0.22 ± 0.04 | 0.22 ± 0.06 | 0.19 ± 0.02 |
| mmol/CmolX/h | 0.089 ± 0.002 | 0.080 ± 0.004 | 0.076 ± 0.004 | 0.067 ± 0.004 | |
| mmol/CmolX/h | 0.26 ± 0.04 | 0.41 ± 0.03 | 0.51 ± 0.04 | 0.44 ± 0.07 | |
| mmol/CmolX/h | 0.42 ± 0.07 | 0.39 ± 0.05 | 0.36 ± 0.04 | 0.33 ± 0.04 | |
| mmol/CmolX/h | 0.15 ± 0.03 | 0.20 ± 0.13 | 0.20 ± 0.044 | 0.12± 0.01 | |
| g/kg | 6.68 ± 0.64 | 7.36 ± 0.51 | 7.36 ± 0.30 | 8.19 ± 0.59 | |
| g/g | 0.45 ± 0.04 | 0.49 ± 0.02 | 0.50 ± 0.03 | 0.54 ± 0.03 | |
| mol/mol | 4.46 ± 0.86 | 4.34 ± 0.10 | 4.40 ± 0.01 | 4.26 ± 0.44 | |
| mmol/mol | 4.95 ± 0.66 | 5.07 ± 0.32 | 4.99 ± 0.17 | 4.99 ± 0.01 | |
| RQ | - | 1.06 ± 0.01 | 1.05 ± 0.01 | 1.07 ± 0.07 | 1.08 ± 0.01 |
Publisher’s Note: MDPI stays neutral with regard to jurisdictional claims in published maps and institutional affiliations. |
© 2022 by the authors. Licensee MDPI, Basel, Switzerland. This article is an open access article distributed under the terms and conditions of the Creative Commons Attribution (CC BY) license (https://creativecommons.org/licenses/by/4.0/).
Share and Cite
Yang, Q.; Lin, W.; Xu, J.; Guo, N.; Zhao, J.; Wang, G.; Wang, Y.; Chu, J.; Wang, G. Changes in Oxygen Availability during Glucose-Limited Chemostat Cultivations of Penicillium chrysogenum Lead to Rapid Metabolite, Flux and Productivity Responses. Metabolites 2022, 12, 45. https://doi.org/10.3390/metabo12010045
Yang Q, Lin W, Xu J, Guo N, Zhao J, Wang G, Wang Y, Chu J, Wang G. Changes in Oxygen Availability during Glucose-Limited Chemostat Cultivations of Penicillium chrysogenum Lead to Rapid Metabolite, Flux and Productivity Responses. Metabolites. 2022; 12(1):45. https://doi.org/10.3390/metabo12010045
Chicago/Turabian StyleYang, Qi, Wenli Lin, Jiawei Xu, Nan Guo, Jiachen Zhao, Gaoya Wang, Yongbo Wang, Ju Chu, and Guan Wang. 2022. "Changes in Oxygen Availability during Glucose-Limited Chemostat Cultivations of Penicillium chrysogenum Lead to Rapid Metabolite, Flux and Productivity Responses" Metabolites 12, no. 1: 45. https://doi.org/10.3390/metabo12010045
APA StyleYang, Q., Lin, W., Xu, J., Guo, N., Zhao, J., Wang, G., Wang, Y., Chu, J., & Wang, G. (2022). Changes in Oxygen Availability during Glucose-Limited Chemostat Cultivations of Penicillium chrysogenum Lead to Rapid Metabolite, Flux and Productivity Responses. Metabolites, 12(1), 45. https://doi.org/10.3390/metabo12010045