Abstract
Metabolomics has advanced from innovation and functional genomics tools and is currently a basis in the big data-led precision medicine era. Metabolomics is promising in the pharmaceutical field and clinical research. However, due to the complexity and high throughput data generated from such experiments, data mining and analysis are significant challenges for researchers in the field. Therefore, several efforts were made to develop a complete workflow that helps researchers analyze data. This paper introduces a review of the state-of-the-art computer-aided tools and databases in metabolomics established in recent years. The paper provides computational tools and resources based on functionality and accessibility and provides hyperlinks to web pages to download or use. This review aims to present the latest computer-aided tools, databases, and resources to the metabolomics community in one place.
1. Introduction
Understanding the molecular system of living organisms has led to advancements in technological techniques for measuring the function of critical biomolecules in living organisms: RNA, DNA, proteins, and small molecules of diverse natures. The analysis of such elements led to the growth of the research field known as Omics [1,2]. Omics has become the new motto of molecular biology. In recent years, the utility of Omics technologies, such as genomics, proteomics, and metabolomics [2], has delivered new perceptions of well-being.
Metabolomics enhances the monitoring of disease evolution, dietary interventions, and drug toxicities by revealing the triggers of several diseases and detecting promising links between apparently different conditions [3]. In addition, Metabolomics seeks to catch the whole set of biomolecules confined in a biological sample, creating big data explored by biostatistics and bioinformatics methods [4].
Two main challenges in Omics data analysis are the dimensionality dilemma produced by more variables than samples and the development of algorithms that successfully integrate and analyze biological data, incorporating present and future knowledge. Pathway Analysis (PA) has developed and established a reliable way of managing these issues. PA is one of the commonly used principal tools of Omics research. PA tools analyze data obtained from high-throughput technologies, identifying potentially perturbed genes in diseased samples compared to a control. In this sense, PA methods aspire to overcome the dilemma of interpreting large lists of essential genes, the main output of most basic high-throughput data analysis. In addition, PA methods provide meaning to experimental high-throughput biological data, thereby enabling interpretation and successive hypothesis generation. PA targets have been achieved by combining databases’ biological knowledge with statistical testing, mathematical analyses, and computational algorithms.
The advancement of analytical techniques and extraction methods helps detect a wide range of metabolites. The well-known analytical techniques are either mass spectrometry (MS) or nuclear magnetic resonance (NMR).
The conventional methodological pipeline of a metabolomics experiment combines different steps (Figure 1). This pipeline starts with biological sample acquisition to further produce metabolic information. The pre-processed metabolomics data, both MS and NMR, is typically organized into a feature quantification matrix (FQM). In this matrix, rows typically relate to the samples, while columns relate to the metabolomic features obtained. The concentration of a metabolite usually characterizes the metabolomic feature. Data analysis techniques can then be applied using these metabolomic features as input.
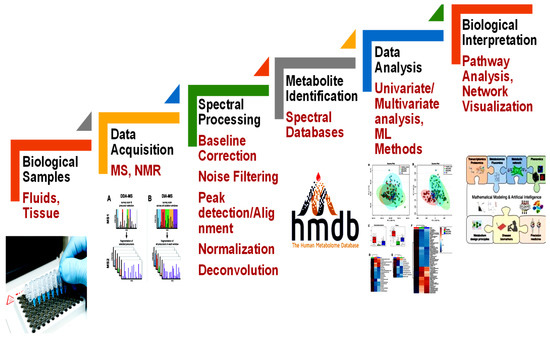
Figure 1.
The metabolomics experiment. The flowchart comprises sample acquisitions, instrumental and spectral analysis, identifications of metabolites, and statistical and pathway analysis for further interpretation.
Medical data is mass-produced, requiring very efficient tools to manage, store, and analyze the data. Therefore, various sources are used to generate high throughput profiling of such biological and clinical data cost-effectively, such as mobile phones, sensor devices, electronic health records (EHR), patients, hospitals and clinics, researchers, and other organizations.
Big data tools in modern software systems empower remarkable research opportunities and innovation in the healthcare domain. New emerging and interrelated paradigms such as Informatics & Data-Driven Medicine [5], eHealth [6] and mHealth [7], and Digital Health [8] are booming and attaining recognition among healthcare specialists and patients.
Big Data Analytics (Figure 2) has emerged to perform descriptive and predictive analyses of such massive data. Big Data Analytics is vital and popular in bioinformatics research since the human genome size can reach 200 GB [9]. Therefore, bioinformatics researchers need to develop high-power computational algorithms and parallel programs. Thus, this study overviews primary computer-aided tools and databases in metabolomics in recent years. The report is organized into two main sections: (1) metabolomics databases and (2) computer-aided tools in metabolomics. Table 1 and Table 2 summarize all reviewed resources and their availability.
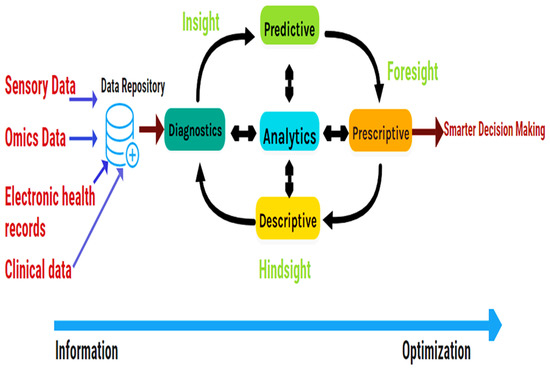
Figure 2.
Workflow of Big data Analytics, adapted from [10]. Descriptive analytics defines what occurred. Diagnostics analytics replies why it occurred. Predictive analytics provides what will occur. Finally, prescriptive analytics proposes actions to influence desired results (make it occur).

Table 1.
Summary of metabolomics databases.
Table 2.
Summary of computer-aided metabolomics.
Databases store big healthcare data produced by several resources. Big data analytics platforms process the data for a better decision-making process. Descriptive analytics describes what happened. Diagnostics analytics answers why it happened. Predictive analytics gives what will happen. Finally, prescriptive analytics recommends actions to affect desirable outcomes (make it happen).
2. Metabolomics Databases
The vast amount of information in the ever-growing quantity of experimental and computational chemical data needs to be stored, made accessible, and manipulated. Today, hundreds of database projects are created and annotated biological knowledge. Each has a dedicated context (Figure 3).
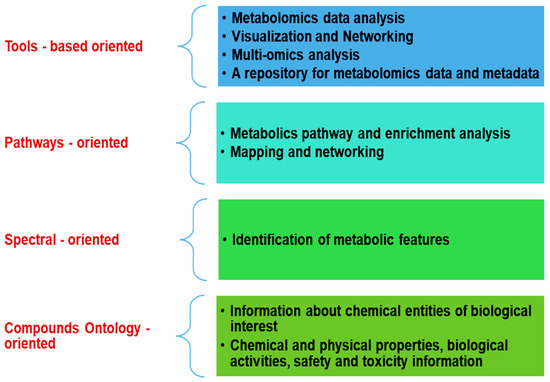
Figure 3.
Metabolomics databases multifunctional tasks.
As a result, the database’s current catalog is robust and diverse, including organism focus, curation approach, type of pathways, and interactions covered, along with other differences. In addition, many databases are available to researchers for data mining and sharing consistent chemical data for various purposes. For example, all pathway search tools depend on a database from which biochemical reactions and molecules can be enlisted to comprise the pathway of interest. This section discusses the databases related to various metabolite annotation, metabolism, and metabolomics workflows.
The Reactome Knowledgebase [11] (Reactome.org, accessed on 1 April 2022) is a distinct curated database of pathways and reactions in human biology, cross-referenced with several resources, such as essential literature and different pathway-related databases. It aims its manual annotation effort on Homo-sapiens, a single species, and applies a separate consistent data model within the whole biology domain. The Reactome describes a reaction as an event in biology that alters the condition of a biological molecule. Degradation, activation, binding, translocation, and typical biochemical events, including a catalyst, are reactions. It presents molecular features of signal transduction, transport, metabolism, DNA replication, and more cellular activities. It contains 2546 human pathways and 1940 small molecules [11].
BioCyc (Biocyc.org, accessed on 1 April 2022) [12] is a comprehensive reference to a collection of 19,494 Pathway and Genome Databases for model eukaryotes and thousands of microbes and software tools for exploring them. In addition, BioCyc comprises curated data from 130,000 publications. The MetaCyc and EcoCyc databases are freely available via BioCyc. However, access to the remaining BioCyc databases, such as HumanCyc (HumanCyc.org, accessed on 1 April 2022) [57], needs a paid subscription.
MetaCyc (MetaCyc.org, accessed on 1 April 2022) [13] is a broad metabolic pathways and enzymes database from each field of life. It includes 2937 pathways obtained from 3295 different organisms, making it the most extensive curated collection of metabolic pathways [13].
EcoCyc (EcoCyc.org, accessed on 1 April 2022) [14] is a systematic database for Escherichia coli K-12 MG1655. The EcoCyc presents a literature-based curation of its genome, transporters, metabolic pathways, and transcriptional regulation. Original and improved data analysis and visualization tools involve a circular genome viewer, an interactive metabolic network explorer, and several upgrades to the usability and speed of current tools [14]. It mainly focuses on metabolic pathways and signaling.
Metabolite Network of Depression Database (MENDA) [30] (http://menda.cqmu.edu.cn:8080/index.php, accessed on 1 April 2022) is a broad metabolite-disease association database that integrates all existing knowledge and datasets of metabolic characterization in depression. In addition, study and tissue type, organism, category of depression, sample size, platform (MS-based, MRS, NMR), and differential metabolites are provided.
BiGG Models (BIGG.ucsd.edu, accessed on 1 April 2022) [15] is a biochemical, genetic, and genomic knowledge base of genome-scale metabolic network reconstructions. BiGG Models includes more than 75 superior, manually curated genome-scale metabolic models. It also delivers a broad application interface for accessing BiGG Models with modeling and analysis kits. In addition, reaction and metabolite identifiers and pathway visualization were formalized in BiGG Models.
Kyoto Encyclopedia of Genes and Genomes (KEGG) (www.kegg.jp/, accessed on 1 April 2022) [16] is an extensive and widely used database. It is a manually curated source incorporating 18 databases classified into genomic, systems, health, and chemical data.
The Braunschweig Enzyme Database (BRENDA) enzyme database (www.brenda-enzymes.org, accessed on 1 April 2022) [17] contains comprehensive functional enzyme and metabolism data such as measured kinetic parameters. The main part has more than 5 million data points for almost 90,000 enzymes. In addition, BRENDA presents accessible enzyme information from fast to superior text- and structured-based searches for word maps, enzyme-ligand interactions, and enzyme data visualization.
PubChem (pubchem.ncbi.nlm.nih.gov, accessed on 1 April 2022) [18] is the world’s most extensive set of open and accessible chemical information from more than 750 data sources. It stores information in three primary categories: compounds, substances, and bioactivities. In addition, several research areas use PubChem as a big data resource, including machine learning and data science for drug repurposing, virtual screening, drug side effect prediction, metabolite identification, and chemical toxicity prediction. Furthermore, PubChem provides physical and chemical properties, safety and toxicity information, biological activities, literature citations, patents, and more.
ChEBI (www.ebi.ac.uk/chebi, accessed on 1 April 2022) [19] is an open-access glossary of molecular entities aimed at small biochemical compounds.
The HMDB (https://hmdb.ca, accessed on 1 April 2022) [20] is a broad source delivering information about homo-sapiens metabolites and their associated physiological, chemical, and biological properties. To date, HMDB has 220,945 total metabolites.
ChemSpider (chemspider.com, accessed on 1 April 2022) [21] is a freely accessible chemical structure database delivering a quick structure and text search covering over one hundred million structures from hundreds of data resources.
MetaboLights (https://www.ebi.ac.uk/metabolights, accessed on 1 April 2022) [22] is a database that includes metabolomics studies research, raw experimental data, and related metadata. MetaboLights is cross-technique and cross-species and includes metabolite structures and their related biological roles, reference spectra, concentrations and locations, and metabolic experiments data. Users can upload their research datasets into the MetaboLights Repository. Researchers are then automatically given a unique and stable identifier for publication reference.
The Metabolomics Workbench (metabolomicsworkbench.org, accessed on 1 April 2022) [23] is a public repository for experimental metabolomics metadata and data covering several species and experimental platforms, metabolite structures, metabolite standards, tutorials, protocols, training material, and more educational resources. It can combine, examine, deposit, track, and distribute big heterogeneous data from many MS- and NMR-based metabolomics studies. It covers over twenty diverse species, including humans and other mammals, insects, invertebrates, plants, and microorganisms.
SMPDB (https://smpdb.ca, accessed on 1 April 2022) [24] is a comprehensive, interactive, visual database that includes over 48,000 discovered pathways. Most of the pathways do not exist in other pathway databases. SMPDB help in pathway discovery and interpretation in metabolomics, proteomics, transcriptomics, and systems biology.
MetSigDis [25] (http://www.bio-annotation.cn/MetSigDis/, accessed on 1 April 2022) is a free web-based tool that offers a comprehensive metabolite alterations resource in various diseases. The database deposited 6849 curated associations between 2420 metabolites and 129 diseases among eight species, including humans and model organisms.
Virtual Metabolic Human [26] (VMH, www.vmh.life, accessed on 1 April 2022) is a web-based database capturing the knowledge of Homo-sapiens metabolism within 5 interlinked resources, including, Homo-sapiens metabolism, Disease, Gut microbiome, ReconMaps, and Nutrition. The VMH’s exceptional features are (i) the introduction of the metabolic reconstructions of Homo-sapiens and gut microbes for metabolic modeling; (ii) seven Homo-sapiens metabolic maps for data visualization; (iii) a nutrition designer; (iv) an accessible webpage and application user interface to access the content; (v) feedback option for community users’ interactions and (vi) the linking of its entities to 57 web resources.
WikiPathways [28] (wikipathways.org, accessed on 1 April 2022) is a reliable and rich pathway database that captures biological pathways’ collective knowledge. By delivering a database in a curated, machine-readable system, visualization and omics data studies is supported.
The relational database of Metabolomics Pathways (RaMP) [29] is a public database to combine biological pathways from the WikiPathways, KEGG Reactome, and the HMDB. RaMP maps metabolites and genes to biochemical and disease pathways and can be incorporated into other existing software. It can be used as a stand-alone resource (https://github.com/mathelab/RaMP-DB/, accessed on 1 April 2022) or incorporated into other tools (https://github.com/mathelab/RaMP-DB/inst/extdata/, accessed on 1 April 2022).
Pathway Commons [27] (https://www.pathwaycommons.org, accessed on 1 April 2022) is one of the most extensive composite databases. It is an integrated resource of openly accessible information about biological pathways involving biochemical reactions, transport and catalysis events, assembly of biomolecular complexes, and physical interactions, including DNA, RNA, proteins, and small molecules such as drug compounds and metabolites. A list of commonly used metabolomics databases and their main features can be found in Table 1.
A variety of databases stands as a metabolomics dataset repository. To mention some, BioMagResBank (BMRB) (http://www.bmrb.wisc.edu, accessed on 1 April 2022) [58] is a public repository for NMR spectroscopy data from peptides, proteins, nucleic acids, and more biomolecules. In addition, the Golm Metabolome Database (GMD) (http://gmd.mpimp-golm.mpg.de/, accessed on 1 April 2022) [59] provides datasets for biologically quantified active metabolites and text search capabilities for GC-MS data. Moreover, the Mass Spectral Library (https://www.NIST.gov/srd/NIST-standard-referencedatabase-1a, accessed on 1 April 2022) [60] extensively collects EI MS, MS/MS, replicate spectra, and retention index datasets. Finally, the Spectral Database System (SDBS) (https://sdbs.db.aist.go.jp/, accessed on 1 April 2022) [61] is a spectral database for organic compounds and has various MS, NMR, IR, Raman, ESR datasets.
Taken all together, Pathguide [62] is a necessary initial step for considering the prospect of pathway databases. Pathguide is a meta-database that contains information about 702 biological pathway-related databases and molecular interaction-related databases. For example, the Pathguide categories include signaling pathways, metabolic pathways, pathway diagrams, gene regulatory networks, transcription factor targets, genetic interactions networks, protein sequence-focused, protein-protein interactions, protein–compound interactions, etc.
Despite the emerging number of chemical databases, the significant challenge for this expansion is the incompetence to use metabolite and reaction information from databases such as KEGG, BRENDA, and MetaCyc because of representation inconsistencies and duplications, and errors. In addition, the same metabolite is obtained with several names among models and databases, which slows down assembling information from different data sources. Therefore, researchers designed the MetRxn database [63], Rhea [64], and RefMet [65] to standardize reaction and metabolite names. Additions and modifications to databases are made regularly to increase the quality and coverage of their biological knowledge. Some databases can update their information frequently to sustain pace with discoveries. For instance, the KEGG database [16] revises its data weekly; however, other databases do it less often. The preference of databases should consider the relative sizes, degree of overlap, and scope. For instance, KEGG comprises considerably more compounds than MetaCyc, but MetaCyc includes more pathways and reactions than KEGG. For example, pathway sets might vary between databases in several ways, involving the number of pathways present, the size of pathways, how pathways are curated, be it manually or automatically, or a combination of both, organisms supported, and the pathway boundaries [66]. However, interpreting metabolomics data has been intriguing since realizing the relationships among dozens of modified metabolites have often relied on researchers’ biochemical assumptions and knowledge. However, recent biochemical databases deliver information about metabolism’s interrelations, automatically polling using metabolomics analysis tools, i.e., mathematical and computational tools.
3. Metabolomics Computer-Aided Tools
Python [67], R [68], and other programming languages empower and facilitate various tools to implement integrated workflows (Figure 4).
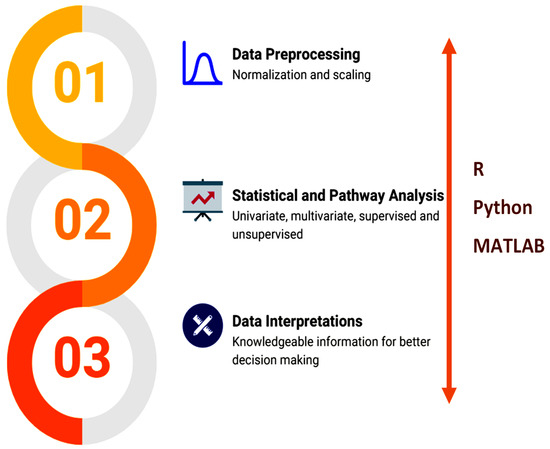
Figure 4.
Overview of the data analysis workflow.
Independent computational methods for conducting statistics, enrichment, contextualization, and visualization must be combined into integrated workflows [69]. These workflows should be customized and made compatible with the study designs to attain complete and significant information from the metabolomics datasets. Mathematical methods are helpful for molecular biomarker detection. However, statistical tests, such as t-tests, significance analysis of microarrays (SAM), and eBayes, usually extract dysfunctional molecules from comprehensive expression data and are incorporated as an essential analytical phase in several metabolic identification pipelines. In addition, several novel computational tools have been established as secondary analysis tools to allow metabolomics researchers to grasp the powers of their data and create more beyond-achieving biological decisions than ever before. This section explains the functionality and use of various secondary analysis tools.
The MarVis-Suite [31] (http://marvis.gobics.de, accessed on 1 April 2022) (Marker Visualization) toolbox for interactive ranking, combination, filtering, visualization, clustering, and functional analysis of datasets, including intensity-based profile vectors, as found, e.g., in MS, microarray, or RNA-seq experiments.
MetExplore [32] (https://metexplore.toulouse.inra.fr/metexplore2/, accessed on 1 April 2022) offers an easy-to-use complete online solution comprised of interactive tools for metabolic network curation, network exploration, and omics data study. MetExplore holds the concepts of metabolic networks and significantly improves multi-omics data analysis.
Pathway Activity Profiling [33] (PAPi) (http://www.4shared.com/file/s0uIYWIg/PAPi_10.html, accessed on 1 April 2022) compares metabolic pathway activities from metabolite profiles. PAPi can reach the activity of metabolic pathways in several situations, which delivers excellent help for hypothesis creation and simplifies biological interpretation.
Metabolites Biological Role (MBROLE) [34] (http://csbg.cnb.csic.es/mbrole2, accessed on 1 April 2022) is a server that performs the functional enrichment research of a list of chemical compounds obtained from a metabolomics experiment, which helps the list to be explained in biological terms.
MBROLE analyzes an extensive diversity of functional annotations that define several distinct aspects of the biology and chemistry of chemical compounds; these involve pathways and sub-pathways, interactions with proteins, enzymes, and more kinds of molecules, chemical classifications and taxonomies, physiological locations, and biological functions, and applications.
MeltDB 2.0 [53] (https://meltdb.cebitec.uni-bielefeld.de, accessed on 1 April 2022) is a next-generation web application delivering storage, standardization, sharing, integration, and the analysis of metabolomics assays.
MetaboAnalyst version 5.0 [35] (https://www.metaboanalyst.ca, accessed on 1 April 2022) is a fully automated web interface to bridge raw data to functional insights for global metabolomics based on high-resolution mass spectrometry (HRMS). MetaboAnalyst performs enhanced peak detection, annotation tasks, and alignment for LC-MS data produced in global metabolomics. The key features of MetaboAnalyst are that it includes: (1) the MetaboAnalystR package in the R environment, (2) large libraries for metabolite sets and metabolic pathways, (3) metabolomic biomarker metanalysis, (4) the integration of multi-omics data over visualization and knowledge-based network analysis, and (5) an easy and free, accessible tool.
Metabolite pathway enrichment analysis (MPEA) [36] (http://ekhidna.biocenter.helsinki.fi/poxo/mpea/, accessed on 1 April 2022) is a metabolomics pathway enrichment tool for visualization and biological interpretation. MPEA is limited to top-down/bottom-up analysis. MetaP-server [55] (http://metabolomics.helmholtz-muenchen.de/metap2/, accessed on 1 April 2022) is a user-friendly web-server-based for metabolomics data analysis. It covers data acquisition to biological interpretation: (i) data quality checks, (ii) estimate of reproducibility and batch effects, (iii) hypothesis assessments for several categorical phenotypes, (iv) correlation analyses for metric phenotypes, (v) optionally involving all potential sets of metabolite concentration ratios, (vi)mapping of metabolites against colored KEGG pathway maps and (vii) PCA.
Mass TRanslator into Pathways (MassTRIX) [54] (www.masstrix.org, accessed on 1 April 2022) annotates metabolites in high-precision MS data. It marks the discovered chemical compounds on KEGG pathway maps using the KEGG/API. In addition, genes or enzymes can be underlined to denote information on gene transcription or differences in the gene complement of several bacterial strains.
Pathos [56] (http://motif.gla.ac.uk/Pathos/, accessed on 1 April 2022) is a web-based tool for analyzing raw or processed metabolomics mass spectra and demonstrating the metabolites identified and alterations in their experimental abundance within the context of their associated metabolic pathways. Pathos is limited to specific organism databases.
PaintOmics 3 [37] (www.paintomics.org, accessed on 1 April 2022) is a web-based tool for the integrated visualization of several omic data types onto KEGG pathway diagrams. PaintOmics 3 combines server-end abilities for data analysis with the capability of modern web resources for data visualization, delivering investigators with a robust framework for an interactive examination of their multi-omics information.
IMPaLA [38] (http://impala.molgen.mpg.de, accessed on 1 April 2022) is a web-based tool for joint pathway analysis with expression (genes/proteins) and metabolite data. It performs enrichment analysis or over-representation with user-specified lists of genes and metabolites utilizing more than three thousand pre-annotated pathways from eleven databases.
MetaMapR [39] (http://dgrapov.github.io/MetaMapR/, accessed on 1 April 2022) is a free-source, web-based, or desktop software employed in the R programming language. It incorporates enzymatic transformations with metabolite structural similarity, mass spectral similarity, and empirical relationships to create well-associated metabolic networks.
The Layered Enrichment Analysis of Pathways (LeapR) [40] (https://github.com/biodataganache/leapR, accessed on 1 April 2022) is a framework to measure biological pathway activity utilizing various statistical analyses and data resources, permitting facile incorporation of multisource data.
PAthway NEtwork Visualizer (PANEV) [41] (https://github.com/vpalombo/PANEV, accessed on 1 April 2022) is an R package for gene or pathway-based network visualization. Using KEGG, it visualizes genes within a network of multiple levels of interlinked upstream and downstream pathways. The network graph visualization facilitates interpreting the functional profiles of gene clusters. However, PANEV is a KEGG-based tool that can be considered a limitation because of KEGG’s lack of or incomplete information.
PathfindR [42] is an R package using protein-protein interaction information and active-subnetwork-oriented pathway enrichment analyses for class comparison omics experiments. It also provides functionality for clustering the resulting pathways.
Ingenuity Pathway Analysis [43] (IPA, http://www.ingenuity.com, accessed on 1 April 2022) is a comprehensive visualization software or database search tool for discovering functions and pathways for specific biological conditions. IPA helps realize complex omics data and achieve insightful data analysis and interpretation by putting experimental results in the context of biological systems. Its pathway focuses on protein-protein interactions, protein–compound interactions, metabolic, signaling, gene regulation, and diagrams.
iPath3.0 [44] (http://pathways.embl.de, accessed on 1 April 2022) is a free web-based tool for visualization, customization, and analysis of various KEGG cellular pathways. In addition, version 3 can deal with metabolic and regulatory pathways and the biosynthesis of secondary metabolites.
ReactomePA [45] (http://www.bioconductor.org/packages/ReactomePA, accessed on 1 April 2022) is a free R/Bioconductor package delivering enrichment analyses involving gene set enrichment analyses and hypergeometric tests. For example, functional analysis can be applied to the genomic coordination taken from a sequencing experiment to explore a genomic loci’s functional significance, including non-coding regions and cis-regulatory elements. In addition, ReactomePA offers various visualization functions to generate very customizable, publication-quality figures.
MetExploreViz [46] (http://metexplore.toulouse.inra.fr/metexploreViz/doc/, accessed on 1 April 2022) is an open-source web component for visualizing pathways and metabolic networks and presents a solution to examine omics data in a biochemical perspective.
Recon3D [47] (http://vmh.life, accessed on 1 April 2022and http://bigg.ucsd.edu/, accessed on 1 April 2022) is a computational source that comprises protein structure data and three-dimensional (3D) metabolite and allows integrated analyses of metabolic functions in humans. Recon3D is the most comprehensive human metabolic network model, reporting 3288 open reading frames (representing 17% of functionally annotated human genes), including 12,890 protein structures, 4140 unique metabolites, and 13,543 metabolic reactions. These data offer an outstanding resource for examining molecular mechanisms of human metabolism.
ChemRICH [48] (www.chemrich.fiehnlab.ucdavis.edu, accessed on 1 April 2022 and www.github.com/barupal/chemrich, accessed on 1 April 2022) is a statistical enrichment method relying on chemical similarity instead of sparse biochemical knowledge annotations. ChemRICH utilizes chemical ontologies and structure similarity to map all known metabolites and name metabolic modules. Unlike pathway mapping, this strategy generates research-specific, non-intersecting groups of all identified metabolites.
KEGGREST [49] (bioconductor.org/packages/release/bioc/html/KEGGREST.html, accessed on 1 April 2022) is an R package employed to build an adjacency matrix that links the dataset’s metabolites with their matching KEGG pathways. First, one is allocated if the metabolite is part of that specific pathway or 0 if not. The following five metabolites of each pathway were at random samples.
MetaX [50] offers several functions: peak picking and annotation, data quality assessment, missing and zero values imputation, data standardization/normalization, univariate and multivariate statistical analysis, power analysis and sample size estimate, receiver operating characteristic (ROC) analysis, biomarkers selection, and pathway annotation, correlation network analysis, and metabolite identification. It is available as a web-based interface and R package (http://metax.genomics.cn, accessed on 1 April 2022).
Biomarker Discovery by Machine Learning (BioDiscML) [51] (https://github.com/mickaelleclercq/BioDiscML, accessed on 1 April 2022) is a biomarker discovery tool that exploits several features for selection methods to generate signatures coupled with machine learning models that will predict a particular outcome efficiently. BioDiscML employs a massive selection of machine-learning algorithms to choose the ultimate combination of biomarkers for expecting continuous and categorical results from very unbalanced datasets. BioDiscML can implement data pre-processing, features and model selection, and performance assessment. The software tool is developed in JAVA 8 language and uses the Weka 3.8 machine learning library. It outperforms recent tools for discovering biomarkers’ signatures.
ASICS [70] is an R package that covers a full workflow to analyze spectra from NMR experiments. It includes an automatic method to identifying and quantifying metabolites in a complex mixture spectrum and utilizes the quantification outcomes in untargeted and targeted statistical experiments. However, ASICS has algorithm limitations: the difficulty in detecting the low concentration metabolites or their peaks, all placed in an area with a high density of peaks.
3Omics [52] (http://3omics.cmdm.tw, accessed on 1 April 2022) is a web-based visualization tool incorporating human metabolomic, transcriptomic, and proteomic data. It produces inter-Omics correlation networks to visualize data associations for all metabolites, transcripts, and proteins for time or experimental situations.
Also, one study [71] examined about 100 metabolomics software sources, databases, tools, and more utilities that have emerged or been enhanced in 2019. Similarly, around 85 metabolomics software sources, tools, packages, databases, and other utilities that appeared in 2020 were released in a recent study [72]. Finally, Table 2 surveyed commonly used metabolomics tools in the literature.
Each tool has strengths and weaknesses and should not come from using one over the other. Due to the complexity of metabolomics data, it is essential to regard the outcomes from the secondary analysis with caution. For example, enrichment analysis can generate significant pathway hits from only one or two metabolites in a pathway. As such, precise scrutinization and logical biological interpretation of the data should be undertaken. With this in mind, metabolomics scientists should incorporate secondary analysis into their analyses, as these beneficial outcomes can be attained rapidly [73]. The secondary analysis field is coming into its own, and its steady growth will help enhance the success of the metabolomics approach. These cutting-edge bioinformatics analysis tools that are completely incorporated with various functions and are accessible and manageable by users who lack prior knowledge in programming are vital in metabolomics research. They will persist in enabling discoveries and more significant insights for increasing metabolomics research.
4. Discussion and Concluding Remarks
This paper has highlighted extensive lists of metabolomics databases and computer-aided tools.
Databases are considered the cornerstone in metabolomics assays, and choosing a database could substantially affect the results. During recent decades, advancements in metabolomics databases have caused several formalization schemes, impeding the interoperability among these resources and generating data silos. In addition, metabolomics database selection, metabolite misidentification rate, and assay chemical bias of several analytical platforms will impact subsequent methods. Therefore, the suggestion to overcome the database’s pitfalls is to perform organism-specific metabolomics analysis using multiple databases and form a consensus signature using the outcomes. Databases integration comprising multiple databases, such as the ConsensusPathDB [74] or PathMe [75], might be helpful and consider continuing attempts to standardize the different resources.
A critical overview of the performance of selected bioinformatics tools for omics datasets is presented for the first time. These tools include BioCyc/HumanCyc [12], ConsensusPathDB [72], MBRole [34], IMPaLA [38], Metabox [76], MetaboAnalyst [35], MetExplore [32], MPEA [36], Reactome [11], PathVisio [77], and KEGGREST [49]. Despite the tool’s variability, they generated coherent outcomes independent of their analytical method. Nevertheless, further effort on the completeness of metabolomics databases is necessary, dramatically impacting the accuracy of the analysis.
Computer-aided tools are evolving, and recently, an abundance exists for metabolomics researchers [78]. Moreover, these tools have promising features to elevate metabolomics research [79,80]. User-friendly, open access and instant results are desirable attributes.
However, high-quality data analysis tools are crucial for repeatability, reproducibility, and minimal uncertainty. An experiment should generate similar responses using the same inputs; otherwise, there is little promise that an algorithm can be predictive. Therefore, the available tools should be classified based on performance; however, lacking a measure to validate their performance. Few studies have attempted to compare and measure various tools’ performance, yet more efforts are required to embrace these tools with certainty.
Metabolomic technological capabilities and data sharing, for instance, database incorporation, will be crucial in the future expansion of metabolomics and enable enhancements in multi-organism systems biology.
Author Contributions
Conceptualization, B.H.B.; methodology, B.H.B.; validation, B.H.B., A.S. and H.A.; formal analysis, B.H.B., A.S. and H.A.; investigation, B.H.B., A.S. and H.A; resources, B.H.B., A.S. and H.A.; data curation, B.H.B., A.S. and H.A.; writing—original draft preparation, B.H.B.; writing—review and editing, B.H.B., A.S. and H.A.; visualization, B.H.B.; supervision, A.S. and H.A.; project administration, A.S. and H.A.; funding acquisition, A.S. All authors have read and agreed to the published version of the manuscript.
Funding
This research was funded by internal funds provided by the American University of Sharjah (Grant code: FRG20-M-E108).
Conflicts of Interest
The authors declare no conflict of interest. The funders had no role in the design of the study; in the collection, analyses, or interpretation of data; in the writing of the manuscript, or in the decision to publish the results.
References
- Weinstein, J.N. ‘Omic’and hypothesis-driven research in the molecular pharmacology of cancer. Curr. Opin. Pharmacol. 2002, 2, 361–365. [Google Scholar] [CrossRef]
- Ge, H.; Walhout, A.J.M.; Vidal, M. Integrating ‘omic’information: A bridge between genomics and systems biology. TRENDS Genet. 2003, 19, 551–560. [Google Scholar] [CrossRef]
- Mi, K.; Jiang, Y.; Chen, J.; Lv, D.; Qian, Z.; Sun, H.; Shang, D. Construction and Analysis of Human Diseases and Metabolites Network. Front. Bioeng. Biotechnol. 2020, 8, 398. (In English) [Google Scholar] [CrossRef]
- Schneider, M.V.; Orchard, S. Omics technologies, data and bioinformatics principles. In Bioinformatics for Omics Data; Springer: Berlin/Heidelberg, Germany, 2011; pp. 3–30. [Google Scholar]
- Izonin, I.; Shakhovska, N. Informatics & data-driven medicine. Math. Biosci. Eng. 2021, 18, 6430–6433. [Google Scholar] [PubMed]
- van der Kleij, R.M.; Kasteleyn, M.J.; Meijer, E.; Bonten, T.N.; Houwink, E.J.; Teichert, M.; van Luenen, S.; Vedanthan, R.; Evers, A.; Car, J.; et al. SERIES: eHealth in primary care. Part 1: Concepts, conditions and challenges. Eur. J. Gen. Pract. 2019, 25, 179–189. [Google Scholar] [CrossRef] [PubMed]
- Marcolino, M.S.; Oliveira, J.A.Q.; D’Agostino, M.; Ribeiro, A.L.; Alkmim, M.B.M.; Novillo-Ortiz, D. The impact of mHealth interventions: Systematic review of systematic reviews. JMIR Mhealth Uhealth 2018, 6, e8873. [Google Scholar] [CrossRef] [PubMed]
- Mathews, S.C.; McShea, M.J.; Hanley, C.L.; Ravitz, A.; Labrique, A.B.; Cohen, A.B. Digital health: A path to validation. NPJ Digit. Med. 2019, 2, 38. [Google Scholar] [CrossRef]
- Patel, D.T. Big Data Analytics in Bioinformatics. In Biotechnology: Concepts, Methodologies, Tools, and Applications; IGI Global: Pennsylvania, PA, USA, 2019; pp. 1967–1984. [Google Scholar]
- Dash, S.; Shakyawar, S.K.; Sharma, M.; Kaushik, S. Big data in healthcare: Management, analysis and future prospects. J. Big Data 2019, 6, 54. [Google Scholar]
- Gillespie, M.; Jassal, B.; Stephan, R.; Milacic, M.; Rothfels, K.; Senff-Ribeiro, A.; Griss, J.; Sevilla, C.; Matthews, L.; Gong, C. The reactome pathway knowledgebase 2022. Nucleic Acids Res. 2021, 50, D687–D692. [Google Scholar] [CrossRef]
- Karp, P.D.; Billington, R.; Caspi, R.; Fulcher, C.A.; Latendresse, M.; Kothari, A.; Keseler, I.M.; Krummenacker, M.; Midford, P.E.; Ong, Q.; et al. The BioCyc collection of microbial genomes and metabolic pathways. Brief. Bioinform. 2019, 20, 1085–1093. [Google Scholar] [CrossRef]
- Caspi, R.; Billington, R.; Keseler, I.M.; Kothari, A.; Krummenacker, M.; Midford, P.E.; Ong, W.K.; Paley, S.; Subhraveti, P.; Karp, P.D. The MetaCyc database of metabolic pathways and enzymes-a 2019 update. Nucleic Acids Res. 2020, 48, D445–D453. [Google Scholar] [CrossRef]
- Keseler, I.M.; Gama-Castro, S.; Mackie, A.; Billington, R.; Bonavides-Martínez, C.; Caspi, R.; Kothari, A.; Krummenacker, M.; Midford, P.E.; Muñiz-Rascado, L.; et al. The EcoCyc database in 2021. Front. Microbiol. 2021, 12, 2098. [Google Scholar] [CrossRef] [PubMed]
- Norsigian, C.J.; Pusarla, N.; McConn, J.L.; Yurkovich, J.T.; Dräger, A.; O Palsson, B.; King, Z. BiGG Models 2020: Multi-strain genome-scale models and expansion across the phylogenetic tree. Nucleic Acids Res. 2020, 48, D402–D406. [Google Scholar] [CrossRef] [PubMed]
- Kanehisa, M.; Furumichi, M.; Sato, Y.; Ishiguro-Watanabe, M.; Tanabe, M. KEGG: Integrating viruses and cellular organisms. Nucleic Acids Res. 2021, 49, D545–D551. [Google Scholar] [CrossRef]
- Chang, A.; Jeske, L.; Ulbrich, S.; Hofmann, J.; Koblitz, J.; Schomburg, I.; Neumann-Schaal, M.; Jahn, D.; Schomburg, D. BRENDA, the ELIXIR core data resource in 2021: New developments and updates. Nucleic Acids Res. 2021, 49, D498–D508. [Google Scholar] [CrossRef] [PubMed]
- Kim, S.; Chen, J.; Cheng, T.; Gindulyte, A.; He, J.; He, S.; Li, Q.; Shoemaker, B.A.; Thiessen, P.A.; Yu, B.; et al. PubChem in 2021: New data content and improved web interfaces. Nucleic Acids Res. 2021, 49, D1388–D1395. [Google Scholar] [CrossRef] [PubMed]
- Hastings, J.; Owen, G.; Dekker, A.; Ennis, M.; Kale, N.; Muthukrishnan, V.; Turner, S.; Swainston, N.; Mendes, P.; Steinbeck, C. ChEBI in 2016: Improved services and an expanding collection of metabolites. Nucleic Acids Res. 2016, 44, D1214–D1219. [Google Scholar] [CrossRef]
- Wishart, D.S.; Guo, A.; Oler, E.; Wang, F.; Anjum, A.; Peters, H.; Dizon, R.; Sayeeda, Z.; Tian, S.; Lee, B.L.; et al. HMDB 5.0: The Human Metabolome Database for 2022. Nucleic Acids Res. 2022, 50, D622–D631. [Google Scholar] [CrossRef]
- Pence, H.E.; Williams, A. ChemSpider: An online chemical information resource. J. Chem. Educ. 2010, 87, 1123–1124. [Google Scholar] [CrossRef]
- Haug, K.; Cochrane, K.; Nainala, V.C.; Williams, M.; Chang, J.; Jayaseelan, K.V.; O’Donovan, C. MetaboLights: A resource evolving in response to the needs of its scientific community. Nucleic Acids Res. 2020, 48, D440–D444. [Google Scholar] [CrossRef]
- Sud, M.; Fahy, E.; Cotter, D.; Azam, K.; Vadivelu, I.; Burant, C.; Edison, A.; Fiehn, O.; Higashi, R.; Nair, K.S.; et al. Metabolomics Workbench: An international repository for metabolomics data and metadata, metabolite standards, protocols, tutorials and training, and analysis tools. Nucleic Acids Res. 2016, 44, D463–D470. [Google Scholar] [CrossRef] [PubMed]
- Jewison, T.; Su, Y.; Disfany, F.M.; Liang, Y.; Knox, C.; Maciejewski, A.; Poelzer, J.; Huynh, J.; Zhou, Y.; Arndt, D.; et al. SMPDB 2.0: Big improvements to the Small Molecule Pathway Database. Nucleic Acids Res. 2014, 42, D478–D484. [Google Scholar] [CrossRef] [PubMed]
- Cheng, L.; Yang, H.; Zhao, H.; Pei, X.; Shi, H.; Sun, J.; Zhang, Y.; Wang, Z.; Zhou, M. MetSigDis: A manually curated resource for the metabolic signatures of diseases. Brief. Bioinform. 2019, 20, 203–209. [Google Scholar] [CrossRef]
- Noronha, A.; Modamio, J.; Jarosz, Y.; Guerard, E.; Sompairac, N.; Preciat, G.; Daníelsdóttir, A.D.; Krecke, M.; Merten, D.; Haraldsdóttir, H.S. The Virtual Metabolic Human database: Integrating human and gut microbiome metabolism with nutrition and disease. Nucleic Acids Res. 2019, 47, D614–D624. [Google Scholar] [CrossRef] [PubMed]
- Rodchenkov, I.; Babur, O.; Luna, A.; Aksoy, B.A.; Wong, J.V.; Fong, D.; Franz, M.; Siper, M.C.; Cheung, M.; Wrana, M.; et al. Pathway Commons 2019 Update: Integration, analysis and exploration of pathway data. Nucleic Acids Res. 2020, 48, D489–D497. [Google Scholar] [CrossRef] [PubMed]
- Slenter, D.N.; Kutmon, M.; Hanspers, K.; Riutta, A.; Windsor, J.; Nunes, N.; Mélius, J.; Cirillo, E.; Coort, S.L.; Digles, D.; et al. WikiPathways: A multifaceted pathway database bridging metabolomics to other omics research. Nucleic Acids Res. 2018, 46, D661–D667. [Google Scholar] [CrossRef]
- Zhang, B.; Hu, S.; Baskin, E.; Patt, A.; Siddiqui, J.K.; Mathé, E.A. RaMP: A comprehensive relational database of metabolomics pathways for pathway enrichment analysis of genes and metabolites. Metabolites 2018, 8, 16. [Google Scholar] [CrossRef]
- Pu, J.; Yu, Y.; Liu, Y.; Tian, L.; Gui, S.; Zhong, X.; Fan, C.; Xu, S.; Song, X.; Liu, L.; et al. MENDA: A comprehensive curated resource of metabolic characterization in depression. Brief. Bioinform. 2020, 21, 1455–1464. [Google Scholar] [CrossRef]
- Kaever, A.; Landesfeind, M.; Feussner, K.; Mosblech, A.; Heilmann, I.; Morgenstern, B.; Feussner, I.; Meinicke, P. MarVis-Pathway: Integrative and exploratory pathway analysis of non-targeted metabolomics data. Metabolomics 2015, 11, 764–777. [Google Scholar] [CrossRef]
- Cottret, L.; Frainay, C.; Chazalviel, M.; Cabanettes, F.; Gloaguen, Y.; Camenen, E.; Merlet, B.; Heux, S.; Portais, J.-C.; Poupin, N.; et al. MetExplore: Collaborative edition and exploration of metabolic networks. Nucleic Acids Res. 2018, 46, W495–W502. [Google Scholar] [CrossRef]
- Aggio, R.B.M.; Ruggiero, K.; Villas-Bôas, S.G. Pathway Activity Profiling (PAPi): From the metabolite profile to the metabolic pathway activity. Bioinformatics 2010, 26, 2969–2976. [Google Scholar] [CrossRef] [PubMed]
- López-Ibáñez, J.; Pazos, F.; Chagoyen, M. MBROLE 2.0—Functional enrichment of chemical compounds. Nucleic Acids Res. 2016, 44, W201–W204. [Google Scholar] [CrossRef] [PubMed]
- Pang, Z.; Chong, J.; Zhou, G.; de Lima Morais, D.A.; Chang, L.; Barrette, M.; Gauthier, C.; Jacques, P.-É.; Li, S.; Xia, J. MetaboAnalyst 5.0: Narrowing the gap between raw spectra and functional insights. Nucleic Acids Res. 2021, 49, W388–W396. [Google Scholar] [CrossRef]
- Kankainen, M.; Gopalacharyulu, P.; Holm, L.; Orešič, M. MPEA—Metabolite pathway enrichment analysis. Bioinformatics 2011, 27, 1878–1879. [Google Scholar] [CrossRef] [PubMed]
- Hernández-de-Diego, R.; Tarazona, S.; Martínez-Mira, C.; Balzano-Nogueira, L.; Furió-Tarí, P.; Pappas, G.J., Jr.; Conesa, A. PaintOmics 3: A web resource for the pathway analysis and visualization of multi-omics data. Nucleic Acids Res. 2018, 46, W503–W509. [Google Scholar] [CrossRef] [PubMed]
- Kamburov, A.; Cavill, R.; Ebbels, T.M.D.; Herwig, R.; Keun, H.C. Integrated pathway-level analysis of transcriptomics and metabolomics data with IMPaLA. Bioinformatics 2011, 27, 2917–2918. [Google Scholar] [CrossRef]
- Grapov, D.; Wanichthanarak, K.; Fiehn, O. MetaMapR: Pathway independent metabolomic network analysis incorporating unknowns. Bioinformatics 2015, 31, 2757–2760. [Google Scholar] [CrossRef]
- Danna, V.; Mitchell, H.; Anderson, L.; Godinez, I.; Gosline, S.J.C.; Teeguarden, J.; McDermott, J.E. leapR: An R Package for Multiomic Pathway Analysis. J. Proteome Res. 2021, 20, 2116–2121. [Google Scholar] [CrossRef]
- Palombo, V.; Milanesi, M.; Sferra, G.; Capomaccio, S.; Sgorlon, S.; D’Andrea, M. PANEV: An R package for a pathway-based network visualization. BMC Bioinform. 2020, 21, 46. [Google Scholar] [CrossRef]
- Ulgen, E.; Ozisik, O.; Sezerman, O.U. pathfindR: An R package for comprehensive identification of enriched pathways in omics data through active subnetworks. Front. Genet. 2019, 10, 858. [Google Scholar] [CrossRef]
- Krämer, A.; Green, J.; Pollard, J., Jr.; Tugendreich, S. Causal analysis approaches in ingenuity pathway analysis. Bioinformatics 2014, 30, 523–530. [Google Scholar] [CrossRef] [PubMed]
- Darzi, Y.; Letunic, I.; Bork, P.; Yamada, T. iPath3. 0: Interactive pathways explorer v3. Nucleic Acids Res. 2018, 46, W510–W513. [Google Scholar] [CrossRef] [PubMed]
- Yu, G.; He, Q.-Y. ReactomePA: An R/Bioconductor package for reactome pathway analysis and visualization. Mol. BioSystems 2016, 12, 477–479. [Google Scholar] [CrossRef] [PubMed]
- Chazalviel, M.; Frainay, C.; Poupin, N.; Vinson, F.; Merlet, B.; Gloaguen, Y.; Cottret, L.; Jourdan, F. MetExploreViz: Web component for interactive metabolic network visualization. Bioinformatics 2018, 34, 312–313. [Google Scholar] [CrossRef] [PubMed]
- Brunk, E.; Sahoo, S.; Zielinski, D.C.; Altunkaya, A.; Dräger, A.; Mih, N.; Gatto, F.; Nilsson, A.; Preciat Gonzalez, G.A.; Aurich, M.K.; et al. Recon3D enables a three-dimensional view of gene variation in human metabolism. Nat. Biotechnol. 2018, 36, 272–281. [Google Scholar] [CrossRef]
- Barupal, D.K.; Fiehn, O. Chemical Similarity Enrichment Analysis (ChemRICH) as alternative to biochemical pathway mapping for metabolomic datasets. Sci. Rep. 2017, 7, 14567. [Google Scholar] [CrossRef]
- Tenenbaum, D.; Runit, S.; Maintainer, M.B.P.; Carlson, M.; ThirdPartyClient. Package ‘KEGGREST’; R Foundation for Statistical Computing: Vienna, Austria, 2019. [Google Scholar]
- Wen, B.; Mei, Z.; Zeng, C.; Liu, S. metaX: A flexible and comprehensive software for processing metabolomics data. BMC Bioinform. 2017, 18, 183. [Google Scholar] [CrossRef]
- Leclercq, M.; Vittrant, B.; Martin-Magniette, M.L.; Boyer, M.P.S.; Perin, O.; Bergeron, A.; Fradet, Y.; Droit, A. Large-scale automatic feature selection for biomarker discovery in high-dimensional OMICs data. Front. Genet. 2019, 10, 452. [Google Scholar] [CrossRef]
- Kuo, T.-C.; Tian, T.-F.; Tseng, Y.J. 3Omics: A web-based systems biology tool for analysis, integration and visualization of human transcriptomic, proteomic and metabolomic data. BMC Syst. Biol. 2013, 7, 64. [Google Scholar] [CrossRef]
- Kessler, N.; Neuweger, H.; Bonte, A.; Langenkämper, G.; Niehaus, K.; Nattkemper, T.W.; Goesmann, A. MeltDB 2.0–advances of the metabolomics software system. Bioinformatics 2013, 29, 2452–2459. [Google Scholar] [CrossRef]
- Wägele, B.; Witting, M.; Schmitt-Kopplin, P.; Suhre, K. MassTRIX reloaded: Combined analysis and visualization of transcriptome and metabolome data. PLoS ONE 2012, 7, e39860. [Google Scholar] [CrossRef] [PubMed]
- Kastenmüller, G.; Römisch-Margl, W.; Wägele, B.; Altmaier, E.; Suhre, K. metaP-server: A web-based metabolomics data analysis tool. J. Biomed. Biotechnol. 2011, 2011, 839862. [Google Scholar] [CrossRef] [PubMed]
- Leader, D.P.; Burgess, K.; Creek, D.; Barrett, M.P. Pathos: A web facility that uses metabolic maps to display experimental changes in metabolites identified by mass spectrometry. Rapid Commun. Mass Spectrom. 2011, 25, 3422–3426. [Google Scholar] [CrossRef] [PubMed]
- Romero, P.; Wagg, J.; Green, M.L.; Kaiser, D.; Krummenacker, M.; Karp, P.D. Computational prediction of human metabolic pathways from the complete human genome. Genome Biol. 2005, 6, R2. [Google Scholar] [CrossRef] [PubMed]
- Ulrich, E.L.; Akutsu, H.; Doreleijers, J.F.; Harano, Y.; Ioannidis, Y.E.; Lin, J. BioMagResBank. Nucleic Acids Res. 2008, 36, D402–D408. [Google Scholar] [CrossRef] [PubMed]
- Kopka, J.; Schauer, N.; Krueger, S.; Birkemeyer, C.; Usadel, B.; Bergmuller, E.; Dormann, P.; Weckwerth, W.; Gibon, Y.; Stitt, M.; et al. GMD@ CSB. DB: The Golm metabolome database. Bioinformatics 2005, 21, 1635–1638. [Google Scholar] [CrossRef]
- Prendeville, S.; Sanders, C.; Sherry, J.; Costa, F. NIST Standard Reference Database 1A; Standard Reference Data; NIST: Gaithersburg, MD, USA, 2014. Available online: https://www.nist.gov/srd/nist-standard-referencedatabase-1a (accessed on 1 April 2022).
- Zhou, W.; Ying, Y.; Xie, L. Spectral database systems: A review. Appl. Spectrosc. Rev. 2012, 47, 654–670. [Google Scholar] [CrossRef]
- Bader, G.D.; Cary, M.P.; Sander, C. Pathguide: A pathway resource list. Nucleic Acids Res. 2006, 34, D504–D506. [Google Scholar] [CrossRef]
- Kumar, A.; Suthers, P.F.; Maranas, C.D. MetRxn: A knowledgebase of metabolites and reactions spanning metabolic models and databases. BMC Bioinform. 2012, 13, 6. [Google Scholar] [CrossRef]
- Alcántara, R.; Axelsen, K.; Morgat, A.; Belda, E.; Coudert, E.; Bridge, A.; Cao, H.; De Matos, P.; Ennis, M.; Turner, S.; et al. Rhea—A manually curated resource of biochemical reactions. Nucleic Acids Res. 2012, 40, D754–D760. [Google Scholar] [CrossRef]
- Fahy, E.; Subramaniam, S. RefMet: A reference nomenclature for metabolomics. Nat. Methods 2020, 17, 1173–1174. [Google Scholar] [CrossRef] [PubMed]
- Wieder, C.; Frainay, C.; Poupin, N.; Rodríguez-Mier, P.; Vinson, F.; Cooke, J.; Lai, R.P.; Bundy, J.G.; Jourdan, F.; Ebbels, T. Pathway analysis in metabolomics: Recommendations for the use of over-representation analysis. PLoS Comput. Biol. 2021, 17, e1009105. [Google Scholar] [CrossRef] [PubMed]
- Van Rossum, G. Python Reference Manual; Department of Computer Science [CS]; CWI: Amsterdam, The Netherlands, 1995. [Google Scholar]
- R Core Team. R: A Language and Environment for Statistical Computing; R Foundation for Statistical Computing: Vienna, Austria, 2018. [Google Scholar]
- Barupal, D.K.; Fan, S.; Fiehn, O. Integrating bioinformatics approaches for a comprehensive interpretation of metabolomics datasets. Curr. Opin. Biotechnol. 2018, 54, 1–9. [Google Scholar] [CrossRef]
- Lefort, G.; Liaubet, L.; Canlet, C.; Tardivel, P.; Père, M.-C.; Quesnel, H.; Paris, A.; Iannuccelli, N.; Vialaneix, N.; Servien, R. ASICS: An R package for a whole analysis workflow of 1D 1H NMR spectra. Bioinformatics 2019, 35, 4356–4363. [Google Scholar] [CrossRef] [PubMed]
- O’Shea, K.; Misra, B.B. Software tools, databases and resources in metabolomics: Updates from 2018 to 2019. Metabolomics 2020, 16, 36. [Google Scholar] [CrossRef] [PubMed]
- Misra, B.B. New software tools, databases, and resources in metabolomics: Updates from 2020. Metabolomics 2021, 17, 49. [Google Scholar] [CrossRef] [PubMed]
- Booth, S.C.; Weljie, A.M.; Turner, R.J. Computational tools for the secondary analysis of metabolomics experiments. Comput. Struct. Biotechnol. J. 2013, 4, e201301003. [Google Scholar] [CrossRef]
- Kamburov, A.; Wierling, C.; Lehrach, H.; Herwig, R. ConsensusPathDB—A database for integrating human functional interaction networks. Nucleic Acids Res. 2009, 37, D623–D628. [Google Scholar] [CrossRef]
- Domingo-Fernández, D.; Mubeen, S.; Marín-Llaó, J.; Hoyt, C.T.; Hofmann-Apitius, M. PathMe: Merging and exploring mechanistic pathway knowledge. BMC Bioinform. 2019, 20, 243. [Google Scholar] [CrossRef]
- Wanichthanarak, K.; Fan, S.; Grapov, D.; Barupal, D.K.; Fiehn, O. Metabox: A toolbox for metabolomic data analysis, interpretation and integrative exploration. PLoS ONE 2017, 12, e0171046. [Google Scholar] [CrossRef]
- Kutmon, M.; van Iersel, M.; Bohler, A.; Kelder, T.; Nunes, N.; Pico, A.; Evelo, C.T. PathVisio 3: An extendable pathway analysis toolbox. PLoS Comput. Biol. 2015, 11, e1004085. [Google Scholar] [CrossRef] [PubMed]
- Banimfreg, B.H. Biomarker Discovery Utilizing Big Data: The Case of Diabetes in United Arab Emirates. Doctoral Dissertation, American University of Sharjah, Sharjah, United Arab Emirates, 2022. [Google Scholar]
- Banimfreg, B.H.; Shamayleh, A.; Alshraideh, H.; Semreen, M.H.; Soares, N.C. Untargeted approach to investigating the metabolomics profile of type 2 diabetes emiratis. J. Proteom. 2022, 269, 104718. [Google Scholar] [CrossRef] [PubMed]
- Banimfreg, B.H.; Alshraideh, H.; Shamayleh, A.; Guella, A.; Semreen, M.H.; Al Bataineh, M.T.; Soares, N.C. Untargeted Metabolomic Plasma Profiling of Emirati Dialysis Patients with Diabetes versus Non-Diabetic: A Pilot Study. Biomolecules 2022, 12, 962. [Google Scholar] [CrossRef] [PubMed]


Publisher’s Note: MDPI stays neutral with regard to jurisdictional claims in published maps and institutional affiliations. |
© 2022 by the authors. Licensee MDPI, Basel, Switzerland. This article is an open access article distributed under the terms and conditions of the Creative Commons Attribution (CC BY) license (https://creativecommons.org/licenses/by/4.0/).