
A Metabolomics Approach to Sulforaphane Efficacy in Secondhand Smoking-Induced Pulmonary Damage in Mice


Abstract
:
1. Introduction
2. Results
2.1. Changes in Body Weights
2.2. Histopathologic Examination
2.3. SHS Regulated Metabolites in Serum and Lungs
3. Discussion
4. Methods
4.1. Chemicals
4.2. Animals and Treatment
4.3. Histopathologic Examination
4.4. Metabolomics
4.4.1. H-NMR Spectroscopic Analysis
4.4.2. Multivariate and Statistical Analysis
5. Conclusions
Supplementary Materials
Author Contributions
Funding
Institutional Review Board Statement
Informed Consent Statement
Data Availability Statement
Conflicts of Interest
References
- Yagishita, Y.; Fahey, J.W.; Dinkova-Kostova, A.; Kensler, T.W. Broccoli or Sulforaphane: Is It the Source or Dose That Matters? Molecules 2019, 24, 3593. [Google Scholar] [CrossRef] [PubMed] [Green Version]
- Zhao, Y.D.; Yin, L.; Archer, S.; Lu, C.; Zhao, G.; Yao, Y.; Wu, L.; Hsin, M.; Waddell, T.K.; Keshavjee, S.; et al. Metabolic heterogeneity of idiopathic pulmonary fibrosis: A metabolomic study. BMJ Open Respir. Res. 2017, 4, e000183. [Google Scholar] [CrossRef] [PubMed] [Green Version]
- Houghton, C.A.; Fassett, R.G.; Coombes, J.S. Sulforaphane and Other Nutrigenomic Nrf2 Activators: Can the Clinician’s Expectation Be Matched by the Reality? Oxidative Med. Cell. Longev. 2016, 2016, 7857186. [Google Scholar] [CrossRef] [PubMed] [Green Version]
- Nguyen, T.; Huang, H.C.; Pickett, C.B. Transcriptional regulation of the antioxidant response element: Activation by Nrf2 and repression by MafK. J. Biol. Chem. 2000, 275, 15466–15473. [Google Scholar] [CrossRef] [Green Version]
- Park, S.Y.; Bae, S.-J.; Choi, Y.H. Anti-proliferative Effects of the Isothiocyanate Sulforaphane on the Growth of Human Cervical Carcinoma HeLa Cells. J. Life Sci. 2005, 15, 397–405. [Google Scholar] [CrossRef] [Green Version]
- Conaway, C.C.; Wang, C.-X.; Pittman, B.; Yang, Y.-M.; Schwartz, J.E.; Tian, D.; McIntee, E.J.; Hecht, S.S.; Chung, F.-L. Phenethyl Isothiocyanate and Sulforaphane and their N-Acetylcysteine Conjugates Inhibit Malignant Progression of Lung Adenomas Induced by Tobacco Carcinogens in A/J Mice. Cancer Res. 2005, 65, 8548–8557. [Google Scholar] [CrossRef] [Green Version]
- Yoo, I.H.; Kim, M.J.; Kim, J.; Sung, J.J.; Park, S.T.; Ahn, S.W. The Anti-Inflammatory Effect of Sulforaphane in Mice with Experimental Autoimmune Encephalomyelitis. J. Korean Med. Sci. 2019, 34, e197. [Google Scholar] [CrossRef]
- Barnes, P.J.; Shapiro, S.D.; Pauwels, R.A. Chronic obstructive pulmonary disease: Molecular and cellular mechanisms. Eur. Respir. J. 2003, 22, 672–688. [Google Scholar] [CrossRef]
- Harting, J.R.; Gleason, A.; Romberger, D.J.; Von Essen, S.G.; Qiu, F.; Alexis, N.; Poole, J.A. Chronic Obstructive Pulmonary Disease Patients Have Greater Systemic Responsiveness to Ex Vivo Stimulation with Swine Dust Extract and its Components Versus Healthy Volunteers. J. Toxicol. Environ. Health Part A 2012, 75, 1456–1470. [Google Scholar] [CrossRef] [Green Version]
- Kang, Y.P.; Lee, S.B.; Lee, J.-M.; Kim, H.M.; Hong, J.Y.; Lee, W.J.; Choi, C.W.; Shin, H.K.; Kim, D.-J.; Koh, E.S.; et al. Metabolic Profiling Regarding Pathogenesis of Idiopathic Pulmonary Fibrosis. J. Proteome Res. 2016, 15, 1717–1724. [Google Scholar] [CrossRef]
- Kim, K.-B.; Um, S.Y.; Chung, M.W.; Jung, S.C.; Oh, J.S.; Kim, S.H.; Na, H.S.; Lee, B.M.; Choi, K.H. Toxicometabolomics approach to urinary biomarkers for mercuric chloride (HgCl2)-induced nephrotoxicity using proton nuclear magnetic resonance (1H NMR) in rats. Toxicol. Appl. Pharmacol. 2010, 249, 114–126. [Google Scholar] [CrossRef] [PubMed]
- Beckett, E.L.; Stevens, R.L.; Jarnicki, A.G.; Kim, R.Y.; Hanish, I.; Hansbro, N.G.; Deane, A.; Keely, S.; Horvat, J.C.; Yang, M.; et al. A new short-term mouse model of chronic obstructive pulmonary disease identifies a role for mast cell tryptase in pathogenesis. J. Allergy Clin. Immunol. 2013, 131, 752–762.e7. [Google Scholar] [CrossRef] [PubMed] [Green Version]
- Hwang, J.; Chung, S.; Sundar, I.K.; Yao, H.; Arunachalam, G.; McBurney, M.W.; Rahman, I. Cigarette smoke-induced autophagy is regulated by SIRT1–PARP-1-dependent mechanism: Implication in pathogenesis of COPD. Arch. Biochem. Biophys. 2010, 500, 203–209. [Google Scholar] [CrossRef] [PubMed] [Green Version]
- Kim, K.; Lee, B.M. Metabolomics, a new promising technology for toxicological research. Toxicol. Res. 2009, 25, 59–69. [Google Scholar] [CrossRef] [Green Version]
- Roberts, M.J.; Schirra, H.; Lavin, M.F.; Gardiner, R.A. NMR-based metabolomics: Gobal analysis of metabolites to address problems in prostate cancer. In Cervical, Breast and Prostate Cancer; iConcept Press: Hong Kong, China, 2014; pp. 1–43. [Google Scholar]
- Ho, J.; Sharma, A.; Mandal, R.; Wishart, D.S.; Wiebe, C.; Storsley, L.; Karpinski, M.; Gibson, I.W.; Nickerson, P.W.; Rush, D.N. Detecting renal allograft inflammation using quantitative urine metabolomics and CXCL10. Transplant. Direct 2016, 2, e78. [Google Scholar] [CrossRef] [PubMed]
- Kim, S.N.; Lee, J.; Yang, H.; Cho, J.; Kwon, S.; Kim, Y.; Her, J.; Cho, K.; Song, C.; Lee, K. Dose-response effects of bleomycin on inflammation and pulmonary fibrosis in mice. Toxicol. Res. 2010, 26, 217–222. [Google Scholar] [CrossRef] [Green Version]
- Ryu, S.H.; Lee, J.D.; Kim, J.W.; Kim, S.; Kim, S.; Kim, K. 1H NMR toxicometabolomics following cisplatin-induced nephrotoxicity in male rats. J. Toxicol. Sci. 2019, 44, 57–71. [Google Scholar] [CrossRef] [Green Version]
- Kim, M.K.; Kim, K.-B.; Kim, H.S.; Lee, B.-M. Alternative skin sensitization prediction and risk assessment using proinflammatory biomarkers, interleukin-1 beta (IL-1β) and inducible nitric oxide synthase (iNOS). J. Toxicol. Environ. Health Part A 2019, 82, 361–378. [Google Scholar] [CrossRef]
- Kim, H.Y.; Lee, Y.; Kim, S.J.; Lee, J.D.; Kim, S.; Ko, M.J.; Kim, J.; Shin, C.Y.; Kim, K. Metabolomics profiling of valproic acid-induced symptoms resembling autism spectrum disorders using 1H NMR spectral analysis in rat model. J. Toxicol. Environ. Health Part A 2022, 85, 1–13. [Google Scholar] [CrossRef]
- Lee, J.D.; Kim, H.Y.; Park, J.J.; Oh, S.B.; Goo, H.; Cho, K.J.; Kim, S.; Kim, K. Metabolomics approach to biomarkers of dry eye disease using 1H-NMR in rats. J. Toxicol. Environ. Health Part A 2021, 84, 313–330. [Google Scholar] [CrossRef]
- Won, A.J.; Kim, S.; Kim, Y.G.; Kim, K.; Choi, W.S.; Kacew, S.; Kim, K.S.; Jung, J.H.; Lee, B.M.; Kim, S. Discovery of urinary metabolomic biomarkers for early detection of acute kidney injury. Mol. BioSyst. 2016, 12, 133–144. [Google Scholar] [CrossRef] [PubMed]
- Schick, S.; Glantz, S. Philip Morris toxicological experiments with fresh sidestream smoke: More toxic than mainstream smoke. Tob. Control 2005, 14, 396–404. [Google Scholar] [CrossRef] [PubMed]
- Chiolero, A.; Faeh, D.; Paccaud, F.; Cornuz, J. Consequences of smoking for body weight, body fat distribution, and insulin resistance. Am. J. Clin. Nutr. 2008, 87, 801–809. [Google Scholar] [CrossRef] [PubMed] [Green Version]
- Hong, H.W. The Effects of Kamgiltang on Passive Smoking in Rats. Ph.D. Thesis, Dong-Eui University, Busan, Korea, 2011. [Google Scholar]
- Kanj, R.S.; Kang, J.L.; Castranova, V. Measurement of the release of inflammatory mediators from rat alveolar macrophages and alveolar type II cells following lipopolysaccharide or silica exposure: A comparative study. J. Toxicol. Environ. Health Part A 2005, 68, 185–207. [Google Scholar] [CrossRef]
- Fitzpatrick, M.; Young, S.P. Metabolomics—A novel window into inflammatory disease. Swiss Med. Wkly. 2013, 143, w13743. [Google Scholar] [CrossRef]
- Carneiro, E.M.; Latorraca, M.Q.; Araujo, E.P.; Beltrá, M.; Oliveras-López, M.-J.; Navarro, M.; Berna, G.; Bedoya, F.; Velloso, L.A.; Soria, B. Taurine supplementation modulates glucose homeostasis and islet function. J. Nutr. Biochem. 2009, 20, 503–511. [Google Scholar] [CrossRef]
- De la Puerta, C.; Arrieta, F.J.; Balsa, J.A.; Botella-Carretero, J.I.; Zamarrón, I.; Vázquez, C. Taurine and glucose metabolism: A review. Nutr. Hosp. 2010, 25, 910–919. [Google Scholar]
- Lampson, W.G.; Kramer, J.H.; Schaffer, S.W. Potentiation of the actions of insulin by taurine. Can. J. Physiol. Pharmacol. 1983, 61, 457–463. [Google Scholar] [CrossRef]
- Qaradakhi, T.; Gadanec, L.K.; McSweeney, K.R.; Abraham, J.R.; Apostolopoulos, V.; Zulli, A. The Anti-Inflammatory Effect of Taurine on Cardiovascular Disease. Nutrients 2020, 12, 2847. [Google Scholar] [CrossRef]
- Marcinkiewicz, J.; Grabowska, A.; Bereta, J.; Bryniarski, K.; Nowak, B. Taurine chloramine down-regulates the generation of murine neutrophil inflammatory mediators. Immunopharmacology 1998, 40, 27–38. [Google Scholar] [CrossRef]
- Marquez, L.A.; Dunford, H.B. Chlorination of taurine by myeloperoxidase. Kinetic evidence for an enzyme-bound intermediate. J. Biol. Chem. 1994, 269, 7950–7956. [Google Scholar] [CrossRef]
- Jung, J.; Kim, S.-H.; Lee, H.-S.; Choi, G.S.; Jung, Y.-S.; Ryu, D.H.; Park, H.-S.; Hwang, G.-S. Serum metabolomics reveals pathways and biomarkers associated with asthma pathogenesis. Clin. Exp. Allergy 2013, 43, 425–433. [Google Scholar] [CrossRef] [PubMed]
- Sousse, L.E.; Yamamoto, Y.; Enkhbaatar, P.; Rehberg, S.W.; Wells, S.M.; Leonard, S.; Traber, M.G.; Yu, Y.M.; Cox, R.A.; Hawkins, H.K.; et al. Acute lung injury-induced collagen deposition is associated with elevated asymmetric dimethylarginine and arginase activity. Shock 2011, 35, 282–288. [Google Scholar] [CrossRef] [PubMed] [Green Version]
- Ruzsics, I.; Nagy, L.; Keki, S.; Sarosi, V.; Illes, B.; Illes, Z.; Horvath, I.; Bogar, L.; Molnar, T. L-Arginine Pathway in COPD Patients with Acute Exacerbation: A New Potential Biomarker. COPD J. Chronic Obstr. Pulm. Dis. 2015, 13, 139–145. [Google Scholar] [CrossRef]
- Sappington, D.R.; Siegel, E.R.; Hiatt, G.; Desai, A.; Penney, R.B.; Jamshidi-Parsian, A.; Griffin, R.J.; Boysen, G. Glutamine drives glutathione synthesis and contributes to radiation sensitivity of A549 and H460 lung cancer cell lines. Biochim. Biophys. Acta Gen. Subj. 2016, 1860, 836–843. [Google Scholar] [CrossRef] [Green Version]
- Corrales-Medina, V.F.; deKemp, R.A.; Chirinos, J.A.; Zeng, W.; Wang, J.; Waterer, G.; Beanlands, R.S.B.; Dwivedi, G. Persistent Lung Inflammation After Clinical Resolution of Community-Acquired Pneumonia as Measured by 18FDG-PET/CT Imaging. Chest 2021, 160, 446–453. [Google Scholar] [CrossRef]


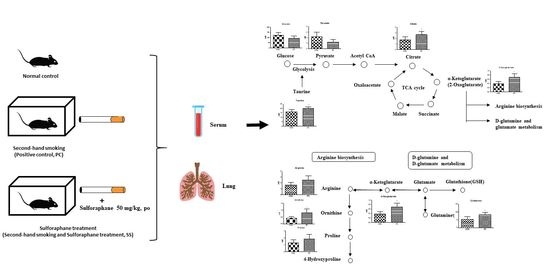
 , positive control (PC);
  , test (SS).
, positive control (PC); , test (SS).
, test (SS).
, positive control (PC); , test (SS).
 , positive control (PC);
  , test (SS).
, positive control (PC); , test (SS).
, test (SS).
, positive control (PC); , test (SS).


Publisher’s Note: MDPI stays neutral with regard to jurisdictional claims in published maps and institutional affiliations. |
© 2022 by the authors. Licensee MDPI, Basel, Switzerland. This article is an open access article distributed under the terms and conditions of the Creative Commons Attribution (CC BY) license (https://creativecommons.org/licenses/by/4.0/).
Share and Cite
Kim, H.; Yoo, S.; Lee, J.-D.; Kim, H.-Y.; Kim, S.; Kim, K.-B. A Metabolomics Approach to Sulforaphane Efficacy in Secondhand Smoking-Induced Pulmonary Damage in Mice. Metabolites 2022, 12, 518. https://doi.org/10.3390/metabo12060518
Kim H, Yoo S, Lee J-D, Kim H-Y, Kim S, Kim K-B. A Metabolomics Approach to Sulforaphane Efficacy in Secondhand Smoking-Induced Pulmonary Damage in Mice. Metabolites. 2022; 12(6):518. https://doi.org/10.3390/metabo12060518
Chicago/Turabian StyleKim, Hongyoon, Sunju Yoo, Jung-Dae Lee, Hyang-Yeon Kim, Suhkmann Kim, and Kyu-Bong Kim. 2022. "A Metabolomics Approach to Sulforaphane Efficacy in Secondhand Smoking-Induced Pulmonary Damage in Mice" Metabolites 12, no. 6: 518. https://doi.org/10.3390/metabo12060518
APA StyleKim, H., Yoo, S., Lee, J.-D., Kim, H.-Y., Kim, S., & Kim, K.-B. (2022). A Metabolomics Approach to Sulforaphane Efficacy in Secondhand Smoking-Induced Pulmonary Damage in Mice. Metabolites, 12(6), 518. https://doi.org/10.3390/metabo12060518