Article

Diagnostics of νLa.max and Glycolytic Energy Contribution Indicate Individual Characteristics of Anaerobic Glycolytic Energy Metabolism Contributing to Rowing Performance

1
Department for Biosciences of Sports, Institute of Sport Science, University of Hildesheim, 31139 Hildesheim, Germany
2
Graduate School of Sports Medicine, CHA University, Seongnam-si 13503, Republic of Korea
3
Olympic Training Center Hamburg/Schleswig Holstein, 22049 Hamburg, Germany
4
Center for Anaesthesiology, Helios University Hospital Wuppertal, 42283 Wuppertal, Germany
5
Department of Medicine, General Graduate School, CHA University, Seongnam-si 13503, Republic of Korea
6
Institute of Cardiovascular Research and Sports Medicine, German Sport University Cologne, 50933 Cologne, Germany
*
Authors to whom correspondence should be addressed.
These authors contributed equally to this work.
Metabolites 2023, 13(3), 317; https://doi.org/10.3390/metabo13030317
Submission received: 31 December 2022 / Revised: 16 February 2023 / Accepted: 18 February 2023 / Published: 21 February 2023
(This article belongs to the Special Issue Metabolic Flexibility in Exercise Performances and Metabolic Diseases)

Abstract

:
The diagnostics of anaerobic glycolytic metabolism which play a subordinate role in elite rowing and parameters such as maximum lactate accumulation rate (νLa.max) have thus far not been associated with ergometer rowing performance. The aim of the study was to quantify the glycolytic energy metabolism (WGly) during a 2000 m ergometer rowing time trial (RTT) and νLa.max during a 10 s maximum ergometer rowing sprint test (RST) and to unravel associations between those variables and RTT performance. Combined post-exercise lactate measurements and oxygen uptake after RST and RTT were used to determine νLa.max and glycolytic energy contribution (WGly) in seven male and three female German U 23 national rowers (N = 10, 19.8 ± 0.9 years, 183.2 ± 7.0 cm height, 79.9 ± 13.3 kg body mass, 16.4 ± 5.1 % body fat). WGly during RTT ranged from 7 to 15.5% and νLa.max between 0.25 and 0.66 mmol∙L−1∙s−1. νLa.max correlated with WGly (p < 0.05, r = 0.74) and the mechanical power output (W) for the first 300 m (300first) during RTT (p < 0.05, r = 0.67). νLa.max further correlated with ∆300first−last (W) for the first and last 300 m (300last) during RTT (p < 0.01, r = 0.87) and also within the subgroup of male rowers. νLa.max displays a wide spectrum of individual differences in rowers. Due to this and its correlation to specific phases of RTT, it contributes to an individual energetic performance profile in rowing. Future studies must undermine the role of νLa.max for exercise performance and whether it serves as a marker that can be specifically targeted for a training-induced increase or decrease.

Graphical Abstract

1. Introduction

Rowing is one of the Olympic disciplines with a particular high demand on all metabolic pathways. At the top level, the 2000 m distance for men and women is covered between 335 and 460 s, depending on the classification, i.e., heavyweight or lightweight, boat classification and sex, and conducted with a mean mechanical power output between 450 to 550 W [1,2]. To facilitate the oxidative supply for such high mechanical power outputs, male elite rowers have an absolute maximum oxygen uptake ( V . O2max) of up to 7 and female elite rowers of up to 4 L∙min−1 [3,4,5,6,7], respectively. A high V . O2max is scientifically undisputed for such performances [8,9,10,11]. The contribution of the oxidative metabolism was determined by de Campos Mello and colleagues to have a mean of 87% on the water and 84% on the ergometer [12]. Importantly, post rowing serum lactate concentrations may rise as high as 32 mmol·L−1, thus pointing also to a significant contribution of the anaerobic glycolytic energy metabolism [13,14]. So far, several studies investigated the response and the contribution of the anaerobic glycolytic metabolism in rowing [14,15,16]. De Campos Mello and co-authors determined an anaerobic lactic energy contribution of just 6% on the water and 9% on the rowing ergometer for 2000 m of rowing.
The contribution of anaerobic metabolism to rowing performance is generally more difficult to quantify [16] but was recently redetermined by an analysis of energetic contributions in rowers [17]. Diry et al. calculated an anaerobic glycolytic energy contribution to be a mean of 11.5% for the 2000 m rowing time trial. The anaerobic energy metabolism consists of the phosphagen system fueled by phosphocreatine (PCr) and adenosine triphosphate (ATP) and the glycolytic pathway producing pyruvate or lactate [18,19].
The glycolytic energy metabolism produces considerable amounts of energy per second [20,21,22], especially at workloads above the maximum lactate steady state (MLSS) or the power output above the anaerobic lactate threshold [23]. Although the term and the physiology behind such thresholds are still discussed [24], they nevertheless represent parameters that are frequently used in performance diagnostics. As such, it is used as a rough estimate of the MLSS and the mechanical power output above which lactate production exceeds its oxidation [25].
The 2000 m rowing race consists of specific race phases contributing to the mean mechanical power output and the entire race time [2,26,27,28,29]. As such, the approximate first and last minute are characterized as either phases of acceleration from the start or a sprint up to the finish [2,26,27,28,29]. During these phases, but also in the mid phase of the race, the required mechanical power output outranges the mechanical power output at 4 mmol·L−1 (P4) and is around or above the V . O2max [7]. Under such conditions, glycolytic energy metabolism must support the total energy metabolism to fuel the required metabolical power output [14,15,16]. Already in 1984, Heck et al. [30] assumed, that the maximum rate of lactate accumulation (νLa.max), determined via specific sprint tests, may serve as a measure for the individual rate of anaerobic glycolytic energy metabolism in an athlete [20]. Based on mathematical modelling [31] it was shown, that the individual νLa.max significantly affects the power output at the anaerobic lactate threshold [20]. While a low νLa.max shifts the lactate curve to the right and improves mechanical power output at the lactate threshold, a high νLa.max decreases lactate threshold performance [25]. However, particularly high mechanical power outputs, e.g., required in 1000 m time trial in track cycling, are only possible with the support of a high νLa.max [25].
Performance diagnostics for rowers in Germany usually focuses on the determination of the P4 [30] which is useful to diagnose the individual training progress and to control zones of training intensity. Unfortunately, the role of the glycolytic energy metabolism for rowing performance is still not clear and not mirrored by P4 alone.
Because the 2000 m rowing time trial (RTT) puts high demands on all energy metabolism pathways and the prominent diagnostic procedures in rowing do not specifically test for the glycolytic energy metabolism, the aim of our approach was firstly to determine the contribution of glycolytic energy metabolism during 2000 m RTT performance. Using a mathematical model involving V . O2 and lactate accumulation (La) obtained during and post 2000 m RTT, three energy system contributions (anaerobic alactic, anaerobic glycolytic, and oxidative) were calculated in German U 23 national rowers. Furthermore, νLa.max in a 10 s maximum sprint test (RST) was determined to get an estimate for the interindividual variability of this diagnostic marker in rowers. By correlating νLa.max with specific phases of 2000 m RTT and the glycolytic energy contribution, we aimed to determine and quantify possible associations that may indicate a specific role of νLa.max to support energy metabolism during 2000 m RTT and the share of glycolytic energy contribution during 2000 m RTT.

2. Materials and Methods

2.1. Participants

The sample size was calculated using the G*Power software (G*Power software 3.1.9.4; Heinrich Heine University, Düsseldorf, Germany): effect size = 1.80, alpha error probability = 0.05, statistical power = 0.80. The consideration of effect size was based on previous studies [32,33,34]. Therefore, seven male and three female German U 23 national rowers were recruited, including 20% dropout rate and participated in the study (N = 10). All rowers participated in national and international championships at the time of the study. All tests were conducted in October 2021. Six athletes were heavyweight and four were lightweight rowers. At the time of the study, all athletes were carrying out the general preparation phase for the regular season. Body fat and weight were determined using a Medical Body Composition Analyzer from SECA (SECA GmbH & Co KG, Hamburg, Germany). Body height (cm) was measured electrically with a stadiometer (SECA GmbH & Co. KG, Hamburg, Germany). Data are shown in Table 1.
All participants received written athlete information in advance and were informed about the aim, procedure, and risks of the study. This participant information also contained instructions on which aspects the participants must consider before their individual test days. Some days before the testing procedures, all participants were informed orally and in writing in advance of the study for a second time and gave their written informed consent prior participation. The study was approved by the Institutional Review Board of University of Hildesheim (No. 259_22) and followed the Declaration of Helsinki. The athletes did not perform any strength training or physically demanding rowing training for 48 h before the tests and participated in the rested state.

2.2. Lactate Diagnostics

For the determination of lactate concentration, capillary blood samples (mmol·L−1, 20 μL) were collected into an end-to-end capillary (EKF diagnostic, Barleben, Germany) from the earlobe. Lactate samples were analyzed immediately after collection using an enzymatic–amperometric sensor chip system (Biosen C-line, EKF diagnostics sales GmbH, Barleben, Germany). An automatic calibration of the system was performed after 60 min. For each test, resting lactate values were ≤2.0 mmol·L−1.

2.3. Cardio Pulmonary Exercise Testing (CPET)

Oxygen uptake ( V . O2) was measured using a spirometry system K5 (COSMED, Rome, Italy) in breath by breath mode. The values were averaged at 5 s intervals using Omnia Cardiopulmonary Diagnostic Software version 1.6.10 (COSMED, Rome, Italy). The flow sensor was calibrated with 5 strokes of a high precision 3 L syringe (Hans Rudolph, Kansas City, MO, USA). The gas calibration was performed with calibration gas (16% O2 and 5% CO2, COSMED, Rome, Italy). All athletes wore silicone masks in sizes M and L which were attached to a flowmeter of the K5 system (Hans Rudolph, Kansas City, MO, USA).

2.4. Rowing Ergometers

An air-braked Concept II Type C ergometer was used in each of the tests (Concept II, Morrisville, VT, USA). The sprint tests were conducted on a modified ergometer which was additionally equipped with a FES (Institute for Research and Development, Berlin, Germany) measurement system. This system consists of a load cell for force measurement and a rotary transducer to calculate the power output. Values were submitted to the associated computer software (FES Ruderergo-Dyno v. 2013.9.1, Institute for Research and Development, Berlin, Germany). In the starting position before each test, athletes sat with the rolling seat close to the resting flywheel, i.e., the participants’ knees were in flexion. This position was chosen in each test because it equals the start in the boat. Drag factor settings in the tests were based on the conditions that apply at national Olympic Training Centers and German Rowing Association (DRV). The drag factor on an air-braked rowing ergometer simulates the water resistance that the paddle of the rower must overcome in the boat. A high drag factor in the sprint test was necessary to provide adequate starting resistance for rowers to generate a maximum mechanical power output from the starting position.

2.5. Heart Rate

Heart rate (bpm) was measured beat to beat continuously during each test using a Suunto Dual heart rate belt (Suunto, Vantaa, Finland).

2.6. Laboratory Conditions

All tests were conducted at a relative humidity of 39–48% and a temperature of 20.3–22.5° Celsius. The values were measured using a Kestrel anemometer (Kestrel Weather and Environmental Meter, Boothwyn, USA).

2.7. The 10 s RST

The 10 s RST was conducted on the Concept II Type C rowing ergometer equipped with the FES measurement system, because an external measurement of mechanical power output is imperative when utilizing the C2 for short tests, due to a substantial underestimation of the start strokes [35]. After the warm-up, capillary blood samples were obtained to determine the resting lactate level (Larest). In case, the resting lactate values were higher than 2.0 mmol·L−1, participants were advised to continue rowing with a low intensity until blood lactate levels were below 2.0 mmol·L−1.
The intensity of the warm-up program was kept low (100 W) to avoid effects on maximum post-exercise lactate. Participants conducted the 10 s RST with the highest possible frequency to achieve a maximum mechanical power output during the test. The drag factor was 185 for men and 170 for women. The coaches verbally motivated all participants during 10 s RST for maximal effort. Immediately after the end of the test, the participants remained seated on the ergometer. For the determination of the maximum post-exercise lactate concentration, capillary blood was collected from the earlobe in one-minute intervals over a total time of 10 min. Once the lactate value dropped twice in a row, the test was considered complete and no further blood samples were obtained. The lactate values were needed to calculate the νLa.max.
The formula of νLa.max is as follows (Equation (1)) [20]:
ν La . max   ( mmol · L 1 · s 1 ) = La peak   La rest t Exer   t PCr
where Lapeak = the maximum lactate concentration after 10 s RST; Larest = the resting lactate concentration before 10 s RST; tExer = total exercise (rowing) time (10 s) and tPCr = the time of dominant phosphagen system contribution.
The time of dominant phosphagen system contribution was calculated using an interpolated model that has been reported previously [36] (Equation (2)):
t P C r   ( s ) = t E x e r · 0.0909 + 2.0455

2.8. The 2000 m RTT

The 2000 m RTT was performed on the air-braked Concept II Type C rowing ergometer without the FES measurement system because it was not necessary to measure mechanical power output of individual strokes. Before the start, during and after 2000 m RTT, all athletes wore a silicone mask to measure oxygen uptake via CPET. Resting oxygen uptake was measured with each participant seated (5 min). During CPET, two male rowers had to remove their silicone masks because of self-reported breathing problems. However, V . O2peak could be measured for one of these two rowers. For this reason, V . O2peak values could be measured for nine athletes (n = 9). Because complete CPET was required for the determination of energy system contributions, these parameters could not be determined for the two athletes mentioned above (n = 8). Nevertheless, these two athletes were able to complete the 2000 m RTT. For this reason, the 2000 m performance and the mechanical power output from the first and last 300 m were obtained from all athletes (N = 10).
All participants were encouraged to run the test with maximum effort, as this is the only way to obtain a reliable and close-to-competition calculation of the energetic contributions. The drag factor was 145 for the men and 130 for the women. After the test, the participants remained seated on the ergometer and V . O2 was continuously measured for off  V . O2 kinetics [12] (6 min) (Figure 1B). Lapeak was determined during post exercise every minute from minute 7 to 17 min. Lactate samples were analyzed immediately after the 2000 m RTT. If two lactate values decreased twice in a row, the blood samplings were considered to complete and no further collections were obtained. The entire test was completed after the last post-exercise lactate collection after reaching Lapeak. The main variables of the 2000 m RTT were:
(1)
2000 m RTT performance (s).
(2)
Average power over the first and last 300 m of 2000 m RTT (P300first and P300last in W).
(3)
Mechanical power output difference between 300 m first and last (∆300 first-last).
(4)
V . O2 (litres O2·min−1) before, during, and after 2000 m RTT.
(5)
Resting lactate and peak blood lactate concentration after 2000 m RTT.

2.9. The Incremental Step Test

The incremental step test was performed on the air-braked Concept II Type C rowing ergometer with FES measurement system. The test consisted of five stages, each with a duration of 4 min and was conducted according to the DRV standards in ergometer rowing. After a low intense warm-up on the rowing ergometer of around 5 min (100 W), capillary blood samples were obtained to determine the resting lactate concentration (Larest). For men, the power of the first stage was 150 W. Female participants started at 80. After each stage, there was a half-minute break before the next one followed. During the 30-s rest period, heart rate and blood lactate were measured and the individual rate of perceived exertion (RPE) was queried. Power output was increased by 50 W per stage for men and 40 W for women. Accordingly, the fifth and final stage resulted in 350 W for men and 240 W for women. On a screen, in front of the ergometer, the athletes were able to see whether they met the required mechanical power output. If the average of the last three strokes was 10 W or more below the target power output, athletes received a visual warning that they must increase mechanical power output. After the fifth warning, the test was automatically terminated. This test is only possible with the FES system and the associated software. At the end of the test, post-exercise lactate measurements were conducted at 3, 5, and 7 min. The drag factor was 145 for men and 130 for women. Thus, the P4 on the rowing ergometer was determined.

2.10. Calculations of Energetic Contributions during 2000 m RTT

Phosphagen, glycolytic, and oxidative contributions were estimated by the assessment of V . O2 (during 2000 m RTT), peak La, and the fast component of excess V . O2 after exercise (EPOCFAST), respectively [32,33,34,37,38,39]. The phosphagenic energy contribution (WPCr) was calculated considering V . O2 after 2000 m RTT, and the fast component of excess post exercise after 2000 m RTT [34,37,40]. The kinetics of post-exercise V . O2 was fitted by mono- and bi-exponential models using OriginPro 2021 (OriginLab Corp, Northampton, Massachusetts, USA) and the slow component of the bi-exponential model was negligible. Therefore, the post-exercise V . O2 data were fitted to a mono-exponential model, and WPCr was calculated by estimating the integral of the exponential area [12,32,37,39]. The glycolytic energy contribution (WGly) was considered by the lactate concentration after 2000 m RTT, assuming that the accumulation of 1 mmol∙L−1 (La) is equivalent to 3 mL O2∙kg−1 of body mass [41]. The delta lactate (ΔLa) was calculated by subtracting the resting lactate concentration from the highest La after 2000 m RTT [34,37,38]. The oxidative energy contribution (WOxi) was calculated by subtracting the resting V . O2 ( V . O2rest) from V . O2 levels during 2000 m RTT by the trapezoidal method. In this method, the area under the curve is divided into sections and then the sum of the trapezoid is utilized to calculate the integral [12]. V . O2rest was measured in the sitting position, within the last 30 s of a 5 min period used as a reference value [33,34,37,39]. A caloric quotient of 20.92 kJ was used in all three energetic contributions [18]. Total energetic expenditure (WTotal) was calculated as the sum of the three energy systems (WOxi + WPCr + WGly) in kJ [32,39]. The relative energy contributions are displayed as percentages (%).

2.11. Statistical Analyses

All data were analyzed using GraphPad Prism (version 9.4.1, GraphPad Prism Software Inc., La, Jolla, CA, USA). Parameters are presented as arithmetic mean and standard deviation (SD). The Friedman repeated-measures rank test with Dunn’s post hoc was utilized to compare the energy system contributions during the 2000 m rowing ergometer test (n = 8, in kJ and %). The α-level of significance was set at p < 0.05 for all statistical analyses. The effect sizes were calculated for non-parametric tests (ES Kendall’s [W] and Z N [r]). The threshold for small, medium, and large effects were considered < 0.3, > 0.3−0.5, and > 0.5 [W] and 0.1, 0.3, and 0.5 [r], respectively [42]. Furthermore, Spearman rank correlation analyses were performed among WGly, νLa.max, 2000 m RTT, P300first and P300last of 2000 m RTT, ∆300first−last and P4.

3. Results

3.1. Calculation of the Three Energy System Contributions (PCr-La-O2 Method) during 2000 m RTT

The first aim was to determine the energetic contributions towards 2000 m RTT. Figure 2 displays the three energy system contributions (oxidative, glycolytic, and phosphagen) in kJ (2A,B) and % (2C,D) during 2000 m RTT (WPCr in kJ: 69.8 ± 10.4, WGly in kJ: 76.0 ± 27.3, WOxi in kJ: 498.7 ± 62.9, WPCr in %: 10.9 ± 1.7, WGly in %: 11.5 ± 2.8, WOxi in %: 77.5 ± 1.5, respectively).
Significant differences in the energetic contributions in kJ and % (p = 0.002) were found between those pathways. Values of WOxi in kJ and % were significantly higher compared to WGly and WPCr (vs. WGly in kJ; p = 0.008, vs. WPCr in kJ; p = 0.008, vs. WGly in %; p = 0.008, vs. WPCr in %; p = 0.008) (Figure 2B,D). There was neither a significant difference between WGly and WPCr in kJ nor in % (p > 0.05).

3.2. νLa.max and tPCr of 10 s RST, P300first, and P300last of 2000 m RTT

Next, the aim was to determine in which range νLa.max is displayed in the group of participants. νLa.max values ranged from 0.25 mmol·L−1 (P3) as the lowest value to 0.66 mmol·L−1 (P6) as the highest value. During the first 300 m, the mean mechanical power output ranged between 466 W (P5) and 218 W (P3). The mechanical power output on the last 300 m to the finish of the 2000 m RTT ranged from 433 W (P8) to 218 W (P3).

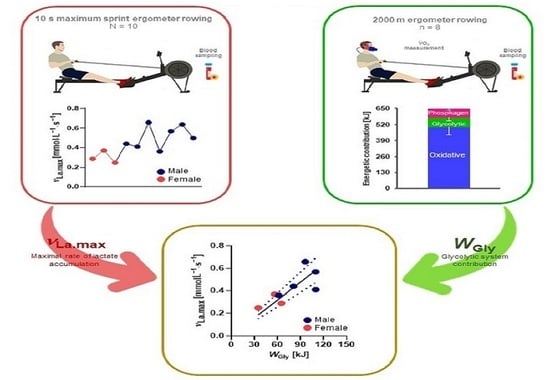
3.3. The Relationship between νLa.max and WGly over 2000 m RTT

The next aim was to determine whether νLa.max contributes to the glycolytic energy contribution (in kJ). A positive correlation was observed between WGly and νLa.max (p < 0.05; Figure 3).

3.4. The Relationship between νLa.max, WGly, P4, Absolute V ˙ O2peak, and 2000 m RTT Performance

Based on these findings, it was analyzed whether νLa.max, WGly, V . O2peak, or P4 has an influence on the 2000 m RTT performance. In addition, significant correlations were seen between WGly, P4, V . O2peak and 2000 m RTT performance (p < 0.05, p < 0.001, and p < 0.001). There was no significant correlation between νLa.max and 2000 m RTT performance for the entire group (p > 0.05). (Figure 4A−D).

3.5. The Influence of νLa.max on Specific Sections of 2000 m RTT

Because mechanical power output over the first and the last 300 m of 2000 m RTT are usually higher than over the middle part of the race, it was investigated whether there was a relationship between the νLa.max and the delta (∆300first−last) value. Similarly, it was analyzed for a correlation between νLa.max and on the first and last 300 m during 2000 m RTT. A correlation between the νLa.max value and ∆300first−last was found (p < 0.05, Figure 5A). Furthermore, a correlation was found between P300first W during the 2000 m RTT and νLa.max (p < 0.05, Figure 5B). No correlation was found between the P300last W during the 2000 m RTT and νLa.max (p > 0.05, Figure 5C).

3.6. Separate Classification of νLa.max, V ˙ O2peak, and Performance over P300first and ∆300first−last for Male Athletes

It was recognized that the obtained correlation between variables in the entire group of rowers was enhanced due to the involvement of three female athletes with generally lower performance values. Those athletes had an overall lower bodyweight, lower muscle mass and therefore V . O2peak and νLa.max what strengthened our interpretation. Therefore, the former correlations for the subgroup of males were reanalyzed in our study. In this subgroup νLa.max and V . O2peak did not correlate with 2000 m RTT performance (p > 0.05; n = 7; Figure 6A, p > 0.05; n = 6, Figure 6B). Furthermore, P300first showed no interdependency with νLa.max in the cohort of males (p > 0.05; n = 7, Figure 6C). The value of ∆300 first−last showed no correlation with νLa.max, also in males (p > 0.05; n = 7, Figure 6D).

4. Discussion

In recent years, the determination of anaerobic metabolism in performance testing [36,43,44,45,46] became more popular. Past [20] and recent findings [25] attribute to the anaerobic glycolytic metabolism a high importance for endurance exercise performance [25]. When exercise is conducted at mechanical power outputs at and above the anaerobic threshold or V . O2max [25] the contribution of the anaerobic glycolytic metabolism more and more increases. Such conditions are predominant during the 2000 m RTT in rowing [14,15,25]. Therefore, the anaerobic glycolytic metabolism can be considered as a factor that enables the high energy flow rate required during rowing.
Because approaches to quantify anaerobic glycolytic performance in rowing diagnostics are still missing, νLa.max as a measure of one’s individual lactate accumulation rate or anaerobic glycolytic performance in U 23 national rowers was determined in an explorative manner. We further analyzed the contribution of anaerobic glycolytic metabolism during 2000 m RTT and calculated associations between 2000 m RTT performance and νLa.max.
Our calculations revealed a mean contribution of 11.5% of anaerobic glycolytic metabolism during 2000 m RTT in our participants. The shorter the time course in which a maximum mechanical power output has to be maintained, the higher it is [47]. As a consequence, the percentage of anaerobic glycolytic metabolism is also higher. Thus, participants with a shorter race time had a higher percentage of anaerobic glycolytic energy contribution (Figure 4B). The international rowing federation (World Rowing) established the reduction in the course length from 2000 m to 1500 m for men and women for the Olympic Games in 2028 [48]. This will likely increase the absolute and relative anaerobic lactic energy contribution for the competing athlete during a 1500 m race and might affect the training preparation after 2024. A recent study [17] already calculated the changing metabolic demands for this reduction in course length and described an increase for the mean percentage of anaerobic glycolytic energy metabolism from 11.5% to 13.3%.
Our calculation revealed a percentage of 11.5 ± 2.9% which corresponds with the data from Diry and colleagues [17]. The used method is established to determine the proportions of the energy metabolism towards exercise [33,37,49,50,51,52,53]. However, our study showed a higher phosphagen contribution (10.9%) than the results from Diry et al. [17] (1.5%) because of the different methodological calculations of the phosphagen system. The time constant of mono-exponential function using off  V . O2 kinetics, which indicates phosphocreatine (PCr) recovery (return to baseline PCr levels) after intense exercise, serves as a more precise method to consider the phosphagen contribution in our study [33,37,52,53,54].
The νLa.max during 10 s RST was determined to analyze in which range this easily detectable marker of anaerobic glycolytic energy metabolism displays itself in our group of participants and whether it is related to the glycolytic energy contribution over 2000 m RTT. Within the tested athletes, νLa.max values between 0.25 and 0.66 mmol·L−1·s−1, V . O2peak values between 3.5 and 5.9 L·min−1, and P4 values between 200 and 338 W were observed (Table 2 and Table 3).
This reveals a broad spectrum of differential energetic abilities in national German U 23 rowers. Importantly, νLa.max varied between the athletes more than 2-fold while V . O2peak values varied by only 1.7-fold. Thus, νLa.max displays itself as a diagnostic parameter that reveals a larger range of νLa.max than V . O2peak in rowers. νLa.max influences the power at the MLSS and by that also the lactate threshold [25]. Ingham and colleagues have determined that mechanical power output at 2 mmol·L−1 and at 4 mmol·L−1 is a strong predictor of 2000 m rowing performance [2]. Therefore, the influence of νLa.max on rowing performance is comprehensible. It was unexpected that νLa.max differs considerably between athletes otherwise having a similar V . O2peak and 2000 m RTT performance (Table 2 and Table 3, participants P6 and P7).
Importantly, as expected, absolute V . O2peak correlated well with 2000 m RTT performance (Figure 4D). However, although the importance for possessing a high oxidative capacity in rowing is undisputed, the entire performance over 2000 m RTT is seemingly also influenced by anaerobic glycolytic performance as measured by νLa.max.
In the entire group of participants (males and females combined), a correlation was found between WGly during 2000 m RTT and νLa.max (Figure 3). This indicates that νLa.max may support the glycolytic flux during exercise and by that the utilization of anaerobic glycolytic energy metabolism. In addition, a correlation was found between νLa.max and the mechanical power output generated during the first 300 m in the 2000 m RTT (Figure 5A) emphasizing that the individual characteristic of mechanical power output during rowing in this time frame is influenced by the individual glycolytic capacity.
Interestingly, the decline in mechanical power output between the first and last 300 m during 2000 m RTT also correlated with νLa.max. This may attribute νLa.max a contributing role towards fatigue during specific phases of 2000 m RTT, because athletes with a higher νLa.max also show a higher reduction in the possible mechanical power output at the end of 2000 m RTT.
Our data imply that an extended performance diagnostic in rowing, including νLa.max testing, may be feasible to assess one’s individual ability for glycolytic energy metabolism via a non-complicated and time-efficient test procedure.
The concept of νLa.max as a measure of the individual maximum lactate accumulation rate was introduced by Mader in the 1980s [31]. Approaches to determine νLa.max so far are used for performance diagnostics in running [55] and cycling [56]. A key determinant for such testing is on the one hand to induce a rapid and maximum turnover of ATP and PCr in order to maximally activate glycolysis [20]. On the other hand, the time frame of the test has to be as short as possible to minimize the activation of oxidative metabolism and thus lactate oxidation [20]. Further, this aims to prevent the increasing inhibition of phosphofructokinase due to declining pH levels [57]. In such tests, the maximum accumulated lactate in blood serves here as an estimate of what working muscle has produced during 10 s maximum RST.
We chose 10 s for the RST, a duration which has been described to minimize oxidative metabolism but is sufficient to maximally activate glycolysis [20]. To calculate νLa.max, we used a phosphagen-contributed time frame of 2.95 s in which energy metabolism is fueled by high energy phosphates and glycolysis is not yet maximally activated and followed already published calculations [36]. While sprint tests designed to determine νLa.max in running and cycling are described to last between 15 and 30 s [36,46,58,59,60] and allow for more than 50 maximum muscle contractions, rowing is associated with a much slower movement speed during each rowing cycle. Hence, during RST our participants were merely able to conduct between 8 and 11 rowing cycles within 10 s (data not shown). Therefore, due to the reduced number of muscle contractions during RST when compared to cycling maximum lactate values might be lower in our study. Overall, 10 s of RST is technically demanding why participants were able to practice the starting phases in advance of the testing day. It has to be mentioned that individual strength abilities may interfere with the ability to quickly generate force from the start. This can be specifically different between male and female athletes.
Importantly, three of the participants were female and those were the athletes in our correlations (Figure 4B,D) with the lowest V . O2peak, but also low νLa.max values (Table 2 and Table 3, participants P1–P3). Female athletes have generally a lower amount of muscle mass and mean mechanical power output than compared to men [61] which consequently led to an extended competition time of 450 s in women compared to 382.7 s in men in our study. The lower muscle mass also reduces the absolute oxidative capacity due to an absolute lower content of oxidative enzymes.
Due to the mix of female and male athletes, our correlations display a broad range of νLa.max, V . O2peak, and P4 values. This range likely made the detection of our findings possible and enhanced our correlations as presented here. In the subgroup of men, our associations (Figure 6A−D) that could be seen in the mixed group of participants could no longer be revealed. All seven men showed a very high 2000 m RTT performance with a νLa.max variation between 0.36 and 0.66 mmol·L−1 and only a weak correlation was found between 300first and 300last but also no correlation was found with V . O2peak and 2000 m RTT performance.
This indicates that our sample size was too small for detecting clear relations in men and based on our findings for the entire group of participants, there is the need for the evaluation of diagnostic markers of energy metabolism and especially νLa.max in a more extended sample size of elite, sub-elite but also novice rowers. This, in order to clearly estimate the influence of νLa.max for rowing performance and further to determine under which condition and for which athlete-specific training might be used to increase or decrease νLa.max.
As recently introduced by Wackerhage and colleagues [25], the influence of νLa.max on exercise metabolism and endurance performance can be interpreted only in combination with V . O2peak. As indicated in Table 3 and Figure 6D, the reduction in mechanical power output between the first and last 300 m may indicate a performance decrement which occurs under the influence of νLa.max. Whether either an increase or a decrease in νLa.max would be an important training goal to enhance 2000 m or 1500 m RTT cannot be determined in our small group of participants and in this initial approach.
To date, there are also no clear data available how to specifically modulate individual νLa.max by training. Also, νLa.max itself is yet not a specific topic themed on a regular basis in international exercise physiology. Therefore, literature for this very context is still sparse. Data suggest, that glycolytic capacity will be reduced when oxidative capacity increases [62]. Mechanistically, increasing volumes of training are associated with an augmented expression of PGC-1 alpha-regulated oxidative genes concomitantly with a reduction in glycolytic gene expression [63].
Additionally, a higher potential to oxidize lactate in mitochondria will then reduce blood lactate levels at a given rate of glycolysis, even when the glycolytic potential per se may be increased. This would limit the achievability and detectability for a desired increase in νLa.max during specific phases of training and in elite athletes who train generally with high training volumes. Several studies show that sprint training may increase the expression of anaerobic glycolytic enzymes or anaerobic performance [64] while others reported no increase in glycolytic capacity after explosive strength training [65,66]. Lactate production also depends on the amount of fast fiber types [67] in skeletal muscle as well as muscle mass [68] which can be increased by resistance training. In this context, resistance training has been shown to increase particularly the hypertrophy and abundance of intermediate fast glycolytic type IIa fibers [69]. In contrast, endurance training does not induce substantial hypertrophy but can induce the transition of myofibers to a slower phenotype, especially when athletes possess a higher amount of fast fibers [70].
Therefore, some approaches showed that resistance training was able to increase νLa.max [71] and that a reduction in training volume may enhance glycolytic capacity and anaerobic performance [72]. Additionally, hypoxic training methods such as intermittent hypoxic training (IHT) can be effective training strategies to increase anaerobic performance [73]. It has been shown that hypoxia increases the HIF-1 alpha-driven expression of glycolytic enzymes [74].
Based on the former considerations and the high training volumes conducted in rowing, a directed and training-induced increase in νLa.max may be more difficult to reach than its reduction. Future studies must show under which conditions (e.g., V . O2peak) an increase or decrease in νLa.max may increase rowing-specific performance. Specific training regimens could then be incorporated into rowing training to modulate νLa.max.

Limitations

Despite our group of highly trained German U23 national rowers, the sample size is still limited. A broader spectrum of 2000 m RTT performances as well as νLa.max, V . O2peak, and segments of rowing-specific performance would have greatly undermined our findings and more precisely enclose our interpretations in more extended and significant correlations. Out of 10 participants, only eight data sets could be used for the determination of energy turnover during 2000 m RTT and three of our data sets were from female athletes which also determined the lower limit in our correlations concerning νLa.max, rowing performance during 2000 m RTT, and P300first. Hence, those data have influenced our correlations. Although energetic contributions in female athletes follow generally the same physiological regulations as in men, specificities for female athletes exist [61] that must be separately addressed in the future.

5. Conclusions

Although energy supply during 2000 m RTT is predominantly ensured by the oxidative metabolism, the anaerobic glycolytic metabolism, as determined by νLa.max, arises as an individual component of energetic performance that supports the total energy requirements of 2000 m RTT. Based on its broad variety in athletes and its relationship to specific phases of 2000 m RTT, it may serve in the future as a diagnostic marker in rowing to detect potential limiting factors of exercise performance beyond usual diagnostic markers.

Author Contributions

Conceptualization, F.S., C.W., W.-H.Y. and S.G.; methodology, F.S., C.W., W.-H.Y. and S.G.; formal analysis, F.S., W.-H.Y. and S.G.; investigation, F.S. and S.G.; resources, C.W. and S.G.; data curation, F.S.; writing—original draft preparation, F.S., C.W., W.-H.Y. and S.G.; writing—review and editing, F.S., C.W., C.T., W.-H.Y. and S.G.; visualization, S.-Y.P. and W.-H.Y.; supervision, F.S., C.W., C.T., W.-H.Y. and S.G.; project administration, S.G.; funding acquisition, S.G. All authors have read and agreed to the published version of the manuscript.

Funding

This research received no external funding.

Institutional Review Board Statement

The study was approved by the Institutional Review Board of University of Hildesheim (No. 259) and followed the principal guideline in the Declaration of Helsinki.

Informed Consent Statement

Informed consent was obtained from all subjects involved in the study.

Data Availability Statement

Data available on request are dependent on restrictions, e.g., privacy or ethical. The data presented in this study are available on request from the corresponding authors.

Acknowledgments

We would like to thank all employees of the Olympic Training Center Hamburg/Schleswig-Holstein, all involved coaches and athletes of the U 23 for the cooperation.

Conflicts of Interest

The authors declare no conflict of interest.

References

  1. Kleshnev, V. Biomechanics of Rowing: A Unique Insight into the Technical and Tactical Aspects of Elite Rowing; The Crowood Press: Marlborough, UK, 2020. [Google Scholar]
  2. Ingham, S.A.; Whyte, G.P.; Jones, K.; Nevill, A.M. Determinants of 2,000 m rowing ergometer performance in elite rowers. Eur. J. Appl. Physiol. 2002, 88, 243–246. [Google Scholar] [CrossRef] [PubMed]
  3. Yoshiga, C.C.; Higuchi, M. Rowing performance of female and male rowers. Scand J. Med. Sci. Sports 2003, 13, 317–321. [Google Scholar] [CrossRef]
  4. Larsson, L.; Forsberg, A. Morphological muscle characteristics in rowers. Can. J. Appl. Sport Sci 1980, 5, 239–244. [Google Scholar]
  5. Hagerman, F.C.; Connors, M.C.; Gault, J.A.; Hagerman, G.R.; Polinski, W.J. Energy expenditure during simulated rowing. J. Appl. Physiol. Respir. Environ. Exerc. Physiol. 1978, 45, 87–93. [Google Scholar] [CrossRef]
  6. Mikulic, P.; Bralic, N. Elite status maintained: A 12-year physiological and performance follow-up of two Olympic champion rowers. J. Sports Sci. 2018, 36, 660–665. [Google Scholar] [CrossRef] [PubMed]
  7. Treff, G.; Schmidt, W.; Wachsmuth, N.; Völzke, C.; Steinacker, J.M. Total haemoglobin mass, maximal and submaximal power in elite rowers. Int. J. Sports Med. 2014, 35, 571–574. [Google Scholar] [CrossRef]
  8. Cosgrove, M.J.; Wilson, J.; Watt, D.; Grant, S.F. The relationship between selected physiological variables of rowers and rowing performance as determined by a 2000 m ergometer test. J. Sports Sci. 1999, 17, 845–852. [Google Scholar] [CrossRef]
  9. Secher, N.H. The physiology of rowing. J. Sport. Sci. 1983, 1, 23–53. [Google Scholar] [CrossRef]
  10. Gillies, E.; Bell, G. The relationship of physical and physiological parameters to 2000 m simulated rowing performance. Res. Sport. Med. Int. J. 2000, 9, 277–288. [Google Scholar] [CrossRef]
  11. Kramer, J.F.; Leger, A.; Paterson, D.H.; Morrow, A. Rowing performance and selected descriptive, field, and laboratory variables. Can. J. Appl. Physiol. 1994, 19, 174–184. [Google Scholar] [CrossRef]
  12. de Campos Mello, F.; de Moraes Bertuzzi, R.C.; Grangeiro, P.M.; Franchini, E. Energy systems contributions in 2,000 m race simulation: A comparison among rowing ergometers and water. Eur. J. Appl. Physiol. 2009, 107, 615–619. [Google Scholar] [CrossRef]
  13. Nielsen, H.B. pH after competitive rowing: The lower physiological range? Acta Physiol. Scand 1999, 165, 113–114. [Google Scholar] [CrossRef] [PubMed]
  14. Maciejewski, H.; Bourdin, M.; Lacour, J.R.; Denis, C.; Moyen, B.; Messonnier, L. Lactate accumulation in response to supramaximal exercise in rowers. Scand J. Med. Sci. Sports 2013, 23, 585–592. [Google Scholar] [CrossRef] [PubMed]
  15. Maciejewski, H.; Bourdin, M.; Féasson, L.; Dubouchaud, H.; Messonnier, L.A. Non-oxidative Energy Supply Correlates with Lactate Transport and Removal in Trained Rowers. Int. J. Sports Med. 2020, 41, 936–943. [Google Scholar] [CrossRef]
  16. Pripstein, L.P.; Rhodes, E.C.; McKenzie, D.C.; Coutts, K.D. Aerobic and anaerobic energy during a 2-km race simulation in female rowers. Eur. J. Appl. Physiol. Occup. Physiol. 1999, 79, 491–494. [Google Scholar] [CrossRef] [PubMed]
  17. Diry, A.; Ratel, S.; Nevill, A.; Maciejewski, H. What is the physiological impact of reducing the 2000 m Olympic distance in rowing to 1500 m and 1000 m for French young competitive rowers? Insights from the energy system contribution. Front. Physiol. 2022, 13, 896975. [Google Scholar] [CrossRef] [PubMed]
  18. Gastin, P.B. Energy system interaction and relative contribution during maximal exercise. Sports Med. 2001, 31, 725–741. [Google Scholar] [CrossRef]
  19. Mader, A. Glycolysis and oxidative phosphorylation as a function of cytosolic phosphorylation state and power output of the muscle cell. Eur. J. Appl. Physiol. 2003, 88, 317–338. [Google Scholar] [CrossRef]
  20. Heck, H.; Schulz, H.; Bartmus, U. Diagnostics of anaerobic power and capacity. Eur. J. Sport Sci. 2003, 3, 1–23. [Google Scholar] [CrossRef]
  21. Hargreaves, M.; Spriet, L.L. Skeletal muscle energy metabolism during exercise. Nat. Metab. 2020, 2, 817–828. [Google Scholar] [CrossRef]
  22. Baker, J.S.; McCormick, M.C.; Robergs, R.A. Interaction among Skeletal Muscle Metabolic Energy Systems during Intense Exercise. J. Nutr. Metab. 2010, 2010, 905612. [Google Scholar] [CrossRef] [Green Version]
  23. Mader, A. Zur beurteilung der sportartspezifischen ausdauerleistungsfahigkeit im labor. Sportarzt. Sportmed. 1976, 27, 80–88. [Google Scholar]
  24. Poole, D.C.; Rossiter, H.B.; Brooks, G.A.; Gladden, L.B. The anaerobic threshold: 50+ years of controversy. J. Physiol. 2021, 599, 737–767. [Google Scholar] [CrossRef]
  25. Wackerhage, H.; Gehlert, S.; Schulz, H.; Weber, S.; Ring-Dimitriou, S.; Heine, O. Lactate Thresholds and the Simulation of Human Energy Metabolism: Contributions by the Cologne Sports Medicine Group in the 1970s and 1980s. Front. Physiol. 2022, 13, 899670. [Google Scholar] [CrossRef]
  26. Roth, W.; Schwanitz, P.; Pas, P.; Bauer, P. Force-time characteristics of the rowing stroke and corresponding physiological muscle adaptations. Int. J. Sports Med. 1993, 14, S32–S34. [Google Scholar] [CrossRef]
  27. Akça, F. Prediction of rowing ergometer performance from functional anaerobic power, strength and anthropometric components. J. Hum. Kinet. 2014, 41, 133–142. [Google Scholar] [CrossRef] [Green Version]
  28. Izquierdo-Gabarren, M.; Expósito, R.G.; de Villarreal, E.S.; Izquierdo, M. Physiological factors to predict on traditional rowing performance. Eur. J. Appl. Physiol. 2010, 108, 83–92. [Google Scholar] [CrossRef]
  29. Cataldo, A.; Cerasola, D.; Russo, G.; Zangla, D.; Traina, M. Mean power during 20 sec all-out test to predict 2000 m rowing ergometer performance in national level young rowers. J. Sports Med. Phys. Fit. 2015, 55, 872–877. [Google Scholar]
  30. Heck, H.; Mader, A.; Hess, G.; Mucke, S.; Muller, R.; Hollmann, W. Justification of the 4-mmol/l lactate threshold. Int. J. Sports Med. 1985, 6, 117–130. [Google Scholar] [CrossRef]
  31. Mader, A. Eine Theorie zur Berechnung der Dynamik und des steady state von Phosphorylierungszustand und Stoffwechselaktivität der Muskelzelle als Folge des Energiebedarfs; German Sport University Cologne: Cologne, Germany, 1984. [Google Scholar]
  32. Julio, U.F.; Panissa, V.L.G.; Esteves, J.V.; Cury, R.L.; Agostinho, M.F.; Franchini, E. Energy-System Contributions to Simulated Judo Matches. Int. J. Sports Physiol. Perform. 2017, 12, 676–683. [Google Scholar] [CrossRef]
  33. Yang, W.H.; Park, J.H.; Shin, Y.C.; Kim, J. Physiological Profiling and Energy System Contributions During Simulated Epée Matches in Elite Fencers. Int. J. Sports Physiol. Perform. 2022, 17, 943–950. [Google Scholar] [CrossRef]
  34. Yang, W.-H.; Heine, O.; Grau, M. Rapid weight reduction does not impair athletic performance of Taekwondo athletes–A pilot study. PLoS ONE 2018, 13, e0196568. [Google Scholar] [CrossRef] [Green Version]
  35. Treff, G.; Mentz, L.; Mayer, B.; Winkert, K.; Engleder, T.; Steinacker, J.M. Initial Evaluation of the Concept-2 Rowing Ergometer’s Accuracy Using a Motorized Test Rig. Front. Sports Act. Living 2021, 3, 801617. [Google Scholar] [CrossRef]
  36. Quittmann, O.J.; Appelhans, D.; Abel, T.; Strüder, H.K. Evaluation of a sport-specific field test to determine maximal lactate accumulation rate and sprint performance parameters in running. J. Sci. Med. Sport 2020, 23, 27–34. [Google Scholar] [CrossRef] [Green Version]
  37. Beneke, R.; Beyer, T.; Jachner, C.; Erasmus, J.; Hütler, M. Energetics of karate kumite. Eur. J. Appl. Physiol. 2004, 92, 518–523. [Google Scholar] [CrossRef]
  38. Hausen, M.; Soares, P.P.; Araújo, M.P.; Porto, F.; Franchini, E.; Bridge, C.A.; Gurgel, J. Physiological responses and external validity of a new setting for taekwondo combat simulation. PLoS ONE 2017, 12, e0171553. [Google Scholar]
  39. Campos, F.A.D.; Bertuzzi, R.; Dourado, A.C.; Santos, V.G.F.; Franchini, E. Energy demands in taekwondo athletes during combat simulation. Eur. J. Appl. Physiol. 2012, 112, 1221–1228. [Google Scholar] [CrossRef]
  40. Lopes-Silva, J.P.; Da Silva Santos, J.F.; Artioli, G.G.; Loturco, I.; Abbiss, C.; Franchini, E. Sodium bicarbonate ingestion increases glycolytic contribution and improves performance during simulated taekwondo combat. Eur. J. Sport Sci. 2018, 18, 431–440. [Google Scholar] [CrossRef]
  41. di Prampero, P.E.; Ferretti, G. The energetics of anaerobic muscle metabolism: A reappraisal of older and recent concepts. Respir. Physiol. 1999, 118, 103–115. [Google Scholar] [CrossRef]
  42. Fritz, C.O.; Morris, P.E.; Richler, J.J. Effect size estimates: Current use, calculations, and interpretation. J. Exp. Psychol. Gen. 2012, 141, 2–18. [Google Scholar] [CrossRef] [Green Version]
  43. Andrade, V.L.; Zagatto, A.M.; Kalva-Filho, C.A.; Mendes, O.C.; Gobatto, C.A.; Campos, E.Z.; Papoti, M. Running-based Anaerobic Sprint Test as a Procedure to Evaluate Anaerobic Power. Int. J. Sports Med. 2015, 36, 1156–1162. [Google Scholar] [CrossRef] [Green Version]
  44. Keir, D.A.; Thériault, F.; Serresse, O. Evaluation of the running-based anaerobic sprint test as a measure of repeated sprint ability in collegiate-level soccer players. J. Strength Cond. Res. 2013, 27, 1671–1678. [Google Scholar] [CrossRef]
  45. Meckel, Y.; Gottlieb, R.; Eliakim, A. Repeated sprint tests in young basketball players at different game stages. Eur. J. Appl. Physiol. 2009, 107, 273–279. [Google Scholar] [CrossRef]
  46. Quittmann, O.J.; Abel, T.; Vafa, R.; Mester, J.; Schwarz, Y.M.; Strüder, H.K. Maximal lactate accumulation rate and post-exercise lactate kinetics in handcycling and cycling. Eur. J. Sport Sci. 2021, 21, 539–551. [Google Scholar] [CrossRef]
  47. van Loon, L.J.; Greenhaff, P.L.; Constantin-Teodosiu, D.; Saris, W.H.; Wagenmakers, A.J. The effects of increasing exercise intensity on muscle fuel utilisation in humans. J. Physiol. 2001, 536, 295–304. [Google Scholar] [CrossRef]
  48. Astridge, D.J.; Peeling, P.; Goods, P.S.R.; Girard, O.; Hewlett, J.; Rice, A.J.; Binnie, M.J. Rowing in Los Angeles: Performance Considerations for the Change to 1500 m at the 2028 Olympic Games. Int. J. Sports Physiol. Perform. 2022, 18, 104–107. [Google Scholar] [CrossRef]
  49. Medbø, J.I.; Mohn, A.C.; Tabata, I.; Bahr, R.; Vaage, O.; Sejersted, O.M. Anaerobic capacity determined by maximal accumulated O2 deficit. J. Appl. Physiol. 1988, 64, 50–60. [Google Scholar] [CrossRef] [Green Version]
  50. Lacour, J.R.; Bouvat, E.; Barthélémy, J.C. Post-competition blood lactate concentrations as indicators of anaerobic energy expenditure during 400-m and 800-m races. Eur. J. Appl. Physiol. Occup. Physiol. 1990, 61, 172–176. [Google Scholar] [CrossRef]
  51. Mader, A.; Hartmann, U.; Hollmann, W. Der Einfluß der Ausdauer auf die 6minütige maximale anaerobe und aerobe Arbeitskapazität eines Eliteruderers. In Rudern; Springer: Berlin/Heidelberg, Germany, 1988; pp. 62–78. [Google Scholar]
  52. Lee, K.H.; Ju, H.M.; Yang, W.H. Metabolic Energy Contributions During High-Intensity Hatha Yoga and Physiological Comparisons Between Active and Passive (Savasana) Recovery. Front. Physiol. 2021, 12, 743859. [Google Scholar] [CrossRef]
  53. Yang, W.-H.; Park, J.-H.; Park, S.-Y.; Park, Y. Energetic Contributions Including Gender Differences and Metabolic Flexibility in the General Population and Athletes. Metabolites 2022, 12, 965. [Google Scholar] [CrossRef]
  54. Adelnia, F.; Ubaida-Mohien, C.; Moaddel, R.; Shardell, M.; Lyashkov, A.; Fishbein, K.W.; Aon, M.A.; Spencer, R.G.; Ferrucci, L. Proteomic signatures of in vivo muscle oxidative capacity in healthy adults. Aging Cell 2020, 19, e13124. [Google Scholar] [CrossRef] [PubMed] [Green Version]
  55. Zagatto, A.M.; Beck, W.R.; Gobatto, C.A. Validity of the running anaerobic sprint test for assessing anaerobic power and predicting short-distance performances. J. Strength Cond. Res. 2009, 23, 1820–1827. [Google Scholar] [CrossRef] [PubMed] [Green Version]
  56. Nitzsche, N.; Baumgärtel, L.; Schulz, H. Comparison of Maximum Lactate Formation Rates in Ergometer Sprint and Maximum Strength Loads. Ger. J. Sports Med. 2018, 69, 13–18. [Google Scholar] [CrossRef]
  57. Dobson, G.P.; Yamamoto, E.; Hochachka, P.W. Phosphofructokinase control in muscle: Nature and reversal of pH-dependent ATP inhibition. Am. J. Physiol. Regul. Integr. Comp. Physiol. 1986, 250, R71–R76. [Google Scholar] [CrossRef] [PubMed]
  58. Beneke, R.; Leithäuser, R.M.; Ochentel, O. Blood lactate diagnostics in exercise testing and training. Int. J. Sports Physiol. Perform. 2011, 6, 8–24. [Google Scholar] [CrossRef] [PubMed] [Green Version]
  59. Hauser, T.; Adam, J.; Schulz, H. Comparison of calculated and experimental power in maximal lactate-steady state during cycling. Theor. Biol. Med. Model 2014, 11, 25. [Google Scholar] [CrossRef] [Green Version]
  60. Weber, S. Berechnung Leistungsbestimmender Parameter der Metabolischen Aktivität auf Zellulärer Ebene Mittels Fahrradergometrischer Untersuchungen. Diploma Thesis, German Sport University Cologne, Cologne, Germany, 2003. [Google Scholar]
  61. Esbjörnsson-Liljedahl, M.; Sundberg, C.J.; Norman, B.; Jansson, E. Metabolic response in type I and type II muscle fibers during a 30-s cycle sprint in men and women. J. Appl. Physiol. 1999, 87, 1326–1332. [Google Scholar] [CrossRef] [Green Version]
  62. Henriksson, J.; Chi, M.M.; Hintz, C.S.; Young, D.A.; Kaiser, K.K.; Salmons, S.; Lowry, O.H. Chronic stimulation of mammalian muscle: Changes in enzymes of six metabolic pathways. Am. J. Physiol. 1986, 251, C614–C632. [Google Scholar] [CrossRef]
  63. Wende, A.R.; Schaeffer, P.J.; Parker, G.J.; Zechner, C.; Han, D.H.; Chen, M.M.; Hancock, C.R.; Lehman, J.J.; Huss, J.M.; McClain, D.A.; et al. A role for the transcriptional coactivator PGC-1alpha in muscle refueling. J. Biol. Chem. 2007, 282, 36642–36651. [Google Scholar] [CrossRef] [Green Version]
  64. Linossier, M.T.; Dormois, D.; Perier, C.; Frey, J.; Geyssant, A.; Denis, C. Enzyme adaptations of human skeletal muscle during bicycle short-sprint training and detraining. Acta Physiol. Scand 1997, 161, 439–445. [Google Scholar] [CrossRef]
  65. Tesch, P.A.; Komi, P.V.; Häkkinen, K. Enzymatic adaptations consequent to long-term strength training. Int. J. Sports Med. 1987, 8, 66–69. [Google Scholar] [CrossRef] [PubMed]
  66. MacDougall, J.D.; Hicks, A.L.; MacDonald, J.R.; McKelvie, R.S.; Green, H.J.; Smith, K.M. Muscle performance and enzymatic adaptations to sprint interval training. J. Appl. Physiol. 1998, 84, 2138–2142. [Google Scholar] [CrossRef] [PubMed]
  67. Nalbandian, M.; Takeda, M. Lactate as a Signaling Molecule That Regulates Exercise-Induced Adaptations. Biology 2016, 5, 38. [Google Scholar] [CrossRef] [PubMed] [Green Version]
  68. Jensen-Urstad, M.; Svedenhag, J.; Sahlin, K. Effect of muscle mass on lactate formation during exercise in humans. Eur. J. Appl. Physiol. Occup. Physiol. 1994, 69, 189–195. [Google Scholar] [CrossRef]
  69. Plotkin, D.L.; Roberts, M.D.; Haun, C.T.; Schoenfeld, B.J. Muscle Fiber Type Transitions with Exercise Training: Shifting Perspectives. Sports 2021, 9, 127. [Google Scholar] [CrossRef] [PubMed]
  70. Gehlert, S.; Weber, S.; Weidmann, B.; Gutsche, K.; Platen, P.; Graf, C.; Kappes-Horn, K.; Bloch, W. Cycling exercise-induced myofiber transitions in skeletal muscle depend on basal fiber type distribution. Eur. J. Appl. Physiol. 2012, 112, 2393–2402. [Google Scholar] [CrossRef] [PubMed]
  71. Nitzsche, N.; Lenz, J.C.; Voronoi, P.; Schulz, H. Adaption of Maximal Glycolysis Rate after Resistance Exercise with Different Volume Load. Sports Med. Int. Open 2020, 4, E39–E44. [Google Scholar] [CrossRef] [Green Version]
  72. Parra, J.; Cadefau, J.A.; Rodas, G.; Amigó, N.; Cussó, R. The distribution of rest periods affects performance and adaptations of energy metabolism induced by high-intensity training in human muscle. Acta Physiol. Scand 2000, 169, 157–165. [Google Scholar] [CrossRef]
  73. Millet, G.P.; Roels, B.; Schmitt, L.; Woorons, X.; Richalet, J.P. Combining hypoxic methods for peak performance. Sports Med. 2010, 40, 1–25. [Google Scholar] [CrossRef]
  74. Webster, K.A. Evolution of the coordinate regulation of glycolytic enzyme genes by hypoxia. J. Exp. Biol. 2003, 206, 2911–2922. [Google Scholar] [CrossRef] [Green Version]
Figure 1. Rowing time trial (RTT) and rowing sprint test (RST) test procedures. (A) Procedure of the 10 s RST and (B) 2000 m RTT.
Metabolites 13 00317 g001
Figure 2. Energetic contributions during 2000 m RTT. Calculated absolute ((A,B), kJ) and relative ((C,D), %) energetic contributions in 2000 m RTT. Oxidative energy contribution is shown in blue, glycolytic energy contribution in green, and phosphagen energy contribution in red. Data are mean ± standard deviation (SD) (n = 8). ** p < 0.01, *** p < 0.001, ns: p > 0.05. ES: effect size.
Metabolites 13 00317 g002
Figure 3. Relationship between νLa.max and WGly (n = 8). νLa.max: maximum rate of lactate accumulation, WGly: glycolytic energy contribution. Dotted lines: 95% confidence interval, straight line: strength of the linear relationship between two variables.
Metabolites 13 00317 g003
Figure 4. Relationship between (A) 2000 m RTT performance and νLa.max (n = 8), between (B) 2000 m RTT performance and WGly (n = 8), between (C) P4 and 2000 m RTT performance (N = 10), and between (D) 2000 m RTT performance and V . O2peak (n = 9). V . O2peak: peak oxygen uptake during 2000 m RTT, P4: mechanical power output at 4 mmol·L−1. Dotted lines: 95% confidence interval, straight line: strength of the linear relationship between two variables.
Metabolites 13 00317 g004
Figure 5. Correlation analyses. Relations between (A) the νLa.max value and ∆300first−last during 2000 m RTT (N = 10), between (B) first 300 m during 2000 m RTT and νLa.max (N = 10), and between (C) last 300 m during 2000 m RTT and νLa.max (N = 10). ∆: Delta 300first−last; subtraction of P300first and P300last. Dotted lines: 95% confidence interval, straight line: strength of the linear relationship between two variables.
Metabolites 13 00317 g005
Figure 6. Relations between (A) 2000 m RTT performance and νLa.max (n = 7), between (B) 2000 m RTT performance and V . O2peak (n = 6), (C) between P300fist during 2000 m RTT performance and νLa.max (n = 7), and between (D) ∆300first−last of the 2000 m RTT and νLa.max (n = 7). Dotted lines: 95% confidence interval, straight line: strength of the linear relationship between two variables.
Metabolites 13 00317 g006
Table 1. Anthropometric data.
ParametersTotalMaleFemale
N = 10n = 7n = 3
Age [years]19.80 ± 0.919.8 ± 0.919.6 ± 0.5
Height [cm]183.20 ± 7.0188.4 ± 3.2175.6 ± 4.7
Body mass [kg]79.9 ± 13.385.4 ± 11.267.2 ± 3.8
Body fat [%]16.4 ± 5.114.8 ± 5.020.08 ± 3.1
Data are presented as means and standard deviation (SD).
Table 2. Physiological variables obtained during and after 2000 m RTT and power output (W) at 4 mmol∙L−1 determined during the incremental step test.
Participants (Sex)2000 m RTT PerformanceLapeak V ˙ O2peakP4
smmol·L−1ml·min−1W
P1 (f)43515.774042229
P2 (f)45915.774233200
P3 (f)4568.953546226
P4 (m)39218.825561302
P5 (m)37821.305683298
P6 (m)38219.665626305
P7 (m)38915.015388335
P8 (m)37218.025967338
P9 (m)38513.515757314
P10 (m)38115.91-314
2000 m RTT performance (s), peak lactate values after 2000 m RTT (Lapeak), V . O2peak values (in ml·min−1) during 2000 m RTT and mechanical power output at 4 mmol∙L−1 (in W) for each athlete (P1–P10).
Table 3. Maximum rate of lactate accumulation (νLa.max) and power output (W) over certain sections during 2000 m RTT.
Participants (Sex)νLa.maxtPCrP300firstP300last∆300 first-last
mmol·L−1·s−1sWWW
P1 (f)0.292.9530329013
P2 (f)0.372.9525323320
P3 (f)0.252.952182180
P4 (m)0.442.9539536134
P5 (m)0.412.9546640858
P6 (m)0.662.9544838860
P7 (m)0.362.954124111
P8 (m)0.572.9547243339
P9 (m)0.642.9540732087
P10 (m)0.502.9541735067
νLa.max values (in mmol·L−1·s−1), tPCr (s), mean mechanical power output (in W) over the first and last 300 m over the course of 2000 m RTT and ∆300 first-last for each athlete (P1−P10).
Disclaimer/Publisher’s Note: The statements, opinions and data contained in all publications are solely those of the individual author(s) and contributor(s) and not of MDPI and/or the editor(s). MDPI and/or the editor(s) disclaim responsibility for any injury to people or property resulting from any ideas, methods, instructions or products referred to in the content.

