Abstract
The complex development of type 2 diabetes (T2D) creates challenges for studying the progression and treatment of the disease in animal models. A newly developed rat model of diabetes, the Zucker Diabetic Sprague Dawley (ZDSD) rat, closely parallels the progression of T2D in humans. Here, we examine the progression of T2D and associated changes in the gut microbiota in male ZDSD rats and test whether the model can be used to examine the efficacy of potential therapeutics such as prebiotics, specifically oligofructose, that target the gut microbiota. Bodyweight, adiposity, and fed/fasting blood glucose and insulin were recorded over the course of the study. Glucose and insulin tolerance tests were performed, and feces collected at 8, 16, and 24 weeks of age for short-chain fatty acids and microbiota analysis using 16s rRNA gene sequencing. At the end of 24 weeks of age, half of the rats were supplemented with 10% oligofructose and tests were repeated. We observed a transition from healthy/nondiabetic to prediabetic and overtly diabetic states, via worsened insulin and glucose tolerance and significant increases in fed/fasted glucose, followed by a significant decrease in circulating insulin. Acetate and propionate levels were significantly increased in the overt diabetic state compared to healthy and prediabetic. Microbiota analysis demonstrated alterations in the gut microbiota with shifts in alpha and beta diversity as well as alterations in specific bacterial genera in healthy compared to prediabetic and diabetic states. Oligofructose treatment improved glucose tolerance and shifted the cecal microbiota of the ZDSD rats during late-stage diabetes. These findings underscore the translational potential of ZDSD rats as a model of T2D and highlight potential gut bacteria that could impact the development of the disease or serve as a biomarker for T2D. Additionally, oligofructose treatment was able to moderately improve glucose homeostasis.
1. Introduction
Type 2 diabetes (T2D) is classically characterized by chronic hyperglycemia, due to increased hepatic glucose production, insulin resistance, and altered insulin production and secretion [1]. However, the development of T2D is highly complex with diet, genetics, and the environment all playing a role [2]. More recently, the gut microbiota has been implicated in the development and progression of T2D [3,4]. T2D is associated with a unique gut microbiota, and the gut microbiota has been implicated in the success of several current treatment options for diabetes [5,6]. However, the causal role of the gut microbiota in T2D is still poorly understood. For example, while inoculation of germ-free mice with the gut microbiota from diabetic mice compared to healthy mice results in impaired glucose homeostasis, this merely demonstrates the glucoregulatory impact of the gut microbiota but does not prove causality [7]. Challenges in demonstrating causality can be attributed, in part, to a lack of relevant translational models to examine T2D development in unison with alterations in the gut microbiota.
Due to the extensive limitations of studying T2D in humans, researchers have relied on animal models that mimic some of the classic features of T2D, such as increased hepatic glucose production or insulin resistance or severe loss of insulin secretion. However, current animal models for studying T2D lack the normal progression of diabetes development, do not manifest all the clinical characteristics, or have mutations in critical signaling pathways that are uncommon in humans. For example, high-fat diet (HFD)-fed mice are a commonly used model to mimic human diabetes as HFD mice are hyperglycemic, exhibit increased hepatic glucose production, and are insulin resistant. However, HFD mice lack a translational prediabetic state, and rarely develop overt diabetes with loss of insulin release and unchecked hyperglycemia [8]. The commonly used Zucker Diabetic Fatty (ZDF) rat as well as the ob/ob and db/db mouse models have genetic defects in the leptin signaling pathway, inducing obesity and insulin resistance, which are uncommon in human T2D development [9,10]. However, the Zucker Diabetic Sprague Dawley (ZDSD) rat model was recently developed as a more translational animal model for the development of diabetes. ZDSD rats are a cross between the ZDF rat and the Sprague Dawley (SD) rat, which readily develops obesity when placed on a HFD. ZDSD rats are susceptible to high fat (HF) diet-induced obesity and T2D, but unlike ZDF rats, ZDSD rats have preserved the critical leptin signaling pathway [9]. ZDSD rats have been previously characterized and present a normal progression of diabetes from 7 to 24 weeks of age, with healthy, prediabetic, and overt diabetic stages [9,11]. However, to date, no study has characterized the changes in the gut microbiota or microbial-derived short chain fatty acids (SCFAs) through the various stages of T2D in the ZDSD rat. By examining these shifts, not only can we gain a better understanding of the role of the gut microbiota in diabetes progression and discover potential therapeutic targets for T2D, but we may also uncover potential bacteria or metabolites that can serve as biomarkers for the development of T2D. In the current study, the fecal gut microbiota and fecal SCFAs were analyzed through the various stages in the progression of diabetes in the ZDSD rat.
One of the more promising gut microbiota-mediated treatments for metabolic disease is via supplementation with prebiotics, which are nondigestible food components that are selectively fermented by the gut microbiota to confer a health benefit to the host [12,13]. More specifically, the prebiotic oligofructose (OFS) beneficially shifts the gut microbiota and improves glucose and energy homeostasis in obese and diabetic rodents [14,15,16,17]. However, these studies primarily examine the effects of oligofructose in genetically modified or diet-induced obese rodents [18,19]. Therefore, we examined the effect of oligofructose in overt diabetic ZDSD rats to determine whether it could serve as a potential therapy to improve glucose homeostasis in individuals with advanced stage diabetes.
2. Materials and Methods
2.1. Animals
Seven-week-old male ZDSD rats were kindly provided by Charles River Laboratories. All animals were cohoused and maintained on a 12 h light/dark cycle with ad libitum access to chow (Purina 5008). At 16 weeks, rats were switched to a HFD (Research Diets D12468) for 3 weeks before being returned to their normal chow diet, in accordance with previous studies and recommended by Charles River Laboratories (personal correspondence) [9]. Body composition was measured throughout the study using quantitative magnetic resonance imaging using EchoMRI-1100 (EchoMRI, Houston, TX, USA). At the end of 24 weeks, a subset of rats was supplemented with 10% OFS in drinking water for 15 weeks (Figure 1A). The concentration of OFS in drinking water was calculated based on average amount of water and food consumed so that OFS supplementation accounted for ~10% of caloric intake.
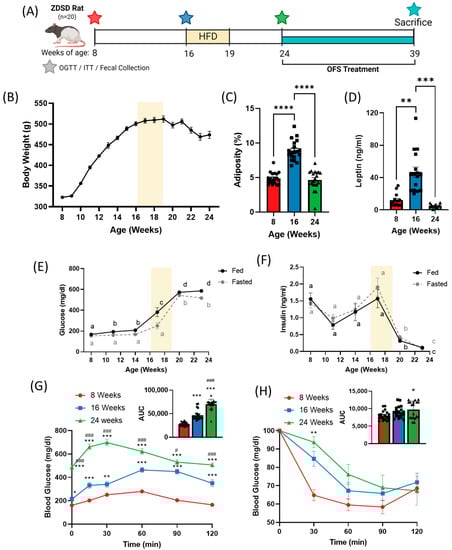
Figure 1.
Progression of diabetes in the ZDSD rat model shifts bodyweight and adiposity and worsens glucose tolerance and insulin sensitivity. (A) Experimental timeline. (B) 24-week body weight and (C) adiposity and (D) plasma leptin at 8, 16, and 24 weeks of age in ZDSD rats on a chow diet with HF diet administered from weeks 16–19. Fed and fasted (E) blood glucose and (F) insulin over 24 weeks. (G) Oral glucose tolerance test and (H) insulin tolerance test at 8, 16, and 24 weeks. Data in all graphs represent the mean + SEM (n = 19); different letters represent significant differences (p < 0.05) over time for fed (black) or fasted (grey) glucose and insulin levels; * p < 0.05, ** p < 0.01, *** p < 0.001 vs. 8 weeks; **** p < 0.0001 between groups; # p < 0.05, ### p < 0.001 vs. 16 weeks, as assessed by two-way ANOVA with Tukey’s (G,H) or Šídák’s (E,F) multiple comparisons test or one-way ANOVA with Tukey’s multiple comparisons (C,D,G,H; AUC).
2.2. Glucose and Insulin Tolerance Testing
Tolerance tests were performed at 8, 16, and 24 weeks of age, and at the end of 14 weeks of OFS treatment. For oral glucose tolerance tests, 6 h fasted rats received an oral gavage of 40% glucose solution (2 g/kg bw; Sigma G7021, St. Louis, MO, USA). Blood glucose was recorded at t = 0, 15, 30, 60, 90, and 120 minutes. For insulin tolerance testing, 5 h fasted rats received an intraperitoneal injection of insulin (0.75 U/kg; Sigma I0516-5ML). Blood glucose was recorded at t = 0, 30, 60, 90, 120 minutes.
2.3. Fed and Fasted Blood and Fecal Collection
Fed blood was collected at the end of the dark cycle via tail vein. Rats were then fasted for 6 h and blood collection repeated. Glucometer was used to measure glucose levels and plasma was collected and stored at −80 degrees for insulin analysis. Fresh feces were collected in cryogenic vials and snap frozen in liquid nitrogen at the 8 week, 16 week, and 24 week time points for microbiota analysis. HOMA-IR was calculated from fasting glucose and insulin (HOMA IR = (insulin (mU/L) × glucose (mg/dL))/405).
2.4. Tissue Collection
Prior to sacrifice, rats were fasted for 5 h and anesthetized using isoflurane. Blood from the portal vein and vena cava were collected in tubes containing DPP-IV inhibitor and plasma was stored at −20 °C. Lower small intestinal (LSI) scrapings (30 cm) were collected ending 10 cm proximal to the cecum, and colon tissue (1 cm) was collected 2 cm distal to the cecum and snap frozen in liquid nitrogen. Cecal contents were collected in cryogenic vials and snap frozen in liquid nitrogen for microbiota analysis.
2.5. RNA Extraction and qPCR
RNA isolation was performed using the PureLink™ RNA Mini Kit (Ambion, Austin, TX, USA) for LSI and colon tissue per the manufacturer’s protocol. cDNA was synthesized using the SuperScript™ IV VILO™ Master Mix with ezDNase™ Enzyme (Invitrogen, Waltham, MA, USA) per the manufacturer’s instruction with 3 μg of RNA. qRT-PCR was performed with CFX96 Touch™ Real-Time PCR Detection System (BioRad Laboratories, Hercules, CA, USA) using rat Gcg (Rn00562293_m1) and 18s ribosomal RNA (Rn03928990_g1) TaqMan™ Gene Expression Assays (ThermoFischer Scientific, Waltham, MA, USA).
2.6. DNA Extraction and Microbiota Analysis
Fecal and cecal microbiota of each animal was assessed based on the V4 fragment of 16S rRNA gene as we previously performed [20,21]. The DNA extraction and library preparation were performed as we described previously [20,22]. A 7.7 pM library spiked with 10% PhiX V3 Sequencing Control (Illumina, San Diego, CA, USA) was sequenced at Microbiome Core at the University of Arizona Steele Children’s Research Center on MiSeq platform (Illumina) using custom primers [23]. The sequencing reads were demultiplexed using the idemp script (https://github.com/yhwu/idemp accessed on 1 April 2022). Filtering, dereplication, chimera identification, and merging of paired-end reads were performed with DADA2 [24]. The ASVs taxonomy was assigned using the Ribosomal Database Project (RDP) classifier [25] against SILVA database (release 138). Richness and Bray–Curtis dissimilarity based non-metric multidimensional scaling (NMDS) ordination were calculated using vegan package [26]. DeSeq2 package was used to calculate differential abundance between experimental groups. Only taxa (family and genus level) significantly different (adjusted p < 0.05, Wald test corrected for multiple testing using the FDR/Benjamini-Hochberg method) were presented. The Friedman test (non-parametric paired test) was used to determine the statistically significant differences between time points. Significant Friedman tests were followed by pairwise Wilcoxon signed-rank test with Bonferroni correction. Spearman correlation for metabolic parameters, SCFAs and taxa at the genus level was calculated with cor function form the stats package [27] and visualized with corplot package [28].
2.7. Short Chain Fatty Acid Analysis
Fecal contents were sent to Microbiome Insights for SCFA extraction as described in Zhao et al. [29]. Briefly, fecal samples were resuspended in MilliQ-grade water, and homogenized using MP Bio FastPrep, for 1 min at 4.0 m/s. Five M HCl was added to acidify fecal suspensions to a final pH of 2.0. Acidified fecal suspensions were incubated and centrifuged at 10,000 rpm to separate the supernatant. Fecal supernatants were spiked with 2-Ethylbutyric acid for a final concentration of 1 mM. Extracted SCFA supernatants were stored in 2-mL GC vials, with glass inserts. SCFAs were detected using gas chromatography (Thermo Trace 1310), coupled to a flame ionization detector (Thermo). SCFA concentrations were measured and presented per kilogram of fecal contents analyzed.
2.8. Biochemical Analysis
Blood glucose was measured using glucometer, unless reading exceed glucometer capabilities, in which case, plasma glucose was measured using a glucose analyzer (Analox GM9, Stourbridge, UK). Fed and fasted plasma insulin was measured via ELISA following manufacturer’s protocol (Cat. # 80-INSRT-E01, Alpco, Salem, NH, USA). Circulating leptin at 8 week, 16 week, and 24 week timepoints was measured using multiplex assay following manufacturer’s protocol (Cat. # RECYTMAG-65K, Millipore, Burlington, MA, USA). Vena cava leptin and portal glucagon-like peptide-1 (GLP-1) from control and OFS-treated rats was determined by ELISA following manufacturer’s protocol (Cat. #EGLP-35K, Millipore; Cat. # EZRL-83K, Millipore).
2.9. Statistical Analysis
Treatments were assigned randomly to animals and normal variance was demonstrated for all groups. One-way ANOVA with Tukey’s multiple comparisons test was used to analyze the differences between the three time points for adiposity, leptin, AUC, and SCFA levels. Two-way ANOVA with Tukey’s or Šídák’s multiple comparisons test was used to analyze fed and fasted glucose and insulin levels and glucose and insulin tolerance tests. Welch’s t test was used to examine differences in bodyweight, adiposity, AUC, leptin, and GLP-1 between OFS treated and untreated groups. P value < 0.05 was considered statistically significant.
3. Results
3.1. Bodyweight and Body Composition
The male ZDSD rat starting weight averaged 322 ± 13 g at 8 weeks of age. Bodyweight increased over 10 weeks with a peak in bodyweight at 512 ± 33 g at 19 weeks of age, followed by a decline over the next 5 weeks prior to the start of OFS treatment (Figure 1A). Adiposity, or percent fat mass, increased significantly between 8 and 16 weeks, but decreased significantly from 16 to 24 weeks (Figure 1B and Figure S1) which corresponded with drastic changes in circulating leptin (Figure 1C) and glucose homeostasis.
3.2. Whole Body Glucose Homeostasis
Over the course of the study, ZDSD rats progressed from a nondiabetic to a prediabetic followed by an overt diabetic state. Fed and fasted blood glucose significantly increased over the course of the study with a dramatic increase from 14 to 20 weeks of age (Figure 1D). Fed and fasted insulin levels peaked at 17 weeks of age before rapidly declining (Figure 1E). Oral glucose tolerance was significantly impaired at 16 weeks compared to 8 weeks of age, and further worsened at 24 weeks, as denoted by a significantly increased area under the curve (Figure 1F). Insulin tolerance tests revealed no difference in insulin tolerance at 8 and 16 weeks, but significantly decreased insulin tolerance at 24 weeks (Figure 1G). Additionally, HOMA-IR was calculated and significantly increased from 8 weeks (0.456 ± 0.208) to 16 weeks (0.774 ± 0.397; p = 0.067 vs. 8 weeks; p < 0.0001 vs. 24 weeks) before rapidly declining by 24 weeks (0.082 ± 0.082; p < 0.0001 vs. 16 weeks), although this is likely an artifact of dramatically reduced insulin secretion at 24 weeks (Figure 2F). Similar to previous studies [9,30], ZDSD rats established a progression of diabetes, from healthy (8 weeks) to prediabetes (16 weeks) to overt diabetes (24 weeks). Development of prediabetes was classified based on an increase in plasma glucose without a substantial change in insulin resistance, while diabetes was defined by severe hyperglycemia and impaired insulin signaling with rats exhibiting both hypoinsulinemia and insulin resistance.
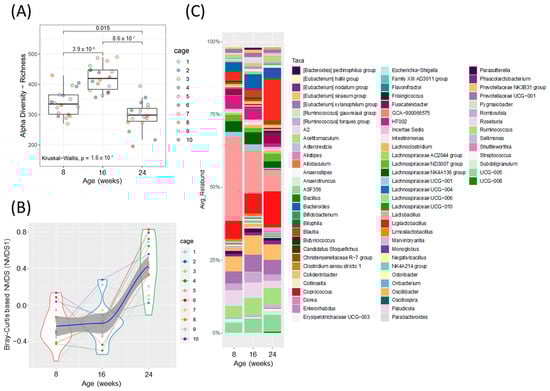
Figure 2.
Fecal microbiota analysis throughout the development of diabetes in ZDSD rodents. (A) Alpha diversity index, ASV/ species richness. Statistically significant differences between groups were tested using Kruskal–Wallis test followed by pairwise Wilcoxon signed-rank test with FDR as a multiple hypothesis testing correction. (B) Non-metric multidimensional scaling (NMDS) using Bray–Curtis dissimilarity (NMDS 1, beta-diversity index). Each dot represents a sample from each animal at the given timepoint (disease development) and the data distribution is visualized with the kernel density violin plots with the lines connecting sample pairs from the same animal; Loess (local polynomial) regression is shown as a bold blue line with 95% confidence interval (in gray). (C) Taxonomic analysis at the genus level, showing relative abundance for ZDSD rodents as they progress from a healthy, to prediabetic, and diabetic state (n = 18, genera with relative abundance lower than 0.1% were removed for visualization only).
3.3. Fecal Microbiota Analysis over Time
Alpha diversity was increased at 16 weeks (prediabetic) compared to 8 weeks (healthy), but rapidly declined following development of diabetes at 24 weeks (diabetic) of age (Figure 2A). Beta diversity was unchanged from healthy to prediabetic states, but significantly shifted following the development of the diabetic phenotype (Figure 2B). Relative abundances of several bacterial genera shifted throughout the development of diabetes (Figure 2C and Figure S2A,B). To look more closely at the specific bacteria that were shifted between the phenotypes, we compared the relative abundance of several bacterial genera at all three timepoints (Figure 3). These specific bacterial genera were selected for time course analysis using DESeq2 analysis (Supplementary Figure S2). The genera presented in Figure 3A–C represent significant differential shifts in both the prediabetic (16 weeks of age) and diabetic (24 weeks of age), compared to healthy (8 weeks of age), thus representing changes in the microbiota that precede development of overt diabetes. The genera presented in Figure 3D–F were significantly shifted in only the diabetic state (24 weeks of age), as a representation of changes likely from the result of the diabetic phenotype. Only the bacterial genera that remained significantly shifted with the Friedman test were represented in Figure 3; all other significant changes are presented in Supplementary Figure S2. Lactobacillus was significantly decreased following the progression from healthy to prediabetic phenotype and further decreased following diabetes development and was negatively correlated with fed and fasting glucose and positively correlated with fed insulin (Figure 3A and Figure 4D). Alistipes and Ruminococcus were increased from healthy to prediabetes and remained elevated at 24 weeks (Figure 3B,C). These bacteria were initially shifted in the prediabetic state, indicating that they may play a causative or preventative role in the progression of diabetes. On the other hand, Lachnospiraceae, Roseburia, and Blautia were significantly altered only in the diabetic phenotype with reductions in Lachnospiraceae and Roseburia and increases in Blautia (Figure 3D–F), potentially due secondarily to host physiological changes occurring during diabetes progression. Indeed, Blautia was negatively correlated with fed and fasting insulin and positively correlated with fed and fasting glucose (Figure 4D).
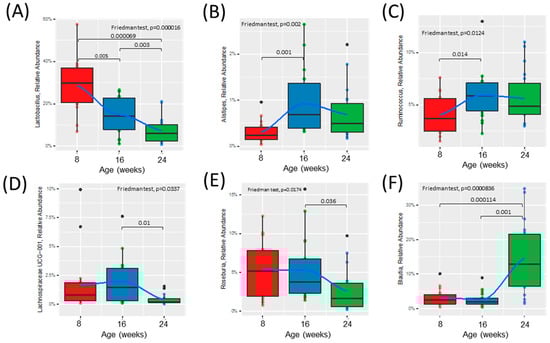
Figure 3.
Time course analysis of the relative abundance of specific bacterial genera throughout the development of diabetes in ZDSD rodents. Presented genera were selected based on DESeq2 analysis and only taxa significantly different were chosen. (A–C) Relative abundance of bacteria significantly shifted from healthy (0) to prediabetic (8). (D–F) Relative abundance of bacteria significantly shifted from prediabetic (8) to diabetic (16) state. Statistically significant differences between groups were tested with the Friedman followed by the pairwise Wilcoxon signed-rank test with Bonferroni correction. The colored dots represent individual samples (ZDSD rats), the black dots represent outliers. The boxes visualize the median, the 25th and 75th percentile. The whiskers visualize the minimum and the maximum values. Loess (local polynomial) regression is shown as a bold blue line with 95% confidence interval (in gray).
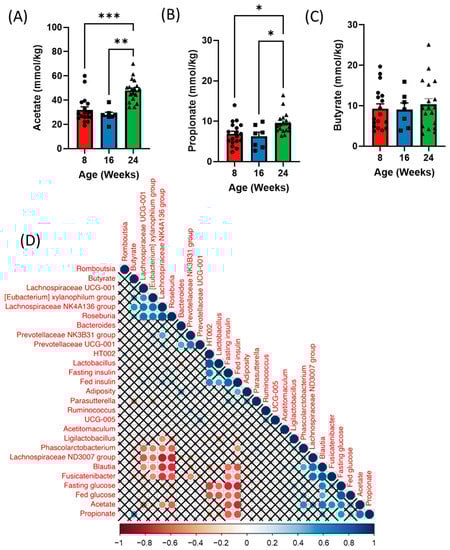
Figure 4.
Time course analysis of fecal short chain fatty acids (SCFAs) throughout the development of diabetes in ZDSD rodents. (A) Acetate, (B) propionate, and (C) butyrate levels in the feces of 5 h fasted ZDSD rats. (D) Spearman correlation of metabolic parameters with fecal bacteria and short-chain fatty acids in ZDSD rats. Correlations that did not reach significance after correcting for False Discovery Rate are marked with an X. Data in all graphs represent the mean + SEM (n = 18); * p < 0.05, ** p < 0.01, *** p < 0.001, as assessed by Kruskal–Wallis one-way ANOVA.
3.4. Fecal Short Chain Fatty Acid (SCFA) Analysis over Time
We next examined whether shifts in the gut microbiota over time could also influence SCFA levels at each timepoint. Analysis of fecal SCFAs revealed increases in both acetate and propionate with no difference in butyrate at 24 weeks of age (diabetic) compared to both 8 (healthy) and 16 (prediabetic) weeks of age (Figure 4A–C). Additionally, we observed a significant increase in isobutyrate in the prediabetic state, and a reduction in hexanoic acid in the diabetic state (Supplementary Figure S3A–D). Both fecal acetate and propionate positively correlated with fed and fasting glucose and negatively correlated to fed and fasting insulin as well as adiposity (Figure 4D). Blautia was positively correlated with both acetate and propionate and negatively correlated with butyrate, while Lachnospiraceae and Roseburia were negatively correlated with acetate (Figure 4D). Lachnospiraceae was also positively correlated with butyrate (Figure 4D).
3.5. Oligofructose Increases Bodyweight and Adiposity and Improves Glucose Tolerance in Overt Diabetic ZDSD Rats
Supplementation of overt diabetic ZDSD rats with 10% OFS in their drinking water for 15 weeks prevented a decrease in bodyweight associated with the progression of untreated T2D. OFS-treated rats had significantly increased bodyweight compared to controls after 7 weeks of treatment and had increased adiposity after 9 weeks (Figure 5A,B and Figure S4A). In accordance with the increase in adiposity following OFS treatment, OFS-treated rats exhibited increased circulating leptin compared to controls (Figure 5C). OFS also improved oral glucose tolerance and decreased fed glucose levels with no change in insulin at the end of the study (Figure 5C–E). As OFS improves fed but not fasted glucose in overt diabetic ZDSD rats, we next measured Gcg mRNA in the lower small intestine (LSI) and colon. Gcg encodes for the incretin hormone glucagon-like peptide-1 (GLP-1), which is secreted following a meal and is known to be reduced with T2D [31]. Gcg expression was significantly increased with OFS treatment in both the LSI and colon of OFS-treated rats (Figure 5G). Additionally, GLP-1 was slightly increased in the portal vein following OFS treatment, although it did not reach statistical significance (Figure 5H).
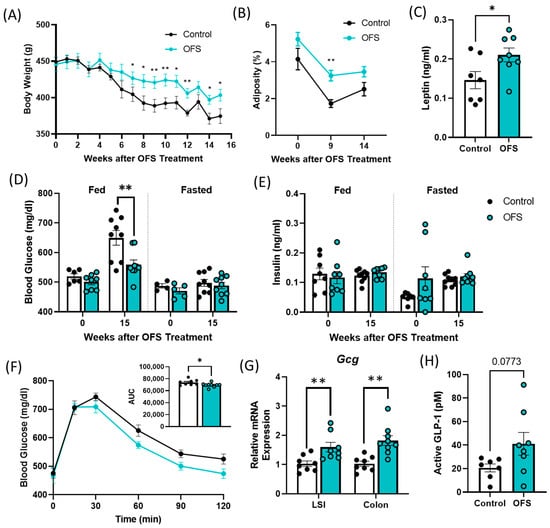
Figure 5.
Oligofructose (OFS) increases bodyweight and adiposity and improves glucose tolerance in the ZDSD rat model of diabetes. (A) Bodyweight and (B) adiposity following supplementation with OFS in overt diabetic ZDSD rats. (C) Plasma leptin following 15 weeks of OFS treatment. Fed and fasted plasma, (D) glucose, and (E) insulin at baseline and following 15 weeks of OFS supplementation. (F) Oral glucose tolerance test following 15 weeks of OFS treatment. (G) Lower small intestine (LSI) and colon Gcg mRNA expression and (H) portal GLP-1 levels following 15 weeks of OFS treatment. Data in all graphs represent the mean + SEM (n = 18); * p < 0.05, ** p < 0.01 vs. control, as assessed by two-way ANOVA with Šídák’s multiple comparisons test or unpaired t test with Welch’s correction.
3.6. Oligofructose Shifts the Cecal Microbiota in Overt Diabetic ZDSD Rodents
Oligofructose reduced cecal microbiota alpha diversity and shifted beta diversity after 16 weeks of treatment (Figure 6A,B). The cecal, rather than fecal, microbiota was analyzed at the end of the study, as the cecum houses the majority of the gut microbiota and provides a more accurate endogenous representation of the proportional differences between genera [32]. OFS treatment also significantly shifted the relative abundance of the cecal microbiota with 17 taxa increased and only 1 taxon decreased (Supplementary Figure S4B). Similar to other OFS studies [33,34,35], the greatest increase observed was in Bifidobacterium relative abundance compared to the control untreated rats (Figure 6C and Figure S4B), while Ruminococcus relative abundance was significantly decreased. Of note, this was the only genus that was significantly altered from the genera in Figure 3 that were selected based on either potentially being causative or resultant of the diabetic phenotype.
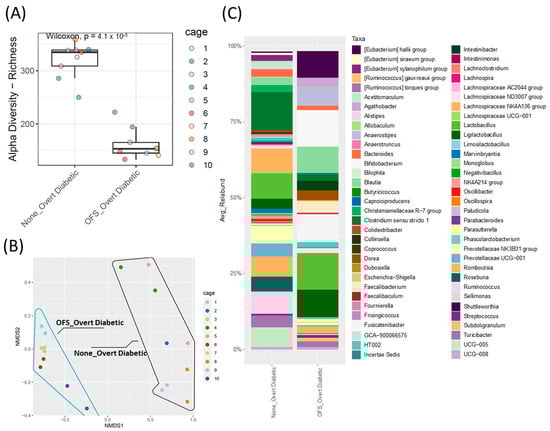
Figure 6.
Cecal microbiota analysis of overt diabetic ZDSD rodents following OFS treatment. (A) Alpha diversity index, ASV/Species Richness with statistical significance between groups tested using pairwise Wilcoxon signed-rank test with FDR as a multiple hypothesis testing correction. (B) Beta-diversity, non-metric multidimensional scaling (NMDS) analysis based on Bray–Curtis dissimilarities; shape outlines used to represent sample groups with (blue line) or without (black line) OFS treatment. Statistical significance between groups was assessed using permutational multivariate analysis of variance using distance matrices (Adonis test). (C) Taxonomic analysis of genus-level relative abundance for control and OFS-treated ZDSD rodents (n = 18, genera with relative abundance lower than 0.1% were removed for visualization only).
4. Discussion
Rodent models are commonly used to examine the mechanism of T2D development and progression, although most rodent models fail to replicate the development and normal progression of diabetes that occurs in humans. In mice, long-term HFD-feeding causes weight gain and hyperglycemia associated with increased insulin and impaired glucose tolerance and is commonly used in the obese-susceptible C57BL/6J mice or SD rats [36,37]. However, these HFD-fed rodents do not develop overt T2D and fail to recapitulate the entire progression of human diabetes. Beta cell dysfunction is a characteristic of overt diabetes, and although a combination of HF-feeding and streptozotocin injection, to promote insulin resistance and destroy pancreatic beta cells, respectively, is another commonly used model of T2D, it fails to follow the natural progression of the disease unlike the ZDSD rat [38]. Furthermore, the genetic component of T2D development in humans is highly complex, with the genetic risk of diabetes development linked to multiple gene regions and gene interactions, making replication in rodents unachievable [2]. While the monogenic ZDF rodent model rapidly develops diabetes by 8 weeks of age due to a missense mutation in their leptin receptor, the ZDSD rat overcomes this by exhibiting normal leptin signaling and likely has polygenetic contributions to the development of diabetes. Additionally, the ZDF rat rapidly develops overt diabetes within 8 weeks of age, unlike the ZDSD model, which we and others have found provides a longer window to examine the progression of T2D and possible preventative therapeutics [9,11,39]. While the polygenic Otsuka Long-Evans Tokushima Fat rat (OLETF) also exhibits a prediabetic phase similar to the ZDSD rat, OLETF rats develop diabetes due to a lack of the cholecystokinin (CCK)-1 receptor, leading to hyperphagia and increased glucose production. However, these rats also have altered neuronal anatomy and melanocortin signaling, which does not occur in humans [40]. In the current study, rats progressed from a healthy to prediabetic phenotype by 16 weeks of age and developed diabetes by 24 weeks, with severe impairments in insulin production. This study supports the ZDSD model as a more relevant and translational model for the progression of diabetes. Similar to previous studies, we observed that blood glucose drastically increases, paralleled by increasing circulating insulin to attempt to compensate for the persistent hyperglycemia as the rats progress from a healthy to prediabetic phenotype. This is followed by a sharp decline in circulating insulin, representative of beta cell burnout as the rats progress into a diabetic state. Interestingly, these phenotypic changes are also paralleled by shifts in the gut microbiota.
T2D is associated with shifts in the relative abundance of specific bacterial genera and species [6,41]. However, most work examining the contribution of the gut microbiota to the development of T2D and vice versa is correlative, in part due to a lack of translational animal models that reflect T2D development in humans. Here, we demonstrate that shifts in both alpha and beta diversity, as well as specific bacterial genera, occur throughout the progression of T2D in ZDSD rats. We observed no significant changes in beta diversity from the healthy to prediabetic state, but following development of T2D, beta diversity was significantly shifted. Alpha diversity, which usually decreases with development of T2D, was increased in the prediabetic state. As prediabetes is a transitional state, the observed increase could be due to changes in metabolism or other host factors, driving changes in different bacterial species, which may warrant further investigation. We observed significant changes in specific bacterial genera both at the prediabetic and diabetic timepoints, indicating possible causative shifts driving the diabetic state or changes that might be secondary to the overt diabetic phenotype, respectively. In line with this, studies suggest that changes in the gut microbiota from HFD-feeding could drive the development of diabetes via increased metabolic endotoxemia, alterations in energy extraction, or changes in gut-derived metabolites, all of which could impact host physiological pathways that regulate glucose homeostasis [7,42,43]. Alternatively, hyperglycemia is known to impair gut barrier function, allowing for increased bacterial translocation and significantly shifts the gut microbiota, which is restored following a return to normoglycemia via insulin [44]. Therefore, whether these shifts in the diabetic state serve as a marker for disease progression via hyperglycemia or in a more causal role for disease development is unclear and warrants further investigation. In examining specific changes in bacterial genera and species over the progression from healthy to prediabetic and overt diabetic in the ZDSD rats, we may be able to better discriminate bacteria that serve as markers for the progression of T2D or that may play a causal role in driving the disease. These longitudinal shifts are likely not due to changes in diet or aging, as the HFD provided for 3 weeks was utilized to sync the development of diabetes between rats, which were then promptly returned to their normal chow diet. Although diet is known to shift the gut microbiota, these shifts are transient and are known to shift back to baseline after returning to a normal diet [45]. While aging is also known to alter the gut microbiota, significant shifts have not been observed in SD rats during the time course of our study [46]. Thus, we do not believe these shifts are merely an artifact of aging or a transient shift in diet but are a representation of the metabolic shifts of the ZDSD rats. However, it should be noted that this is one disadvantage of the ZDSD rodent model as it lacks a proper control to thoroughly address this. Nonetheless, in the present study, we found significant shifts in Lactobacillus, Alistipes, and Ruminococcus between the healthy and prediabetic state, indicating that these bacteria may participate in a more causal role, as these shifts occur prior to significant physiological changes such as overt hyperglycemia and hyperinsulinemia. The significant reductions in Lactobacillus during the development of T2D in the ZDSD rats highlights a possible protective role for this genus in the disease. As commonly used probiotics, several species of Lactobacillus are known to improve glycemia in both rodents and humans [47,48,49]. Conversely, the significant increases in the Alistipes and Ruminococcus genera indicate their presence may act to drive the development of T2D. While Alistipes relative abundance is increased in prediabetic and diabetic patients and in hyperglycemic mice, a causal role for increased Alistipes in T2D has not been established [50,51,52]. Ruminococcus is also increased in prediabetic and diabetic patients, and although its role in diabetes development is unclear, increases in Ruminococcus are associated with increased intestinal inflammation which could lead to gut barrier dysfunction and further metabolic consequences, potentially initiating disease development [53,54,55]. Conversely, the genera Blautia, Lachnospiraceae UCG-001, and Roseburia were shifted in only the diabetic state, indicating that host physiological changes may be influencing their relative abundance, highlighting their potential to serve as markers for T2D. Blautia is commonly increased in the microbiota of patients with T2D, and all Blautia strains can utilize glucose as a substrate to produce metabolites such as acetate, succinate, and lactate, providing a possible explanation for its bloom following diabetes development, when glucose is abundantly available [56,57,58]. Lachnospiraceae UCG-001 and Roseburia are also short chain fatty acid (SCFA) producers but are commonly reduced with T2D [54,57]. While increases in Lachnospiraceae UCG-001 are associated with improved weight loss in humans, no studies have examined their role in patients with diabetes [59]. Roseburia is a key producer of the SCFA, butyrate, and both Roseburia and butyrate can reduce intestinal inflammation and improve the gut barrier [54,60,61]. Thus, loss of Roseburia with T2D could further exacerbate the disease via increases in intestinal permeability and systemic inflammation. Overall, the changes in the bacterial genera observed over the course of the study reflect shifts previously observed in humans with prediabetes and T2D, supporting the ZDSD rat as a more translational model for T2D research from both a pathophysiological as well as microbial standpoint.
In further support of the ZDSD rat as a translational model for T2D, we observed significant shifts in fecal SCFA levels from the healthy to diabetic phenotype. Although shifts in fecal and circulating SCFA levels vary between studies, generally, increases in acetate and decreases in butyrate are associated with impairments in energy and glucose metabolism [22,62,63]. We observed a significant increase in fecal acetate in diabetic ZDSD rats, which was associated with increased fasting glucose and decreased fed and fasting insulin. This supports previous findings in rodents and humans, as circulating and fecal acetate levels have been shown to be increased in both rodents and patients with diabetes [62,64]. Although not fully understood, this is thought to be due to a reduction in acetate metabolism with T2D [65]. Furthermore, fecal acetate was positively correlated with several acetate producing bacteria—Blautia, Fusicatenibacter, and Phascolarctobacterium. Blautia was significantly increased only in diabetic ZDSD rodents, further highlighting its potential to serve as a marker for T2D. Additionally, increased acetate in the diabetic state could be a result of decreases in Lachnospiraceae and Roseburia, both of which can utilize acetate to produce butyrate [66]. While we observed no changes in fecal butyrate, fecal propionate was significantly increased in diabetic ZDSD rats and also associated with increased fasting glucose and decreased fed and fasting insulin. Increases in fecal propionate are associated with impairments in glycemia as well as increased T2D risk [63]. Additionally, fecal propionate has been found to be increased in patients with metabolic syndrome compared to healthy individuals [63,67,68]. However, as the fecal SCFA profile reflects the net result of SCFA production, uptake, and tissue utilization, we cannot determine whether the observed shifts are a direct result of microbial fermentation or due to the altered physiological state of the diabetic ZDSD rat, which remains to be explored. Regardless, the similarities between the SCFA profile of the ZDSD rat and humans with metabolic disorders further highlights the translational potential of this model in studying shifts in the microbiome and metabolome throughout the progression of T2D.
In order to examine the efficacy of using the ZDSD rat in the testing of potential therapeutic treatments for T2D, we supplemented their diet with 10% OFS in drinking water. While OFS treatment was unable to fully rescue the severely impaired glucose homeostasis in the overt diabetic ZDSD rodents, it did increase bodyweight and adiposity. This is contrary to findings in HFD-fed obese and insulin resistant rodents, where OFS is known to reduce food intake and bodyweight [22,69]. However, this discrepancy is likely due to the diabetic state of the rat; unlike SD rats that continue to gain weight when on a HF diet, body weight of the ZDSD rats declined during overt diabetes. To date, no studies have examined the effect of oligofructose treatment in an overt diabetic rodent model. We found that OFS treatment normalized bodyweight in the ZDSD rat, whereas untreated rats continued to lose weight. Insulin resistance combined with beta cell burnout prevents diabetic subjects from utilizing glucose, resulting in increased fat store utilization for energy. As such, we observed significant increases in adiposity in OFS-treated ZDSD rats, indicating that they may be better able to utilize glucose for energy. This increase in adiposity was paralleled by increased circulating leptin, which can improve insulin resistance and dysglycemia [70], which is possibly responsible for the observed improved glucose tolerance in the ZDSD rats after 15 weeks of OFS treatment. Although we only observed a trend in increased GLP-1 following OFS, samples were obtained during a fasted state, whereas GLP-1 is normally secreted following a meal. We did observe significant increases in Gcg mRNA in the LSI and colon of OFS-treated rats, which encodes for GLP-1, thus, we expect that, similar to previous studies, OFS supplementation increases postprandial GLP-1 levels, potentially improving glucose homeostasis. In line with this, we observed improvements in fed, but not fasted, glucose levels following OFS treatment, further supporting GLP-1 as a potential mediator of the improvements in glucose homeostasis. However, improvements in glucose homeostasis could also be due to improvements in insulin sensitivity, potentially via improvements in the gut barrier and metabolic endotoxemia. Shifts in the gut microbiota and increases in Bifidobacterium with OFS treatment has been shown to improve the gut barrier and decrease circulating LPS and metabolic endotoxemia [34,71]. We observed a significant increase in Bifidobacterium following treatment with OFS in the overt diabetic ZDSD model, which also exhibited improved glucose homeostasis. Bifidobacterium most commonly produce acetate and lactate and are commonly involved in cross-feeding with other beneficial bacteria such as the butyrate-producing Faecalibacterium prausnitzii and Roseburia [72,73]. Increases in these bacteria and butyrate could improve the gut barrier’s integrity, decreasing systemic inflammation to reduce insulin resistance and improve glycemia [74]. Although we examined cecal microbiota, while OFS treatment improved glucose homeostasis in diabetic ZDSD rats, it did not seem to impact many of the genera that were differentially altered in the prediabetic or diabetic state. Only Ruminococcus, which was increased in prediabetic and diabetic ZDSD fecal microbiota, was reduced following OFS treatment, further highlighting the potential significance of Ruminococcus in glucose homeostasis. Overall, the slight improvements in glucose homeostasis following OFS highlight the efficacy of the ZDSD model in testing potential treatments for T2D.
5. Conclusions
Our findings confirm the ZDSD model as a translational model for T2D and establish a role for the gut microbiota in the development and progression of the disease. The progression from healthy to prediabetic to diabetic states in the ZDSD rat is paralleled by shifts in specific bacterial genera that could serve as markers for T2D or indicate a causal role for the gut microbiota in the progression of the disease. These shifts are associated with alterations in fecal SCFA levels as well as metabolic parameters. Furthermore, treatment with OFS was able to improve glucose tolerance in the overt diabetic ZDSD rat, highlighting its potential for use in the evaluation of therapeutics targeting the gut microbiota.
Supplementary Materials
The following supporting information can be downloaded at: https://www.mdpi.com/article/10.3390/metabo13050660/s1, Figure S1: Body composition at 8, 16, and 24 weeks in the ZDSD rodent model. (A) Fat and lean mass of ZDSD rats. Data in all graphs represent the mean + SEM (n = 18); * p < 0.05, *** p < 0.001 vs. 8 weeks. ### p < 0.001 vs. 16 weeks. Figure S2: Differential expression analysis of taxonomic shifts in (A) Diabetic vs. Healthy and (B) Diabetic vs. Prediabetic fecal samples. Diabetic group is a baseline. Taxa showed as “increased” on the graph are decreased in Diabetic group compared to Healthy (A) or Prediabetic (B) groups. Figure S3: Time course analysis of fecal short chain fatty acids (SCFAs) throughout the development of diabetes in ZDSD rodents. (A) Isobutyric acid, (B) isovaleric acid, (C) valeric acid, and (D) hexanoic acid levels in the feces of 5 hour fasted ZDSD rats. Data in all graphs represent the mean + SEM (n = 18); * p < 0.05, *** p < 0.001, as assessed by Kruskal–Wallis one-way ANOVA. Figure S4: (A) Fat and lean mass of OFS-treated or untreated ZDSD rats. (B)Differential expression analysis of taxonomic shifts in Overt Diabetic vs. OFS-treated Overt Diabetic cecal samples, where untreated Overt Diabetic was used as a baseline. Data in all graphs represent the mean + SEM (n = 18); *** p < 0.001 vs. control.
Author Contributions
S.N.W. conducted experiments, performed data analysis, and wrote the manuscript. A.D., E.N.B. and M.L.F. assisted with experiments. D.L. and G.S. performed 16S rRNA gene sequencing and analysis. F.A.D. supervised the project, assisted with experiments, designed experiments, and edited the manuscript. All authors have read and agreed to the published version of the manuscript.
Funding
This research was funded by the Arizona Biomedical Research Commission New Investigator Award (ADHS18-198857), National Institute of Food and Agriculture (67017-29252), and NIDDK (R01ES033993).
Institutional Review Board Statement
All rats were housed and maintained in accordance with the University of Arizona Institutional Animal Care and Use Committee (IACUC). All protocols were approved by the IACUC.
Informed Consent Statement
Not applicable.
Data Availability Statement
All data generated or analyzed during this study are included in this published article and its supplementary information files.
Acknowledgments
We would like to thank Charles River Laboratories for generously providing the ZDSD rats, Beneo for providing the oligofructose and Research Diets for help in the diet formulation.
Conflicts of Interest
The authors declare no conflict of interest.
References
- Hatting, M.; Tavares, C.D.J.; Sharabi, K.; Rines, A.K.; Puigserver, P. Insulin regulation of gluconeogenesis. Ann. N. Y. Acad. Sci. 2018, 1411, 21–35. [Google Scholar] [CrossRef] [PubMed]
- Franks, P.W.; McCarthy, M.I. Exposing the exposures responsible for type 2 diabetes and obesity. Science 2016, 354, 69–73. [Google Scholar] [CrossRef] [PubMed]
- Khan, M.T.; Nieuwdorp, M.; Backhed, F. Microbial modulation of insulin sensitivity. Cell. Metab. 2014, 20, 753–760. [Google Scholar] [CrossRef] [PubMed]
- Ussar, S.; Griffin, N.W.; Bezy, O.; Fujisaka, S.; Vienberg, S.; Softic, S.; Deng, L.; Bry, L.; Gordon, J.I.; Kahn, C.R. Interactions between Gut Microbiota, Host Genetics and Diet Modulate the Predisposition to Obesity and Metabolic Syndrome. Cell Metab. 2015, 22, 516–530. [Google Scholar] [CrossRef]
- Bauer, P.V.; Duca, F.A. Targeting the gastrointestinal tract to treat type 2 diabetes. J. Endocrinol. 2016, 230, R95–R113. [Google Scholar] [CrossRef]
- Qin, J.; Li, Y.; Cai, Z.; Li, S.; Zhu, J.; Zhang, F.; Liang, S.; Zhang, W.; Guan, Y.; Shen, D.; et al. A metagenome-wide association study of gut microbiota in type 2 diabetes. Nature 2012, 490, 55–60. [Google Scholar] [CrossRef] [PubMed]
- Turnbaugh, P.J.; Ley, R.E.; Mahowald, M.A.; Magrini, V.; Mardis, E.R.; Gordon, J.I. An obesity-associated gut microbiome with increased capacity for energy harvest. Nature 2006, 444, 1027–1031. [Google Scholar] [CrossRef]
- Stott, N.L.; Marino, J.S. High Fat Rodent Models of Type 2 Diabetes: From Rodent to Human. Nutrients 2020, 12, 3650. [Google Scholar] [CrossRef]
- Peterson, R.G.; Jackson, C.V.; Zimmerman, K.; de Winter, W.; Huebert, N.; Hansen, M.K. Characterization of the ZDSD Rat: A Translational Model for the Study of Metabolic Syndrome and Type 2 Diabetes. J. Diabetes Res. 2015, 2015, 487816. [Google Scholar] [CrossRef]
- Wang, A.N.; Carlos, J.; Fraser, G.M.; McGuire, J.J. Zucker Diabetic-Sprague Dawley (ZDSD) rat: Type 2 diabetes translational research model. Exp. Physiol. 2022, 107, 265–282. [Google Scholar] [CrossRef]
- Han, L.; Bittner, S.; Dong, D.; Cortez, Y.; Bittner, A.; Chan, J.; Umar, M.; Shen, W.J.; Peterson, R.G.; Kraemer, F.B.; et al. Molecular changes in hepatic metabolism in ZDSD rats-A new polygenic rodent model of obesity, metabolic syndrome, and diabetes. Biochim. Biophys. Acta Mol. Basis Dis. 2020, 1866, 165688. [Google Scholar] [CrossRef] [PubMed]
- Cani, P.D.; Knauf, C.; Iglesias, M.A.; Drucker, D.J.; Delzenne, N.M.; Burcelin, R. Improvement of glucose tolerance and hepatic insulin sensitivity by oligofructose requires a functional glucagon-like peptide 1 receptor. Diabetes 2006, 55, 1484–1490. [Google Scholar] [CrossRef]
- Makki, K.; Deehan, E.C.; Walter, J.; Backhed, F. The Impact of Dietary Fiber on Gut Microbiota in Host Health and Disease. Cell. Host Microbe 2018, 23, 705–715. [Google Scholar] [CrossRef] [PubMed]
- Cani, P.D.; Lecourt, E.; Dewulf, E.M.; Sohet, F.M.; Pachikian, B.D.; Naslain, D.; De Backer, F.; Neyrinck, A.M.; Delzenne, N.M. Gut microbiota fermentation of prebiotics increases satietogenic and incretin gut peptide production with consequences for appetite sensation and glucose response after a meal. Am. J. Clin. Nutr. 2009, 90, 1236–1243. [Google Scholar] [CrossRef]
- Delzenne, N.M.; Neyrinck, A.M.; Backhed, F.; Cani, P.D. Targeting gut microbiota in obesity: Effects of prebiotics and probiotics. Nat. Rev. Endocrinol. 2011, 7, 639–646. [Google Scholar] [CrossRef]
- Duca, F.A.; Waise, T.M.Z.; Peppler, W.T.; Lam, T.K.T. The metabolic impact of small intestinal nutrient sensing. Nat. Commun. 2021, 12, 903. [Google Scholar] [CrossRef]
- Li, K.; Zhang, L.; Xue, J.; Yang, X.; Dong, X.; Sha, L.; Lei, H.; Zhang, X.; Zhu, L.; Wang, Z.; et al. Dietary inulin alleviates diverse stages of type 2 diabetes mellitus via anti-inflammation and modulating gut microbiota in db/db mice. Food Funct. 2019, 10, 1915–1927. [Google Scholar] [CrossRef] [PubMed]
- Cani, P.D.; Daubioul, C.A.; Reusens, B.; Remacle, C.; Catillon, G.; Delzenne, N.M. Involvement of endogenous glucagon-like peptide-1(7-36) amide on glycaemia-lowering effect of oligofructose in streptozotocin-treated rats. J. Endocrinol. 2005, 185, 457–465. [Google Scholar] [CrossRef]
- de Cossio, L.F.; Fourrier, C.; Sauvant, J.; Everard, A.; Capuron, L.; Cani, P.D.; Laye, S.; Castanon, N. Impact of prebiotics on metabolic and behavioral alterations in a mouse model of metabolic syndrome. Brain Behav. Immun. 2017, 64, 33–49. [Google Scholar] [CrossRef]
- Detman, A.; Laubitz, D.; Chojnacka, A.; Wiktorowska-Sowa, E.; Piotrowski, J.; Salamon, A.; Kazmierczak, W.; Blaszczyk, M.K.; Barberan, A.; Chen, Y.; et al. Dynamics and Complexity of Dark Fermentation Microbial Communities Producing Hydrogen From Sugar Beet Molasses in Continuously Operating Packed Bed Reactors. Front. Microbiol. 2020, 11, 612344. [Google Scholar] [CrossRef]
- Meyer, R.K.; Bime, M.A.; Duca, F.A. Small intestinal metabolomics analysis reveals differentially regulated metabolite profiles in obese rats and with prebiotic supplementation. Metabolomics 2022, 18, 60. [Google Scholar] [CrossRef] [PubMed]
- Meyer, R.K.; Lane, A.I.; Weninger, S.N.; Martinez, T.M.; Kangath, A.; Laubitz, D.; Duca, F.A. Oligofructose restores postprandial short-chain fatty acid levels during high-fat feeding. Obesity 2022, 30, 1442–1452. [Google Scholar] [CrossRef]
- Caporaso, J.G.; Lauber, C.L.; Walters, W.A.; Berg-Lyons, D.; Huntley, J.; Fierer, N.; Owens, S.M.; Betley, J.; Fraser, L.; Bauer, M.; et al. Ultra-high-throughput microbial community analysis on the Illumina HiSeq and MiSeq platforms. ISME J. 2012, 6, 1621–1624. [Google Scholar] [CrossRef]
- Hernesniemi, A. East Bothnian treatment modalities of spinal manipulation and limb correction. Duodecim 1989, 105, 758–763. [Google Scholar] [PubMed]
- Quast, C.; Pruesse, E.; Yilmaz, P.; Gerken, J.; Schweer, T.; Yarza, P.; Peplies, J.; Glockner, F.O. The SILVA ribosomal RNA gene database project: Improved data processing and web-based tools. Nucleic Acids Res. 2013, 41, D590–D596. [Google Scholar] [CrossRef]
- Oksanen, J.; Blanchet, F.G.; Kindt, R.; Legendre, P.; Minchin, P.; O’Hara, B.; Simpson, G.; Solymos, P.; Stevens, H.; Wagner, H. Vegan: Community Ecology Package, Version 2.2-1. 2015. Available online: https://cran.r-project.org/web/packages/vegan/ (accessed on 21 May 2022).
- R Core Team. R: A Language and Environment for Statistical Computing, Version 4.0.1; R Foundation for Statistical Computing: Vienna, Austria, 2020; Available online: www.r-project.com (accessed on 25 April 2021).
- Wei, T.; Simko, V.; Levy, M.; Xie, Y.; Jin, Y.; Zemla, J. corrplot: Visualization of a Correlation Matrix. R Package, Version 0.73. 2013. Available online: https://cran.r-project.org/web/packages/corrplot/ (accessed on 28 November 2021).
- Zhao, G.; Nyman, M.; Jonsson, J.A. Rapid determination of short-chain fatty acids in colonic contents and faeces of humans and rats by acidified water-extraction and direct-injection gas chromatography. Biomed. Chromatogr. 2006, 20, 674–682. [Google Scholar] [CrossRef]
- Choy, S.; de Winter, W.; Karlsson, M.O.; Kjellsson, M.C. Modeling the Disease Progression from Healthy to Overt Diabetes in ZDSD Rats. AAPS J. 2016, 18, 1203–1212. [Google Scholar] [CrossRef]
- Vilsboll, T.; Krarup, T.; Deacon, C.F.; Madsbad, S.; Holst, J.J. Reduced postprandial concentrations of intact biologically active glucagon-like peptide 1 in type 2 diabetic patients. Diabetes 2001, 50, 609–613. [Google Scholar] [CrossRef]
- Stanley, D.; Geier, M.S.; Chen, H.; Hughes, R.J.; Moore, R.J. Comparison of fecal and cecal microbiotas reveals qualitative similarities but quantitative differences. BMC Microbiol. 2015, 15, 51. [Google Scholar] [CrossRef] [PubMed]
- Bomhof, M.R.; Saha, D.C.; Reid, D.T.; Paul, H.A.; Reimer, R.A. Combined effects of oligofructose and Bifidobacterium animalis on gut microbiota and glycemia in obese rats. Obesity 2014, 22, 763–771. [Google Scholar] [CrossRef]
- Cani, P.D.; Neyrinck, A.M.; Fava, F.; Knauf, C.; Burcelin, R.G.; Tuohy, K.M.; Gibson, G.R.; Delzenne, N.M. Selective increases of bifidobacteria in gut microflora improve high-fat-diet-induced diabetes in mice through a mechanism associated with endotoxaemia. Diabetologia 2007, 50, 2374–2383. [Google Scholar] [CrossRef]
- Dewulf, E.M.; Cani, P.D.; Claus, S.P.; Fuentes, S.; Puylaert, P.G.; Neyrinck, A.M.; Bindels, L.B.; de Vos, W.M.; Gibson, G.R.; Thissen, J.P.; et al. Insight into the prebiotic concept: Lessons from an exploratory, double blind intervention study with inulin-type fructans in obese women. Gut 2013, 62, 1112–1121. [Google Scholar] [CrossRef] [PubMed]
- King, A.J. The use of animal models in diabetes research. Br. J. Pharmacol. 2012, 166, 877–894. [Google Scholar] [CrossRef] [PubMed]
- Winzell, M.S.; Ahren, B. The high-fat diet-fed mouse: A model for studying mechanisms and treatment of impaired glucose tolerance and type 2 diabetes. Diabetes 2004, 53 (Suppl. S3), S215–S219. [Google Scholar] [CrossRef]
- Pascoe, W.S.; Storlien, L.H. Inducement by fat feeding of basal hyperglycemia in rats with abnormal beta-cell function. Model for study of etiology and pathogenesis of NIDDM. Diabetes 1990, 39, 226–233. [Google Scholar] [CrossRef] [PubMed]
- Phillips, M.S.; Liu, Q.; Hammond, H.A.; Dugan, V.; Hey, P.J.; Caskey, C.J.; Hess, J.F. Leptin receptor missense mutation in the fatty Zucker rat. Nat. Genet. 1996, 13, 18–19. [Google Scholar] [CrossRef]
- Moran, T.H.; Bi, S. Hyperphagia and obesity in OLETF rats lacking CCK-1 receptors. Philos. Trans. R. Soc. Lond. B Biol. Sci. 2006, 361, 1211–1218. [Google Scholar] [CrossRef]
- Larsen, N.; Vogensen, F.K.; van den Berg, F.W.; Nielsen, D.S.; Andreasen, A.S.; Pedersen, B.K.; Al-Soud, W.A.; Sorensen, S.J.; Hansen, L.H.; Jakobsen, M. Gut microbiota in human adults with type 2 diabetes differs from non-diabetic adults. PLoS ONE 2010, 5, e9085. [Google Scholar] [CrossRef]
- Canfora, E.E.; Meex, R.C.R.; Venema, K.; Blaak, E.E. Gut microbial metabolites in obesity, NAFLD and T2DM. Nat. Rev. Endocrinol. 2019, 15, 261–273. [Google Scholar] [CrossRef]
- Cani, P.D.; Bibiloni, R.; Knauf, C.; Waget, A.; Neyrinck, A.M.; Delzenne, N.M.; Burcelin, R. Changes in gut microbiota control metabolic endotoxemia-induced inflammation in high-fat diet-induced obesity and diabetes in mice. Diabetes 2008, 57, 1470–1481. [Google Scholar] [CrossRef]
- Thaiss, C.A.; Levy, M.; Grosheva, I.; Zheng, D.; Soffer, E.; Blacher, E.; Braverman, S.; Tengeler, A.C.; Barak, O.; Elazar, M.; et al. Hyperglycemia drives intestinal barrier dysfunction and risk for enteric infection. Science 2018, 359, 1376–1383. [Google Scholar] [CrossRef]
- David, L.A.; Maurice, C.F.; Carmody, R.N.; Gootenberg, D.B.; Button, J.E.; Wolfe, B.E.; Ling, A.V.; Devlin, A.S.; Varma, Y.; Fischbach, M.A.; et al. Diet rapidly and reproducibly alters the human gut microbiome. Nature 2014, 505, 559–563. [Google Scholar] [CrossRef]
- Flemer, B.; Gaci, N.; Borrel, G.; Sanderson, I.R.; Chaudhary, P.P.; Tottey, W.; O’Toole, P.W.; Brugere, J.F. Fecal microbiota variation across the lifespan of the healthy laboratory rat. Gut Microbes 2017, 8, 428–439. [Google Scholar] [CrossRef]
- Oh, M.R.; Jang, H.Y.; Lee, S.Y.; Jung, S.J.; Chae, S.W.; Lee, S.O.; Park, B.H. Lactobacillus plantarum HAC01 Supplementation Improves Glycemic Control in Prediabetic Subjects: A Randomized, Double-Blind, Placebo-Controlled Trial. Nutrients 2021, 13, 2337. [Google Scholar] [CrossRef]
- Toejing, P.; Khampithum, N.; Sirilun, S.; Chaiyasut, C.; Lailerd, N. Influence of Lactobacillus paracasei HII01 Supplementation on Glycemia and Inflammatory Biomarkers in Type 2 Diabetes: A Randomized Clinical Trial. Foods 2021, 10, 1455. [Google Scholar] [CrossRef]
- Yan, F.; Li, N.; Shi, J.; Li, H.; Yue, Y.; Jiao, W.; Wang, N.; Song, Y.; Huo, G.; Li, B. Lactobacillus acidophilus alleviates type 2 diabetes by regulating hepatic glucose, lipid metabolism and gut microbiota in mice. Food Funct. 2019, 10, 5804–5815. [Google Scholar] [CrossRef] [PubMed]
- Cao, M.; Peng, Y.; Lu, Y.; Zou, Z.; Chen, J.; Bottino, R.; Knoll, M.; Zhang, H.; Lin, S.; Pu, Z.; et al. Controls of Hyperglycemia Improves Dysregulated Microbiota in Diabetic Mice. Transplantation 2021, 105, 1980–1988. [Google Scholar] [CrossRef] [PubMed]
- Li, S.C.; Xiao, Y.; Wu, R.T.; Xie, D.; Zhao, H.H.; Shen, G.Y.; Wu, E.Q. Comparative analysis of type 2 diabetes-associated gut microbiota between Han and Mongolian people. J. Microbiol. 2021, 59, 693–701. [Google Scholar] [CrossRef]
- Pinna, N.K.; Anjana, R.M.; Saxena, S.; Dutta, A.; Gnanaprakash, V.; Rameshkumar, G.; Aswath, S.; Raghavan, S.; Rani, C.S.S.; Radha, V.; et al. Trans-ethnic gut microbial signatures of prediabetic subjects from India and Denmark. Genome Med. 2021, 13, 36. [Google Scholar] [CrossRef] [PubMed]
- Allin, K.H.; Tremaroli, V.; Caesar, R.; Jensen, B.A.H.; Damgaard, M.T.F.; Bahl, M.I.; Licht, T.R.; Hansen, T.H.; Nielsen, T.; Dantoft, T.M.; et al. Aberrant intestinal microbiota in individuals with prediabetes. Diabetologia 2018, 61, 810–820. [Google Scholar] [CrossRef]
- Gurung, M.; Li, Z.; You, H.; Rodrigues, R.; Jump, D.B.; Morgun, A.; Shulzhenko, N. Role of gut microbiota in type 2 diabetes pathophysiology. EBioMedicine 2020, 51, 102590. [Google Scholar] [CrossRef]
- Meng, C.; Feng, S.; Hao, Z.; Dong, C.; Liu, H. Changes in gut microbiota composition with age and correlations with gut inflammation in rats. PLoS ONE 2022, 17, e0265430. [Google Scholar] [CrossRef]
- Liu, X.; Mao, B.; Gu, J.; Wu, J.; Cui, S.; Wang, G.; Zhao, J.; Zhang, H.; Chen, W. Blautia-a new functional genus with potential probiotic properties? Gut Microbes 2021, 13, 1875796. [Google Scholar] [CrossRef]
- Wei, X.; Tao, J.; Xiao, S.; Jiang, S.; Shang, E.; Zhu, Z.; Qian, D.; Duan, J. Xiexin Tang improves the symptom of type 2 diabetic rats by modulation of the gut microbiota. Sci. Rep. 2018, 8, 3685. [Google Scholar] [CrossRef]
- Zhang, X.; Shen, D.; Fang, Z.; Jie, Z.; Qiu, X.; Zhang, C.; Chen, Y.; Ji, L. Human gut microbiota changes reveal the progression of glucose intolerance. PLoS ONE 2013, 8, e71108. [Google Scholar] [CrossRef]
- Atzeni, A.; Galie, S.; Muralidharan, J.; Babio, N.; Tinahones, F.J.; Vioque, J.; Corella, D.; Castaner, O.; Vidal, J.; Moreno-Indias, I.; et al. Gut Microbiota Profile and Changes in Body Weight in Elderly Subjects with Overweight/Obesity and Metabolic Syndrome. Microorganisms 2021, 9, 346. [Google Scholar] [CrossRef]
- Coppola, S.; Avagliano, C.; Calignano, A.; Berni Canani, R. The Protective Role of Butyrate against Obesity and Obesity-Related Diseases. Molecules 2021, 26, 682. [Google Scholar] [CrossRef]
- Duncan, S.H.; Hold, G.L.; Barcenilla, A.; Stewart, C.S.; Flint, H.J. Roseburia intestinalis sp. nov., a novel saccharolytic, butyrate-producing bacterium from human faeces. Int. J. Syst. Evol. Microbiol. 2002, 52, 1615–1620. [Google Scholar] [CrossRef]
- Perry, R.J.; Peng, L.; Barry, N.A.; Cline, G.W.; Zhang, D.; Cardone, R.L.; Petersen, K.F.; Kibbey, R.G.; Goodman, A.L.; Shulman, G.I. Acetate mediates a microbiome-brain-beta-cell axis to promote metabolic syndrome. Nature 2016, 534, 213–217. [Google Scholar] [CrossRef]
- Sanna, S.; van Zuydam, N.R.; Mahajan, A.; Kurilshikov, A.; Vich Vila, A.; Vosa, U.; Mujagic, Z.; Masclee, A.A.M.; Jonkers, D.; Oosting, M.; et al. Causal relationships among the gut microbiome, short-chain fatty acids and metabolic diseases. Nat. Genet. 2019, 51, 600–605. [Google Scholar] [CrossRef]
- Todesco, T.; Zamboni, M.; Armellini, F.; Bissoli, L.; Turcato, E.; Piemonte, G.; Rao, A.V.; Jenkins, D.J.; Bosello, O. Plasma acetate levels in a group of obese diabetic, obese normoglycemic, and control subjects and their relationships with other blood parameters. Am. J. Gastroenterol. 1993, 88, 751–755. [Google Scholar] [PubMed]
- Akanji, A.O.; Hockaday, T.D. Acetate tolerance and the kinetics of acetate utilization in diabetic and nondiabetic subjects. Am. J. Clin. Nutr. 1990, 51, 112–118. [Google Scholar] [CrossRef]
- Louis, P.; Flint, H.J. Formation of propionate and butyrate by the human colonic microbiota. Environ. Microbiol. 2017, 19, 29–41. [Google Scholar] [CrossRef]
- Igudesman, D.; Crandell, J.; Corbin, K.D.; Muntis, F.; Zaharieva, D.P.; Casu, A.; Thomas, J.M.; Bulik, C.M.; Carroll, I.M.; Pence, B.W.; et al. The Intestinal Microbiota and Short-Chain Fatty Acids in Association with Advanced Metrics of Glycemia and Adiposity among Young Adults with Type 1 Diabetes and Overweight or Obesity. Curr. Dev. Nutr. 2022, 6, nzac107. [Google Scholar] [CrossRef] [PubMed]
- Ratajczak, W.; Mizerski, A.; Ryl, A.; Slojewski, M.; Sipak, O.; Piasecka, M.; Laszczynska, M. Alterations in fecal short chain fatty acids (SCFAs) and branched short-chain fatty acids (BCFAs) in men with benign prostatic hyperplasia (BPH) and metabolic syndrome (MetS). Aging 2021, 13, 10934–10954. [Google Scholar] [CrossRef]
- Cani, P.D.; Neyrinck, A.M.; Maton, N.; Delzenne, N.M. Oligofructose promotes satiety in rats fed a high-fat diet: Involvement of glucagon-like Peptide-1. Obes. Res. 2005, 13, 1000–1007. [Google Scholar] [CrossRef]
- Shimomura, I.; Hammer, R.E.; Ikemoto, S.; Brown, M.S.; Goldstein, J.L. Leptin reverses insulin resistance and diabetes mellitus in mice with congenital lipodystrophy. Nature 1999, 401, 73–76. [Google Scholar] [CrossRef]
- Cani, P.D.; Possemiers, S.; Van de Wiele, T.; Guiot, Y.; Everard, A.; Rottier, O.; Geurts, L.; Naslain, D.; Neyrinck, A.; Lambert, D.M.; et al. Changes in gut microbiota control inflammation in obese mice through a mechanism involving GLP-2-driven improvement of gut permeability. Gut 2009, 58, 1091–1103. [Google Scholar] [CrossRef]
- Belenguer, A.; Duncan, S.H.; Calder, A.G.; Holtrop, G.; Louis, P.; Lobley, G.E.; Flint, H.J. Two routes of metabolic cross-feeding between Bifidobacterium adolescentis and butyrate-producing anaerobes from the human gut. Appl. Environ. Microbiol. 2006, 72, 3593–3599. [Google Scholar] [CrossRef]
- Rios-Covian, D.; Gueimonde, M.; Duncan, S.H.; Flint, H.J.; de los Reyes-Gavilan, C.G. Enhanced butyrate formation by cross-feeding between Faecalibacterium prausnitzii and Bifidobacterium adolescentis. FEMS Microbiol. Lett. 2015, 362, fnv176. [Google Scholar] [CrossRef]
- Hsieh, C.Y.; Osaka, T.; Moriyama, E.; Date, Y.; Kikuchi, J.; Tsuneda, S. Strengthening of the intestinal epithelial tight junction by Bifidobacterium bifidum. Physiol. Rep. 2015, 3, e12327. [Google Scholar] [CrossRef]


Disclaimer/Publisher’s Note: The statements, opinions and data contained in all publications are solely those of the individual author(s) and contributor(s) and not of MDPI and/or the editor(s). MDPI and/or the editor(s) disclaim responsibility for any injury to people or property resulting from any ideas, methods, instructions or products referred to in the content. |
© 2023 by the authors. Licensee MDPI, Basel, Switzerland. This article is an open access article distributed under the terms and conditions of the Creative Commons Attribution (CC BY) license (https://creativecommons.org/licenses/by/4.0/).