

The Dynamic Change in Aromatic Compounds and Their Relationship with CsAAAT Genes during the Post-Harvest Process of Oolong Tea

Abstract
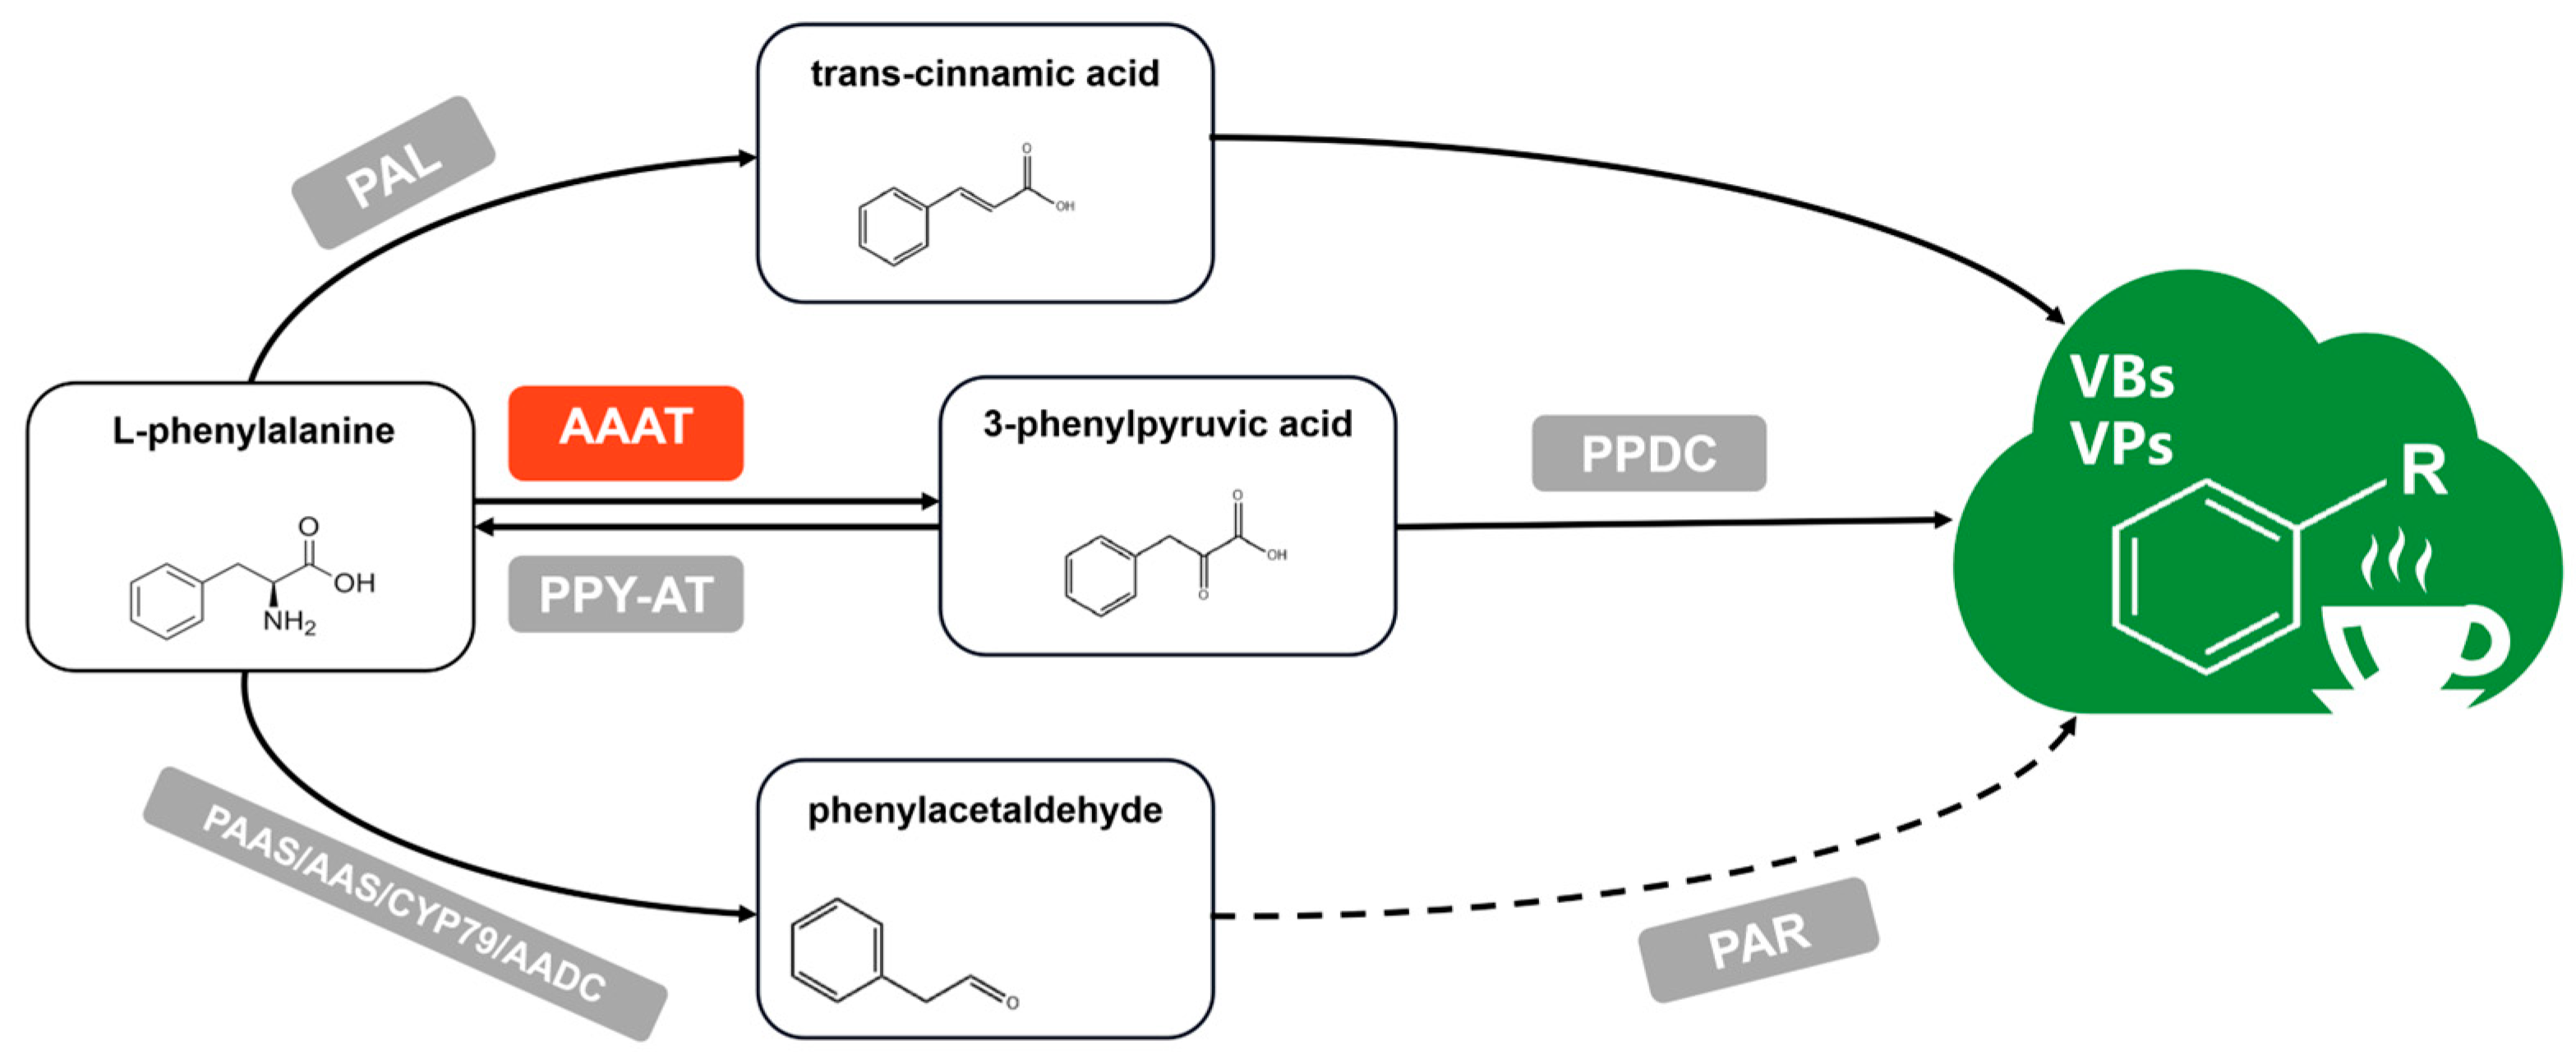
:1. Introduction
2. Materials and Methods
2.1. Plant Materials and Treatments
2.2. Extraction and Detection of Volatile Compounds
2.3. Genome and Transcriptome Data Sources and Screening
2.4. Construction of Phylogenetic Evolutionary Tree
2.5. Extraction of Total RNA and Synthesis of cDNA
2.6. qRT-PCR Conditions
2.7. Data Analysis
3. Results
3.1. Analysis of the Dynamic Changes in VBs/VPs during the Post-Harvest Process of Oolong Tea
3.2. Evaluation of Total RNA Quality
3.3. Screening and Analysis of CsAAAT Genes during the Post-Harvest Process of Oolong Tea
3.4. Correlation Analysis between Dynamic Changes in VB/VP Content and CsAAAT Gene Expression during the Post-Harvest Process of Oolong Tea
3.5. Detection and Analysis of VBs/VPs in Raw Oolong Tea
4. Discussion
4.1. Dynamic Changes in VBs/VPs in Oolong Tea Products
4.2. Expression Analysis and Regulation of Key CsAAAT Genes during the Post-Harvest Process of Oolong Tea
5. Conclusions
- (1)
- A total of 13 types of VBs/VPs were measured in the samples, including 9 types of VPs and 4 types of VBs, and the mechanical force of turnover was the key exogenous stress inducing VBs/VPs (excluding methyl phenylacetate).
- (2)
- The OAVs of 2-hydroxy benzoic acid methyl ester and phenylethyl alcohol were greater than 1.0; therefore, these specific VB/VP components could be considered key components contributing to the aromatic quality of oolong tea.
- (3)
- Six key CsAAAT genes closely related to VB/VP formation were screened, namely, CsAAAT1-1, CsAAAT1-3, CsAAAT1-9, CsAAAT2-1, CsAAAT2-3, and CsAAAT2-6.
- (4)
- The upregulation of the expression level of CsAAAT2-type genes may respond to light stress during solar-withering, in addition to the induction of the mechanical force of turnover.
Supplementary Materials
Author Contributions
Funding
Institutional Review Board Statement
Informed Consent Statement
Data Availability Statement
Conflicts of Interest
References
- Wang, Z.H.; Gan, S.; Sun, W.J.; Chen, Z.D. Widely Targeted Metabolomics Analysis Reveals the Differences of Nonvolatile Compounds in Oolong Tea in Different Production Areas. Foods 2022, 11, 1057. [Google Scholar] [CrossRef] [PubMed]
- Zhang, S.; Duangjan, C.; Tencomnao, T.; Liu, J.; Lin, J.; Wink, M. Neuroprotective effects of oolong tea extracts against glutamate-induced toxicity in cultured neuronal cells and β-amyloid-induced toxicity in Caenorhabditis elegans. Food Funct. 2020, 11, 8179–8192. [Google Scholar] [CrossRef] [PubMed]
- Wang, M.Q.; Ma, W.J.; Shi, J.; Zhu, Y.; Lin, Z.; Lv, H.P. Characterization of the key aroma compounds in Longjing tea using stir bar sorptive extraction (SBSE) combined with gas chromatography-mass spectrometry (GC-MS), gas chromatography-olfactometry (GC-O), odor activity value (OAV), and aroma recombination. Food Res. Int. 2020, 130, 108908. [Google Scholar] [CrossRef] [PubMed]
- Zheng, Y.C.; Hu, Q.C.; Wu, Z.J.; Bi, W.J.; Chen, B.; Hao, Z.L.; Wu, L.Y.; Ye, N.X.; Sun, Y. Volatile metabolomics and coexpression network analyses provide insight into the formation of the characteristic cultivar aroma of oolong tea (Camellia sinensis). LWT 2022, 164, 113666. [Google Scholar] [CrossRef]
- Zhang, C.; Zhou, C.Z.; Xu, K.; Tian, C.Y.; Zhang, M.C.; Lu, L.; Zhu, C.; Lai, Z.X.; Guo, Y.Q. A Comprehensive Investigation of Macro-Composition and Volatile Compounds in Spring-Picked and Autumn-Picked White Tea. Foods 2022, 11, 3628. [Google Scholar] [CrossRef]
- Zeng, L.T.; Zhou, X.C.; Su, X.G.; Yang, Z.Y. Chinese oolong tea: An aromatic beverage produced under multiple stresses. Trends Food Sci. Tech. 2020, 106, 242–253. [Google Scholar] [CrossRef]
- Zhou, Z.W.; Wu, Q.Y.; Yao, Z.L.; Deng, H.L.; Liu, B.B.; Yue, C.; Deng, T.T.; Lai, Z.X.; Sun, Y. Dynamics of ADH and related genes responsible for the transformation of C6-aldehydes to C6-alcohols during the postharvest process of oolong tea. Food Sci. Nutr. 2020, 8, 104–113. [Google Scholar] [CrossRef] [Green Version]
- Zhou, Z.W.; Deng, H.L.; Wu, Q.Y.; Liu, B.B.; Yue, C.; Deng, T.T.; Lai, Z.X.; Sun, Y. Validation of reference genes for gene expression studies in post-harvest leaves of tea plant (Camellia sinensis). PeerJ 2019, 7, e6385. [Google Scholar] [CrossRef] [PubMed] [Green Version]
- Zeng, L.T.; Watanabe, N.; Yang, Z.Y. Understanding the Biosyntheses and Stress Response Mechanisms of Aroma Compounds in Tea (Camellia sinensis) to Safely and Effectively Improve Tea Aroma. Crit. Rev. Food Sci. 2019, 59, 2321–2334. [Google Scholar] [CrossRef]
- Zhou, Z.W.; Wu, Q.Y.; Ni, Z.X.; Hu, Q.C.; Yang, Y.; Zheng, Y.C.; Bi, W.J.; Deng, H.L.; Liu, Z.Z.; Ye, N.X.; et al. Metabolic Flow of C6 Volatile Compounds from LOX-HPL Pathway Based on Airflow during the Post-harvest Process of Oolong Tea. Front. Plant Sci. 2021, 12, 738445. [Google Scholar] [CrossRef]
- Fu, X.M.; Chen, Y.Y.; Mei, X.; Katsuno, T.; Kobayashi, E.; Dong, F.; Watanabe, N.; Yang, Z.Y. Regulation of Formation of Volatile Compounds of Tea (Camellia sinensis) Leaves by Single Light Wavelength. Sci. Rep. 2017, 5, 16858. [Google Scholar] [CrossRef] [PubMed] [Green Version]
- Yang, Z.Y.; Baldermann, S.; Watanabe, N. Recent Studies of the Volatile Compounds in Tea. Food Res. Int. 2013, 53, 585–599. [Google Scholar] [CrossRef]
- Khakdan, F.; Alizadeh, H.; Ranjbar, M. Molecular Cloning, Functional Characterization and Expression of a Drought Inducible Phenylalanine Ammonia-Lyase Gene (ObPAL) from Ocimum basilicum L. Plant Physiol. Bioch. 2018, 130, 464–472. [Google Scholar] [CrossRef] [PubMed]
- Günther, J.; Schmidt, A.; Gershenzon, J.; Köllner, T.G. Phenylacetaldehyde Synthase 2 Does Not Contribute to the Constitutive Formation of 2-phenylethyl-β-D-glucopyranoside in Poplar. Plant Signal. Behav. 2019, 14, 1668233. [Google Scholar] [CrossRef] [PubMed]
- Gonda, I.; Bar, E.; Portnoy, V.; Lev, S.; Burger, J.; Schaffer, A.A.; Tadmor, Y.; Gepstein, S.; Giovannoni, J.J.; Katzir, N.; et al. Branched-Chain and Aromatic Amino Acid Catabolism into Aroma Volatiles in Cucumis Melo L. Fruit. J. Exp. Bot. 2010, 61, 1111–1123. [Google Scholar] [CrossRef] [Green Version]
- Dong, F.; Yang, Z.Y.; Baldermann, S.; Kajitani, Y.; Ota, S.; Kasuga, H.; Imazeki, Y.; Ohnishi, T.; Watanabe, N. Characterization of L-Phenylalanine Metabolism to Acetophenone and L-Phenylethanol in the Flowers of Camellia sinensis Using Stable Isotope Labeling. J. Plant Physiol. 2011, 169, 217–225. [Google Scholar] [CrossRef] [PubMed] [Green Version]
- Hiroshi, H.; Toshiyuki, O.; Haruka, I.; Kensuke, T.; Miwa, S.; Masakazu, H.; Naoharu, W. Functional Characterization of Aromatic Amino Acid Aminotransferase Involved in 2-phenylethanol Biosynthesis in Isolated Rose Petal Protoplasts. J. Plant Physiol. 2012, 169, 444–451. [Google Scholar] [CrossRef] [Green Version]
- Wang, X.Q.; Zeng, L.T.; Liao, Y.Y.; Zhou, Y.; Xu, X.L.; Dong, F.; Yang, Z.Y. An Alternative Pathway for the Formation of Aromatic Aroma Compounds Derived from L-Phenylalanine Via Phenylpyruvic Acid in Tea (Camellia sinensis (L.) O. Kuntze) leaves. Food Chem. 2019, 270, 17–24. [Google Scholar] [CrossRef]
- Zhu, J.C.; Chen, F.; Wang, L.Y.; Niu, Y.W.; Yu, D.; Shu, C.; Chen, H.X.; Wang, H.L.; Xiao, Z.B. Comparison of Aroma-Active Volatiles in Oolong Tea Infusions Using GC-Olfactometry, GC-FPD, and GC-MS. J. Agric. Food Chem. 2015, 63, 7499–7510. [Google Scholar] [CrossRef]
- Shi, J.; Xie, D.C.; Qi, D.D.; Peng, Q.H.; Chen, Z.M.; Schreiner, M.; Lin, Z.; Baldermann, S. Methyl Jasmonate-Induced Changes of Flavor Profiles During the Processing of Green, Oolong, and Black Tea. Front. Plant Sci. 2019, 10, 781. [Google Scholar] [CrossRef] [Green Version]
- Zhou, C.J.; Guo, S.J.; Zhuang, D.H.; Ma, R.J.; Zhu, H.; Wu, Q.H.; Li, M.Q.; Chen, X.D. Comparison of Simultaneous Distillation Extraction (SDE) with Purge and Trap Thermal Desorption (P&T-TD) for the Analysis of Aroma Compounds in Tea Made from Two Cultivars of Fenghuang Dancong by Gas Chromatpraphy-Mass Spectrometry (GC-MS). Food Sci. 2015, 36, 137–142. (In Chinese) [Google Scholar] [CrossRef]
- Zhou, Z.W.; Wei, Y.Y.; Wu, Q.Y.; Fan, L.J.; Rao, H.T.; Chen, Y.Y.; Wu, L.Z.; Dai, B.B.; Cai, L.W.; Zheng, S.Z.; et al. Effects of Differential Green-Making by Airflow Factors on the Aroma Quality of Oolong Tea. Trans. Chin. Soc. Agr. Eng. 2022, 38, 240–248. (In Chinese) [Google Scholar] [CrossRef]
- Liang, S.; Wang, F.; Granato, D.; Zhong, X.; Xiao, A.-F.; Ye, Q.; Li, L.; Zou, C.; Yin, J.-F.; Xu, Y.-Q. Effect of β-Glucosidase on the Aroma of Liquid-fermented Black Tea Juice as An Ingredient for Tea-Based Beverages. Food Chem. 2023, 402, 134201. [Google Scholar] [CrossRef] [PubMed]
- Chen, S.; Liu, H.H.; Zhao, X.M.; Li, X.L.; Shan, W.N.; Wang, X.X.; Wang, S.S.; Yu, W.Q.; Yang, Z.B.; Yu, X.M. Non-targeted Metabolomics Analysis Reveals Dynamic Changes of Volatile and Non-volatile Metabolites during Oolong Tea Manufacture. Food Res. Int. 2020, 128, 108778. [Google Scholar] [CrossRef]
- Wu, L.Y.; Wang, Y.H.; Liu, S.H.; Sun, Y.; Li, C.X.; Lin, J.K.; Wei, S. The Stress-induced Metabolites Changes in the Flavor Formation of Oolong Tea during Enzymatic-catalyzed Process: A Case Study of Zhangping Shuixian Tea. Food Chem. 2022, 391, 13319. [Google Scholar] [CrossRef] [PubMed]
- Sas, C.; Müller, F.; Kappel, C.; Kent, T.V.; Wright, S.I.; Hilker, M.; Lenhard, M. Repeated Inactivation of the First Committed Enzyme Underlies the Loss of Benzaldehyde Emission after the Selfing Transition in Capsella. Curr. Biol. 2016, 26, 3313–3319. [Google Scholar] [CrossRef] [PubMed] [Green Version]
- Klempien, A.; Kaminaga, Y.; Qualley, A.; Nagegowda, D.A.; Widhalm, J.R.; Orlova, I.; Shasany, A.K.; Taguchi, G.; Kish, C.M.; Cooper, B.R.; et al. Contribution of CoA Ligases to Benzenoid Biosynthesis in Petunia Flowers. Plant Cell. 2012, 24, 2015–2030. [Google Scholar] [CrossRef] [Green Version]
- Kapteyn, J.; Qualley, A.V.; Xie, Z.Z.; Fridman, E.; Dudareva, N.; Gang, D.R. Evolution of Cinnamate/p-Coumarate Carboxyl Methyltransferases and Their Role in the Biosynthesis of Methylcinnamate. Plant Cell. 2007, 19, 3212–3229. [Google Scholar] [CrossRef] [Green Version]
- Adebesin, F.; Widhalm, J.R.; Lynch, J.H.; McCoy, R.M.; Dudareva, N.A. Peroxisomal Thioesterase Plays Auxiliary Roles in Plant β-Oxidative Benzoic Acid Metabolism. Plant J. 2018, 93, 905–916. [Google Scholar] [CrossRef] [Green Version]
- Widhalm, J.R.; Gutensohn, M.; Yoo, H.; Adebesin, F.; Qian, Y.C.; Guo, L.Y.; Jaini, R.; Lynch, J.H.; McCoy, R.M.; Shreve, J.T.; et al. Identification of A Plastidial Phenylalanine Exporter that Influences Flux Distribution Through the Phenylalanine Biosynthetic Network. Nat. Commun. 2015, 6, 8142. [Google Scholar] [CrossRef] [Green Version]
- Tieman, D.; Taylor, M.; Schauer, N.; Fernie, A.R.; Hanson, A.D.; Klee, H.J. Tomato Aromatic Amino Acid Decarboxylases Participate in Synthesis of the Favor Volatiles 2-Phenylethanol and 2-Phenylacetaldehyde. Proc. Natl. Acad. Sci. USA 2006, 103, 8287–8292. [Google Scholar] [CrossRef] [PubMed]
- Roccia, A.; Oyan, H.L.; Cavel, E.; Caissard, J.; Machenaud, J.; Thouroude, T.; Jeauffre, J.; Bony, A.; Dubois, A.; Vergne, P.; et al. Biosynthesis of 2-Phenylethanol in Rose Petals is Linked to the Expression of One Allele of RhPAAS. Plant Physiol. 2019, 3, 1064–1079. [Google Scholar] [CrossRef] [PubMed] [Green Version]
- Makino, Y.; Itoh, N. Development of an Improved Phenylacetaldehyde Reductase Mutant by An Efficient Selection Procedure. Appl. Microbiol. Biot. 2014, 98, 4437–4443. [Google Scholar] [CrossRef] [PubMed]
- Gui, J.; Fu, X.; Zhou, Y.; Katsuno, T.; Mei, X.; Deng, R.; Xu, X.; Zhang, L.; Dong, F.; Watanabe, N.; et al. Does Enzymatic Hydrolysis of Glycosidically Bound Volatile Compounds Really Contribute to the Formation of Volatile Compounds during the Oolong Tea Manufacturing Process? J. Agric. Food Chem. 2015, 63, 6905–6914. [Google Scholar] [CrossRef]
- Wu, Q.; Zhou, Z.; Zhang, Y.; Huang, H.; Ou, X.; Sun, Y. Identification of Key Components Responsible for the Aromatic Quality of Jinmudan Black Tea by Means of Molecular Sensory Science. Foods 2023, 12, 1794. [Google Scholar] [CrossRef]
- Livak, K.J.; Schmittgen, T.D. Analysis of Relative Gene Expression Data Using Real-Time Quantitative PCR and the 2−ΔΔCT Method. Methods 2001, 25, 402–408. [Google Scholar] [CrossRef]
- Zhou, Z.W.; Liu, B.S.; Wu, Q.Y.; Bi, W.J.; Ni, Z.X.; Lai, Z.X.; Sun, Y. Formation and Regulation of Aroma Related Volatiles during the Manufacturing Process of Wuyi Rougui Tea via LOX-HPL Pathway. J. Food Sci. Biotechnol. 2021, 40, 100–111. (In Chinese) [Google Scholar]
- Liu, P.P.; Yin, J.F.; Chen, G.S.; Wang, F.; Xu, Y.Q. Flavor Characteristics and Chemical Compositions of Oolong Tea Processed Using Different Semi-Fermentation times. J. Food Sci. Technol. 2018, 55, 1185–1195. [Google Scholar] [CrossRef]
- Wang, Z.Q.; Tang, Q.; Chen, J.L.; Guo, X.; Xu, Y. Analysis of the Suitability for Making Black Tea and Aroma Components of Black Tea Produced by Mingke1,Tieguanyin, and Huangyan Introduced to Sichuan. Food Ferment. Ind. 2015, 41, 192–197. (In Chinese) [Google Scholar]
- Cho, J.Y.; Mizutani, M.; Shimizu, B.; Kinoshita, T.; Ogura, M.; Tokoro, K.; Lin, M.L.; Sakata, K. Chemical Profiling and Gene Expression Profiling during the Manufacturing Process of Taiwan Oolong Tea “Oriental Beauty”. Biosci. Biotech. Bioch. 2007, 71, 1476–1486. [Google Scholar] [CrossRef] [Green Version]
- Qiao, Z.L.; Hu, H.Z.; Yan, B.; Chen, L.Q. Advances of Researches on Biosynthesis and Regulation of Floral Volatile Benzenoids/Phenylpropanoids. Acta Hortic. Sin. 2021, 48, 1815–1826. (In Chinese) [Google Scholar]
- Cong, X.Z.; Li, X.L.; Li, S.T. Crystal Structure of the Aromatic-amino-acid Aminotransferase from Streptococcus mutans. Acta Crystallogr. F 2019, 75, 141–146. [Google Scholar] [CrossRef] [PubMed]
- Yu, X.L. Effects of Different Withering Methods on Components Metabolism Related to Color, Aroma and Taste Quality in Green Tea. Ph.D. Thesis, Huangzhong Agricultural University, Wuhan, China, 2020; pp. 97–102. (In Chinese). [Google Scholar]
- Hirata, H.; Ohnishi, T.; Tomida, K.; Ishida, H.; Kanda, M.; Sakai, M.; Yoshimura, J.; Suzuki, H.; Ishikawa, T.; Dohra, H.; et al. Seasonal Induction of Alternative Principal Pathway for Rose Flower Scent. Sci. Rep. 2016, 6, 20234. [Google Scholar] [CrossRef] [PubMed] [Green Version]
- Deng, H.L.; Chen, S.S.; Zhou, Z.Z.; Li, X.L.; Chen, S.; Hu, J.; Lai, Z.X.; Sun, Y. Transcriptome Analysis Reveals the Effect of Short-Term Sunlight on Aroma Metabolism in Postharvest Leaves of Oolong Tea(Camellia sinensis). Food Res. Int. 2020, 137, 109347. [Google Scholar] [CrossRef]


| Gene Name | Transcript | Number | Sequence Length/bp | Score/Site | E Values | Identity |
|---|---|---|---|---|---|---|
| CsAAAT1 (1266 bp) | Unigene22082_All | CsAAAT1-1 | 1422 | 2486 | 0.0 | 1263/1266 (99%) |
| Unigene17062_All | CsAAAT1-2 | 1266 | 2478 | 0.0 | 1262/1266 (99%) | |
| Unigene13237_All | CsAAAT1-3 | 1329 | 2242 | 0.0 | 1137/1139 (99%) | |
| Unigene65900_All | CsAAAT1-4 | 1059 | 1744 | 0.0 | 886/888 (99%) | |
| Unigene71295_All | CsAAAT1-5 | 903 | 1729 | 0.0 | 884/888 (99%) | |
| Unigene65894_All | CsAAAT1-6 | 1059 | 1697 | 0.0 | 880/888 (99%) | |
| Unigene3903_All | CsAAAT1-7 | 858 | 1586 | 0.0 | 818/824 (99%) | |
| Unigene39034_All | CsAAAT1-8 | 993 | 1586 | 0.0 | 818/824 (99%) | |
| Unigene63900_All | CsAAAT1-9 | 567 | 1108 | 0.0 | 565/567 (99%) | |
| CsAAAT2 (1266 bp) | CL11783.Contig7_All | CsAAAT2-1 | 1266 | 2478 | 0.0 | 1262/1266 (99%) |
| CL11783.Contig1_All | CsAAAT2-2 | 1572 | 2478 | 0.0 | 1262/1266 (99%) | |
| CL11783.Contig12_All | CsAAAT2-3 | 1227 | 2401 | 0.0 | 1223/1227 (99%) | |
| CL11783.Contig2_All | CsAAAT2-4 | 1167 | 2244 | 0.0 | 1144/1148 (99%) | |
| CL11783.Contig5_All | CsAAAT2-5 | 1161 | 2060 | 0.0 | 1051/1055 (99%) | |
| CL11783.Contig8_All | CsAAAT2-6 | 1026 | 1748 | 0.0 | 894/898 (99%) | |
| CL11783.Contig6_All | CsAAAT2-7 | 1053 | 1628 | 0.0 | 833/837 (99%) |
| CsAAAT Type | Gene Name | Transcript | Correlation Coefficient | Significance |
|---|---|---|---|---|
| CsAAAT1 | CsAAAT1-1 | Unigene22082_All | 0.824 | ** |
| CsAAAT1-3 | Unigene13237_All | 0.948 | ** | |
| CsAAAT1-9 | Unigene63900_All | 0.786 | ** | |
| CsAAAT2 | CsAAAT2-1 | CL11783.Contig7_All | 0.830 | ** |
| CsAAAT2-3 | CL11783.Contig12_All | 0.851 | ** | |
| CsAAAT2-6 | CL11783.Contig8_All | 0.796 | ** |
| Types | Component | CAS | Character | Concentration (μg/g) | OAV | Threshold (ug/kg) | ||
|---|---|---|---|---|---|---|---|---|
| Rt | Rc | Rt | Rc | - | ||||
| VBs | Benzaldehyde | 100-52-7 | Bitter almond odor | 10.74 ± 0.44 | 4.25 ± 0.45 | 0.68 | 0.27 | 350 |
| Benzyl alcohol | 100-51-6 | Rose flavor | 27.38 ± 0.40 | 8.58 ± 3.28 | 1.51 | 0.47 | 400 | |
| 2-Hydroxy-, 3-hexenylester, (z)-benzoicaci | 65405-77-8 | Fresh fragrance | 12.41 ± 0.65 | 3.92 ± 0.85 | - | - | - | |
| 2-hydroxy benzoic acid methyl ester | 119-36-8 | Fragrance of holly oil | 22.80 ± 3.67 | 9.98 ± 3.80 | 12.56 | 5.50 | 40 | |
| Benzoic acid, 2-hydroxy-, pentyl ester | 2050-08-0 | Orchid fragrance | 1.55 ± 0.10 | 0.00 | - | - | - | |
| VPs | Phenylethyl alcohol | 60-12-8 | Rose-like | 197.89 ± 6.10 | 64.71 ± 6.80 | 5.81 | 1.90 | 750 |
| Methyl phenylacetate | 101-41-7 | Sweet floral fragrance | 23.59 ± 4.17 | 24.05 ± 3.37 | 0.52 | 0.53 | 1000 | |
| Phenethyl acetate | 103-45-7 | Rose-like | 10.69 ± 0.15 | 3.45 ± 0.07 | - | - | - | |
Disclaimer/Publisher’s Note: The statements, opinions and data contained in all publications are solely those of the individual author(s) and contributor(s) and not of MDPI and/or the editor(s). MDPI and/or the editor(s) disclaim responsibility for any injury to people or property resulting from any ideas, methods, instructions or products referred to in the content. |
© 2023 by the authors. Licensee MDPI, Basel, Switzerland. This article is an open access article distributed under the terms and conditions of the Creative Commons Attribution (CC BY) license (https://creativecommons.org/licenses/by/4.0/).
Share and Cite
Zhou, Z.; Wu, Q.; Rao, H.; Cai, L.; Zheng, S.; Sun, Y. The Dynamic Change in Aromatic Compounds and Their Relationship with CsAAAT Genes during the Post-Harvest Process of Oolong Tea. Metabolites 2023, 13, 868. https://doi.org/10.3390/metabo13070868
Zhou Z, Wu Q, Rao H, Cai L, Zheng S, Sun Y. The Dynamic Change in Aromatic Compounds and Their Relationship with CsAAAT Genes during the Post-Harvest Process of Oolong Tea. Metabolites. 2023; 13(7):868. https://doi.org/10.3390/metabo13070868
Chicago/Turabian StyleZhou, Ziwei, Qingyang Wu, Hongting Rao, Liewei Cai, Shizhong Zheng, and Yun Sun. 2023. "The Dynamic Change in Aromatic Compounds and Their Relationship with CsAAAT Genes during the Post-Harvest Process of Oolong Tea" Metabolites 13, no. 7: 868. https://doi.org/10.3390/metabo13070868