Abstract
Background: A possible role of vitamin D epimers and metabolites in the measurement and response to treatment of vitamin D has been reported recently. Furthermore, the influence of underlying vitamin D receptor (VDR) genetic polymorphisms which have been linked to diseases such as obesity remains unclear. We therefore aimed to examine the influence of vitamin D3 and calcium supplements on vitamin D epimer and metabolite concentrations in subjects with and those without vitamin D receptor (VDR) gene polymorphisms. Methods: A total of 277 participants who were part of a randomized intervention trial of vitamin D3 and calcium or a placebo for 6 months had clinical and anthropometric assessments. Blood samples were taken for measurements of vitamin D, epimers and metabolites of vitamin D, four vitamin D receptor gene polymorphism SNPs, namely, BsmI, FokI, TaqI, and ApaI, metabolic and inflammatory markers, and related biochemical variables. Repeated-measures analysis of variance was used to assess the between-group difference in cumulative changes in vitamin D epimers and metabolites at 6 months after adjusting for the presence of the 4 VDR genotypes and allele gene polymorphisms. Results: Overall, 277 participants, with a mean (±SD) age of 41 ± 12 and 204 (74%) of whom were female, were included in the study. We found no statistically significant differences in vitamin D metabolites or (epimers) between male and females or younger subjects compared to those over 40 years of age except in 7C4 BL (p < 0.05). There was a statistically significant difference in 1,25(OH)2D3 concentrations between subjects with and those without genotypes AG and the allele G SNP2_Taql VDR gene polymorphism. Vitamin D3 concentrations were also significantly lower in subjects with the CC SNP3_Apal gene polymorphism compared to those without the CC SNP3 gene. No statistically significant effects were seen on vitamin D epimers and metabolites concentration in response to supplements before or after adjusting for the presence of the 4 VDR genotypes and allele gene polymorphisms. Conclusions: The CC SNP3 gene had statistically significant influence on vitamin D3 levels. Vitamin D and/or calcium supplements, however, had no effects on vitamin D epimer and metabolite concentration before or after adjusting for the presence of the 4 VDR genotypes and alleles.
1. Introduction
There is strong evidence that vitamin D has other health benefits because most human cells and tissues contain vitamin D receptors [1]. Vitamin D deficiency is common in the Middle East, but its adverse health effects and benefits of optimizing vitamin D status are still not clear. Vitamin deficiency may have a role in the pathologies associated with obesity and related diabetes [2]. Several observational studies have raised the possibility of the role of vitamin D in the development of type 2 diabetes in obese subjects [3,4]. This is important because the United Arab Emirates (UAE) has the second highest rate of obesity and associated type 2 diabetes in the world [5]. The biological action of vitamin D is through binding to vitamin D receptor (VDR) [1]. A number of mutations of the VDR gene have been identified [6]. In addition, several subtle allelic polymorphisms have been reported in the VDR gene, with links to metabolic bone diseases [7,8]. Polymorphisms and mutations of the VDR gene may influence the risk of disease and responses to circulating vitamin D, especially in the Asian and Middle Eastern populations where D deficiency is prevalent. However, studies on the relationship between vitamin D deficiency and its health implications on some ethnic groups have yielded conflicting results [9,10]. Some of these studies revealed only small ethnic differences in bone turnover, despite a striking difference in prevalence of secondary hyperparathyroidism between the two groups. The altered metabolism of vitamin D due to ethnic or genetic differences in Asian women may protect their skeleton from bone loss [11,12,13]. In addition, evidence points to a possible role of vitamin D metabolites in the measurement and response to supplements of 25-hyroxyvitamin D [14].
The main aim of this subgroup analysis was to examine the effects of vitamin D3 and calcium supplements on vitamin D epimer and metabolite concentrations.
2. Methods and Study Design
The methodology of this study has been published before [15]. Briefly, community free-living healthy subjects were recruited for this trial from January 2017 to December 2019. The subjects were recruited from community health centers and from hospital out-patient clinics. The exclusion criteria included those on vitamin D, calcium, and steroid medications, those with renal disease or stones, parathyroid disease, and hypercalcemia, and those unable to give a written informed consent. The trial was approved by the Al Ain Medical District human research ethics committee and all participants provided written informed consent. Clinical Trial Registration: NCT02662491, registered on 13 January 2016 (https://register.clinicaltrials.gov/prs/app/action/SelectProtocol?sid=S00060CE&selectaction=Edit&uid=U0001M6P&ts=3&cx=scu4cb (accessed on 11 September 2024)).
2.1. Study Design
Participants were assigned 2000 IU of vitamin D3, 600 mg of calcium, vitamin D3 (2000 IU) combined with 600 mg calcium, or a placebo daily for 6 months (enrollment flow diagram). Tablets in all 4 groups were identical in appearance and of equal size. Throughout the trial, all investigators were blinded to the intervention assignment. We assessed compliance by counting tablets at follow-up appointments. A computer random number table was used to generate the randomization sequence. Eligible subjects’ blood and urine samples were taken for measurements of 25(OH)D, markers of bone turnover, and related biochemical variables following written informed consent. An assessment of self-rated health, body pains, physical activity, dietary intakes, and bone turnover was performed at baseline, and repeated at 6 months post-randomization. Trial intervention tablets were stopped after the collection of the 6-month biological samples.
Enrolment flow diagram (Figure 1):
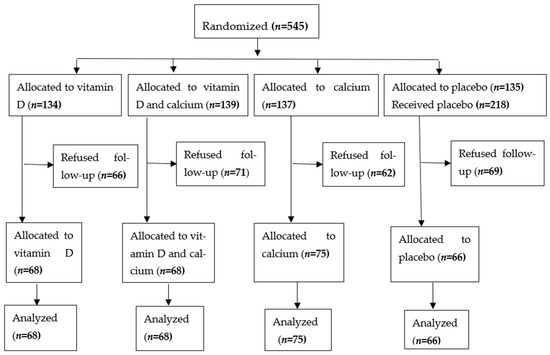
Figure 1.
Enrolment, treatment and follow up of study subjects [15].
2.2. The Measurements
Details of the methods for clinical and biomedical measurements have been published previously [15,16,17]. Briefly, a questionnaire collected data on demographic and life style factors including the use of medications and supplements. Body mass index (BMI) was calculated from body weight and height measured using a Tanita body composition analyzer. Based on WHO cut-of-points for BMI, subjects with BMI = 18–25 were classified as normal weight, those with BMI = 25.1–29.9 as overweight, and those with BMI 30 and above as obese.
2.2.1. DNA Preparation and VDR SNP Genotyping Analysis [17]
This was described previously; briefly, DNA was extracted from blood using a QIAamp DNA Mini Kit. The extracted DNA was analyzed and stored at 80 °C until use. Four VDR SNPs (BsmI, FokI, TaqI, and ApaI) were evaluated using a TaqMan SNP genotyping assay. All assays were performed using Genetic Analyzer (Applied Biosystems, Foster City, CA, USA) according to the manufacturer’s instructions.
2.2.2. Measurements of Vitamin D Epimers and Metabolites [17]
Vitamin D metabolites including 2 epimers were measured using the LC–MS/MS instrument (Shimadzu, Kyoto, Japan) [17]. The Shimadzu 8060 (Shimadzu, Kyoto, Japan) system was run using positive ion electrospray ionization (ESI). The method validation showed good sensitivity, recovery, linearity, precision, specificity, and accuracy [17].
2.3. Statistical Analysis
All data were analyzed using the SPSS V26. Testing for between-group differences was carried out using one-way ANOVA or the nonparametric Kruskal–Wallis H. Repeated-measures analysis of variance was used to assess the between-group difference in cumulative changes in vitamin D epimers and metabolites at 6 months after adjusting for the presence of the 4 VDR genotypes and allele gene polymorphisms.
3. Results
3.1. Baseline Characteristics
For those who completed 6 months of follow-up, baseline characteristics were well balanced across the groups except for the prevalence of diabetes (Table 1). Among the 277 subjects recruited, 46 (17%) had type 2 diabetes and 41 (15%) had hypertension. Using WHO obesity cut-of-points for BMI, 65 (24%) subjects had normal BMI, 93 (34) overweight, and 108 (39%) obesity at baseline (Table 1).

Table 1.
Baseline characteristics at trial entry by randomization group, mean (SD) unless stated otherwise.
3.2. Vitamin D Epimer and Metabolite Concentrations Stratified by Age, Sex and Presence or Absence of the Genotype and Allele
Figure 2 and Figure 3 show baseline epimers of vitamin D in the study population stratified by sex and age over 40 years compared to those under 40 years of age. However, no statistically significant differences were seen in vitamin D or its metabolites (epimers) including 1,25 (OH)2D3 between males and females or between younger subjects and those over 40 years of age except in 7C4 BL (p < 0.05).
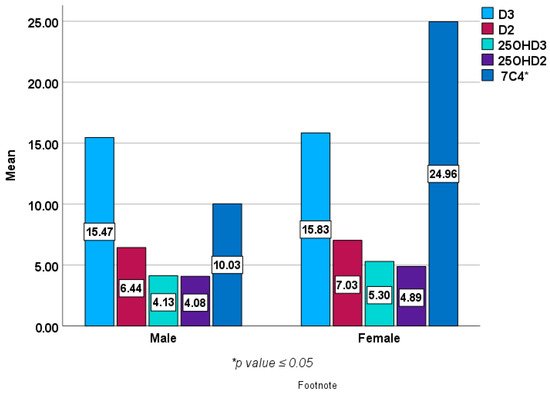
Figure 2.
Baseline epimers and metabolites of vitamin D levels (ng/mL) in females (n = 203) compared with male subjects (n = 69).
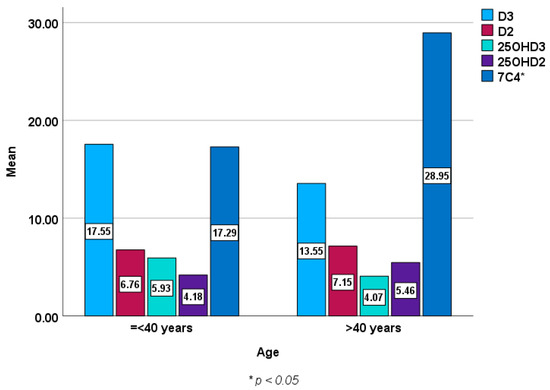
Figure 3.
Baseline epimers and metabolites of vitamin D levels (ng/mL) in those aged ≤ 40 years [mean (±SD) age of 31 ± 7, n = 130] compared to those over 40 years [mean (±SD) age of 51 ± 8, n = 139].
Figure 4 shows the genotype and allele percentage frequency distribution of four VDR gene polymorphisms in 277 Emirati subjects.
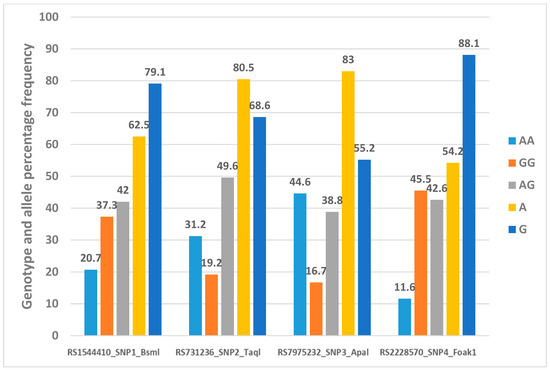
Figure 4.
Genotype and allele percentage frequency distribution of 4 VDR gene polymorphisms in Emirati population [16].
Table 2, Table 3, Table 4 and Table 5 show vitamin D epimer and metabolite concentrations according to the presence or absence of the genotype and allele distribution of four VDR gene polymorphisms. There was a statistically significant difference in 1,25(OH)2D3 concentrations between subjects with and those without genotypes AG and allele G in the RS731236_SNP2_Taql VDR gene polymorphism (p < 0.05). Vitamin D3 concentrations were also significantly lower in subjects with the genotype CC in the SNP3_Apal gene polymorphism compared to those with and those without the genotype CC SNP3 (p < 0.05) [Table 4].
Table 2.
Vitamin D epimer and metabolite concentrations according to presence or absence of genotype and allele distribution of RS1544410_SNP1_Bsml VDR.
Table 3.
Vitamin D epimer and metabolite concentrations according to presence or absence of genotype and allele distribution of RS731236_SNP2_Taql gene polymorphism.
Table 4.
Vitamin D epimer and metabolite concentrations according to presence or absence of genotype and allele distribution of RS7975232_SNP3_Apal gene polymorphism.
Table 5.
Vitamin D epimer and metabolite concentrations according to presence or absence of genotype and allele distribution of RS2228570_SNP4_Fok1 gene polymorphism.
Table 6 shows the effect of supplements on vitamin D metabolites and epimers. There were no statistically significant differences in vitamin D metabolite and epimer levels between the supplement and placebo groups at the 6-month follow-up (Table 3).
Table 6.
Vitamin D epimer and metabolite outcomes by randomized group, mean (SD) unless stated otherwise.
4. Discussion
This is a subgroup analysis of the first randomized placebo-controlled trial to investigate the effect of vitamin D supplementation with calcium on vitamin D epimer and metabolite concentrations in subjects with and those without vitamin D receptor (VDR) gene polymorphisms. No statistically significant differences were seen in vitamin D metabolites or epimers between males and females or younger subjects compared to those over 40 years of age except in 7C4 BL. There was a statistically significant difference in 1,25(OH)2D3 concentrations between subjects with and those without genotype AG and allele G of the RS731236_SNP2_Taql VDR gene polymorphism. Vitamin D3 concentrations were also significantly lower in subjects with the genotype CC in the SNP3_Apal gene polymorphism compared to those with those without the genotype CC SNP3. No statistically significant effects were seen on vitamin D epimers and metabolites in response to supplements before or after adjusting for the presence of the four VDR genotype and allele gene polymorphisms. Several reasons may explain the lack of benefits of the supplements in our study [15]. First, there was a large number of recruited subjects who did not show up for follow-up. However, there were no statistically significant difference in baseline demographic and clinical characteristics between those who had follow-up data compared to those who did not come for the follow-up [15]. In addition, the pre-study sample size calculation shows that the number of participants with follow-up data is large enough to detect a difference if one exists. Second, vitamin D levels in the supplement group did not show the expected increase in relation to supplement dose and duration although this was slightly better in subjects who reported taking more than half of the prescribed trial medications. This could be a true finding or alternatively the result of the over-reporting of the number of tables taken although compliance was assessed by counting tablets at follow-up appointments in all study participants. Another reason which could explain the variability in response to supplements is the high proportion of overweight and obese subjects in our study population because overweight and obesity are known to markedly decrease response to vitamin D supplementation [18,19,20]. Recent guidance recommends obese subjects be given two to three times more vitamin D doses compared to normal-weight subjects [20]. Studies have reported different mechanisms for the poor response to supplements in obese subjects including decreased absorption, greater volume of distribution, and tightly bound vitamin D in fatty tissues; however, there is still no consensus on these mechanisms [20,21,22,23]. Our own society in the UAE has a growing epidemic of overweight/obesity, diabetes, and vitamin D deficiency. However, adjustment for factors known to influence vitamin D status such as body mass index, physical activity, sun exposure, and a vitamin D and calcium-rich diet did not show significant association with baseline vitamin D levels or response to supplements [17]. Recently, vitamin D supplementation to reach and sustain 25(OH)D levels ≥ 125 nmol/L has been shown to lower the risk of progression to diabetes in adults with prediabetes [24]. Accumulating evidence suggests that a higher dose of vitamin D supplementation to reach and sustain higher levels of 25(OH)D may indeed have clinical benefits in our high-risk population.
A metanalysis of 76 trials of the influence of variable doses of vitamin D supplementation on serum 25-hydroxyvitamin D levels in Caucasians but not Asians reported that trials that used similar supplement doses could obtain significantly different changes to 25(OH)D concentrations [25]. In light of this evidence, the lack of significant increase in vitamin D levels or one of its metabolites or epimers in those who received the supplements in our study could be a true finding.
A number of factors have been reported to affect response to vitamin D levels and response to supplements including ethnicity, genetics, body mass, and type of vitamin D [1]. This may be the reason for the diversity in opinion reflected in different guidelines. Recent evidence also points to a possible role of vitamin D metabolites and epimers in the measurement and response to supplements of vitamin D [14]. The concentration of vitamin D epimers is reported to be greater in males than in females and the number of epimers was found to be higher in the blood of infants compared to adults [26,27,28]. It has also been reported that the oral supplementation of vitamin D can cause an increased production of epimers in mice but not in humans [29]. In addition, some experimental evidence suggests that adiposity reduces the hepatic hydroxylation of vitamin D, leading to lower vitamin D levels in obese mice compared with normal-weight mice [30]. Because of the controversy and difference in opinion regarding the clinical significance of vitamin D metabolites, we developed and validated the Ultra-High-Performance Liquid Chromatography-Tandem Mass Spectrometry (UHPLC-MS/MS) method and applied it to measure vitamin D metabolites in the serum of 452 obese and normal-weight healthy subjects [14]. Because of the increased risk of obesity-associated diabetes and vitamin D deficiency in our community and the paucity of evidence regarding the significance and storage effects of vitamin D status in obese subjects, we subsequently applied the above method to study vitamin D metabolites and epimers in a different cohort of community free-living healthy populations including obese subjects. We also studied the interaction and correlations of vitamin D and its metabolites with adverse metabolic health risk factors in obese subjects [2,17]. Although we reported a significant association between vitamin D levels and age, gender, and type 2 diabetes, we found no significant associations between the deficiency of vitamin D and or its metabolites and body mass index, inflammatory, or metabolic risk factors [17]. At present, clinical evidence does not support the routine quantification of vitamin D metabolites and epimers; however, our research has shown that vitamin D epimers are present in significant proportions in the blood, which can lead to an overestimation when measuring vitamin D levels [26]. The overestimation of vitamin D levels in patients undergoing vitamin D supplementation therapy is of serious concern, as sufficient vitamin D levels are critical for various important physiological functions and for disease prevention.
4.1. Strengths and Limitations
Although this is a subgroup analysis of the effect of vitamin D supplementation with or without calcium on vitamin D epimer and metabolite concentration in subjects with and those without vitamin D receptor (VDR) gene polymorphisms, we acknowledge some limitations.
One potential limitation is the lack of expected increase in vitamin D levels in relation to supplement dose used and duration, although this may be due to the high number of overweight and obese subjects in the study population or compliance with the trial medications. Compliance was assessed meticulously by counting tablets at follow-up appointments.
4.2. Clinical Implications and Recommendations
Our previous research has shown that vitamin D epimers and metabolites are present in significant proportions in the blood, which can lead to an overestimation when measuring vitamin D levels [14]. Although clinical evidence at present does not exist for the routine quantification of vitamin D epimers and metabolites, the overestimation of vitamin D levels in patients undergoing vitamin D supplementation therapy is of concern, as sufficient vitamin D levels are critical for optimal health. It is therefore imperative for the healthcare community to be aware that reported vitamin D values for patients using currently available commercial vitamin D kits might be significantly overestimated. This may have practical implications for current supplementation strategies and guidelines.
5. Conclusions
Our main finding is that the CC SNP3 gene had statistically significant influence on vitamin D3 levels. This finding, however, needs more research because the reasons for it are not clear at present. Vitamin D and/or calcium supplements, however, had no effect on vitamin D epimer and metabolite concentration before or after adjusting for the presence of the four VDR genotypes and alleles. Although clinical evidence at present does not exist for the routine quantification of vitamin D epimers and metabolites, there is a need to be aware that the presence of vitamin D epimers and metabolite might lead to an overestimation of vitamin D values. Future research is also needed to study the effects of a higher dose of vitamin D supplementation to reach higher levels, particularly in high-risk populations, to see if this will affect vitamin D epimers and metabolites.
Author Contributions
Conceptualization, S.G.; Formal analysis, S.G.; Investigation, G.S.M.A.-B. and J.Y.; Resources, G.S.M.A.-B.; Data curation, G.S.M.A.-B. and J.Y.; Writing—original draft, S.G.; Project administration, S.G. and J.Y.; Funding acquisition, S.G. All authors have read and agreed to the published version of the manuscript.
Funding
This research was supported by a grant from United Arab Emirates University project Grant (NP-17-11).
Institutional Review Board Statement
The study was conducted in accordance with the Declaration of Helsinki, and approved by Research Ethics Committee of the Al Ain Medical District (protocol code: AAHEC-03-17-055 and approval date: 18 April 2017).
Informed Consent Statement
Informed consent was obtained from all subjects involved in the study.
Data Availability Statement
The original contributions presented in the study are included in the article, further inquiries can be directed to the corresponding author.
Conflicts of Interest
The authors declare no conflict of interest.
References
- Ramasamy, I. Vitamin D metabolism and guidelines for vitamin D supplementation. Clin. Biochem. Rev. 2020, 41, 103–126. [Google Scholar] [CrossRef] [PubMed]
- Alzohily, B.; AlMenhali, A.; Gariballa, S.; Munawar, N.; Yasin, J.; Shah, I. Unraveling the complex interplay between obesity and vitamin D metabolism. Sci. Rep. 2024, 14, 7583. [Google Scholar] [CrossRef] [PubMed]
- Palaniswamy, S.; Gill, D.; De Silva, N.M.; Lowry, E.; Jokelainen, J.; Karhu, T.; Mutt, S.J.; Dehghan, A.; Sliz, E.; Chasman, D.I.; et al. Could vitamin D reduce obesity-associated inflammation? Observational and Mendelian randomization study. Am. J. Clin. Nutr. 2020, 111, 1036–1047. [Google Scholar] [CrossRef] [PubMed]
- Norman, A.W.; Frankel, J.B.; Heldt, A.M.; Grodsky, G.M. Vitamin D deficiency inhibits pancreatic secretion of insulin. Science 1980, 209, 823–825. [Google Scholar] [CrossRef] [PubMed]
- Obesity: Preventing and managing the global epidemic. Report of a WHO consultation. World Health Organ Tech. Rep. Ser. 2000, 894, 1–253.
- Uitterlinden, A.G.; Fang, Y.; Van Meurs, J.B.; Pols, H.A.; Van Leeuwen, J.P. Genetics and biology of vitamin D receptor polymorphisms. Gene 2004, 338, 143–156. [Google Scholar] [CrossRef]
- Rezende, V.B.; Barbosa, F., Jr.; Montenegro, M.F.; Sandrim, V.C.; Gerlach, R.F.; Tanus-Santos, J.E. An interethnic comparison of the distribution of vitamin D receptor genotypes and haplotypes. Clin. Chim. Acta 2007, 384, 155–159. [Google Scholar] [CrossRef]
- Qin, W.H.; Wang, H.X.; Qiu, J.L.; Huang, X.B.; Huang, Y.; Wu, N.R.; Liang, H.S. A meta-analysis of association of vitamin D receptor BsmI gene polymorphism with the risk of type 1 diabetes mellitus. J. Recept. Signal Transduct. Res. 2014, 34, 372–377. [Google Scholar] [CrossRef]
- Holvik, K.; Meyer, H.E.; Søgaard, A.J.; Selmer, R.; Haug, E.; Falch, J.A. Biochemical markers of bone turnover and their relation to forearm bone mineral density in persons of Pakistani and Norwegian background living in Oslo Norway. Eur. J. Endocrinol. 2006, 155, 693–699. [Google Scholar] [CrossRef][Green Version]
- Lowe, N.M.; Mitra, S.R.; Foster, P.C.; Bhojani, I.; McCann, J. Vitamin D status and markers of bone turnover in Caucasian and Southy Asian postmenopausal women living in the UK. Br. J. Nutr. 2010, 103, 1706–1710. [Google Scholar] [CrossRef]
- Farrar, M.D.; Kift, R.; Felton, S.J.; Berry, J.L.; Durkin, M.T.; Allan, D.; Vail, A.; Webb, A.R.; Rhodes, L.E. Recommended summer sunlight exposure amounts fail to produce sufficie vitamin D status in UK adults of South Asian origin. Am. J. Clin. Nutr. 2011, 94, 1219–1224. [Google Scholar] [CrossRef] [PubMed]
- Saadi, H.; Dawodu, A.; Afandi, B.; Zayed, R.; Benedict, S.; Ngelkerke, N. Efficacy of daily and monthly high-dose calciferol in Vitamin D deficient nulliparous and lactating women. Am. J. Clin. Nutr. 2007, 85, 1565–1571. [Google Scholar] [CrossRef] [PubMed]
- Laaksonen, M.; Kärkkäinen, M.; Outila, T.; Vanninen, T.; Ray, C.; Lamberg-Allardt, C. Vitamin D receptor gene BsmI-polymorphism in Finnish premenopausal and postmenopausal women: Its association with bone mineral density, markers of bone turnover, and intestinal calcium absorption, with adjustment for lifestyle factors. J. Bone Miner. Metab. 2002, 20, 383–390. [Google Scholar] [CrossRef] [PubMed]
- Shah, I.; Al-Dabbagh, B.; Gariballa, S.; Al-Menhali, A.; Muhammad, N.; Yasin, J.; Ashraf, S.S. Application of a new vitamin D blood test on the Emirati population. J. Steroid Biochem. Mol. Biol. 2018, 180, 118–128. [Google Scholar] [CrossRef] [PubMed]
- Gariballa, S.; Yasin, J.; Alessa, A. A randomized, double-blind, placebo-controlled trial of vitamin D supplementation with or without calcium in community-dwelling vitamin D deficient subjects. BMC Musculoskelet. Disord. 2022, 23, 415. [Google Scholar] [CrossRef]
- Gariballa, S.; Al-Bluwi, G.S.M.; Yasin, J. Frequency of Vitamin D Receptor Gene Polymorphisms in a Population with a very High Prevalence of Vitamin D Deficiency, Obesity, Diabetes and Hypertension. Biomedicines 2023, 11, 1202. [Google Scholar] [CrossRef]
- Gariballa, S.; Shah, I.; Yasin, J.; Alessa, A. Vitamin D [25(OH)D] metabolites and epimers in obese subject: Interaction and correlations with adverse metabolic health risk factors. J. Steroid Biochem. Mol. Biol. 2022, 215, 106023. [Google Scholar] [CrossRef]
- Wortsman, J.; Matsuoka, L.Y.; Chen, T.C.; Lu, Z.; Holick, M.F. Decreased bioavailability of vitamin D in obesity. Am. J. Clin. Nutr. 2000, 72, 690–693.38. [Google Scholar] [CrossRef]
- Maki, K.C.; Rubin, M.R.; Wong, L.G.; McManus, J.F.; Jensen, C.D.; Lawless, A. Effects of vitamin D supplementation on 25-hydroxyvitamin D, high-density lipoprotein cholesterol, and other cardiovascular disease risk markers in subjects with elevated waist circumference. Int. J. Food Sci. Nutr. 2011, 62, 318–332. [Google Scholar] [CrossRef]
- Ekwaru, J.P.; Zwicker, J.D.; Holick, M.F.; Giovannucci, E.; Veugelers, P.J. The importance of body weight for the dose response relationship of oral vitamin D supplementation and serum 25-hydroxyvitamin D in healthy volunteers. PLoS ONE 2014, 9, e111265. [Google Scholar] [CrossRef]
- Drincic, A.T.; Armas, L.A.; Van Diest, E.E.; Heaney, R.P. Volumetric dilution, rather than sequestration best explains the low vitamin D status of obesity. Obesity 2012, 20, 1444–1448. [Google Scholar] [CrossRef] [PubMed]
- Veugelers, P.J.; Pham, T.M.; Ekwaru, J.P. Optimal Vitamin D Supplementation Doses that Minimize the Risk for Both Low and High Serum 25-Hydroxyvitamin D Concentrations in the General Population. Nutrients 2015, 7, 10189–10208. [Google Scholar] [CrossRef] [PubMed]
- Crowe, F.L.; Steur, M.; Allen, N.E.; Appleby, P.N.; Travis, R.C.; Key, T.J. Plasma concentrations of 25-hydroxyvitamin D in meat eaters, fish eaters, vegetarians and vegans: Results from the EPIC-Oxford study. Public Health Nutr. 2011, 14, 340–346. [Google Scholar] [CrossRef] [PubMed]
- Dawson-Hughes, B.; Staten, M.A.; Knowler, W.C.; Nelson, J.; Vickery, E.M.; LeBlanc, E.S.; Neff, L.M.; Park, J.; Pittas, A.G. Intratrial Exposure to Vitamin D and New-Onset Diabetes Among Adults With Prediabetes: A Secondary Analysis From the Vitamin D and Type 2 Diabetes (D2d) Study. Diabetes Care. 2020, 43, 2916–2922. [Google Scholar] [CrossRef] [PubMed]
- Autier, P.; Gandini, S.; Mullie, P. A Systematic Review: Influence of Vitamin D Supplementation on Serum 25-Hydroxyvitamin D Concentration. J. Clin. Endocrinol. Metab. 2012, 97, 2606–2613. [Google Scholar] [CrossRef]
- Al-Zohily Al Menhali, B.; Gariballa, S.; Haq, A.; Shah, I. Epimers of vitamin D: A review. Int. J. Mol. Sci. 2020, 21, 470. [Google Scholar] [CrossRef]
- Chailurkit, L.; Aekplakorn, W.; Ongphiphadhanakul, B. Serum C3 epimer of 25-hydroxyvitamin D and its determinants in adults: A national health examination survey in Thais. Osteoporos. Int. 2015, 26, 2339–2344. [Google Scholar] [CrossRef]
- Singh, R.J.; Taylor, R.L.; Reddy, G.S.; Grebe, S.K. C-3 epimers can account for a significant proportion of total circulating 25-hydroxyvitamin D in infants, complicating accurate measurement and interpretation of vitamin D status. J. Clin. Endocrinol. Metab. 2006, 91, 3055–3061. [Google Scholar] [CrossRef]
- Ghaly, S.; Bliuc, D.; Center, J.R.; Clarke, M.W.; Jones, A.P.; Trend, S.; Kermode, A.G.; Neale, R.E.; Hart, P.H. Vitamin D C3-epimer levels are proportionally higher with oral vitamin D supplementation compared to ultraviolet irradiation of skin in mice but not humans. J. Steroid Biochem. Mol. Biol. 2019, 186, 110–116. [Google Scholar] [CrossRef]
- Bouillon, R.; Bikle, D. Vitamin D metabolism revised: Fall of dogmas. J. Bone Miner. Res. 2019, 34, 1985–1992. [Google Scholar] [CrossRef]


Disclaimer/Publisher’s Note: The statements, opinions and data contained in all publications are solely those of the individual author(s) and contributor(s) and not of MDPI and/or the editor(s). MDPI and/or the editor(s) disclaim responsibility for any injury to people or property resulting from any ideas, methods, instructions or products referred to in the content. |
© 2024 by the authors. Licensee MDPI, Basel, Switzerland. This article is an open access article distributed under the terms and conditions of the Creative Commons Attribution (CC BY) license (https://creativecommons.org/licenses/by/4.0/).