

Diagnostic Potential of Alternations of Bile Acid Profiles in the Plasma of Patients with Huntington’s Disease

 , ,
, ,  and
and
Abstract

1. Introduction
2. Materials and Methods
2.1. Ethics Statement and Study Participants
2.2. Participants Recruitment and Plasma Preparation
2.3. Bile Acid Analysis with Liquid Chromatography–Mass Spectrometry (LCMS)
2.4. Statistical Analysis
3. Results
- CDCA/CA Ratio: This ratio was used to assess potential shifts in BA synthesis, indicating deviations from the classical to the alternative BA pathway;
- Ratios of secondary to primary BAs (DCA/CA, GDCA/CA): By assessing these ratios, we investigated disparities in enzymatic activities of the gut microbiome that may lead to increased secondary BA production;
- Sum of neuroprotective BAs [UDCA + GUDCA + tauroursodeoxycholic acid (TUDCA)]: This sum was used to evaluate the overall neuroprotective effect of BAs;
- Sum of neurotoxic BAs [glycocholic acid (GCA) + GDCA + GCDCA]: This sum was used to assess the magnitude of neurotoxicity of BAs;
- Ratio of UDCA + GUDCA + TUDCA/GCA + GDCA + GCDCA: This ratio indicates if neuroprotective BAs are proportionally higher than neurotoxic BAs in HD.
4. Discussion
Limitations and Future Directions
5. Conclusions
Supplementary Materials
Author Contributions
Funding
Institutional Review Board Statement
Informed Consent Statement
Data Availability Statement
Acknowledgments
Conflicts of Interest
References
- Macdonald, M. A Novel Gene Containing a Trinucleotide Repeat That Is Expanded and Unstable on Huntington’s Disease Chromosomes. Cell 1993, 72, 971–983. [Google Scholar] [CrossRef] [PubMed]
- Kremer, B.; Goldberg, P.; Andrew, S.E.; Theilmann, J.; Telenius, H.; Zeisler, J.; Squitieri, F.; Lin, B.; Bassett, A.; Almqvist, E. A Worldwide Study of the Huntington’s Disease Mutation. The Sensitivity and Specificity of Measuring CAG Repeats. N. Engl. J. Med. 1994, 330, 1401–1406. [Google Scholar] [CrossRef] [PubMed]
- Cha, J.-H.J. Transcriptional Signatures in Huntington’s Disease. Prog. Neurobiol. 2007, 83, 228–248. [Google Scholar] [CrossRef] [PubMed]
- Chen, C.-M. Mitochondrial Dysfunction, Metabolic Deficits, and Increased Oxidative Stress in Huntington’s Disease. Chang. Gung Med. J. 2011, 34, 135–152. [Google Scholar]
- Valera, A.G.; Díaz-Hernández, M.; Hernández, F.; Ortega, Z.; Lucas, J.J. The Ubiquitin-Proteasome System in Huntington’s Disease. Neuroscientist 2005, 11, 583–594. [Google Scholar] [CrossRef] [PubMed]
- DiFiglia, M.; Sapp, E.; Chase, K.O.; Davies, S.W.; Bates, G.P.; Vonsattel, J.P.; Aronin, N. Aggregation of Huntingtin in Neuronal Intranuclear Inclusions and Dystrophic Neurites in Brain. Science 1997, 277, 1990–1993. [Google Scholar] [CrossRef] [PubMed]
- Huang, Y.-C.; Wu, Y.-R.; Tseng, M.-Y.; Chen, Y.-C.; Hsieh, S.-Y.; Chen, C.-M. Increased Prothrombin, Apolipoprotein A-IV, and Haptoglobin in the Cerebrospinal Fluid of Patients with Huntington’s Disease. PLoS ONE 2011, 6, e15809. [Google Scholar] [CrossRef] [PubMed]
- Mochel, F.; Charles, P.; Seguin, F.; Barritault, J.; Coussieu, C.; Perin, L.; Le Bouc, Y.; Gervais, C.; Carcelain, G.; Vassault, A.; et al. Early Energy Deficit in Huntington Disease: Identification of a Plasma Biomarker Traceable during Disease Progression. PLoS ONE 2007, 2, e647. [Google Scholar] [CrossRef] [PubMed]
- Underwood, B.R.; Broadhurst, D.; Dunn, W.B.; Ellis, D.I.; Michell, A.W.; Vacher, C.; Mosedale, D.E.; Kell, D.B.; Barker, R.A.; Grainger, D.J.; et al. Huntington Disease Patients and Transgenic Mice Have Similar Pro-Catabolic Serum Metabolite Profiles. Brain 2006, 129, 877–886. [Google Scholar] [CrossRef] [PubMed]
- Cheng, M.-L.; Chang, K.-H.; Wu, Y.-R.; Chen, C.-M. Metabolic Disturbances in Plasma as Biomarkers for Huntington’s Disease. J. Nutr. Biochem. 2016, 31, 38–44. [Google Scholar] [CrossRef] [PubMed]
- McGarry, A.; Gaughan, J.; Hackmyer, C.; Lovett, J.; Khadeer, M.; Shaikh, H.; Pradhan, B.; Ferraro, T.N.; Wainer, I.W.; Moaddel, R. Cross-Sectional Analysis of Plasma and CSF Metabolomic Markers in Huntington’s Disease for Participants of Varying Functional Disability: A Pilot Study. Sci. Rep. 2020, 10, 20490. [Google Scholar] [CrossRef] [PubMed]
- Kim, A.; Lalonde, K.; Truesdell, A.; Gomes Welter, P.; Brocardo, P.S.; Rosenstock, T.R.; Gil-Mohapel, J. New Avenues for the Treatment of Huntington’s Disease. Int. J. Mol. Sci. 2021, 22, 8363. [Google Scholar] [CrossRef] [PubMed]
- Houten, S.M.; Watanabe, M.; Auwerx, J. Endocrine Functions of Bile Acids. EMBO J. 2006, 25, 1419–1425. [Google Scholar] [CrossRef] [PubMed]
- de Aguiar Vallim, T.Q.; Tarling, E.J.; Edwards, P.A. Pleiotropic Roles of Bile Acids in Metabolism. Cell Metab. 2013, 17, 657–669. [Google Scholar] [CrossRef] [PubMed]
- Russell, D.W. The Enzymes, Regulation, and Genetics of Bile Acid Synthesis. Annu. Rev. Biochem. 2003, 72, 137–174. [Google Scholar] [CrossRef] [PubMed]
- Bjorkhem, I.; Andersson, U.; Ellis, E.; Alvelius, G.; Ellegard, L.; Diczfalusy, U.; Sjovall, J.; Einarsson, C. From Brain to Bile. Evidence That Conjugation and Omega-Hydroxylation Are Important for Elimination of 24S-Hydroxycholesterol (Cerebrosterol) in Humans. J. Biol. Chem. 2001, 276, 37004–37010. [Google Scholar] [CrossRef] [PubMed]
- Midtvedt, T. Microbial Bile Acid Transformation. Am. J. Clin. Nutr. 1974, 27, 1341–1347. [Google Scholar] [CrossRef] [PubMed]
- Hofmann, A.F.; Hagey, L.R. Bile Acids: Chemistry, Pathochemistry, Biology, Pathobiology, and Therapeutics. Cell Mol. Life Sci. 2008, 65, 2461–2483. [Google Scholar] [CrossRef] [PubMed]
- Mertens, K.L.; Kalsbeek, A.; Soeters, M.R.; Eggink, H.M. Bile Acid Signaling Pathways from the Enterohepatic Circulation to the Central Nervous System. Front. Neurosci. 2017, 11, 617. [Google Scholar] [CrossRef] [PubMed]
- Ackerman, H.D.; Gerhard, G.S. Bile Acids in Neurodegenerative Disorders. Front. Aging Neurosci. 2016, 8, 263. [Google Scholar] [CrossRef] [PubMed]
- Hurley, M.J.; Bates, R.; Macnaughtan, J.; Schapira, A.H. V Bile Acids and Neurological Disease. Pharmacol. Ther. 2022, 240, 108311. [Google Scholar] [CrossRef] [PubMed]
- MahmoudianDehkordi, S.; Arnold, M.; Nho, K.; Ahmad, S.; Jia, W.; Xie, G.; Louie, G.; Kueider-Paisley, A.; Moseley, M.A.; Thompson, J.W.; et al. Altered Bile Acid Profile Associates with Cognitive Impairment in Alzheimer’s Disease-An Emerging Role for Gut Microbiome. Alzheimers Dement. 2019, 15, 76–92. [Google Scholar] [CrossRef] [PubMed]
- Nie, K.; Li, Y.; Zhang, J.; Gao, Y.; Qiu, Y.; Gan, R.; Zhang, Y.; Wang, L. Distinct Bile Acid Signature in Parkinson’s Disease With Mild Cognitive Impairment. Front. Neurol. 2022, 13, 897867. [Google Scholar] [CrossRef] [PubMed]
- Ghaisas, S.; Maher, J.; Kanthasamy, A. Gut Microbiome in Health and Disease: Linking the Microbiome-Gut-Brain Axis and Environmental Factors in the Pathogenesis of Systemic and Neurodegenerative Diseases. Pharmacol. Ther. 2016, 158, 52–62. [Google Scholar] [CrossRef] [PubMed]
- Yarandi, S.S.; Peterson, D.A.; Treisman, G.J.; Moran, T.H.; Pasricha, P.J. Modulatory Effects of Gut Microbiota on the Central Nervous System: How Gut Could Play a Role in Neuropsychiatric Health and Diseases. J. Neurogastroenterol. Motil. 2016, 22, 201–212. [Google Scholar] [CrossRef] [PubMed]
- Fang, P.; Kazmi, S.A.; Jameson, K.G.; Hsiao, E.Y. The Microbiome as a Modifier of Neurodegenerative Disease Risk. Cell Host Microbe 2020, 28, 201–222. [Google Scholar] [CrossRef] [PubMed]
- Singh, A.; Dawson, T.M.; Kulkarni, S. Neurodegenerative Disorders and Gut-Brain Interactions. J. Clin. Investig. 2021, 131, e143775. [Google Scholar] [CrossRef] [PubMed]
- Leoni, V.; Mariotti, C.; Tabrizi, S.J.; Valenza, M.; Wild, E.J.; Henley, S.M.D.; Hobbs, N.Z.; Mandelli, M.L.; Grisoli, M.; Björkhem, I.; et al. Plasma 24S-Hydroxycholesterol and Caudate MRI in Pre-Manifest and Early Huntington’s Disease. Brain 2008, 131, 2851–2859. [Google Scholar] [CrossRef] [PubMed]
- Chang, K.-H.; Cheng, M.-L.; Lo, C.-J.; Fan, C.-M.; Wu, Y.-R.; Chen, C.-M. Alternations of Lipoprotein Profiles in the Plasma as Biomarkers of Huntington’s Disease. Cells 2023, 12, 385. [Google Scholar] [CrossRef] [PubMed]
- Unified Huntington’s Disease Rating Scale: Reliability and Consistency. Huntington Study Group. Mov. Disord. 1996, 11, 136–142. [CrossRef] [PubMed]
- Oosterloo, M.; de Greef, B.T.A.; Bijlsma, E.K.; Durr, A.; Tabrizi, S.J.; Estevez-Fraga, C.; de Die-Smulders, C.E.M.; Roos, R.A.C. Disease Onset in Huntington’s Disease: When Is the Conversion? Mov. Disord. Clin. Pract. 2021, 8, 352–360. [Google Scholar] [CrossRef] [PubMed]
- Moffitt, H.; McPhail, G.D.; Woodman, B.; Hobbs, C.; Bates, G.P. Formation of Polyglutamine Inclusions in a Wide Range of Non-CNS Tissues in the HdhQ150 Knock-in Mouse Model of Huntington’s Disease. PLoS ONE 2009, 4, e8025. [Google Scholar] [CrossRef] [PubMed]
- McCourt, A.C.; O’Donovan, K.L.; Ekblad, E.; Sand, E.; Craufurd, D.; Rosser, A.; Sanders, D.; Stoy, N.; Rickards, H.; Wierup, N.; et al. Characterization of Gastric Mucosa Biopsies Reveals Alterations in Huntington’s Disease. PLoS Curr. 2015, 7, ecurrents.hd.858b4cc7f235df068387e9c20c436a79. [Google Scholar] [CrossRef] [PubMed]
- Wasser, C.I.; Mercieca, E.-C.; Kong, G.; Hannan, A.J.; McKeown, S.J.; Glikmann-Johnston, Y.; Stout, J.C. Gut Dysbiosis in Huntington’s Disease: Associations among Gut Microbiota, Cognitive Performance and Clinical Outcomes. Brain Commun. 2020, 2, fcaa110. [Google Scholar] [CrossRef] [PubMed]
- Stan, T.L.; Soylu-Kucharz, R.; Burleigh, S.; Prykhodko, O.; Cao, L.; Franke, N.; Sjögren, M.; Haikal, C.; Hållenius, F.; Björkqvist, M. Increased Intestinal Permeability and Gut Dysbiosis in the R6/2 Mouse Model of Huntington’s Disease. Sci. Rep. 2020, 10, 18270. [Google Scholar] [CrossRef] [PubMed]
- Di Pardo, A.; Monyror, J.; Morales, L.C.; Kadam, V.; Lingrell, S.; Maglione, V.; Wozniak, R.W.; Sipione, S. Mutant Huntingtin Interacts with the Sterol Regulatory Element-Binding Proteins and Impairs Their Nuclear Import. Hum. Mol. Genet. 2020, 29, 418–431. [Google Scholar] [CrossRef] [PubMed]
- Leoni, V.; Mariotti, C.; Nanetti, L.; Salvatore, E.; Squitieri, F.; Bentivoglio, A.R.; Bandettini di Poggio, M.; Piacentini, S.; Monza, D.; Valenza, M.; et al. Whole Body Cholesterol Metabolism Is Impaired in Huntington’s Disease. Neurosci. Lett. 2011, 494, 245–249. [Google Scholar] [CrossRef] [PubMed]
- Bragg, R.M.; Coffey, S.R.; Cantle, J.P.; Hu, S.; Singh, S.; Legg, S.R.; McHugh, C.A.; Toor, A.; Zeitlin, S.O.; Kwak, S.; et al. Huntingtin Loss in Hepatocytes Is Associated with Altered Metabolism, Adhesion, and Liver Zonation. Life Sci. Alliance 2023, 6, e202302098. [Google Scholar] [CrossRef] [PubMed]
- Parry, G.J.; Rodrigues, C.M.P.; Aranha, M.M.; Hilbert, S.J.; Davey, C.; Kelkar, P.; Low, W.C.; Steer, C.J. Safety, Tolerability, and Cerebrospinal Fluid Penetration of Ursodeoxycholic Acid in Patients with Amyotrophic Lateral Sclerosis. Clin. Neuropharmacol. 2010, 33, 17–21. [Google Scholar] [CrossRef] [PubMed]
- Lalić-Popović, M.; Vasović, V.; Milijašević, B.; Goločorbin-Kon, S.; Al-Salami, H.; Mikov, M. Deoxycholic Acid as a Modifier of the Permeation of Gliclazide through the Blood Brain Barrier of a Rat. J. Diabetes Res. 2013, 2013, 598603. [Google Scholar] [CrossRef] [PubMed]
- Quinn, M.; McMillin, M.; Galindo, C.; Frampton, G.; Pae, H.Y.; DeMorrow, S. Bile Acids Permeabilize the Blood Brain Barrier after Bile Duct Ligation in Rats via Rac1-Dependent Mechanisms. Dig. Liver Dis. 2014, 46, 527–534. [Google Scholar] [CrossRef] [PubMed]
- Palmela, I.; Correia, L.; Silva, R.F.M.; Sasaki, H.; Kim, K.S.; Brites, D.; Brito, M.A. Hydrophilic Bile Acids Protect Human Blood-Brain Barrier Endothelial Cells from Disruption by Unconjugated Bilirubin: An in Vitro Study. Front. Neurosci. 2015, 9, 80. [Google Scholar] [CrossRef] [PubMed]
- Higashi, T.; Watanabe, S.; Tomaru, K.; Yamazaki, W.; Yoshizawa, K.; Ogawa, S.; Nagao, H.; Minato, K.; Maekawa, M.; Mano, N. Unconjugated Bile Acids in Rat Brain: Analytical Method Based on LC/ESI-MS/MS with Chemical Derivatization and Estimation of Their Origin by Comparison to Serum Levels. Steroids 2017, 125, 107–113. [Google Scholar] [CrossRef] [PubMed]
- St-Pierre, M.V.; Kullak-Ublick, G.A.; Hagenbuch, B.; Meier, P.J. Transport of Bile Acids in Hepatic and Non-Hepatic Tissues. J. Exp. Biol. 2001, 204, 1673–1686. [Google Scholar] [CrossRef] [PubMed]
- Hanafi, N.I.; Mohamed, A.S.; Sheikh Abdul Kadir, S.H.; Othman, M.H.D. Overview of Bile Acids Signaling and Perspective on the Signal of Ursodeoxycholic Acid, the Most Hydrophilic Bile Acid, in the Heart. Biomolecules 2018, 8, 159. [Google Scholar] [CrossRef] [PubMed]
- Khalaf, K.; Tornese, P.; Cocco, A.; Albanese, A. Tauroursodeoxycholic Acid: A Potential Therapeutic Tool in Neurodegenerative Diseases. Transl. Neurodegener. 2022, 11, 33. [Google Scholar] [CrossRef] [PubMed]
- Lo, A.C.; Callaerts-Vegh, Z.; Nunes, A.F.; Rodrigues, C.M.P.; D’Hooge, R. Tauroursodeoxycholic Acid (TUDCA) Supplementation Prevents Cognitive Impairment and Amyloid Deposition in APP/PS1 Mice. Neurobiol. Dis. 2013, 50, 21–29. [Google Scholar] [CrossRef] [PubMed]
- Bell, S.M.; Barnes, K.; Clemmens, H.; Al-Rafiah, A.R.; Al-Ofi, E.A.; Leech, V.; Bandmann, O.; Shaw, P.J.; Blackburn, D.J.; Ferraiuolo, L.; et al. Ursodeoxycholic Acid Improves Mitochondrial Function and Redistributes Drp1 in Fibroblasts from Patients with Either Sporadic or Familial Alzheimer’s Disease. J. Mol. Biol. 2018, 430, 3942–3953. [Google Scholar] [CrossRef] [PubMed]
- Castro-Caldas, M.; Carvalho, A.N.; Rodrigues, E.; Henderson, C.J.; Wolf, C.R.; Rodrigues, C.M.P.; Gama, M.J. Tauroursodeoxycholic Acid Prevents MPTP-Induced Dopaminergic Cell Death in a Mouse Model of Parkinson’s Disease. Mol. Neurobiol. 2012, 46, 475–486. [Google Scholar] [CrossRef] [PubMed]
- Rosa, A.I.; Duarte-Silva, S.; Silva-Fernandes, A.; Nunes, M.J.; Carvalho, A.N.; Rodrigues, E.; Gama, M.J.; Rodrigues, C.M.P.; Maciel, P.; Castro-Caldas, M. Tauroursodeoxycholic Acid Improves Motor Symptoms in a Mouse Model of Parkinson’s Disease. Mol. Neurobiol. 2018, 55, 9139–9155. [Google Scholar] [CrossRef] [PubMed]
- Rosa, A.I.; Fonseca, I.; Nunes, M.J.; Moreira, S.; Rodrigues, E.; Carvalho, A.N.; Rodrigues, C.M.P.; Gama, M.J.; Castro-Caldas, M. Novel Insights into the Antioxidant Role of Tauroursodeoxycholic Acid in Experimental Models of Parkinson’s Disease. Biochim. Biophys. Acta Mol. Basis Dis. 2017, 1863, 2171–2181. [Google Scholar] [CrossRef] [PubMed]
- Bazzari, F.H.; Abdallah, D.M.; El-Abhar, H.S. Chenodeoxycholic Acid Ameliorates AlCl3-Induced Alzheimer’s Disease Neurotoxicity and Cognitive Deterioration via Enhanced Insulin Signaling in Rats. Molecules 2019, 24, 1992. [Google Scholar] [CrossRef]
- Keene, C.D.; Rodrigues, C.M.; Eich, T.; Linehan-Stieers, C.; Abt, A.; Kren, B.T.; Steer, C.J.; Low, W.C. A Bile Acid Protects against Motor and Cognitive Deficits and Reduces Striatal Degeneration in the 3-Nitropropionic Acid Model of Huntington’s Disease. Exp. Neurol. 2001, 171, 351–360. [Google Scholar] [CrossRef] [PubMed]
- Rodrigues, C.M.; Stieers, C.L.; Keene, C.D.; Ma, X.; Kren, B.T.; Low, W.C.; Steer, C.J. Tauroursodeoxycholic Acid Partially Prevents Apoptosis Induced by 3-Nitropropionic Acid: Evidence for a Mitochondrial Pathway Independent of the Permeability Transition. J. Neurochem. 2000, 75, 2368–2379. [Google Scholar] [CrossRef] [PubMed]
- Keene, C.D.; Rodrigues, C.M.P.; Eich, T.; Chhabra, M.S.; Steer, C.J.; Low, W.C. Tauroursodeoxycholic Acid, a Bile Acid, Is Neuroprotective in a Transgenic Animal Model of Huntington’s Disease. Proc. Natl. Acad. Sci. USA 2002, 99, 10671–10676. [Google Scholar] [CrossRef] [PubMed]
- Björkhem, I.; Lütjohann, D.; Diczfalusy, U.; Ståhle, L.; Ahlborg, G.; Wahren, J. Cholesterol Homeostasis in Human Brain: Turnover of 24S-Hydroxycholesterol and Evidence for a Cerebral Origin of Most of This Oxysterol in the Circulation. J. Lipid Res. 1998, 39, 1594–1600. [Google Scholar] [CrossRef] [PubMed]
- Meaney, S.; Hassan, M.; Sakinis, A.; Lütjohann, D.; von Bergmann, K.; Wennmalm, A.; Diczfalusy, U.; Björkhem, I. Evidence That the Major Oxysterols in Human Circulation Originate from Distinct Pools of Cholesterol: A Stable Isotope Study. J. Lipid Res. 2001, 42, 70–78. [Google Scholar] [CrossRef] [PubMed]
- Meaney, S.; Lütjohann, D.; Diczfalusy, U.; Björkhem, I. Formation of Oxysterols from Different Pools of Cholesterol as Studied by Stable Isotope Technique: Cerebral Origin of Most Circulating 24S-Hydroxycholesterol in Rats, but Not in Mice. Biochim. Biophys. Acta 2000, 1486, 293–298. [Google Scholar] [CrossRef] [PubMed]
- Lütjohann, D.; von Bergmann, K. 24S-Hydroxycholesterol: A Marker of Brain Cholesterol Metabolism. Pharmacopsychiatry 2003, 36 (Suppl. S2), S102–S106. [Google Scholar] [CrossRef] [PubMed]
- Leoni, V.; Caccia, C. 24S-Hydroxycholesterol in Plasma: A Marker of Cholesterol Turnover in Neurodegenerative Diseases. Biochimie 2013, 95, 595–612. [Google Scholar] [CrossRef] [PubMed]
- Fuchs, M. Bile Acid Regulation of Hepatic Physiology: III. Regulation of Bile Acid Synthesis: Past Progress and Future Challenges. Am. J. Physiol. Gastrointest. Liver Physiol. 2003, 284, G551–G557. [Google Scholar] [CrossRef] [PubMed]
- Sato, Y.; Atarashi, K.; Plichta, D.R.; Arai, Y.; Sasajima, S.; Kearney, S.M.; Suda, W.; Takeshita, K.; Sasaki, T.; Okamoto, S.; et al. Novel Bile Acid Biosynthetic Pathways Are Enriched in the Microbiome of Centenarians. Nature 2021, 599, 458–464. [Google Scholar] [CrossRef] [PubMed]


| HC | HD | |||
|---|---|---|---|---|
| (n = 20) | preHD (n = 9) | symHD (n = 24) | All (n = 33) | |
| Age (years) | 52.7 ± 9.0 | 32.0 ± 7.9 * | 50.0 ± 10.9 | 45.1 ± 13.1 |
| Male (%) | 10 (50.00) | 1 (11.1) ** | 16 (66.7) | 17 (51.5) |
| BMI | 23.4 ± 2.6 | 20.2 ± 2.4 | 21.9 ± 2.5 | 21.4 ± 2.6 |
| Pre-prandial glucose (mg/dL) | 93.3 ± 10.7 | 87.8 ± 7.9 | 98.3 ± 16.6 | 96.7 ± 17.2 |
| UHDRS | ||||
| Total motor score | 0 | 39.2 ± 19.3 | ||
| Independence scale | 100 | 66.7 ± 25.9 | ||
| Functional capacity | 13 | 6.4 ± 4.2 | ||
| Disease burden | 272.6 ± 182.3 | 457.5 ± 124.6 | ||
| Medications | ||||
| Tetrabenazine (%) | 0 | 0 | 6 (25.00) | |
| Antipsychotics (%) | 0 | 0 | 11 (45.9) | |
| Antidepressants (%) | 0 | 0 | 8 (33.3) | |
| Benzodiazepines (%) | 3 (15.00) | 0 | 14 (58.3) | |
| Ubidecarenone (%) | 0 | 0 | 10 (41.7) | |
| Metabolite Name (nM) | HC (n = 20) | HD | ||
|---|---|---|---|---|
| preHD (n = 9) | symHD (n = 24) | All (n = 33) | ||
| 5-Cholenic acid-3ß-ol | 6.90 ± 2.82 | 6.54 ± 2.11 | 5.27 ± 1.91 | 5.62 ± 2.01 |
| Lithocholic acid (LCA) | 17.02 ± 9.03 | 12.88 ± 8.84 | 17.05 ± 9.53 | 15.90 ± 9.38 |
| Isolithocholic acid (Iso-LCA) | 18.78 ±15.55 | 3.37 ± 2.91 | 9.72 ± 9.57 | 7.81 ± 8.62 * |
| 5ß-Cholenic acid-7a-ol-3-one | 1.21 ± 0.1.23 | 2.38 ± 2.53 | 1.34 ± 1.24 | 1.62 ± 1.71 |
| 5ß-Cholanic acid-3ß, 12a-diol | 53.39 ± 42.77 | 31.58 ± 14.88 | 38.68 ±38.94 | 37.21 ± 35.2 |
| Deoxycholic acid (DCA) | 341.78 ± 340.09 | 388.33 ± 308.75 | 429.91 ± 419.96 | 421.31 ± 394.83 |
| Chenodeoxycholic acid (CDCA) | 326.70 ± 423.08 | 652.67 ± 575.75 | 346.15 ± 318.6 | 429.75 ± 418.38 |
| Ursodeoxycholic acid (UDCA) | 107.38 ± 104.4 | 247.76 ± 176.28 | 120.37 ± 130.07 | 155.11 ± 152.47 |
| Cholic acid (CA) | 155.51 ± 218.78 | 219.84 ± 211.44 | 153.75 ± 164.29 | 171.78 ± 177.4 |
| Hyocholic acid (HCA) | 9.95 ± 7.77 | 19.24 ± 17.67 | 12.31 ± 8.15 | 14.20 ± 11.64 |
| Glycochenodeoxycholic acid (GCDCA) | 580.02 ± 426.35 | 2110.80 ± 1731.74 | 2061.12 ± 2287.53 | 2074.67 ± 2123.98 * |
| Glycodeoxycholic acid (GDCA) | 195.36 ± 220.9 | 591.26 ± 962.54 | 893.26 ± 1880.57 | 810.89 ± 1670.98 |
| Glycoursodeoxycholic acid (GUDCA) | 74.39 ± 74.08 | 414.84 ± 306.45 | 275.43 ± 422.03 | 313.45 ± 394.29 * |
| Glycocholic acid (GCA) | 194.78 ± 268.59 | 903.47 ± 1777.84 | 517.41 ± 931.16 | 622.70 ± 1201.61 |
| Glycohyocholic acid (GHCA) | 11.15 ±12.37 | 21.86 ± 13.34 | 25.98 ± 29.53 | 24.86 ± 25.97 |
| Tauroursodeoxycholic acid (TUDCA) | 4.98 ± 6.73 | 35.47 ± 54.85 | 11.26 ± 20.97 | 17.86 ± 34.47 |
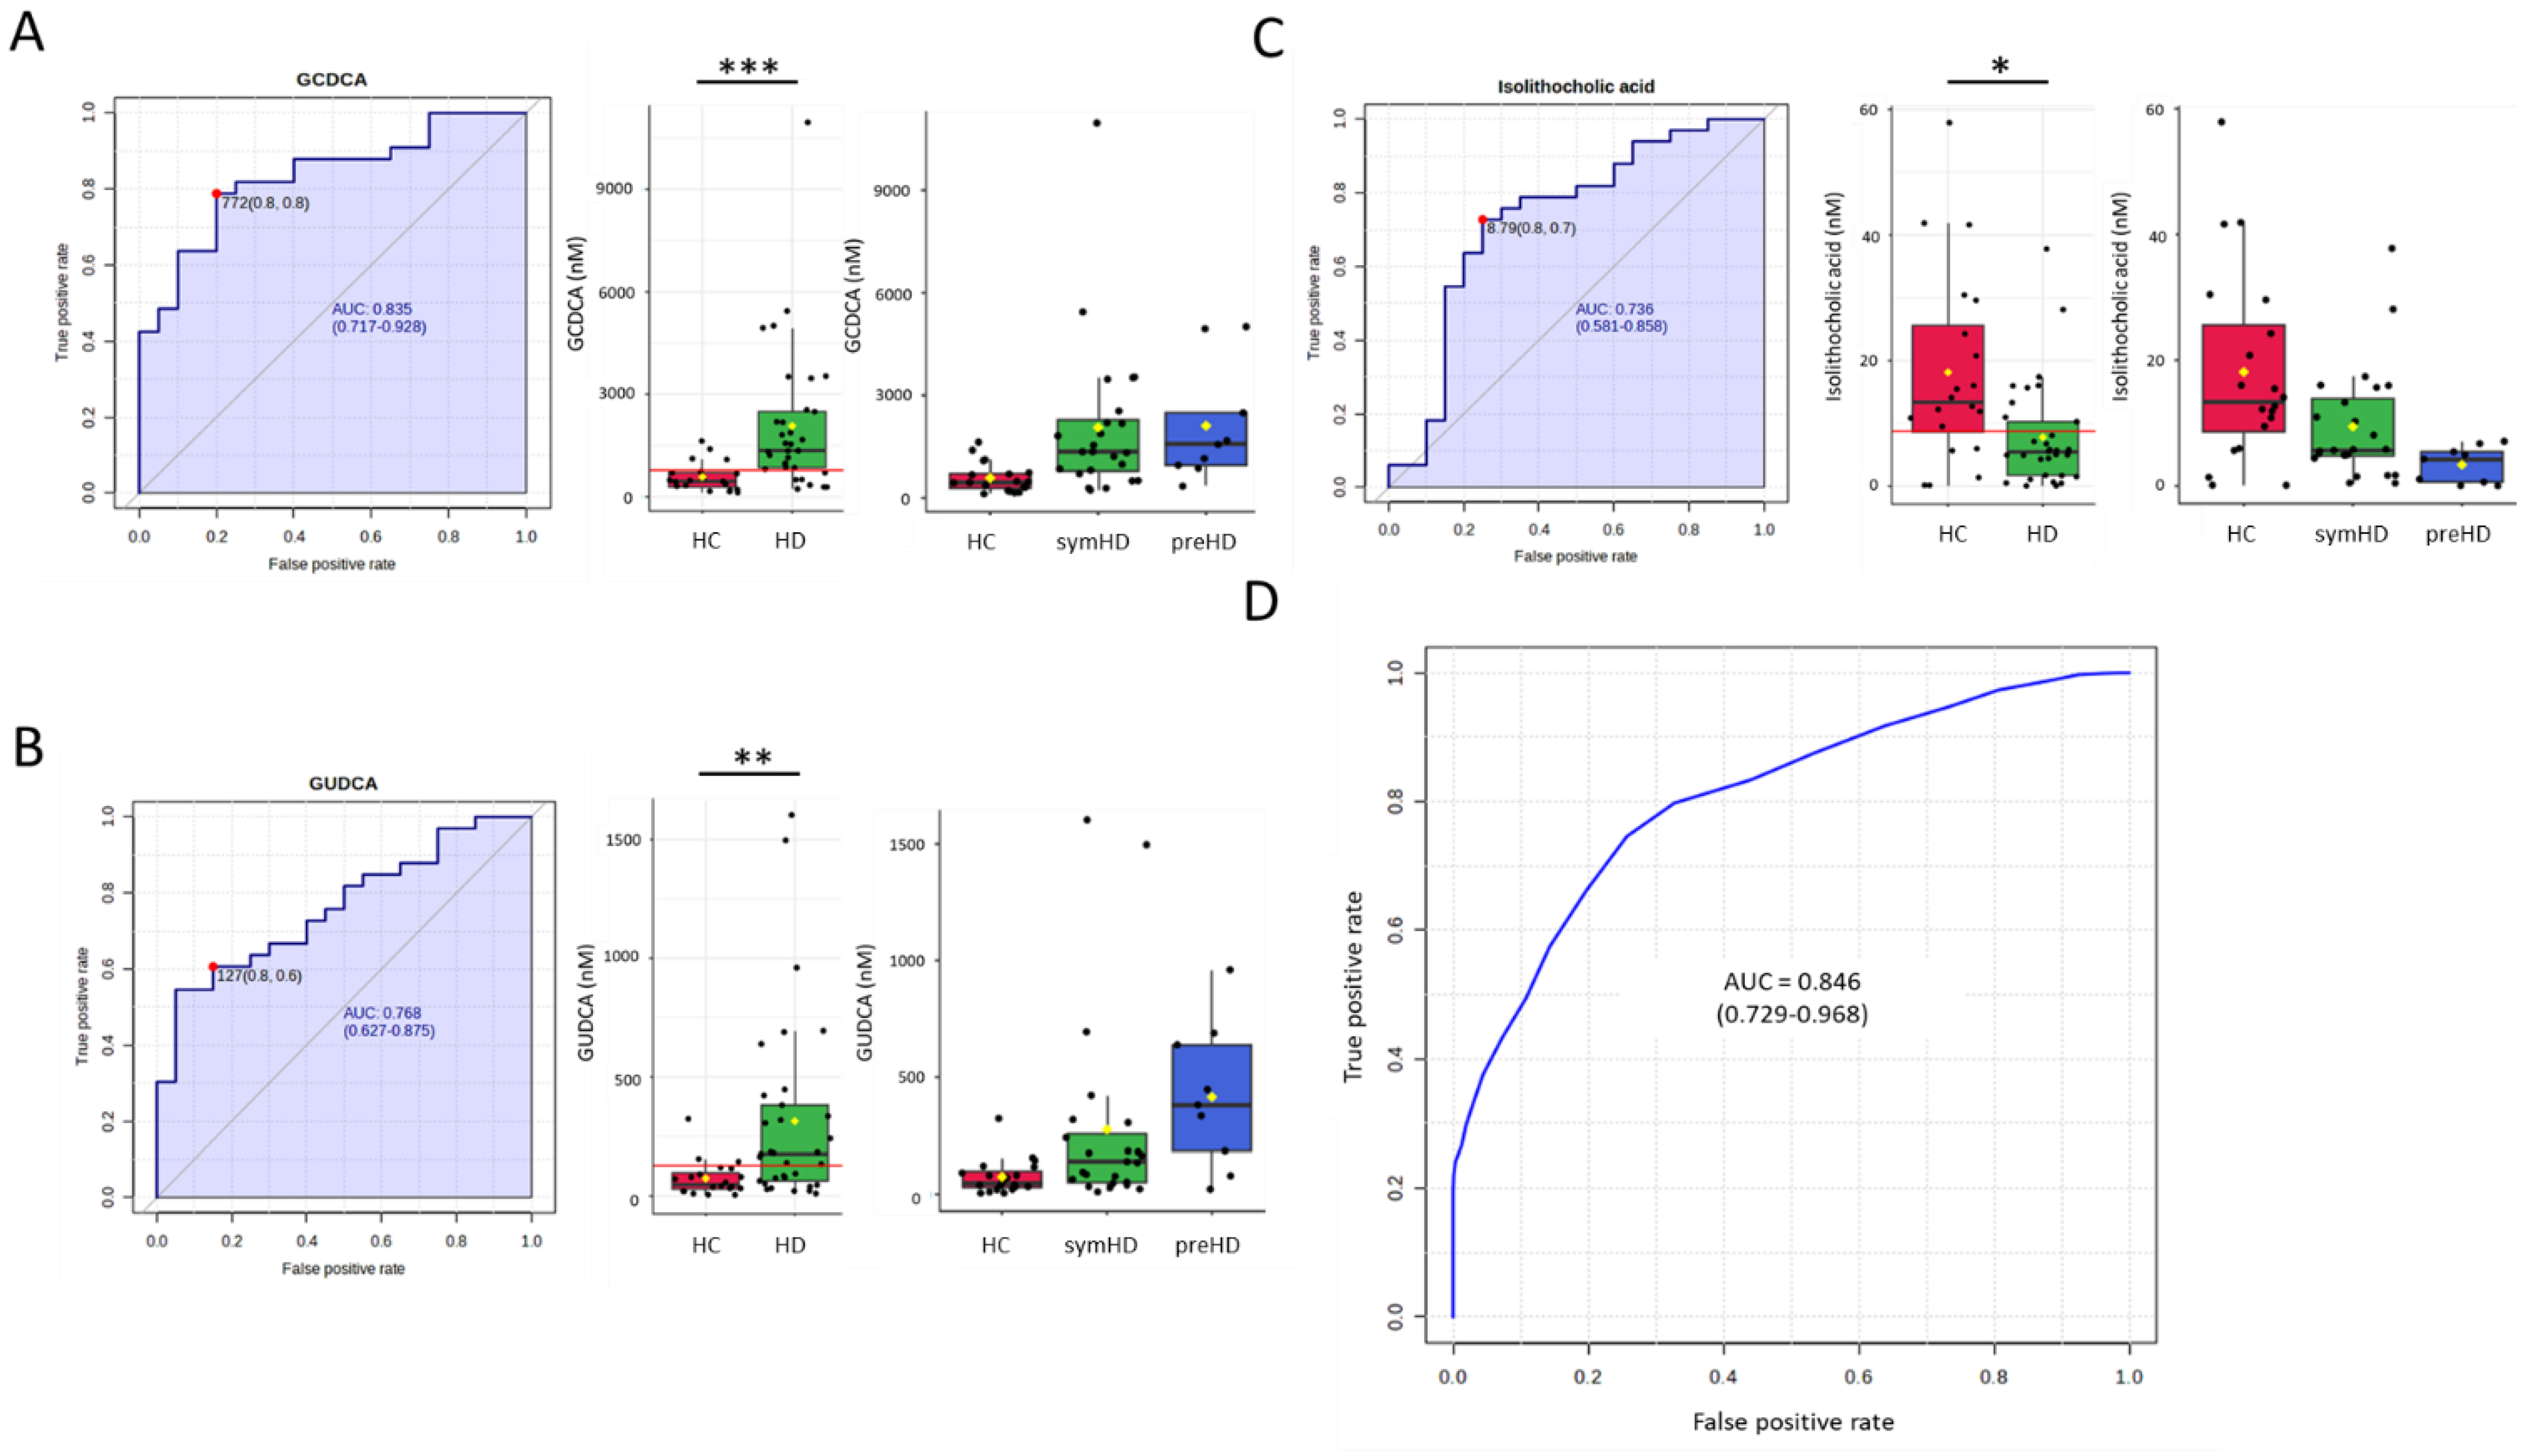
| GCDCA | GUDCA | iso-LCA | SVM Algorithm | |
|---|---|---|---|---|
| HD vs. HC | 0.835 * | 0.768 | 0.736 | 0.846 |
| symHD vs. HC | 0.828 * | 0.738 | 0.696 | 0.809 |
| preHD vs. HC | 0.872 | 0.878 * | 0.878 * | 0.888 |
| preHD vs. symHD | - | 0.713 | 0.755 * | - |
| Informative about Metabolic Process | Ratios or Total Amounts (nM) | HC | preHD | symHD |
|---|---|---|---|---|
| Bile acid synthesis: alternative vs. classical pathway | CDCA/CA | 3.08 ± 2.27 | 4.17 ± 3.70 | 3.18 ± 2.15 |
| Conversion from primary to secondary BA by the gut microbiome | DCA/CA GDCA/CA | 7.53 ± 8.44 4.86 ± 6.44 | 4.06 ± 4.04 5.35 ± 5.96 | 5.82 ± 6.11 13.45 ± 20.19 |
| Neuroprotective BA | UDCA + GUDCA + TUDCA | 186.75 ± 153.95 | 698.07 ± 485.28 * | 407.05 ± 532.92 |
| Neurotoxic BA | GCA + GDCA + GCDCA | 970.16 ± 804.02 | 3605.53 ± 4034.86 | 3471.79 ± 4983.96 * |
| Neuroprotective BA/ Neurotoxic BA | UDCA + GUDCA + TUDCA/ GCA + GDCA + GCDCA | 0.31 ± 0.38 | 0.25 ± 0.17 | 0.19 ± 0.17 |
| Considered to be neurotoxic BA | GCA, GDCA, GCDCA |  Hydrophilicity |
| GHCA, HCA | ||
| LCA | ||
| DCA | ||
| Considered to be neuroprotective BA | CDCA | |
| CA | ||
| UDCA, GUDCA, TUDCA |
Disclaimer/Publisher’s Note: The statements, opinions and data contained in all publications are solely those of the individual author(s) and contributor(s) and not of MDPI and/or the editor(s). MDPI and/or the editor(s) disclaim responsibility for any injury to people or property resulting from any ideas, methods, instructions or products referred to in the content. |
© 2024 by the authors. Licensee MDPI, Basel, Switzerland. This article is an open access article distributed under the terms and conditions of the Creative Commons Attribution (CC BY) license (https://creativecommons.org/licenses/by/4.0/).
Share and Cite
Chiang, P.-I.; Chang, K.-H.; Tang, H.-Y.; Wu, Y.-R.; Cheng, M.-L.; Chen, C.-M. Diagnostic Potential of Alternations of Bile Acid Profiles in the Plasma of Patients with Huntington’s Disease. Metabolites 2024, 14, 394. https://doi.org/10.3390/metabo14070394
Chiang P-I, Chang K-H, Tang H-Y, Wu Y-R, Cheng M-L, Chen C-M. Diagnostic Potential of Alternations of Bile Acid Profiles in the Plasma of Patients with Huntington’s Disease. Metabolites. 2024; 14(7):394. https://doi.org/10.3390/metabo14070394
Chicago/Turabian StyleChiang, Ping-I, Kuo-Hsuan Chang, Hsiang-Yu Tang, Yih-Ru Wu, Mei-Ling Cheng, and Chiung-Mei Chen. 2024. "Diagnostic Potential of Alternations of Bile Acid Profiles in the Plasma of Patients with Huntington’s Disease" Metabolites 14, no. 7: 394. https://doi.org/10.3390/metabo14070394
APA StyleChiang, P.-I., Chang, K.-H., Tang, H.-Y., Wu, Y.-R., Cheng, M.-L., & Chen, C.-M. (2024). Diagnostic Potential of Alternations of Bile Acid Profiles in the Plasma of Patients with Huntington’s Disease. Metabolites, 14(7), 394. https://doi.org/10.3390/metabo14070394