
Peripheral Lipid Signatures, Metabolic Dysfunction, and Pathophysiology in Schizophrenia Spectrum Disorders
 , ,
, ,  and
and
Abstract
:1. Introduction
2. Materials and Methods
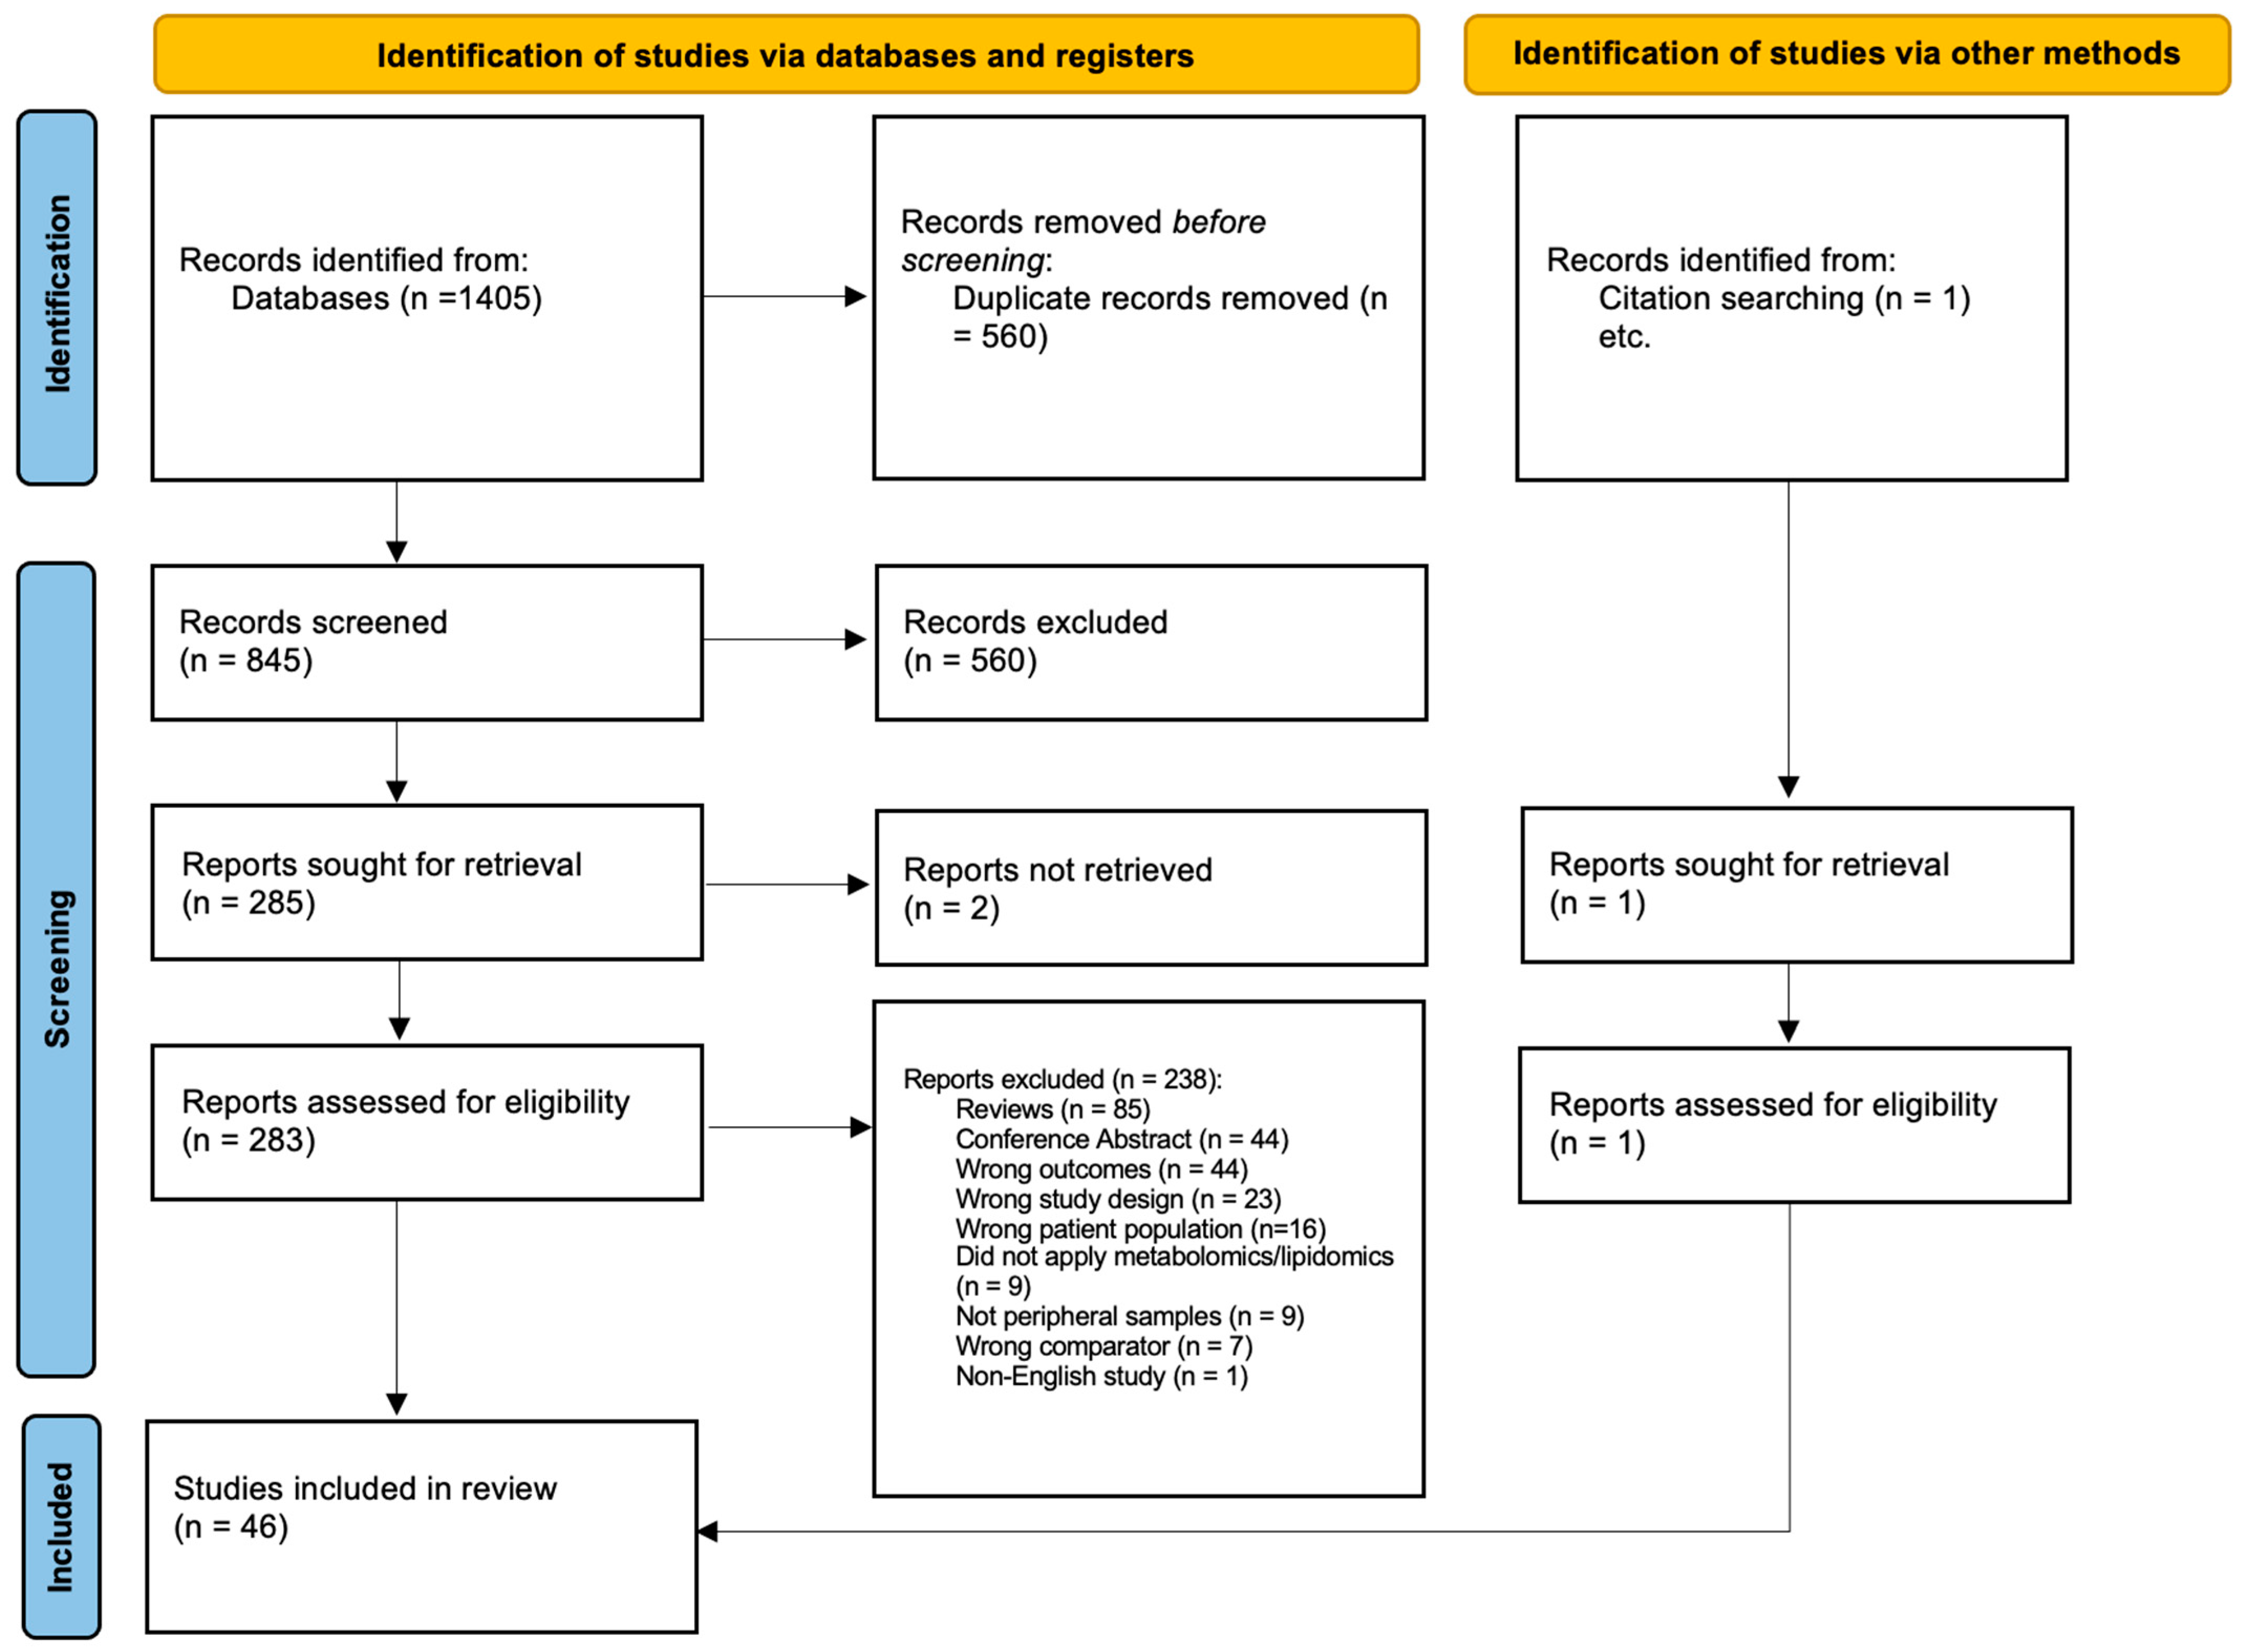
2.1. Search Strategy
2.2. Study Selection
2.3. Data Extraction
2.4. Risk of Bias Assessment
3. Results
4. Discussion
4.1. Aim 1: Lipidomic Signatures in Minimally AP-Treated Patients Compared to Healthy Controls
4.2. Aim 2: Investigate the Impact of APs on Lipidomic Signatures by Comparing AP-Treated Patients with SSDs to HCs or by Comparing Pre-to-Post AP Treatment in Patients
4.3. Limitations and Recommendations for Future Studies
5. Conclusions
Supplementary Materials
Author Contributions
Funding
Institutional Review Board Statement
Informed Consent Statement
Data Availability Statement
Conflicts of Interest
References
- Tandon, R.; Nasrallah, H.A.; Keshavan, M.S. Schizophrenia, “Just the Facts” 4. Clinical Features and Conceptualization. Schizophr. Res. 2009, 110, 1–23. [Google Scholar] [CrossRef]
- De Hert, M.; Schreurs, V.; Vancampfort, D.; Van Winkel, R. Metabolic Syndrome in People with Schizophrenia: A Review. World Psychiatry 2009, 8, 15. [Google Scholar] [CrossRef] [PubMed]
- Hennekens, C.H.; Hennekens, A.R.; Hollar, D.; Casey, D.E. Schizophrenia and Increased Risks of Cardiovascular Disease. Am. Heart J. 2005, 150, 1115–1121. [Google Scholar] [CrossRef] [PubMed]
- Rajkumar, A.P.; Horsdal, H.T.; Wimberley, T.; Cohen, D.; Mors, O.; Børglum, A.D.; Gasse, C. Endogenous and Antipsychotic-Related Risks for Diabetes Mellitus in Young People With Schizophrenia: A Danish Population-Based Cohort Study. Am. J. Psychiatry 2017, 174, 686–694. [Google Scholar] [CrossRef]
- Correll, C.U.; Robinson, D.G.; Schooler, N.R.; Brunette, M.F.; Mueser, K.T.; Rosenheck, R.A.; Marcy, P.; Addington, J.; Estroff, S.E.; Robinson, J.; et al. Cardiometabolic Risk in Patients with First-Episode Schizophrenia Spectrum Disorders: Baseline Results from the RAISE-ETP Study. JAMA Psychiatry 2014, 71, 1350–1363. [Google Scholar] [CrossRef]
- Misiak, B.; Stańczykiewicz, B.; Łaczmański, Ł.; Frydecka, D. Lipid Profile Disturbances in Antipsychotic-Naive Patients with First-Episode Non-Affective Psychosis: A Systematic Review and Meta-Analysis. Schizophr. Res. 2017, 190, 18–27. [Google Scholar] [CrossRef] [PubMed]
- Kucukgoncu, S.; Kosir, U.; Zhou, E.; Sullivan, E.; Srihari, V.H.; Tek, C. Glucose Metabolism Dysregulation at the Onset of Mental Illness Is Not Limited to First Episode Psychosis: A Systematic Review and Meta-Analysis. Early Interv. Psychiatry 2019, 13, 1021–1031. [Google Scholar] [CrossRef] [PubMed]
- Mitchell, A.J.; Vancampfort, D.; Sweers, K.; Van Winkel, R.; Yu, W.; De Hert, M. Prevalence of Metabolic Syndrome and Metabolic Abnormalities in Schizophrenia and Related Disorders—A Systematic Review and Meta-Analysis. Schizophr. Bull. 2013, 39, 306. [Google Scholar] [CrossRef]
- Heald, A.; Pendlebury, J.; Anderson, S.; Narayan, V.; Guy, M.; Gibson, M.; Haddad, P.; Livingston, M. Lifestyle Factors and the Metabolic Syndrome in Schizophrenia: A Cross-Sectional Study. Ann. Gen. Psychiatry 2017, 16, 12. [Google Scholar] [CrossRef]
- Rummel-Kluge, C.; Komossa, K.; Schwarz, S.; Hunger, H.; Schmid, F.; Lobos, C.A.; Kissling, W.; Davis, J.M.; Leucht, S. Head-to-Head Comparisons of Metabolic Side Effects of Second Generation Antipsychotics in the Treatment of Schizophrenia: A Systematic Review and Meta-Analysis. Schizophr. Res. 2010, 123, 225–233. [Google Scholar] [CrossRef]
- Pillinger, T.; McCutcheon, R.A.; Vano, L.; Mizuno, Y.; Arumuham, A.; Hindley, G.; Beck, K.; Natesan, S.; Efthimiou, O.; Cipriani, A.; et al. Comparative Effects of 18 Antipsychotics on Metabolic Function in Patients with Schizophrenia, Predictors of Metabolic Dysregulation, and Association with Psychopathology: A Systematic Review and Network Meta-Analysis. Lancet Psychiatry 2020, 7, 64–77. [Google Scholar] [CrossRef]
- Newcomer, J.W. Second-Generation (Atypical) Antipsychotics and Metabolic Effects: A Comprehensive Literature Review. CNS Drugs 2005, 19 (Suppl. 1), 1–93. [Google Scholar] [CrossRef] [PubMed]
- Monnerie, S.; Comte, B.; Ziegler, D.; Morais, J.A.; Pujos-Guillot, E.; Gaudreau, P. Metabolomic and Lipidomic Signatures of Metabolic Syndrome and Its Physiological Components in Adults: A Systematic Review. Sci. Rep. 2020, 10, 669. [Google Scholar] [CrossRef] [PubMed]
- Horrobin, D.F. The Membrane Phospholipid Hypothesis as a Biochemical Basis for the Neurodevelopmental Concept of Schizophrenia. Schizophr. Res. 1998, 30, 193–208. [Google Scholar] [CrossRef] [PubMed]
- Wu, Z.; Bagarolo, G.I.; Thoröe-Boveleth, S.; Jankowski, J. “Lipidomics”: Mass Spectrometric and Chemometric Analyses of Lipids. Adv. Drug Deliv. Rev. 2020, 159, 294–307. [Google Scholar] [CrossRef] [PubMed]
- Cajka, T.; Fiehn, O. Toward Merging Untargeted and Targeted Methods in Mass Spectrometry-Based Metabolomics and Lipidomics. Anal. Chem. 2016, 88, 524–545. [Google Scholar] [CrossRef]
- Sethi, S.; Hayashi, M.A.F.; Barbosa, B.S.; Pontes, J.G.M.; Tasic, L.; Brietzke, E. Lipidomics, Biomarkers, and Schizophrenia: A Current Perspective. Adv. Exp. Med. Biol. 2017, 965, 265–290. [Google Scholar] [CrossRef]
- Zhuo, C.; Hou, W.; Tian, H.; Wang, L.; Li, R. Lipidomics of the Brain, Retina, and Biofluids: From the Biological Landscape to Potential Clinical Application in Schizophrenia. Transl. Psychiatry 2020, 10, 391. [Google Scholar] [CrossRef]
- Udhane, S.S.; Legeza, B.; Marti, N.; Hertig, D.; DIserens, G.; Nuoffer, J.M.; Vermathen, P.; Flück, C.E. Combined Transcriptome and Metabolome Analyses of Metformin Effects Reveal Novel Links between Metabolic Networks in Steroidogenic Systems. Sci. Rep. 2017, 7, 8652. [Google Scholar] [CrossRef]
- Bicikova, M.; Hill, M.; Ripova, D.; Mohr, P.; Hampl, R. Determination of Steroid Metabolome as a Possible Tool for Laboratory Diagnosis of Schizophrenia. J. Steroid Biochem. Mol. Biol. 2013, 133, 77–83. [Google Scholar] [CrossRef]
- Wishart, D.S.; Guo, A.C.; Oler, E.; Wang, F.; Anjum, A.; Peters, H.; Dizon, R.; Sayeeda, Z.; Tian, S.; Lee, B.L.; et al. HMDB 5.0: The Human Metabolome Database for 2022. Nucleic Acids Res. 2022, 50, D622–D631. [Google Scholar] [CrossRef]
- Moola, S.; Munn, Z.; Tufanaru, C.; Aromataris, E.; Sears, K.; Sfetcu, R.; Currie, M.; Qureshi, R.; Mattis, P.; Lisy, K.; et al. Chapter 7: Systematic Reviews of Etiology and Risk. Available online: https://synthesismanual.jbi.global (accessed on 14 April 2023).
- Cai, H.L.; Li, H.D.; Yan, X.Z.; Sun, B.; Zhang, Q.; Yan, M.; Zhang, W.Y.; Jiang, P.; Zhu, R.H.; Liu, Y.P.; et al. Metabolomic Analysis of Biochemical Changes in the Plasma and Urine of First-Episode Neuroleptic-Naïve Schizophrenia Patients after Treatment with Risperidone. J. Proteome Res. 2012, 11, 4338–4350. [Google Scholar] [CrossRef] [PubMed]
- Cui, G.; Qing, Y.; Li, M.; Sun, L.; Zhang, J.; Feng, L.; Li, J.; Chen, T.; Wang, J.; Wan, C. Salivary Metabolomics Reveals That Metabolic Alterations Precede the Onset of Schizophrenia. J. Proteome Res. 2021, 20, 5010–5023. [Google Scholar] [CrossRef]
- Kaddurah-Daouk, R.; Mcevoy, J.; Baillie, R.; Zhu, H.; Yao, J.K.; Nimgaonkar, V.L.; Buckley, P.F.; Keshavan, M.S.; Georgiades, A.; Nasrallah, H.A. Impaired Plasmalogens in Patients with Schizophrenia. Psychiatry Res. 2012, 198, 347–352. [Google Scholar] [CrossRef]
- Kriisa, K.; Leppik, L.; Balõtšev, R.; Ottas, A.; Soomets, U.; Koido, K.; Volke, V.; Rgen Innos, J.; Haring, L.; Vasar, E.; et al. Profiling of Acylcarnitines in First Episode Psychosis before and after Antipsychotic Treatment. J. Proteome Res. 2017, 16, 3558–3566. [Google Scholar] [CrossRef] [PubMed]
- Leppik, L.; Parksepp, M.; Janno, S.; Koido, K.; Haring, L.; Vasar, E.; Zilmer, M. Profiling of Lipidomics before and after Antipsychotic Treatment in First-Episode Psychosis. Eur. Arch. Psychiatry Clin. Neurosci. 2020, 270, 59–70. [Google Scholar] [CrossRef] [PubMed]
- Liu, Y.; Song, X.; Liu, X.; Pu, J.; Gui, S.; Xu, S.; Tian, L.; Zhong, X.; Zhao, L.; Wang, H.; et al. Alteration of Lipids and Amino Acids in Plasma Distinguish Schizophrenia Patients from Controls: A Targeted Metabolomics Study. Psychiatry Clin. Neurosci. 2021, 75, 138–144. [Google Scholar] [CrossRef]
- Qiao, Y.; Zhang, L.; He, S.; Wen, H.; Yu, Y.-M.; Cao, C.-H.; Li, H.-F. Plasma Metabonomics Study of First-Episode Schizophrenia Treated with Olanzapine in Female Patients. Neurosci. Lett. 2016, 617, 270–276. [Google Scholar] [CrossRef]
- Schwarz, E.; Whitfield, P.; Nahnsen, S.; Wang, L.; Major, H.; Leweke, F.M.; Koethe, D.; Lio, P.; Bahn, S. Alterations of Primary Fatty Acid Amides in Serum of Patients with Severe Mental Illness. Front. Biosci. (Elite Ed) 2011, 3, 308–314. [Google Scholar] [CrossRef]
- Yan, L.; Zhou, J.; Wang, D.; Si, D.; Liu, Y.; Zhong, L.; Yin, Y.; Yan, L. Unbiased Lipidomic Profiling Reveals Metabolomic Changes during the Onset and Antipsychotics Treatment of Schizophrenia Disease. Metabolomics 2018, 14, 80. [Google Scholar] [CrossRef]
- Lee, J.; Costa-Dookhan, K.; Panganiban, K.; MacKenzie, N.; Treen, Q.C.; Chintoh, A.; Remington, G.; Müller, D.J.; Sockalingam, S.; Gerretsen, P.; et al. Metabolomic Signatures Associated with Weight Gain and Psychosis Spectrum Diagnoses: A Pilot Study. Front. Psychiatry 2023, 14, 1169787. [Google Scholar] [CrossRef] [PubMed]
- Shang, P.; Man-Choi Ho, A.; Tufvesson-Alm, M.; Lindberg, D.R.; Grant, C.W.; Orhan, F.; Eren, F.; Bhat, M.; Engberg, G.; Schwieler, L.; et al. Identification of Cerebrospinal Fluid and Serum Metabolomic Biomarkers in First Episode Psychosis Patients. Transl. Psychiatry 2022, 12, 229. [Google Scholar] [CrossRef]
- Song, M.; Liu, Y.; Zhou, J.; Shi, H.; Su, X.; Shao, M.; Yang, Y.; Wang, X.; Zhao, J.; Guo, D.; et al. Potential Plasma Biomarker Panels Identification for the Diagnosis of First-Episode Schizophrenia and Monitoring Antipsychotic Monotherapy with the Use of Metabolomics Analyses. Psychiatry Res. 2023, 321, 115070. [Google Scholar] [CrossRef]
- Wang, Z.; Yuan, X.; Zhu, Z.; Pang, L.; Ding, S.; Li, X.; Kang, Y.; Hei, G.; Zhang, L.; Zhang, X.; et al. Multiomics Analyses Reveal Microbiome-Gut-Brain Crosstalk Centered on Aberrant Gamma-Aminobutyric Acid and Tryptophan Metabolism in Drug-Naïve Patients with First-Episode Schizophrenia. Schizophr. Bull. 2024, 50, 187–198. [Google Scholar] [CrossRef] [PubMed]
- Wang, X.; Xie, J.; Ma, H.; Li, G.; Li, M.; Li, S.; Sun, X.; Zhao, Y.; Sun, W.; Yang, S.; et al. The Relationship between Alterations in Plasma Metabolites and Treatment Responses in Antipsychotic-Naïve Female Patients with Schizophrenia. World J. Biol. Psychiatry 2024, 25, 106–115. [Google Scholar] [CrossRef] [PubMed]
- Su, Q.; Bi, F.; Yang, S.; Yan, H.; Sun, X.; Wang, J.; Qiu, Y.; Li, M.; Li, S.; Li, J. Identification of Plasma Biomarkers in Drug-Naïve Schizophrenia Using Targeted Metabolomics. Psychiatry Investig. 2023, 20, 818–825. [Google Scholar] [CrossRef]
- Liu, M.L.; Zheng, P.; Liu, Z.; Xu, Y.; Mu, J.; Guo, J.; Huang, T.; Meng, H.Q.; Xie, P. GC-MS Based Metabolomics Identification of Possible Novel Biomarkers for Schizophrenia in Peripheral Blood Mononuclear Cells. Mol. Biosyst. 2014, 10, 2398–2406. [Google Scholar] [CrossRef]
- Al Awam, K.; Haußleiter, I.S.; Dudley, E.; Donev, R.; Brüne, M.; Juckel, G.; Thome, J. Multiplatform Metabolome and Proteome Profiling Identifies Serum Metabolite and Protein Signatures as Prospective Biomarkers for Schizophrenia. J. Neural Transm. 2015, 122, 111–122. [Google Scholar] [CrossRef]
- Avigdor, B.E.; Yang, K.; Shinder, I.; Orsburn, B.C.; Rais, R.; Kano, S.I.; Sawa, A.; Pevsner, J. Characterization of Antipsychotic Medications, Amino Acid Signatures, and Platelet-Activating Factor in First-Episode Psychosis. Biomark. Neuropsychiatry 2021, 5, 100045. [Google Scholar] [CrossRef]
- Campeau, A.; Mills, R.H.; Stevens, T.; Rossitto, L.A.; Meehan, M.; Dorrestein, P.; Daly, R.; Nguyen, T.T.; Gonzalez, D.J.; Jeste, D.V.; et al. Multi-Omics of Human Plasma Reveals Molecular Features of Dysregulated Inflammation and Accelerated Aging in Schizophrenia. Mol. Psychiatry 2022, 27, 1217–1225. [Google Scholar] [CrossRef]
- Cui, G.; Qing, Y.; Hu, X.; Wang, P.; Sun, L.; Yang, X.; Jiang, J.; Zhang, J.; Wang, H.; Feng, L.; et al. Serum Metabolomic Profiling Based on Fourier Transform-Ion Cyclotron Resonance-Mass Spectrometry: Do the Dysfunctions of Metabolic Pathways Reveal a Universal Risk of Oxidative Stress in Schizophrenia? Antioxid. Redox Signal. 2020, 33, 679–688. [Google Scholar] [CrossRef] [PubMed]
- Dickens, A.M.; Borgan, F.; Laurikainen, H.; Lamichhane, S.; Marques, T.; Rönkkö, T.; Veronese, M.; Lindeman, T.; Hyötyläinen, T.; Howes, O.; et al. Links between Central CB1-Receptor Availability and Peripheral Endocannabinoids in Patients with First Episode Psychosis. NPJ Schizophr. 2020, 6, 21. [Google Scholar] [CrossRef]
- Du, Y.; Chen, L.; Li, X.S.; Li, X.L.; Xu, X.D.; Tai, S.B.; Yang, G.L.; Tang, Q.; Liu, H.; Liu, S.H.; et al. Metabolomic Identification of Exosome-Derived Biomarkers for Schizophrenia: A Large Multicenter Study. Schizophr. Bull. 2021, 47, 615–623. [Google Scholar] [CrossRef] [PubMed]
- Fukushima, T.; Iizuka, H.; Yokota, A.; Suzuki, T.; Ohno, C.; Kono, Y.; Nishikiori, M.; Seki, A.; Ichiba, H.; Watanabe, Y.; et al. Quantitative Analyses of Schizophrenia-Associated Metabolites in Serum: Serum D-Lactate Levels Are Negatively Correlated with Gamma-Glutamylcysteine in Medicated Schizophrenia Patients. PLoS ONE 2014, 9, e101652. [Google Scholar] [CrossRef] [PubMed]
- He, Y.; Yu, Z.; Giegling, I.; Xie, L.; Hartmann, A.M.; Prehn, C.; Adamski, J.; Kahn, R.; Li, Y.; Illig, T.; et al. Schizophrenia Shows a Unique Metabolomics Signature in Plasma. Transl. Psychiatry 2012, 2, e149. [Google Scholar] [CrossRef]
- Koike, S.; Bundo, M.; Iwamoto, K.; Suga, M.; Kuwabara, H.; Ohashi, Y.; Shinoda, K.; Takano, Y.; Iwashiro, N.; Satomura, Y.; et al. A Snapshot of Plasma Metabolites in First-Episode Schizophrenia: A Capillary Electrophoresis Time-of-Flight Mass Spectrometry Study. Transl. Psychiatry 2014, 4, e379. [Google Scholar] [CrossRef]
- Liu, L.; Zhao, J.; Chen, Y.; Feng, R. Metabolomics Strategy Assisted by Transcriptomics Analysis to Identify Biomarkers Associated with Schizophrenia. Anal. Chim. Acta 2020, 1140, 18–29. [Google Scholar] [CrossRef]
- Mednova, I.A.; Chernonosov, A.A.; Kasakin, M.F.; Kornetova, E.G.; Semke, A.V.; Bokhan, N.A.; Koval, V.V.; Ivanova, S.A. Amino Acid and Acylcarnitine Levels in Chronic Patients with Schizophrenia: A Preliminary Study. Metabolites 2021, 11, 34. [Google Scholar] [CrossRef]
- Orešič, M.; Tang, J.; Seppänen-Laakso, T.; Mattila, I.; Saarni, S.E.; Saarni, S.I.; Lönnqvist, J.; Sysi-Aho, M.; Hyötyläinen, T.; Perälä, J.; et al. Metabolome in Schizophrenia and Other Psychotic Disorders: A General Population-Based Study. Genome Med. 2011, 3, 1–14. [Google Scholar] [CrossRef]
- Orešič, M.; Seppänen-Laakso, T.; Sun, D.; Tang, J.; Therman, S.; Viehman, R.; Mustonen, U.; van Erp, T.G.; Hyötyläinen, T.; Thompson, P.; et al. Phospholipids and Insulin Resistance in Psychosis: A Lipidomics Study of Twin Pairs Discordant for Schizophrenia. Genome Med. 2012, 4, 1. [Google Scholar] [CrossRef]
- Paredes, R.M.; Quinones, M.; Marballi, K.; Gao, X.; Valdez, C.; Ahuja, S.S.; Velligan, D.; Walss-Bass, C. Metabolomic Profiling of Schizophrenia Patients at Risk for Metabolic Syndrome. Int. J. Neuropsychopharmacol. 2014, 17, 1139–1148. [Google Scholar] [CrossRef]
- Tasic, L.; Pontes, J.G.M.; Carvalho, M.S.; Cruz, G.; Dal Mas, C.; Sethi, S.; Pedrini, M.; Rizzo, L.B.; Zeni-Graiff, M.; Asevedo, E.; et al. Metabolomics and Lipidomics Analyses by 1H Nuclear Magnetic Resonance of Schizophrenia Patient Serum Reveal Potential Peripheral Biomarkers for Diagnosis. Schizophr. Res. 2017, 185, 182–189. [Google Scholar] [CrossRef]
- Tasic, L.; Larcerda, A.L.T.; Pontes, J.G.M.; da Costa, T.B.B.C.; Nani, J.V.; Martins, L.G.; Santos, L.A.; Nunes, M.F.Q.; Adelino, M.P.M.; Pedrini, M.; et al. Peripheral Biomarkers Allow Differential Diagnosis between Schizophrenia and Bipolar Disorder. J. Psychiatr. Res. 2019, 119, 67–75. [Google Scholar] [CrossRef] [PubMed]
- Tessier, C.; Sweers, K.; Frajerman, A.; Bergaoui, H.; Ferreri, F.; Delva, C.; Lapidus, N.; Lamaziere, A.; Roiser, J.P.; De Hert, M.; et al. Membrane Lipidomics in Schizophrenia Patients: A Correlational Study with Clinical and Cognitive Manifestations. Transl. Psychiatry 2016, 6, e906. [Google Scholar] [CrossRef]
- Wang, T.; Li, P.; Meng, X.; Zhang, J.; Liu, Q.; Jia, C.; Meng, N.; Zhu, K.; Lv, D.; Sun, L.; et al. An Integrated Pathological Research for Precise Diagnosis of Schizophrenia Combining LC-MS/1H NMR Metabolomics and Transcriptomics. Clin. Chim. Acta 2022, 524, 84–95. [Google Scholar] [CrossRef] [PubMed]
- Wood, P.L.; Unfried, G.; Whitehead, W.; Phillipps, A.; Wood, J.A. Dysfunctional Plasmalogen Dynamics in the Plasma and Platelets of Patients with Schizophrenia. Schizophr. Res. 2015, 161, 506–510. [Google Scholar] [CrossRef]
- Yang, X.; Sun, L.; Zhao, A.; Hu, X.; Qing, Y.; Jiang, J.; Yang, C.; Xu, T.; Wang, P.; Liu, J.; et al. Serum Fatty Acid Patterns in Patients with Schizophrenia: A Targeted Metabonomics Study. Transl. Psychiatry 2017, 7, e1176. [Google Scholar] [CrossRef] [PubMed]
- Kaddurah-Daouk, R.; McEvoy, J.; Baillie, R.A.; Lee, D.; Yao, J.K.; Doraiswamy, P.M.; Krishnan, K.R.R. Metabolomic Mapping of Atypical Antipsychotic Effects in Schizophrenia. Mol. Psychiatry 2007, 12, 934–945. [Google Scholar] [CrossRef]
- Li, N.; Yang, P.; Tang, M.; Liu, Y.; Guo, W.; Lang, B.; Wang, J.; Wu, H.; Tang, H.; Yu, Y.; et al. Reduced Erythrocyte Membrane Polyunsaturated Fatty Acid Levels Indicate Diminished Treatment Response in Patients with Multi- versus First-Episode Schizophrenia. Schizophrenia 2022, 8, 7. [Google Scholar] [CrossRef]
- Wang, D.; Sun, X.; Maziade, M.; Mao, W.; Zhang, C.; Wang, J.; Cao, B. Characterising Phospholipids and Free Fatty Acids in Patients with Schizophrenia: A Case-Control Study. World J. Biol. Psychiatry 2021, 22, 161–174. [Google Scholar] [CrossRef]
- Xuan, J.; Pan, G.; Qiu, Y.; Yang, L.; Su, M.; Liu, Y.; Chen, J.; Feng, G.; Fang, Y.; Jia, W.; et al. Metabolomic Profiling to Identify Potential Serum Biomarkers for Schizophrenia and Risperidone Action. J. Proteome Res. 2011, 10, 5433–5443. [Google Scholar] [CrossRef] [PubMed]
- Qing, Y.; Wang, P.; Cui, G.; Zhang, J.; Liang, K.; Xia, Z.; Wang, P.; He, L.; Jia, W. Targeted Metabolomics Reveals Aberrant Profiles of Serum Bile Acids in Patients with Schizophrenia. Schizophrenia 2022, 8, 65. [Google Scholar] [CrossRef] [PubMed]
- Parksepp, M.; Haring, L.; Kilk, K.; Taalberg, E.; Kangro, R.; Zilmer, M.; Vasar, E. A Marked Low-Grade Inflammation and a Significant Deterioration in Metabolic Status in First-Episode Schizophrenia: A Five-Year Follow-Up Study. Metabolites 2022, 12, 983. [Google Scholar] [CrossRef]
- Qiu, Y.; Dong, Y.; Sun, W.; Li, G.; Li, M.J.; Zhao, Y.; Jiang, C.; Li, J. Metabolic Biomarkers of Risperidone-Induced Weight Gain in Drug-Naïve Patients with Schizophrenia. Front. Psychiatry 2023, 14, 1144873. [Google Scholar] [CrossRef] [PubMed]
- Liu, J.; Xiu, M.; Liu, H.; Wang, J.; Li, X. Plasma Lysophosphatidylcholine and Lysophosphatidylethanolamine Levels Were Associated With the Therapeutic Response to Olanzapine in Female Antipsychotics-Naïve First-Episode Patients With Schizophrenia. Front. Pharmacol. 2021, 12, 735196. [Google Scholar] [CrossRef] [PubMed]
- Cao, B.; Jin, M.; Brietzke, E.; McIntyre, R.S.; Wang, D.; Rosenblat, J.D.; Ragguett, R.M.; Zhang, C.; Sun, X.; Rong, C.; et al. Serum Metabolic Profiling Using Small Molecular Water-Soluble Metabolites in Individuals with Schizophrenia: A Longitudinal Study Using a Pre–Post-Treatment Design. Psychiatry Clin. Neurosci. 2019, 73, 100–108. [Google Scholar] [CrossRef]
- Farooqui, A.A.; Horrocks, L.A.; Farooqui, T. Glycerophospholipids in Brain: Their Metabolism, Incorporation into Membranes, Functions, and Involvement in Neurological Disorders. Chem. Phys. Lipids 2000, 106, 1–29. [Google Scholar] [CrossRef]
- Van Meer, G.; Voelker, D.R.; Feigenson, G.W. Membrane Lipids: Where They Are and How They Behave. Nat. Rev. Mol. Cell Biol. 2008, 9, 112. [Google Scholar] [CrossRef]
- Pilon, M. Revisiting the Membrane-Centric View of Diabetes. Lipids Health Dis. 2016, 15, 167. [Google Scholar] [CrossRef]
- Reddan, J.M.; White, D.J.; Macpherson, H.; Scholey, A.; Pipingas, A. Glycerophospholipid Supplementation as a Potential Intervention for Supporting Cerebral Structure in Older Adults. Front. Aging Neurosci. 2018, 10, 49. [Google Scholar] [CrossRef]
- Quach, T.T.; Stratton, H.J.; Khanna, R.; Kolattukudy, P.E.; Honnorat, J.; Meyer, K.; Duchemin, A.M. Intellectual Disability: Dendritic Anomalies and Emerging Genetic Perspectives. Acta Neuropathol. 2021, 141, 139–158. [Google Scholar] [CrossRef] [PubMed]
- Penzes, P.; Cahill, M.E.; Jones, K.A.; Vanleeuwen, J.E.; Woolfrey, K.M. Dendritic Spine Pathology in Neuropsychiatric Disorders. Nat. Neurosci. 2011, 14, 285–293. [Google Scholar] [CrossRef]
- De Carvalho, C.C.C.R.; Caramujo, M.J. The Various Roles of Fatty Acids. Molecules 2018, 23, 2583. [Google Scholar] [CrossRef] [PubMed]
- Witte, A.V.; Kerti, L.; Hermannstädter, H.M.; Fiebach, J.B.; Schreiber, S.J.; Schuchardt, J.P.; Hahn, A.; Flöel, A. Long-Chain Omega-3 Fatty Acids Improve Brain Function and Structure in Older Adults. Cereb. Cortex 2014, 24, 3059–3068. [Google Scholar] [CrossRef] [PubMed]
- Dighriri, I.M.; Alsubaie, A.M.; Hakami, F.M.; Hamithi, D.M.; Alshekh, M.M.; Khobrani, F.A.; Dalak, F.E.; Hakami, A.A.; Alsueaadi, E.H.; Alsaawi, L.S.; et al. Effects of Omega-3 Polyunsaturated Fatty Acids on Brain Functions: A Systematic Review. Cureus 2022, 14, e30091. [Google Scholar] [CrossRef] [PubMed]
- Sears, B.; Perry, M. The Role of Fatty Acids in Insulin Resistance. Lipids Health Dis. 2015, 14, 1–9. [Google Scholar] [CrossRef]
- Law, M.H.; Cotton, R.G.H.; Berger, G.E. The Role of Phospholipases A2 in Schizophrenia. Mol. Psychiatry 2006, 11, 547–556. [Google Scholar] [CrossRef]
- Moyer, C.E.; Shelton, M.A.; Sweet, R.A. Dendritic Spine Alterations in Schizophrenia. Neurosci. Lett. 2015, 601, 46–53. [Google Scholar] [CrossRef]
- Ziegler, A.B.; Tavosanis, G. Glycerophospholipids—Emerging Players in Neuronal Dendrite Branching and Outgrowth. Dev. Biol. 2019, 451, 25–34. [Google Scholar] [CrossRef]
- Haijma, S.V.; Van Haren, N.; Cahn, W.; Koolschijn, P.C.M.P.; Hulshoff Pol, H.E.; Kahn, R.S. Brain Volumes in Schizophrenia: A Meta-Analysis in over 18 000 Subjects. Schizophr. Bull. 2013, 39, 1129–1138. [Google Scholar] [CrossRef]
- Bowie, C.R.; Harvey, P.D. Cognitive Deficits and Functional Outcome in Schizophrenia. Neuropsychiatr. Dis. Treat. 2006, 2, 531. [Google Scholar] [CrossRef] [PubMed]
- Kasai, H.; Fukuda, M.; Watanabe, S.; Hayashi-Takagi, A.; Noguchi, J. Structural Dynamics of Dendritic Spines in Memory and Cognition. Trends Neurosci. 2010, 33, 121–129. [Google Scholar] [CrossRef] [PubMed]
- Du, J.; Xi, L.; Zhang, Z.; Ge, X.; Li, W.; Peng, W.; Jiang, X.; Liu, W.; Zhao, N.; Wang, X.; et al. Metabolic Remodeling of Glycerophospholipids Acts as a Signature of Dulaglutide and Liraglutide Treatment in Recent-Onset Type 2 Diabetes Mellitus. Front. Endocrinol. 2023, 13, 1097612. [Google Scholar] [CrossRef]
- Chen, W.; Zhao, H.; Li, Y. Mitochondrial Dynamics in Health and Disease: Mechanisms and Potential Targets. Signal Transduct. Target. Ther. 2023, 8, 1–25. [Google Scholar] [CrossRef] [PubMed]
- Belosludtsev, K.N.; Belosludtseva, N.V.; Dubinin, M.V. Diabetes Mellitus, Mitochondrial Dysfunction and Ca2+-Dependent Permeability Transition Pore. Int. J. Mol. Sci. 2020, 21, 6559. [Google Scholar] [CrossRef]
- Hishikawa, D.; Hashidate, T.; Shimizu, T.; Shindou, H. Diversity and Function of Membrane Glycerophospholipids Generated by the Remodeling Pathway in Mammalian Cells. J. Lipid Res. 2014, 55, 799–807. [Google Scholar] [CrossRef] [PubMed]
- Amminger, G.P.; Schäfer, M.R.; Klier, C.M.; Slavik, J.M.; Holzer, I.; Holub, M.; Goldstone, S.; Whitford, T.J.; McGorry, P.D.; Berk, M. Decreased Nervonic Acid Levels in Erythrocyte Membranes Predict Psychosis in Help-Seeking Ultra-High-Risk Individuals. Mol. Psychiatry 2012, 17, 1150–1152. [Google Scholar] [CrossRef]
- Strassnig, M.; Brar, J.S.; Ganguli, R. Dietary Fatty Acid and Antioxidant Intake in Community-Dwelling Patients Suffering from Schizophrenia. Schizophr. Res. 2005, 76, 343–351. [Google Scholar] [CrossRef]
- Stogios, N.; Smith, E.; Asgariroozbehani, R.; Hamel, L.; Gdanski, A.; Selby, P.; Sockalingam, S.; Graff-Guerrero, A.; Taylor, V.H.; Agarwal, S.M.; et al. Exploring Patterns of Disturbed Eating in Psychosis: A Scoping Review. Nutrients 2020, 12, 3883. [Google Scholar] [CrossRef]
- Berger, M.; Nelson, B.; Markulev, C.; Yuen, H.P.; Schäfer, M.R.; Mossaheb, N.; Schlögelhofer, M.; Smesny, S.; Hickie, I.B.; Berger, G.E.; et al. Relationship between Polyunsaturated Fatty Acids and Psychopathology in the NEURAPRO Clinical Trial. Front. Psychiatry 2019, 10, 393. [Google Scholar] [CrossRef]
- Barber, M.N.; Risis, S.; Yang, C.; Meikle, P.J.; Staples, M.; Febbraio, M.A.; Bruce, C.R. Plasma Lysophosphatidylcholine Levels Are Reduced in Obesity and Type 2 Diabetes. PLoS ONE 2012, 7, e41456. [Google Scholar] [CrossRef]
- Liu, J.H.; Chen, N.; Guo, Y.H.; Guan, X.N.; Wang, J.; Wang, D.; Xiu, M.H. Metabolomics-Based Understanding of the Olanzapine-Induced Weight Gain in Female First-Episode Drug-Naïve Patients with Schizophrenia. J. Psychiatr. Res. 2021, 140, 409–415. [Google Scholar] [CrossRef] [PubMed]
- Castellani, L.N.; Costa-Dookhan, K.A.; McIntyre, W.B.; Wright, D.C.; Flowers, S.A.; Hahn, M.K.; Ward, K.M. Preclinical and Clinical Sex Differences in Antipsychotic-Induced Metabolic Disturbances: A Narrative Review of Adiposity and Glucose Metabolism. J. Psychiatr. Brain Sci. 2019, 4, e190013. [Google Scholar] [CrossRef] [PubMed]
- Sariah, A.E.; Outwater, A.H.; Malima, K.I.Y. Risk and Protective Factors for Relapse among Individuals with Schizophrenia: A Qualitative Study in Dar Es Salaam, Tanzania. BMC Psychiatry 2014, 14, 240. [Google Scholar] [CrossRef] [PubMed]


| Author, Year | Analytical Tool | Diagnosis | AP-Naive Window | AP-Naive | Controls | Significantly Different Metabolic Parameters (SSDs Compared to HCs) | ||||
|---|---|---|---|---|---|---|---|---|---|---|
| N | Sex, Female (%) | Mean Age (SD) | N | Sex, Female (%) | Mean Age (SD) | |||||
| Bicikova 2013 # [20] | GC–MS | SSDs | AP-naive | 21 | 38 | Males: Median = 31 (range: 22–52) Females: Median = 35 (range: 24–52) | 32 | 41 | Males: Median = 35 (range: 23–53) Females: Median = 35 (range: 23–51) | TG *: ↑ Cholesterol *: ↑ HDL *: ↓ * Only in AP-naive FEP males compared to HCs |
| Cai 2012 [23] | UPLC–MS/MS and H-NMR | SSDs | AP-naive | 11 | 45.45 | 27.6 (9.5) | 11 | 45.45 | 27.6 (9.5) | FBG: ↓ Insulin: ↑ |
| Cui 2021 [24] | UPLC–QTOF-MS/MS | FES | AP-naive | 83 | 42.2 | 25.60 (7.42) | 78 | 50 | 23.03 (6.45) | NR |
| Kaddurah-Daouk 2012 [25] | GC + flame ionization detector | SSDs | AP-naive | 20 | 35 | 27.0 (9.8) | 17 | 66 | 37.9 (9.1) | None |
| Kriisa 2017 # [26] | FIA–MS/MS and LC–MS | FEP, SSDs | AP-naive | 38 | NR | Range: 18–45 | 37 | NR | NR | None |
| Lee 2023 [32] | LC–MS | PSDs | AP-naive or AP-free (3 weeks or less in past 3 months) | 25 | 32 | 21.8 (4.1) | 6 | 50 | 25.2 (3.5) | None |
| Leppik 2020 # [27] | FIA–MS/MS and LC–MS | FEP; SSDs | AP-naive | 53 | 39.60 | 26.2 (6.0) | 37 | 56.80 | 24.8 (5.3) | NR |
| Liu 2014 [38] | GC–MS | FES and SSDs | AP-naive (42.2% AP-treated) | 45 | 60 | 33.22 (12.9) | 50 | 56.00 | 37.26 (8.67) | NR |
| Liu 2021 [28] | LC–MS-based multiple reaction monitoring | SSDs | AP-naive | 38 | 57.9 | 34.82 (13.33) | 25 | 40 | 33.7 (12.5) | None |
| Qiao 2016 # [29] | LC–MS | FES | AP-naive | 15 | 100.00 | 28.25 (5.34) | 15 | 100 | 27.6 (6.3) | None |
| Schwarz 2011 [30] | LC–MS | FEP, SSDs | AP-naive | 70 | 34.20 | 29.3 (10.0) | 59 | 44.1 | 27.5 (5.9) | NR |
| Shang 2022 *,# [33] | UPLC–TOF-MS | FEP | Not treated for more than 30 days; mean (SD): 10 (2.9) days | 25 | 48 | 31.40 (1.96) a | 21 | 62 | 25.81 (1.34) a | None |
| Song 2023 # [34] | UPLC–QTOF-MS | SSDs | AP-naive | 43 | 42 | 27.3 (6.0) | 29 | 55 | 27.1 (4.2) | None |
| Su 2023 [37] | FIA/LS–MS | SSDs | AP-naive | 60 | 72 | 38.08 (10.48) | 36 | 56 | 38.03 (9.66) | BMI: ↓ |
| Wang X 2024 * [36] | FIA–MS/MS and LC–MS/MS | SSDs | AP-naive | 38 | 100 | 39.74 (9.83) | 19 | 100 | 40 (9.1) | None |
| Wang Z 2024 [35] | LC–MS | SSDs | AP-naive | 127 | 52.8 | 21.65 (7.55) | 92 | 62 | 22.95 (2.59) | None |
| Yan 2018 # [31] | LC–MS | SSDs | AP-naive | 20 | 45.00 | 32.1 (9.1) | 29 | 37.9 | 32.4 (7.8) | NR |
| Author, Year | Analytical Tool | Antipsychotics | Diagnosis | Antipsychotic-Treated Patients | Controls | Significantly Different Metabolic Parameters (SSDs Compared to HCs) | ||||
|---|---|---|---|---|---|---|---|---|---|---|
| N | Sex, Female (%) | Mean Age (SD) | N | Sex, Female (%) | Mean Age (SD) | |||||
| AlAwam 2015 [39] | GC–MS | ARI, CLO, CLZ, FLU, HAL, LEV, MEL, OLA, PAL, PRO, QUE, RIS, ZUC | SSDs | 26 | 23.1 | 37.27 (12.4) | 26 | 23.1 | 37.0 (10.7) | NR |
| Avigdor 2021 [40] | UHPLC–MS | ARI, CLZ, LUR, QUE, RIS, TRI, ZIP | SSDs | 31 | 38.7 | 23.77 (4.4) | 35 | 45.7 | 23.74 (3.0) | NR |
| Campeau 2022 [41] | LC–MS | RIS | SSDs | 54 | 53.7 | 53.8 (10.0) | 51 | 49 | 52.1 (11.5) | NR |
| Cui 2020 [42] | LC–MS | NR | SSDs | 54 | 66.6 | 38.4 (11.6) | 54 | 75.9 | 33.6 (9.87) | None |
| Dickens 2020 [43] | LC–QqQMS | ARI, OLA, PER, RIS | SSDs | 8 | 0 | 26.4 (3.6) | 10 | 0 | 27.18 (5.9) | None |
| Du 2021 [44] | UPLC–MS | NR | SSDs | 78 | 14.10 | 31.7 (7.7) | 66 | 42.40 | 24.5 (5.1) | NR |
| Fukushima 2014 [45] | HPLC–MS | ARI, BLO, FLU, LEV, OLA, PAL, QUE, RIS, SUL, | SSDs | 25 | 56 | 28.2 (4.4) | 27 | 55.6 | 26.5 (5.6) | BMI: ↑ |
| He 2012 [46] | LC–MS | AMI, CLZ, HAL, OLA, QUE, RIS | SSDs | 213 | 38.00 | 36.9 (11.7) | 216 | 48.10% | 38.9 (10.6) | None |
| Kaddurah-Daouk 2007 # [59] | GC + flame ionization detector | ARI, OLA, RIS | SSDs | 27 | 85.1 | 32.3 (5.0) | 16 | Matched | Matched | None |
| Koike 2014 [47] | CE–TOF-MS | NR | SSDs | 18 | 27.78 | 23.2 (5.4) | 14 | 21.43 | 25.7 (6.1) | NR |
| Li 2022 # [60] | GC–MS | ARI, AMI, CLZ, OLA, RIS, Others | SSDs | 327 | 55 | 32.70 (10.40) | 159 | 52.20 | 32.86 (10.09) | None |
| Liu 2020 [48] | LC–TOF-MS and H-NMR | NR | SSDs | 55 | 63.6 | 33.4 (12.8) | 57 | 63.2 | 44.4 (13.5) | TC: ↓ TG: ↓ HDL: ↓ |
| Mednova 2021 [49] | LC–MS/MS | NR | SSDs | 37 | 48.65 | Median: 35 (IQR: 31.00. 39.00) | 36 | 38.89 | Median: 32.5 (IQR: 28.75; 40.25) | None |
| Oresic 2011 [50] | UPLC–MS | Atypical and typical APs | SSDs | 45 | 57.8 | 53.7 (12.9) | 45 | 57.8 | 53.7 (12.9) | T2D (n): ↑ FBG: ↑ TG: ↑ Insulin: ↑ HOMA-IR: ↑ WC: ↑ HDL: ↓ |
| Oresic 2012 [51] | LC–TOF-MS | Atypical APs | SSDs | 19 | 68.4 | Median: 51 (IQR: 46.4, 55.6) | 34 | 70.6 | Median: 53.4 (IQR: 50.2, 56.6) | BMI: ↑ |
| Paredes 2014 [52] | LC–MS | ARI, CLZ, OLA. QUE, RIS, ZIP | SSDs | 60 | 23.3 | 42.5 (2.6) | 20 | 30 | 41.1. (2.6) | Insulin: ↑ |
| Parksepp 2022 [64] | (FIA)−MS/MS + (LC)−MS/MS | Various APs, types NR | FEP | 38 | 57 | 31.8 (5.9) | 58 | 56 | 24.7 (4.5) | NR |
| Qing 2022 [63] | UPLC–MS/MS | NR | SSDs | 59 | 61 | 37.48 (11.80) | 60 | 58 | 36.80 (9.74) | None |
| Shang 2022 *,# [33] | UPLC–TOF-MS | ARI, CLZ, HAL, OLA, QUE, RIS | FEP | 25 | 48 | 31.40 (1.96) a | 21 | 62 | 25.81 (1.34) a | None |
| Tasic 2017 [53] | H-NMR | OLA, QUE | SSDs | 27 | 37 | 36 (10.3) | 26 | 65.4 | 36 (13.1) | NR |
| Tasic 2019 [54] | H-NMR | CLZ, HAL, OLA, QUE, RIS | SSDs | 50 | 48 | 35.4 (9.5) | 60 | 70 | 36 (10.5) | NR |
| Tessier 2016 [55] | LC–MS | AMI, ARI, CLZ, CPZ, FLU, HAL, OLA, RIS, SER | SSDs | 74 | 35.2 | 43.8 (9.3) | 40 | 40 | 42.6 (13.2) | NR |
| Wang 2021 [61] | LC–MS | NR | SSDs | 119 | 56.30 | 29.0 (IQR: 25, 33.3) | 109 | 66.1 | 30 (IQR: 26, 33) | TC: ↑ |
| Wang 2022 [56] | LC–MS and H-NMR | NR | SSDs | 64 | NR | 44.56 (9.53) | 40 | NR | 43.76 (13.87) | NR |
| Wang X 2024 * [36] | FIA–MS/MS and LC–MS/MS | OLA, PAL, RIS | SSDs | 38 | 100 | 39.74 (9.83) | 19 | 100 | 40 (9.1) | None |
| Wood 2015 [57] | MS/MS | Atypical APs | SSDs | 23 | 21.7 | Median: 47 (range: 25–66) | 27 | 66.7 | Median: 47 (range: 25–65) | None |
| Xuan 2011 # [62] | GC–MS | NR | SSDs | 18 | 44.4 | 41.3 (16.1) | 18 | 44.4 | 41 (15.0) | NR |
| Yang 2017 [58] | UPLC–QTOF-MS | NR | SSDs | 60 | 60 | 37.2 (12.0) | 61 | 59 | 36.9 (9.7) | BMI: ↓ |
| Author, Year; Duration Treated | Analytical Tool | AP-Naive at Baseline | Diagnosis; AP Type | SSD Group | Significantly Different Metabolic Parameters (Post-Treatment Compared to Pre-Treatment) | Significantly Different Symptom Scale Scores (Post-Treatment Compared to Pre-Treatment) | ||
|---|---|---|---|---|---|---|---|---|
| N | Sex, Female (%) | Mean Age (SD) | ||||||
| Bicikova 2013 *; 26 weeks [20] | GC–MS | AP-naive | SSDs; AMI, OLA, RIS | 22 | 9 | Males: Median 31 (range: 22–52) Females: Median 35 (range: 24–52) | NR | NR |
| Cao 2019; 8 weeks [67] | LC–MS | AP-naive or no AP use for 30 days | SSDs; ARI, CLZ, CPZ, HAL, OLA, PRO, QUE, RIS, SUL, ZIP | 122 | 57.4 | 28.91 (6.21) | BMI: ↑ WC: ↑ TG: ↑ VLDL: ↑ FBG: ↓ HDL: ↓ | PANSS Total: ↓ PANSS Positive: ↓ PANSS Negative: ↓ PANS General: ↓ |
| Kaddurah-Daouk 2007 #; 2–3 weeks [59] | GC + flame ionization detector | No AP treatment for at least 3 weeks | SSDs; ARI, OLA, RIS | 27 (ARI = 4, OLA = 14, RIS = 9) | 85.1 | 32.3 (5.0) | NR | NR |
| Kriisa 2017 *; 30 weeks [26] | FIA–MS/MS and LC–MS | AP-naive | SSDs; ARI, CLZ, OLA, QUE, RIS, SER, ZIP | 36 | NR | Range: 18–45 | BMI: ↑ | PANSS Total: ↓ PANSS Positive: ↓ PANSS Negative: ↓ PANSS General: ↓ |
| Leppik 2020 *; 30 weeks [27] | FIA–MS/MS and LC–MS | AP-naive | FEP, SSDs; ARI, CLZ, OLA, PER, QUE, RIS, SER, ZIP | 44 | 39.60 | 26.20 (6.00) | BMI: ↑ | BPRS: ↓ |
| Li 2022 #; 4 weeks [60] | GC–MS | No AP use for 30 days | SSDs; ARI, AMI, CLZ, OLA, RIS | 327 | 55 | 32.70 (10.40) | NR | PANSS Total: ↓ PANSS Positive: ↓ PANSS General: ↓ |
| Liu 2021; 4 weeks [66] | UPLC–QTOF-MS/MS | AP-naive | FEP, SSDs; OLA | 25 | 100 | 27.4 (7.6) | NR | PANSS Total: ↓ PANSS Positive: ↓ PANSS General: ↓ |
| Qiao 2016 *; 4 weeks [29] | LC–MS | AP-naive | FES; OLA | 15 | 100 | 28.20 (5.34) | LDL: ↑ | PANSS Total: ↓ PANSS Positive: ↓ PANSS General: ↓ |
| Qiu 2023; 8 weeks [65] | LC–MS/MS and (FIA–MS/MS | AP-naive | SSDs; RIS | 30 | 50 | 36.40 (12.10) | Weight: ↑ BMI: ↑ WC: ↑ HC: ↑ | PANSS Total: ↓ PANSS Positive: ↓ PANSS Negative: ↓ PANSS General: ↓ |
| Shang 2022 *,#; 78 weeks [33] | UPLC–TOF-MS | AP-naive | FEP; ARI, CLZ, HAL, OLA, QUE | 25 | 48 | 31.40 (1.96) a | NR | PANSS Total: ↓ PANSS Positive: ↓ PANSS General: ↓ |
| Song 2023 *; 4–6 weeks [34] | UPLC–MS | AP-naive | SSDs; OLA | 43 | 42 | 27.30 (6.00) | BMI: ↑ TG: ↑ | PANSS Total: ↓ PANSS Positive: ↓ PANSS Negative: ↓ PANSS General: ↓ |
| Xuan 2011 #; 8 weeks [62] | GC–MS | Unmedicated (duration not specified) | SSDs; RIS | 18 | 44.4 | 41.3 (16.1) | NR | PANSS Total: ↓ PANSS Positive: ↓ PANSS Negative: ↓ |
| Yan 2018 *; 8 weeks [31] | LC–MS | AP-naive | SSDs; CLZ, HAL, OLA, QUE, RIS | 20 | 45.00 | 32.1 (9.1) | NR | NR |
| Class | Lipid, HMDB ID | Bicikova 2013 [20] | Cai 2012 [23] | Cui 2021 [24] | Kaddurah-Daouk 2012 [25] | Kriisa 2017 [26] | Lee 2023 [32] | Leppik 2020 [27] | Liu 2021 [28] | Qiao 2016 [29] | Song 2023 [34] | Su 2023 [37] | Wang X 2024 [36] | Wang Z 2024 [35] | Yan 2018 [31] | Overall Direction |
|---|---|---|---|---|---|---|---|---|---|---|---|---|---|---|---|---|
| Fatty Acyls | Stearic acid, HMDB0000827 | - | - | Downregulated | ||||||||||||
| Glycerophospholipids | LPC (14:0), HMDB0010379 | - | - | Downregulated | ||||||||||||
| Glycerophospholipids | LPC (18:0), HMDB0010384 | - | - | - | Downregulated | |||||||||||
| Glycerophospholipids | PC (O-34:2), HMDB0011151 | - | - | Downregulated | ||||||||||||
| Glycerophospholipids | PC (36:2), HMDB0000593 | - | - | Downregulated | ||||||||||||
| Glycerophospholipids | PC (O-36:0), HMDB0013406 | - | - | Downregulated | ||||||||||||
| Glycerophospholipids | PC (O-36:3), HMDB0013425 | - | - | Downregulated | ||||||||||||
| Fatty Acyls | Arachidonic acid, HMDB0001043 | + | - | Conflicting | ||||||||||||
| Fatty Acyls | Behenic acid, HMDB0000944 | + | - | Conflicting | ||||||||||||
| Fatty Acyls | Fumarylcarnitine, HMDB0013134 | - | + | Conflicting | ||||||||||||
| Glycerophospholipids | PC (32:1), HMDB0007872 | - | + | Conflicting | ||||||||||||
| Steroids and Steroid Derivatives | Glycohyocholic acid, HMDB0240607 | - | + | Conflicting | ||||||||||||
| Steroids and Steroid Derivatives | DHEAS, HMDB0001032 | + | - | Conflicting | ||||||||||||
| Glycerophospholipids | LPC (16:0), HMDB0010382 | + | + | - | Upregulated | |||||||||||
| Steroids and Steroid Derivatives | CE 16:1, HMDB0000658 | + | + | Upregulated | ||||||||||||
| Steroids and Steroid Derivatives | CE 20:3, HMDB0006736 | + | + | Upregulated | ||||||||||||
| Steroids and Steroid Derivatives | Cholic acid, HMDB0000619 | + | + | Upregulated |
| Class | Lipid, HMDB ID | AlAwam 2015 [39] | Avigdor 2021 [40] | Campeau 2022 [41] | Cui 2020 [42] | Dickens 2020 [43] | Du 2020 [44] | Fukushima 2014 [45] | He 2012 [46] | Kaddurah-Daouk 2007 [59] | Li 2022 [60] | Liu 2020 [48] | Mednova 2021 [49] | Oresic 2011 [50] | Oresic 2012 [51] | Paredes 2014 [52] | Parksepp 2022 [64] | Qing 2022 [63] | Tessier 2016 [55] | Wang 2021 [61] | Wang 2022 [56] | Wang X 2024 [36] | Wood 2015 [57] | Xuan 2011 [62] | Yang 2017 [58] | Overall Direction |
|---|---|---|---|---|---|---|---|---|---|---|---|---|---|---|---|---|---|---|---|---|---|---|---|---|---|---|
| Fatty Acyls | Arachidonic acid, HMDB0001043 | + | - | - | - | - | + | Downregulated | ||||||||||||||||||
| Fatty Acyls | Docosahexaenoic acid, HMDB0002183 | - | - | Downregulated | ||||||||||||||||||||||
| Fatty Acyls | Linoleic acid, HMDB0000673 | - | - | - | - | Downregulated | ||||||||||||||||||||
| Fatty Acyls | Oleic acid, HMDB0000207 | - | + | - | - | + | - | + | Downregulated | |||||||||||||||||
| Fatty Acyls | Palmitic acid, HMDB0000220 | - | - | + | - | + | Downregulated | |||||||||||||||||||
| Fatty Acyls | Stearic acid, HMDB0000827 | + | - | - | + | - | Downregulated | |||||||||||||||||||
| Glycerophospholipids | LPC (16:0), HMDB0010382 | - | - | - | - | Downregulated | ||||||||||||||||||||
| Glycerophospholipids | LPC (17:0), HMDB0012108 | - | - | Downregulated | ||||||||||||||||||||||
| Glycerophospholipids | LPC (18:0), HMDB0010384 | - | - | - | - | Downregulated | ||||||||||||||||||||
| Glycerophospholipids | LPE (18:0), HMDB0011130 | - | - | Downregulated | ||||||||||||||||||||||
| Glycerophospholipids | LPE (18:1), HMDB0011506 | - | - | Downregulated | ||||||||||||||||||||||
| Glycerophospholipids | PC (O-38:6), HMDB0013409 | - | - | Downregulated | ||||||||||||||||||||||
| Fatty Acyls | 9-Hydroxylinoleic acid, HMDB0062652 | + | - | Conflicting | ||||||||||||||||||||||
| Fatty Acyls | Acetylcarnitine, HMDB0000201 | - | + | Conflicting | ||||||||||||||||||||||
| Fatty Acyls | Acylcarnitine C16-OH, N/A | - | + | Conflicting | ||||||||||||||||||||||
| Fatty Acyls | Acylcarnitine C16:1, N/A | - | + | Conflicting | ||||||||||||||||||||||
| Fatty Acyls | Acylcarnitine C16:1-OH, N/A | - | + | Conflicting | ||||||||||||||||||||||
| Fatty Acyls | Acylcarnitine C18:1-OH, N/A | - | + | Conflicting | ||||||||||||||||||||||
| Fatty Acyls | Arachidic acid, HMDB0002212 | - | + | Conflicting | ||||||||||||||||||||||
| Fatty Acyls | Heptadecenoic acid, HMDB0002259 | - | + | Conflicting | ||||||||||||||||||||||
| Fatty Acyls | Dihomo-gamma-linolenic acid, HMDB0002925 | - | + | Conflicting | ||||||||||||||||||||||
| Fatty Acyls | Docosapentaenoic acid, HMDB0006528 | - | + | Conflicting | ||||||||||||||||||||||
| Fatty Acyls | Oleamide, HMDB0002117 | + | - | Conflicting | ||||||||||||||||||||||
| Fatty Acyls | Oleoylcarnitine, HMDB0005065 | - | + | Conflicting | ||||||||||||||||||||||
| Fatty Acyls | Stearoylcarnitine, HMDB0062532 | - | + | Conflicting | ||||||||||||||||||||||
| Glycerophospholipids | LPC (14:0), HMDB0010379 | + | - | Conflicting | ||||||||||||||||||||||
| Glycerophospholipids | LPC (18:1), HMDB0002815 | + | + | - | - | Conflicting | ||||||||||||||||||||
| Glycerophospholipids | LPC (22:6), HMDB0010404 | + | - | Conflicting | ||||||||||||||||||||||
| Glycerophospholipids | PE (18:0/18:1), HMDB0008993 | - | + | Conflicting | ||||||||||||||||||||||
| Glycerophospholipids | PC (18:0/18:2), HMDB0008039 | + | - | Conflicting | ||||||||||||||||||||||
| Glycerophospholipids | PE (18:2/18:0), HMDB0009090 | - | + | Conflicting | ||||||||||||||||||||||
| Steroids and Steroid Derivatives | Cholic acid, HMDB0000619 | - | + | Conflicting | ||||||||||||||||||||||
| Steroids and Steroid Derivatives | Progesterone, HMDB0001830 | - | + | Conflicting | ||||||||||||||||||||||
| Fatty Acyls | Adrenic acid, HMDB0002226 | + | - | + | + | + | Upregulated | |||||||||||||||||||
| Fatty Acyls | Eicosenoic acid, HMDB0002231 | + | + | Upregulated | ||||||||||||||||||||||
| Fatty Acyls | Eicosadienoic acid, HMDB0005060 | + | + | Upregulated | ||||||||||||||||||||||
| Fatty Acyls | Linoleamide, HMDB0062656 | + | + | + | Upregulated | |||||||||||||||||||||
| Fatty Acyls | Myristic acid, HMDB0000806 | - | + | + | Upregulated | |||||||||||||||||||||
| Fatty Acyls | Nervonic acid, HMDB0002368 | + | + | Upregulated | ||||||||||||||||||||||
| Fatty Acyls | Palmitaldehyde, HMDB0001551 | + | + | Upregulated | ||||||||||||||||||||||
| Glycerophospholipids | LPE (16:0), HMDB0011503 | + | + | Upregulated | ||||||||||||||||||||||
| Glycerophospholipids | PC (16:0/18:1), HMDB0007971 | + | + | Upregulated | ||||||||||||||||||||||
| Glycerophospholipids | Platelet-activating factor, HMDB0062195 | + | + | Upregulated | ||||||||||||||||||||||
| Sphingolipids | SM (d18:1/18:0), HMDB0001348 | + | + | Upregulated | ||||||||||||||||||||||
| Steroids and Steroid Derivatives | Cholesterol, HMDB0000067 | - | + | + | Upregulated | |||||||||||||||||||||
| Steroids and Steroid Derivatives | Sulfolithocholic acid, HMDB0000907 | + | + | Upregulated | ||||||||||||||||||||||
| Class | Lipid, HMDB ID | Cao 2019 [67] | Kaddurah-Daouk 2007 [59] | Leppik 2020 [27] | Li 2022 [60] | Liu 2021 [66] | Qiao 2016 [29] | Qiu 2023 [65] | Song 2023 [34] | Xuan 2011 [62] | Yan 2018 [31] | Overall Direction |
|---|---|---|---|---|---|---|---|---|---|---|---|---|
| Fatty Acyls | Palmitoleic acid, HMDB0003229 | - | - | Downregulated | ||||||||
| Glycerophospholipids | LPC (16:0), HMDB0010382 | - | - | + | Downregulated | |||||||
| Glycerophospholipids | LPC (22:6), HMDB0010404 | - | - | Downregulated | ||||||||
| Glycerophospholipids | PC (38:6), HMDB0007991 | - | - | Downregulated | ||||||||
| Steroids and Steroid Derivatives | CE (22:6), HMDB0245627 | - | - | Downregulated | ||||||||
| Fatty Acyls | Docosahexaenoic acid, HMDB0002183 | - | + | Conflicting | ||||||||
| Fatty Acyls | Docosapentaenoic acid, HMDB0006528 | - | + | Conflicting | ||||||||
| Fatty Acyls | Eicosapentaenoic acid, HMDB0001999 | - | + | Conflicting | ||||||||
| Fatty Acyls | Palmitic acid, HMDB0000220 | - | + | + | - | Conflicting | ||||||
| Fatty Acyls | Stearic acid, HMDB0000827 | + | - | Conflicting | ||||||||
| Glycerophospholipids | LPC (15:0), HMDB0010381 | - | + | Conflicting | ||||||||
| Glycerophospholipids | LPC (18:2), HMDB0061700 | + | - | Conflicting | ||||||||
| Steroids and Steroid Derivatives | CE (20:5), HMDB0006731 | + | - | Conflicting | ||||||||
| Fatty Acyls | Adrenic acid, HMDB0002226 | + | + | - | Upregulated | |||||||
| Fatty Acyls | Linoleic acid, HMDB0000673 | + | - | + | Upregulated | |||||||
| Fatty Acyls | Oleic acid, HMDB0000207 | + | - | + | Upregulated | |||||||
| Glycerophospholipids | LPC (14:0), HMDB0010379 | - | + | + | + | + | + | Upregulated | ||||
| Glycerophospholipids | LPC (16:1), HMDB0010383 | + | + | Upregulated | ||||||||
| Glycerophospholipids | LPC (18:0), HMDB0010384 | + | + | + | Upregulated | |||||||
| Glycerophospholipids | LPC (18:1), HMDB0002815 | + | + | Upregulated | ||||||||
| Glycerophospholipids | LPC (20:3), HMDB0010393 | + | + | + | + | + | Upregulated | |||||
| Steroids and Steroid Derivatives | CE (18:3), HMDB0010369 | + | + | Upregulated |
Disclaimer/Publisher’s Note: The statements, opinions and data contained in all publications are solely those of the individual author(s) and contributor(s) and not of MDPI and/or the editor(s). MDPI and/or the editor(s) disclaim responsibility for any injury to people or property resulting from any ideas, methods, instructions or products referred to in the content. |
© 2024 by the authors. Licensee MDPI, Basel, Switzerland. This article is an open access article distributed under the terms and conditions of the Creative Commons Attribution (CC BY) license (https://creativecommons.org/licenses/by/4.0/).
Share and Cite
Wu, S.; Panganiban, K.J.; Lee, J.; Li, D.; Smith, E.C.C.; Maksyutynska, K.; Humber, B.; Ahmed, T.; Agarwal, S.M.; Ward, K.; et al. Peripheral Lipid Signatures, Metabolic Dysfunction, and Pathophysiology in Schizophrenia Spectrum Disorders. Metabolites 2024, 14, 475. https://doi.org/10.3390/metabo14090475
Wu S, Panganiban KJ, Lee J, Li D, Smith ECC, Maksyutynska K, Humber B, Ahmed T, Agarwal SM, Ward K, et al. Peripheral Lipid Signatures, Metabolic Dysfunction, and Pathophysiology in Schizophrenia Spectrum Disorders. Metabolites. 2024; 14(9):475. https://doi.org/10.3390/metabo14090475
Chicago/Turabian StyleWu, Sally, Kristoffer J. Panganiban, Jiwon Lee, Dan Li, Emily C.C. Smith, Kateryna Maksyutynska, Bailey Humber, Tariq Ahmed, Sri Mahavir Agarwal, Kristen Ward, and et al. 2024. "Peripheral Lipid Signatures, Metabolic Dysfunction, and Pathophysiology in Schizophrenia Spectrum Disorders" Metabolites 14, no. 9: 475. https://doi.org/10.3390/metabo14090475