Article

Multi-Spectroscopic Analysis of Seed Quality and 13C-Stable-Iotopologue Monitoring in Initial Growth Metabolism of Jatropha curcas L.

1
RIKEN Center for Sustainable Resource Science, 1-7-22 Suehirocho, Tsurumi-ku, Yokohama, Kanagawa 230-0045, Japan
2
Graduate School of Medical Life Science, Yokohama City University, 1-7-29 Suehirocho, Tsurumi-ku, Yokohama, Kanagawa 230-0045, Japan
3
Faculty of Agriculture, Tottori University, 4-101 Koyama-cho, Tottori 680-8553, Japan
4
RIKEN Biomass Engineering Program Cooperation Division, RIKEN Center for Sustainable Resource Science, 1-7-22 Suehirocho, Tsurumi-ku, Yokohama, Kanagawa 230-0045, Japan
5
Graduate School of Bioagricultural Sciences, Nagoya University, 1 Furo-cho, Chikusa-ku, Nagoya, Aichi 464-0810, Japan
*
Author to whom correspondence should be addressed.
Metabolites 2014, 4(4), 1018-1033; https://doi.org/10.3390/metabo4041018
Submission received: 28 April 2014 / Revised: 10 September 2014 / Accepted: 5 November 2014 / Published: 13 November 2014
(This article belongs to the Special Issue Metabolomics and Biotechnology)

Abstract

:
In the present study, we applied nuclear magnetic resonance (NMR), as well as near-infrared (NIR) spectroscopy, to Jatropha curcas to fulfill two objectives: (1) to qualitatively examine the seeds stored at different conditions, and (2) to monitor the metabolism of J. curcas during its initial growth stage under stable-isotope-labeling condition (until 15 days after seeding). NIR spectra could non-invasively distinguish differences in storage conditions. NMR metabolic analysis of water-soluble metabolites identified sucrose and raffinose family oligosaccharides as positive markers and gluconic acid as a negative marker of seed germination. Isotopic labeling patteren of metabolites in germinated seedlings cultured in agar-plate containg 13C-glucose and 15N-nitrate was analyzed by zero-quantum-filtered-total correlation spectroscopy (ZQF-TOCSY) and 13C-detected 1H-13C heteronuclear correlation spectroscopy (HETCOR). 13C-detected HETOCR with 13C-optimized cryogenic probe provided high-resolution 13C-NMR spectra of each metabolite in molecular crowd. The 13C-13C/12C bondmer estimated from 1H-13C HETCOR spectra indicated that glutamine and arginine were the major organic compounds for nitrogen and carbon transfer from roots to leaves.

1. Introduction

Jatropha (Jatropha curcas L.) is a drought-resistant shrub that originated from Central America and is considered a prospective economically relevant plant due to the high oil seed content [1,2]. Its seed contains 30%–45% oil, with a high amount triglycerides consisting of, mainly, oleic and linoleic acid, as well as toxic compounds, such as phorbol ester, lectin dimers, and curcin [3]. J. curcas is considered a semi-wild plant and has not been fully domesticated [4], although its whole genome has been sequenced and reported in 2011 [5,6]. Therefore, its oil productivity is variable, making it difficult to predict yields.
Germination is a critical developmental stage for seed plants. For cultivation, germinated seedlings are maintained in nursery conditions during their initial growth stage [2]. Germination commences with the uptake of water imbibition of the dry seed, followed by embryo expansion, and finally, the embryo axis elongates and breaks through the covering layers to complete germination [7]. Moncaleano-Escandon et al. investigated the germination rate of Jatropha seeds stored for 0–12 months, which showed that the germination rate considerably decreased over time [8]. Stored nutrients in the seeds, including starch and soluble protein, also showed lower levels over time. In the present study, we examined the germination and initial growth of J. curcas because its viability and productivity largely depend on these processes. Transcriptome [9,10] and proteome [11,12,13] analyses during seed germination in J. curcas have been previously reported. However, to our knowledge, reports on the metabolic analysis of the J. curcas during seed germination are limited.
Several spectroscopy such as nuclear magnetic resonance (NMR), infrared spectroscopy (IR), near-infrared spectroscopy (NIR) have contributed a field of metabolic analysis from the early period. Nowadays chromatography-mass spectrometry is widely used for metabolic analysis. However NMR, IR, and NIR are still attractive analytical platform for metabolic analysis or profiling because of their high spectral reproducibility, simple sample preparation, and no derivatization. It is well-known that spectroscopy using different frequency electromagnetic wave has quite different properties and provides quite different information. Due to its high permeability near-infrared wave, NIR spectra can be recorded non-invasively and instantly. It is beneficial for quality examination of agricultural products. This property is also beneficial for quality examination of seeds of J. curcas. NMR provides plenty of structural information, such as larmor frequency, chemical shift, scalar coupling. In addition, its relatively long relaxation time allows various multidimensional NMRs. We can address each metabolite directly without chromatographic separation procedures, because 2D NMR techniques, such as HSQC, HMQC, and TOCSY, get rid of signal overlapping [14,15,16,17,18,19,20,21].
Stable-isotope-labeling has facilitated NMR analysis by enhancing its sensitivity and its abilities of signal assignment [14,15,17,19,20]. As another approach, isotopic analysis combined with heterogeneous stable-isotope-labeling provides unique information of metabolic activities. It is known as NMR metabolic flux analysis (MFA). In the NMR MFA, concentrations of isotopomers are estimated using splitting by spin-spin coupling between one bond 1H-13C (1JCH) and one bond 13C-13C (1JCC) in 1H and 13C NMR, respectively [21,22,23,24]. One advantage of NMR in metabolic flux analysis is the capacity to generate isotopic information in atomic resolution, thus, allowing estimations of a biosynthetic pathway based on their patterns of splitting. A multidimensional approach in NMR, such as zero-quantum-filtered (ZQF) TOCSY [25,26,27] and high resolution HSQC [28,29], has enabled researchers to conduct MFA without the need for sample purification.
In the present study, we applied multi-spectroscopic analyses, including NMR and NIR, to seeds of J. curcas for the evaluation of seed quality. Additionally stable-isotope labeling combined with NMR and isotope ratio MS (IR-MS) was also employed to monitor the flow of carbon and nitrogen in germinated seedlings. We applied heterogeneous stable-isotope-labeling of metabolites, in which seedlings were cultured in agar-plate containing 13C-glucose and 15N-nitrate, to distinguish their heterotrophic (consuming 13C-labeled substrates or storage substrates) or autotrophic metabolic activities. In addition, a method for high-resolution 13C-13C/12C bondmer analysis was proposed and examined using 13C-ditected 1H-13C-hetronuclar correlation spectroscopy (HETCOR) with 13C-optimized cryogenic probe.

2. Results and Discussion

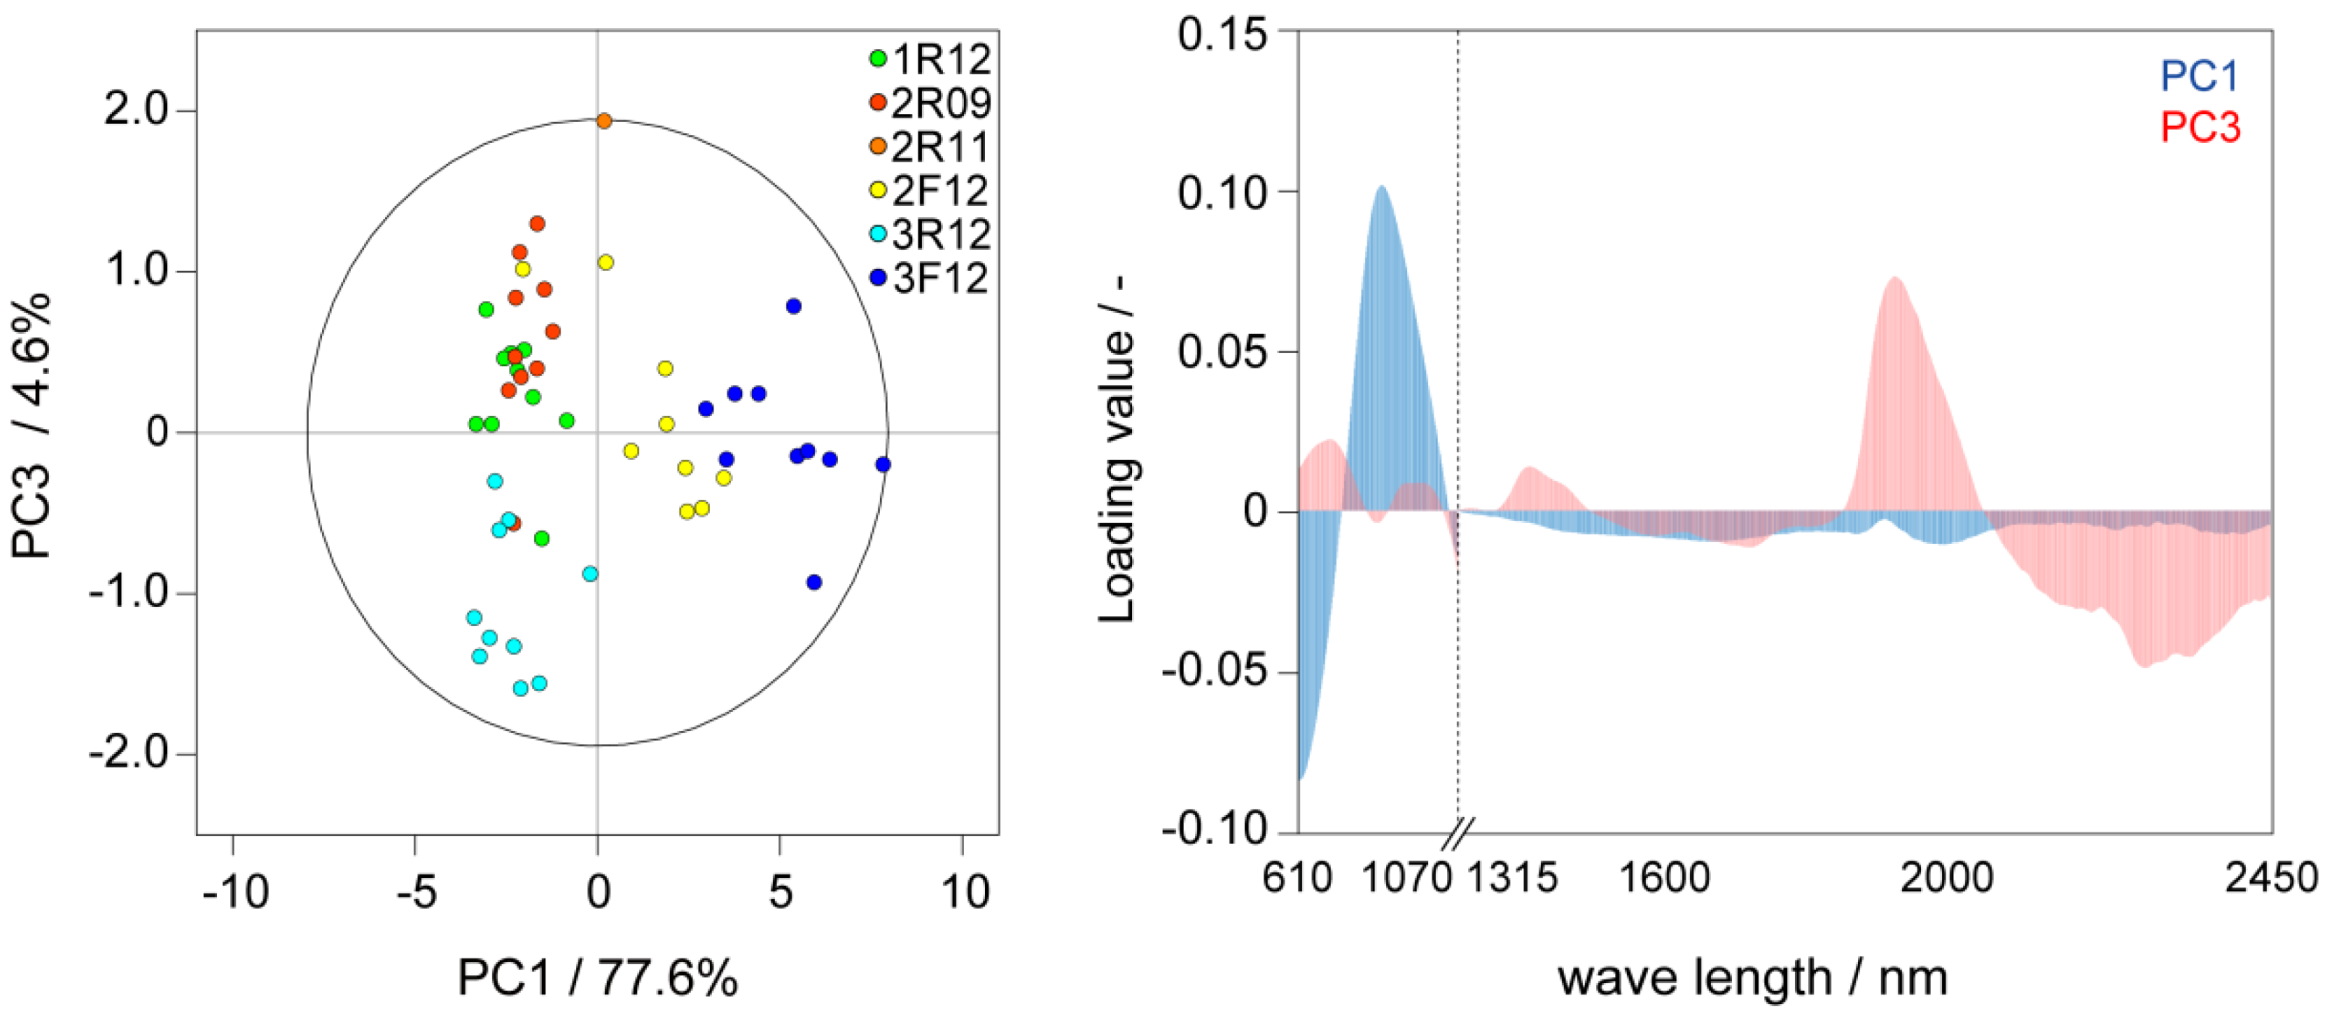
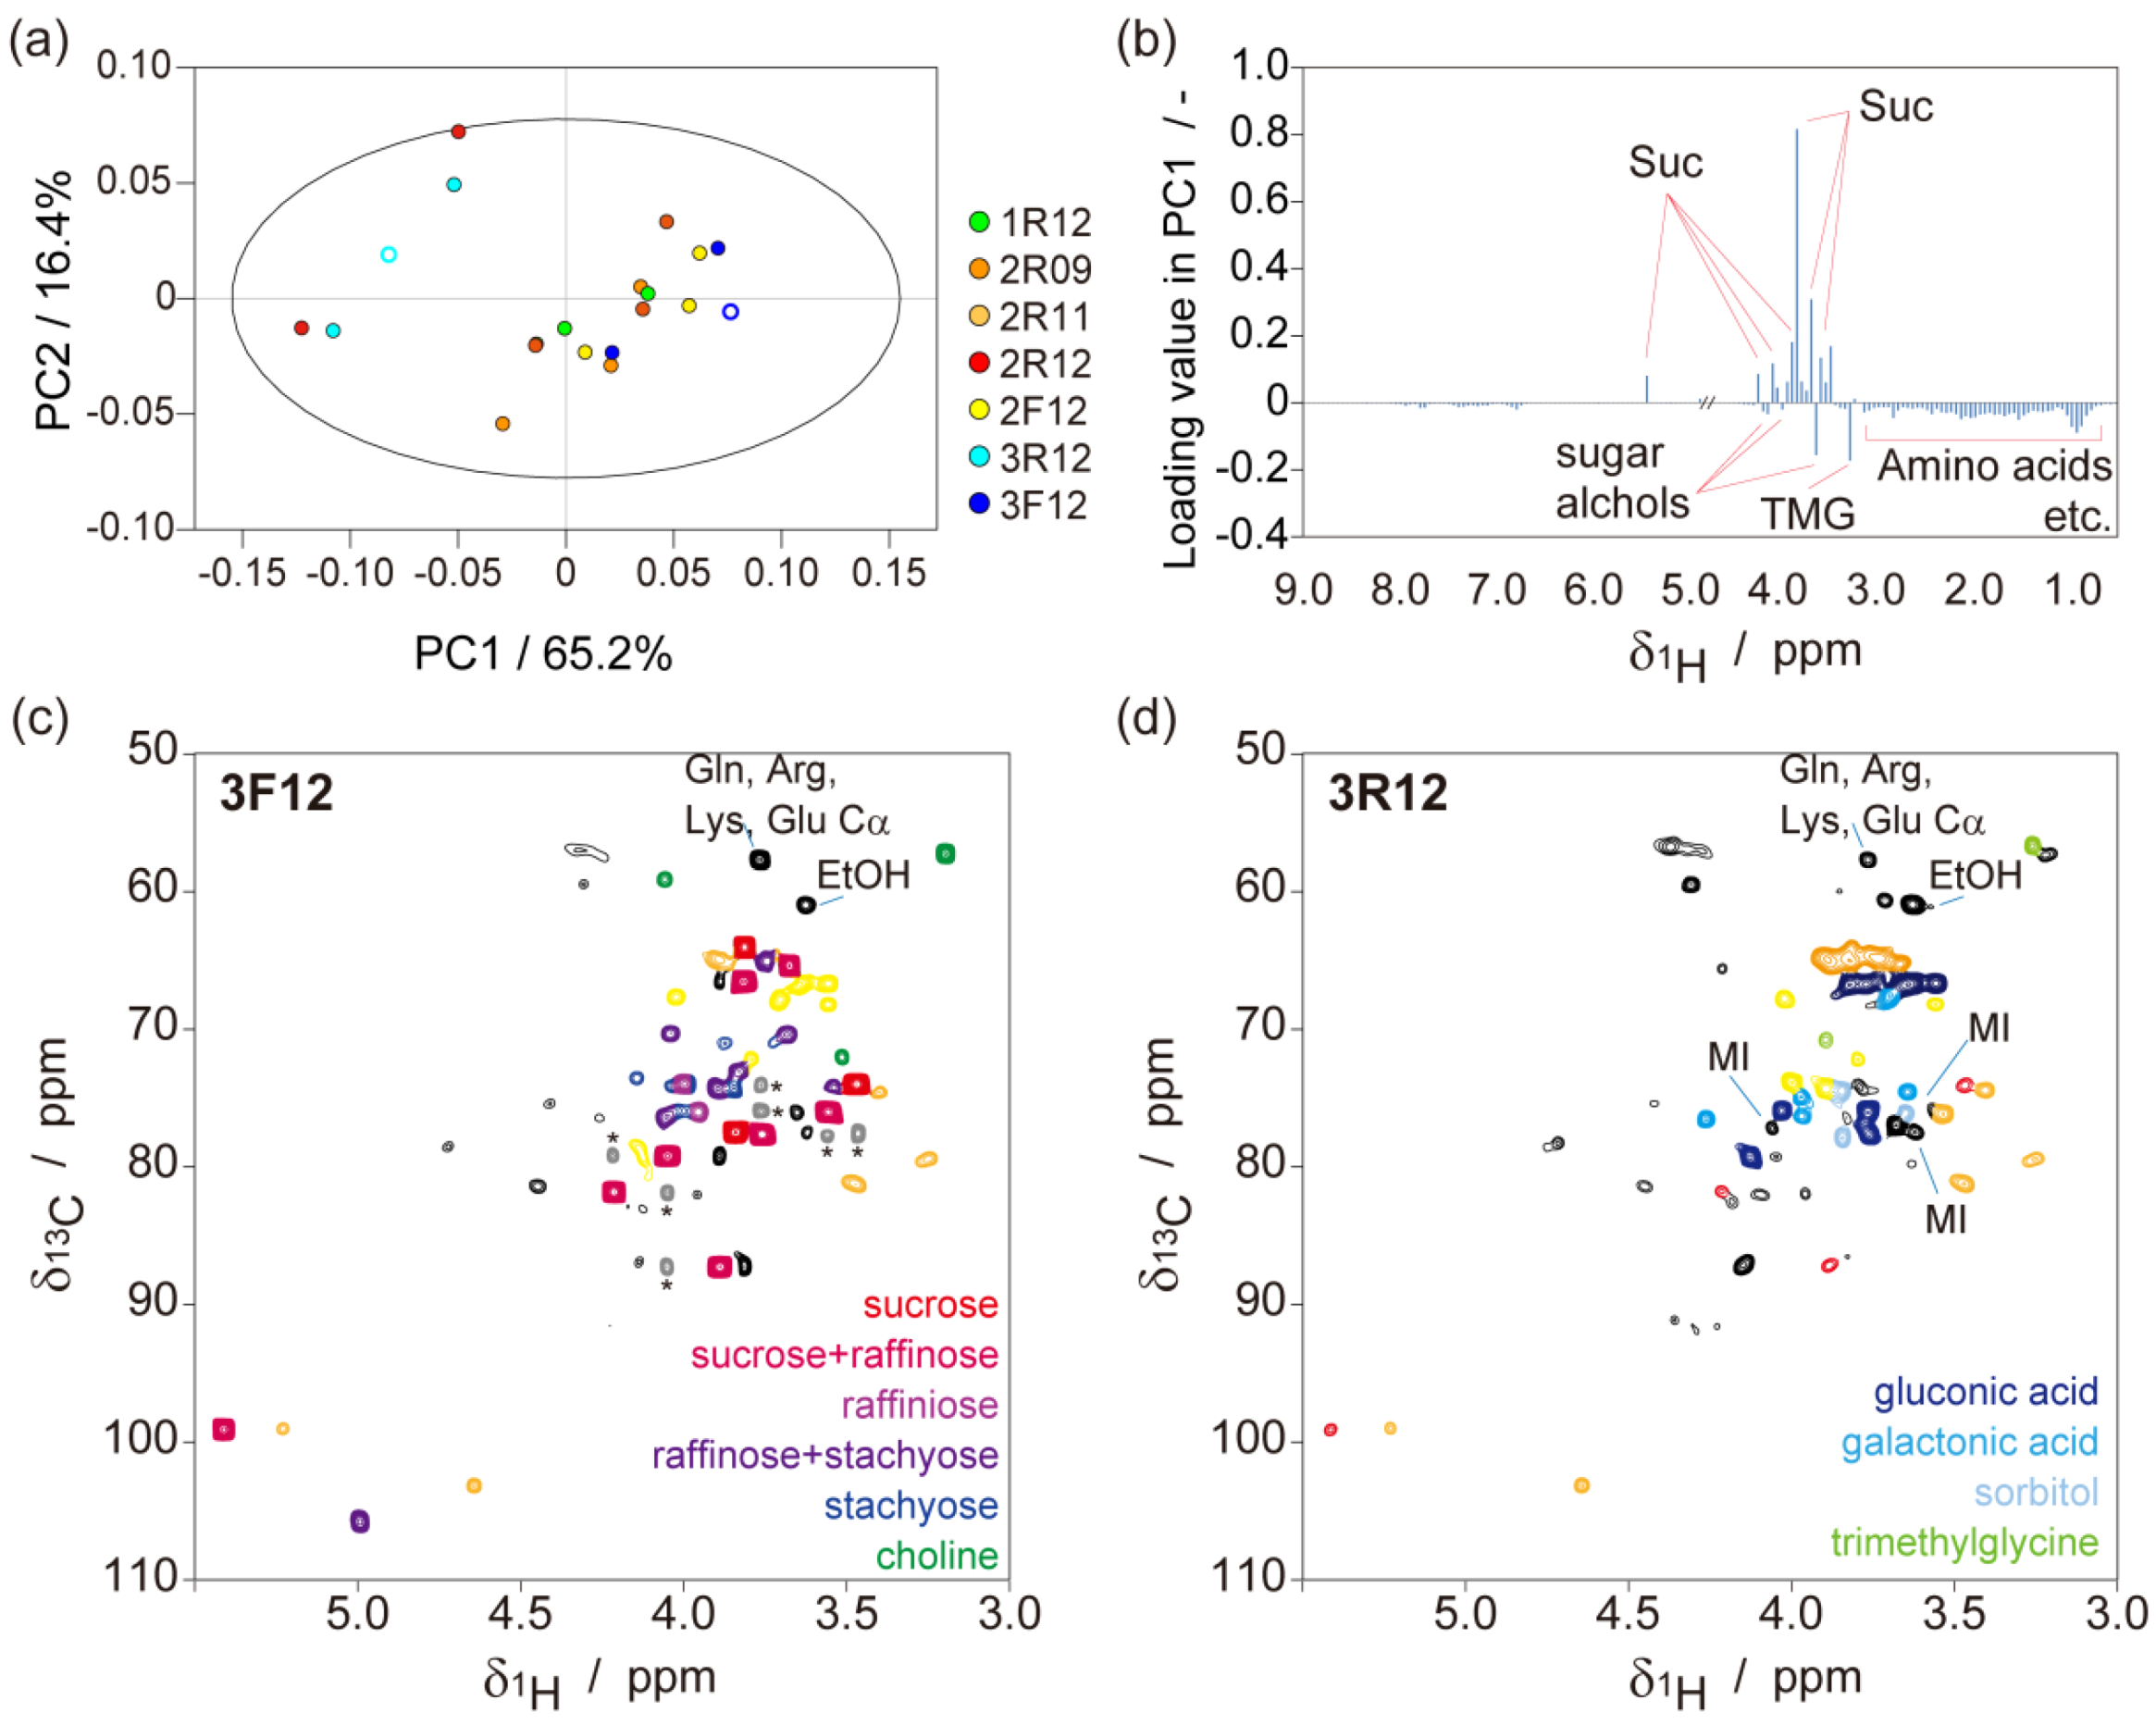
2.1. Metabolic-Analysis-Based Quality Control Methods for Jatropha Seed

We conducted induction of seed germination using three varieties of J. curcas L. stored at two different temperatures (277 and 243 K) and cultivated in three different years (2009, 2011, and 2012). A total of seven samples were included in the study, namely, 1R12 (IP1P stored at 277 K, harvested in 2012), 2R12 (IP2P stored at 277 K, harvested in 2012), 2R11 (IP2P stored at 277 K, harvested in 2011), 2R09 (IP2P stored at 277 K, harvested in 2009), 2F12 (IP2P stored at 243 K, harvested in 2012), 3R12 (IP3P stored at 277 K, harvested in 2012), and 3F12; (IP3P stored at 243 K, harvested in 2012). The germination rates of 2R12 and 3R12 were 0% and 5.1%, respectively, which were significantly lower than the other samples (75.0%, 66.3%, 46.2%, 79.7%, and 60.8% for 1R12, 2R09, 2R11, 2F12, and 3F12, respectively, Table 1). However, the germination rates of 2R09 and 2R11 were significantly higher, and, therefore, we could not conclude that storing seeds at 277 K was harmful for subsequent plant growth and development. Interestingly, the germination rate of 2R09 was 66.3%, which was significantly higher than expected, because this was observed at least three years after harvest. It has been previously reported that Jatropha seeds have a short viability period (<6 months) [8].
NIR spectra provided useful information to distinguish differences in storage conditions and their varieties, although these did not provide any information on whether the seeds would undergo germination using our strategy. A score plot and a loading plot of PCA from data-matrix generated from two different wavelength NIR spectra are shown in Figure 1. The score plots were discriminated based on storage temperature (277 K or 243 K) predominantly in the principle component (PC) 1. Additionally, the score plots of IP3P seeds were weakly discriminated predominantly in PC3. The loading plot is shown in Figure 1b; however, it was difficult to identify the loading compounds due to the extensive absorbance of various molecules. Although further chemometric analyses were required to identify loading compounds, further detailed analyses were not conducted because our objective to distinguish seeds in terms of capacity to germinate was not achieved.
Table 1. Germination rates of 7 different seeds of Jatropha curcas.
1R122R092R112R122F123R123F12
number of germinated seeds [-]601386063248
number of seeds [-]802081330793979
germination rate [%]75.066.346.20.079.75.160.8
Figure 1. PCA of NIR spectra for the non-invasive characterization of seeds. (a) Score plots (PC1 vs. PC3) in PCA for NIR spectra (See also Figure S1). An ellipse in score plot was represented the Hotelling’s T2 95% confidence. An outlier was removed before (See Figure S2); (b) Loading plots (PC1 vs. PC3) in PCA. Input-data were generated from two different wavelength NIR spectra. Two spectra were combined after normalization. 10 seeds of 6 each different sample except for 2R12 were used for PCA.
Metabolites 04 01018 g001
The NMR spectra of water-soluble metabolites in kernels are shown in Figure 2. The score plot in the PCA that indicated the chemotypes of 2R12 and 3R12, which showed poor viability to germinate, were discriminative Figure 2a. In the loading plot, signals from sucrose contributed to the negative direction in PC1 Figure 2b and signals from the other nutrients contributed to a positive direction. Detailed signal assignments were carried out using the 1H-13C-HSQC spectra to understand the relationship between germination rates and metabolites Figure 2c,d. In the 1H-13C-HSQC spectrum of 3F12, sucrose, raffinose, and stachyose were identified as the major sugar components. On the other hand, for 3R12, sucrose, raffinose, and stachyose were designated as trace components. However gluconic acid and galactonic acid were identified as major sugar components in 3R12. Choline was detected in 3F12, whereas this was not observed in 3R12. In contrast to choline, trimetylglycine was identified in 3R12, whereas this was not present in 3F12. Gluconic acid is a product of glucose oxidation, and trimetylglycine is a product of choline oxidation. The accumulation of gluconic acid and trimetylglycine in the present study might have been caused by oxidation over extended storage periods.
Figure 2. NMR analysis for water-soluble metabolites in seeds. (a) A score plot of PCA, in which bucket integrated (0.05 ppm/bucket) 1H-1D spectra were used. An ellipse in score plot was represented the Hotelling’s T2 95% confidence. The open circle plot indicates samples taken using the 1H-13C HSQC spectra of 3F12 (c) and 3R12 (d); (b) A loading plot of the PC1. The indicated molecules were assigned in the 1H-13C HSQC spectra. The 1H-13C HSQC spectra of 3F12 (c) and 3R12 (d). Colored signals are referenced in the lower right of the spectra. Signals indicated by asterisks in (c) were long-range correlations in sucrose via nJCC (n > 1). Suc; sucrose, MI; myo-inositol, TMG; trimethylglycine.
Metabolites 04 01018 g002
Sucrose is a major sugar form in higher-plants; it is converted to monosaccharide and then consumed as a substrate for respiration via glycolysis or used as building blocks of cell walls. Stored sucrose and glucose are utilized as the initial substrates for germination, whereas monosaccharide is derived from storage components such as starch and lipids upon commencement of germination. Raffinose family oligosaccharides (RFOs), including raffinose and stachyose, were preferentially accumulated in the seeds and are considered as important molecules for germination. RFOs are accumulated during the late stage of seed maturation and desiccation and play a role in desiccation tolerance [30,31,32,33], although several reports indicate that RFOs are not essential for germination [34].

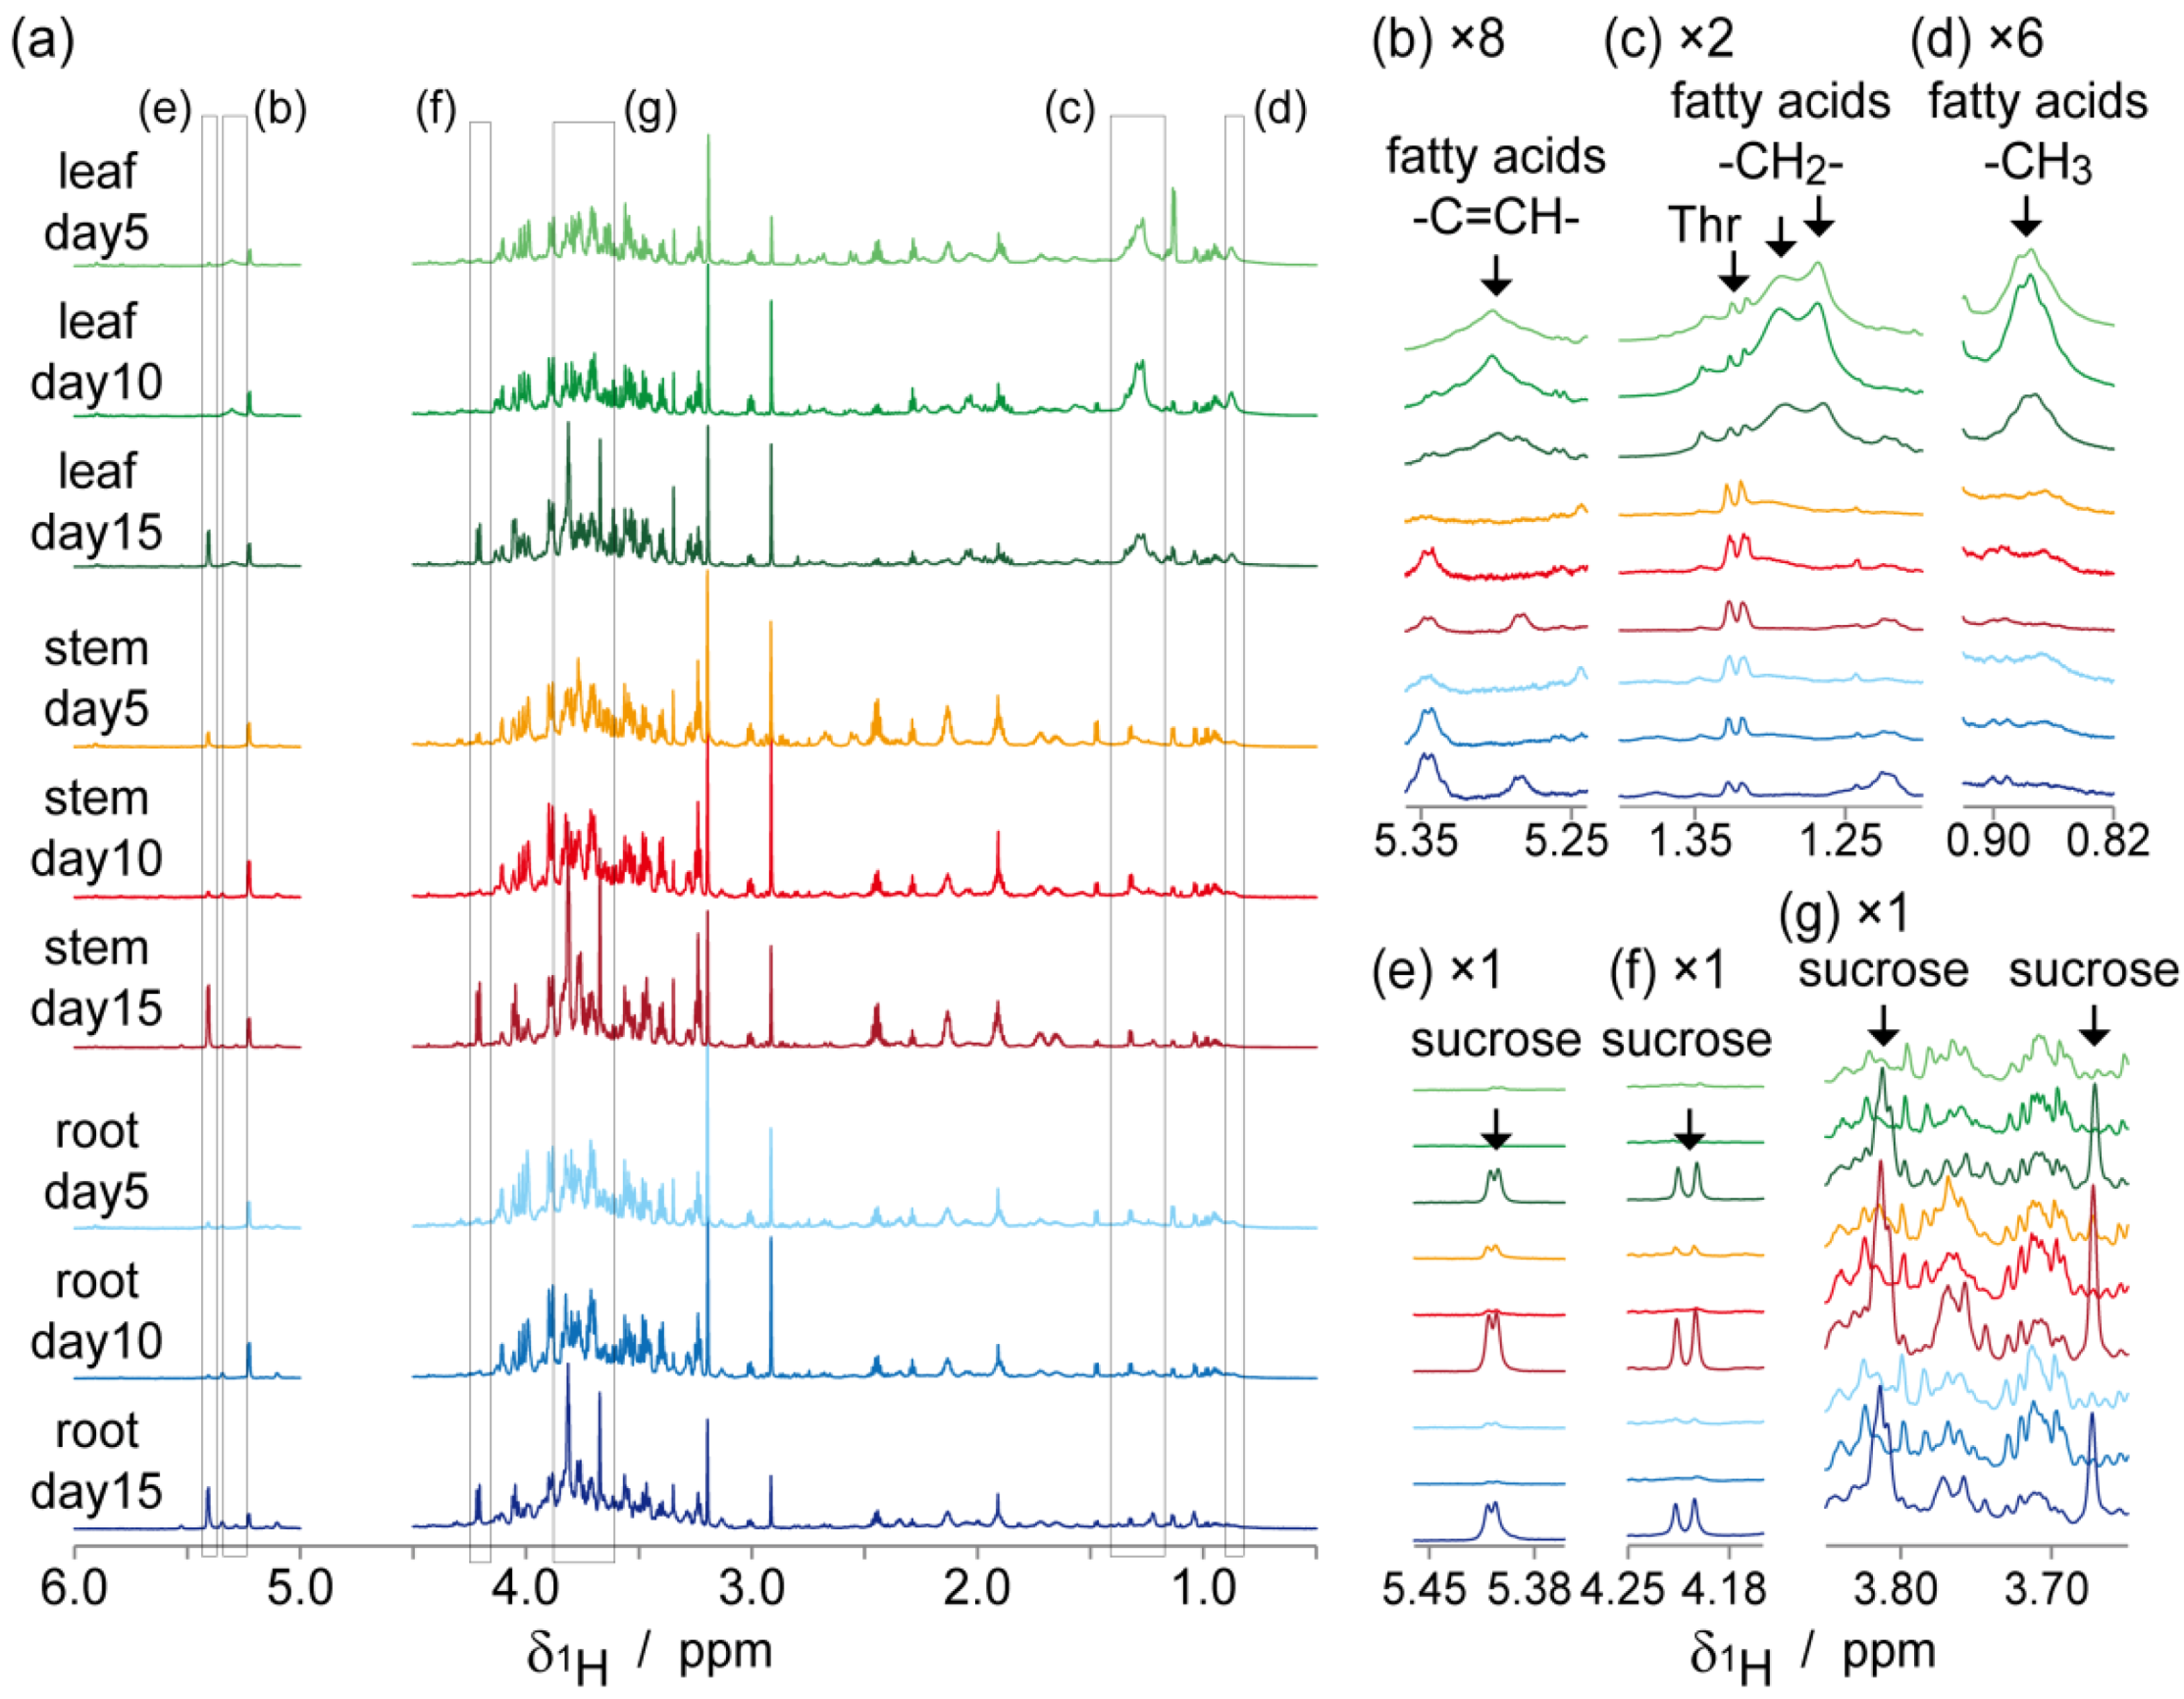
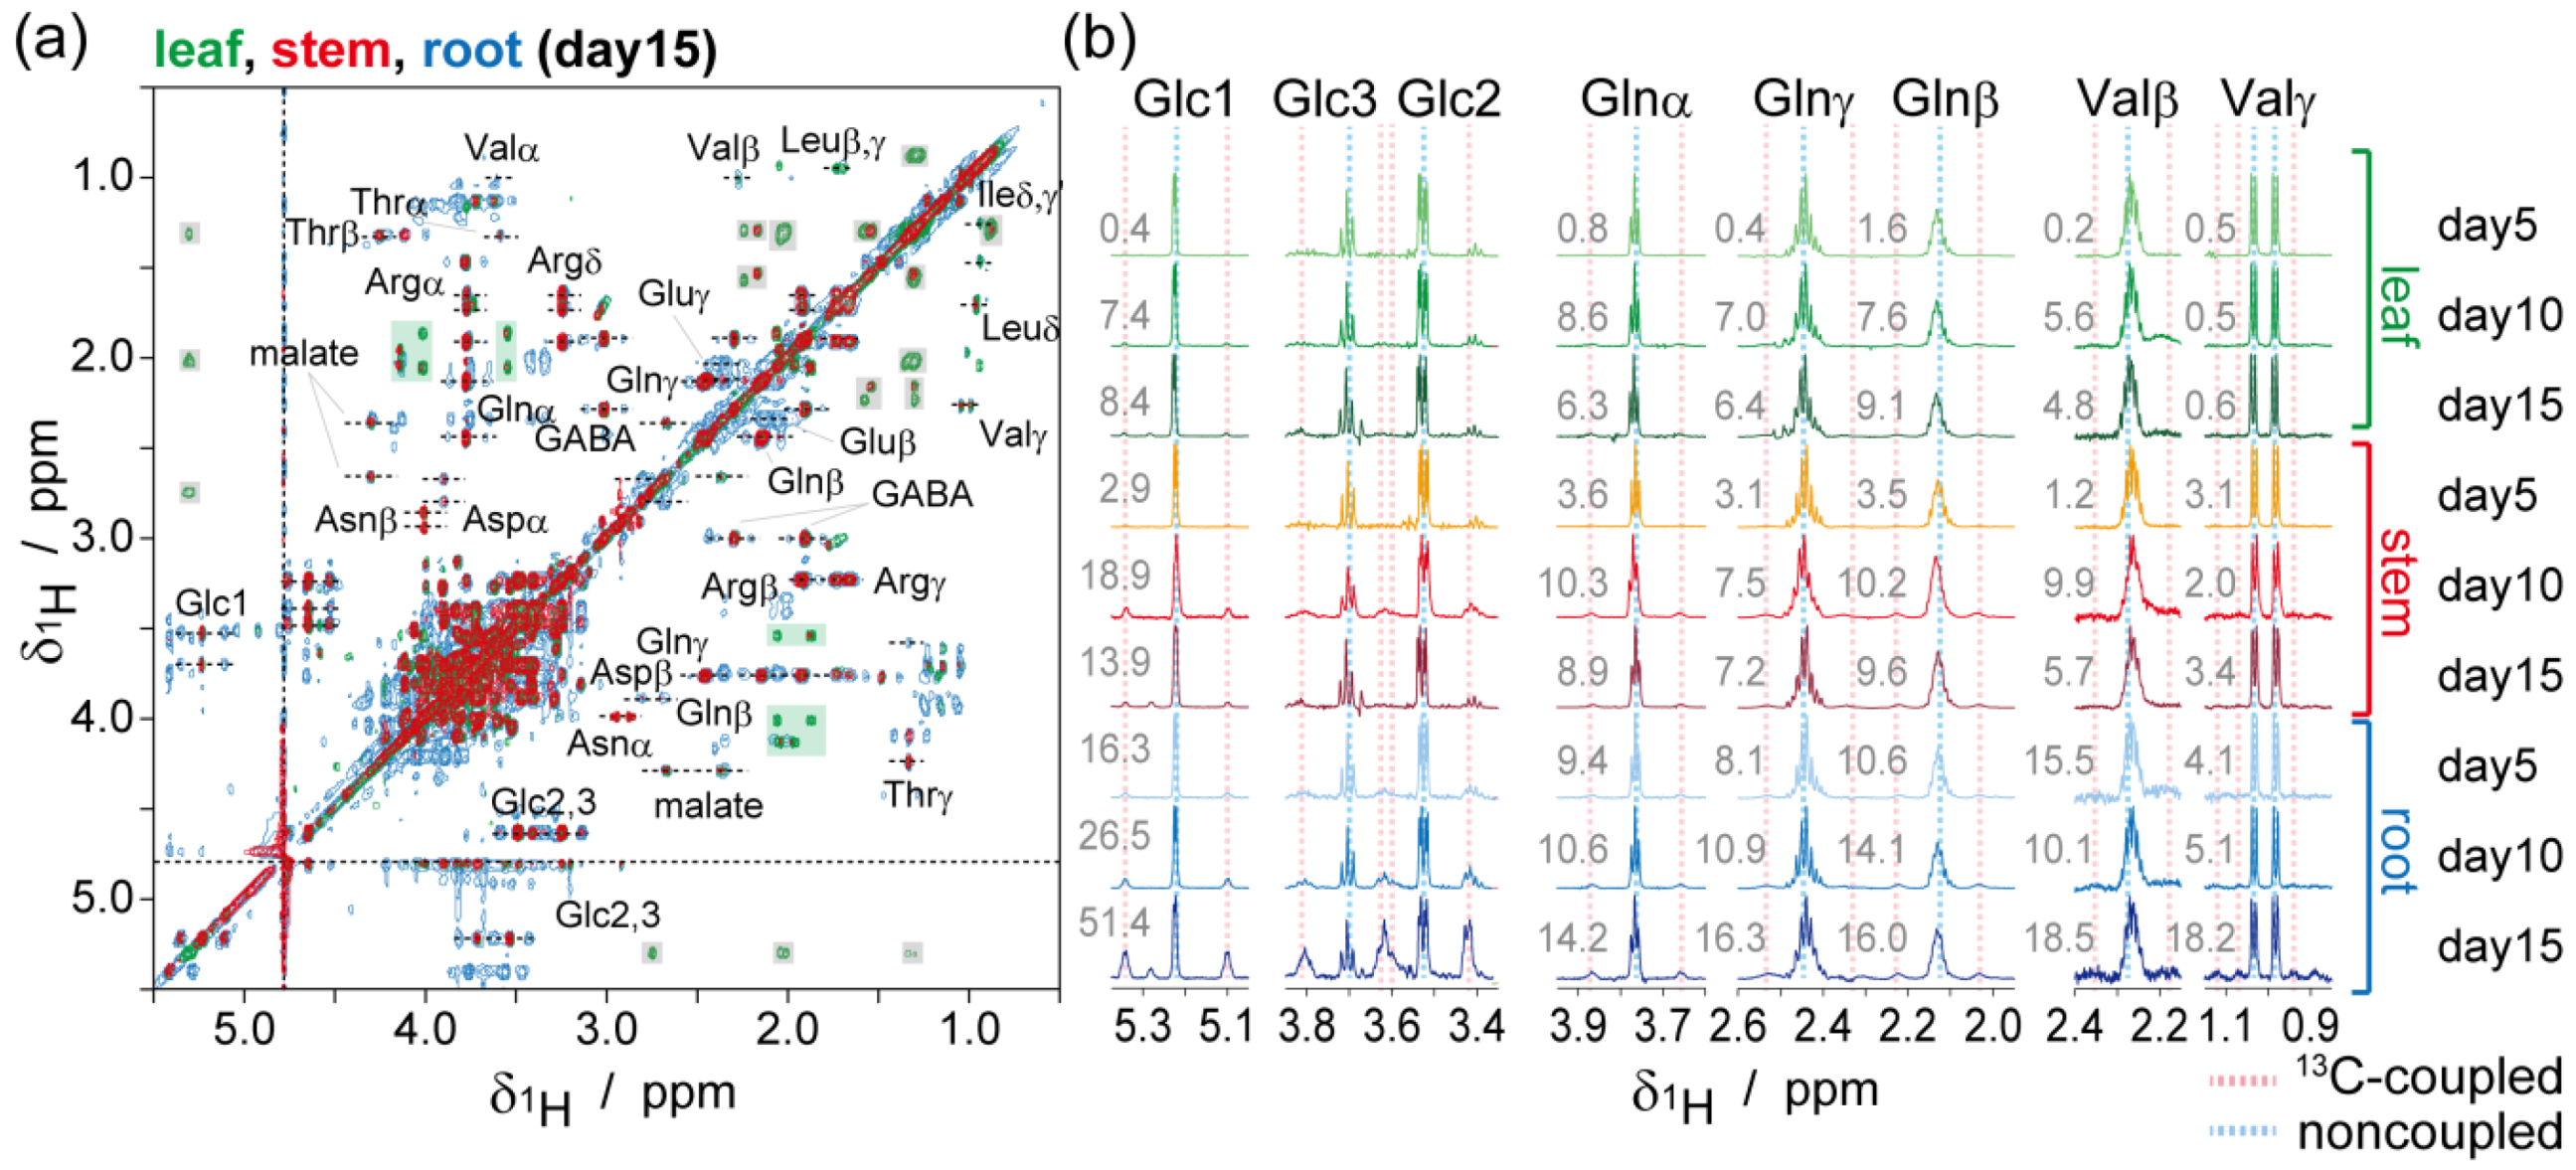
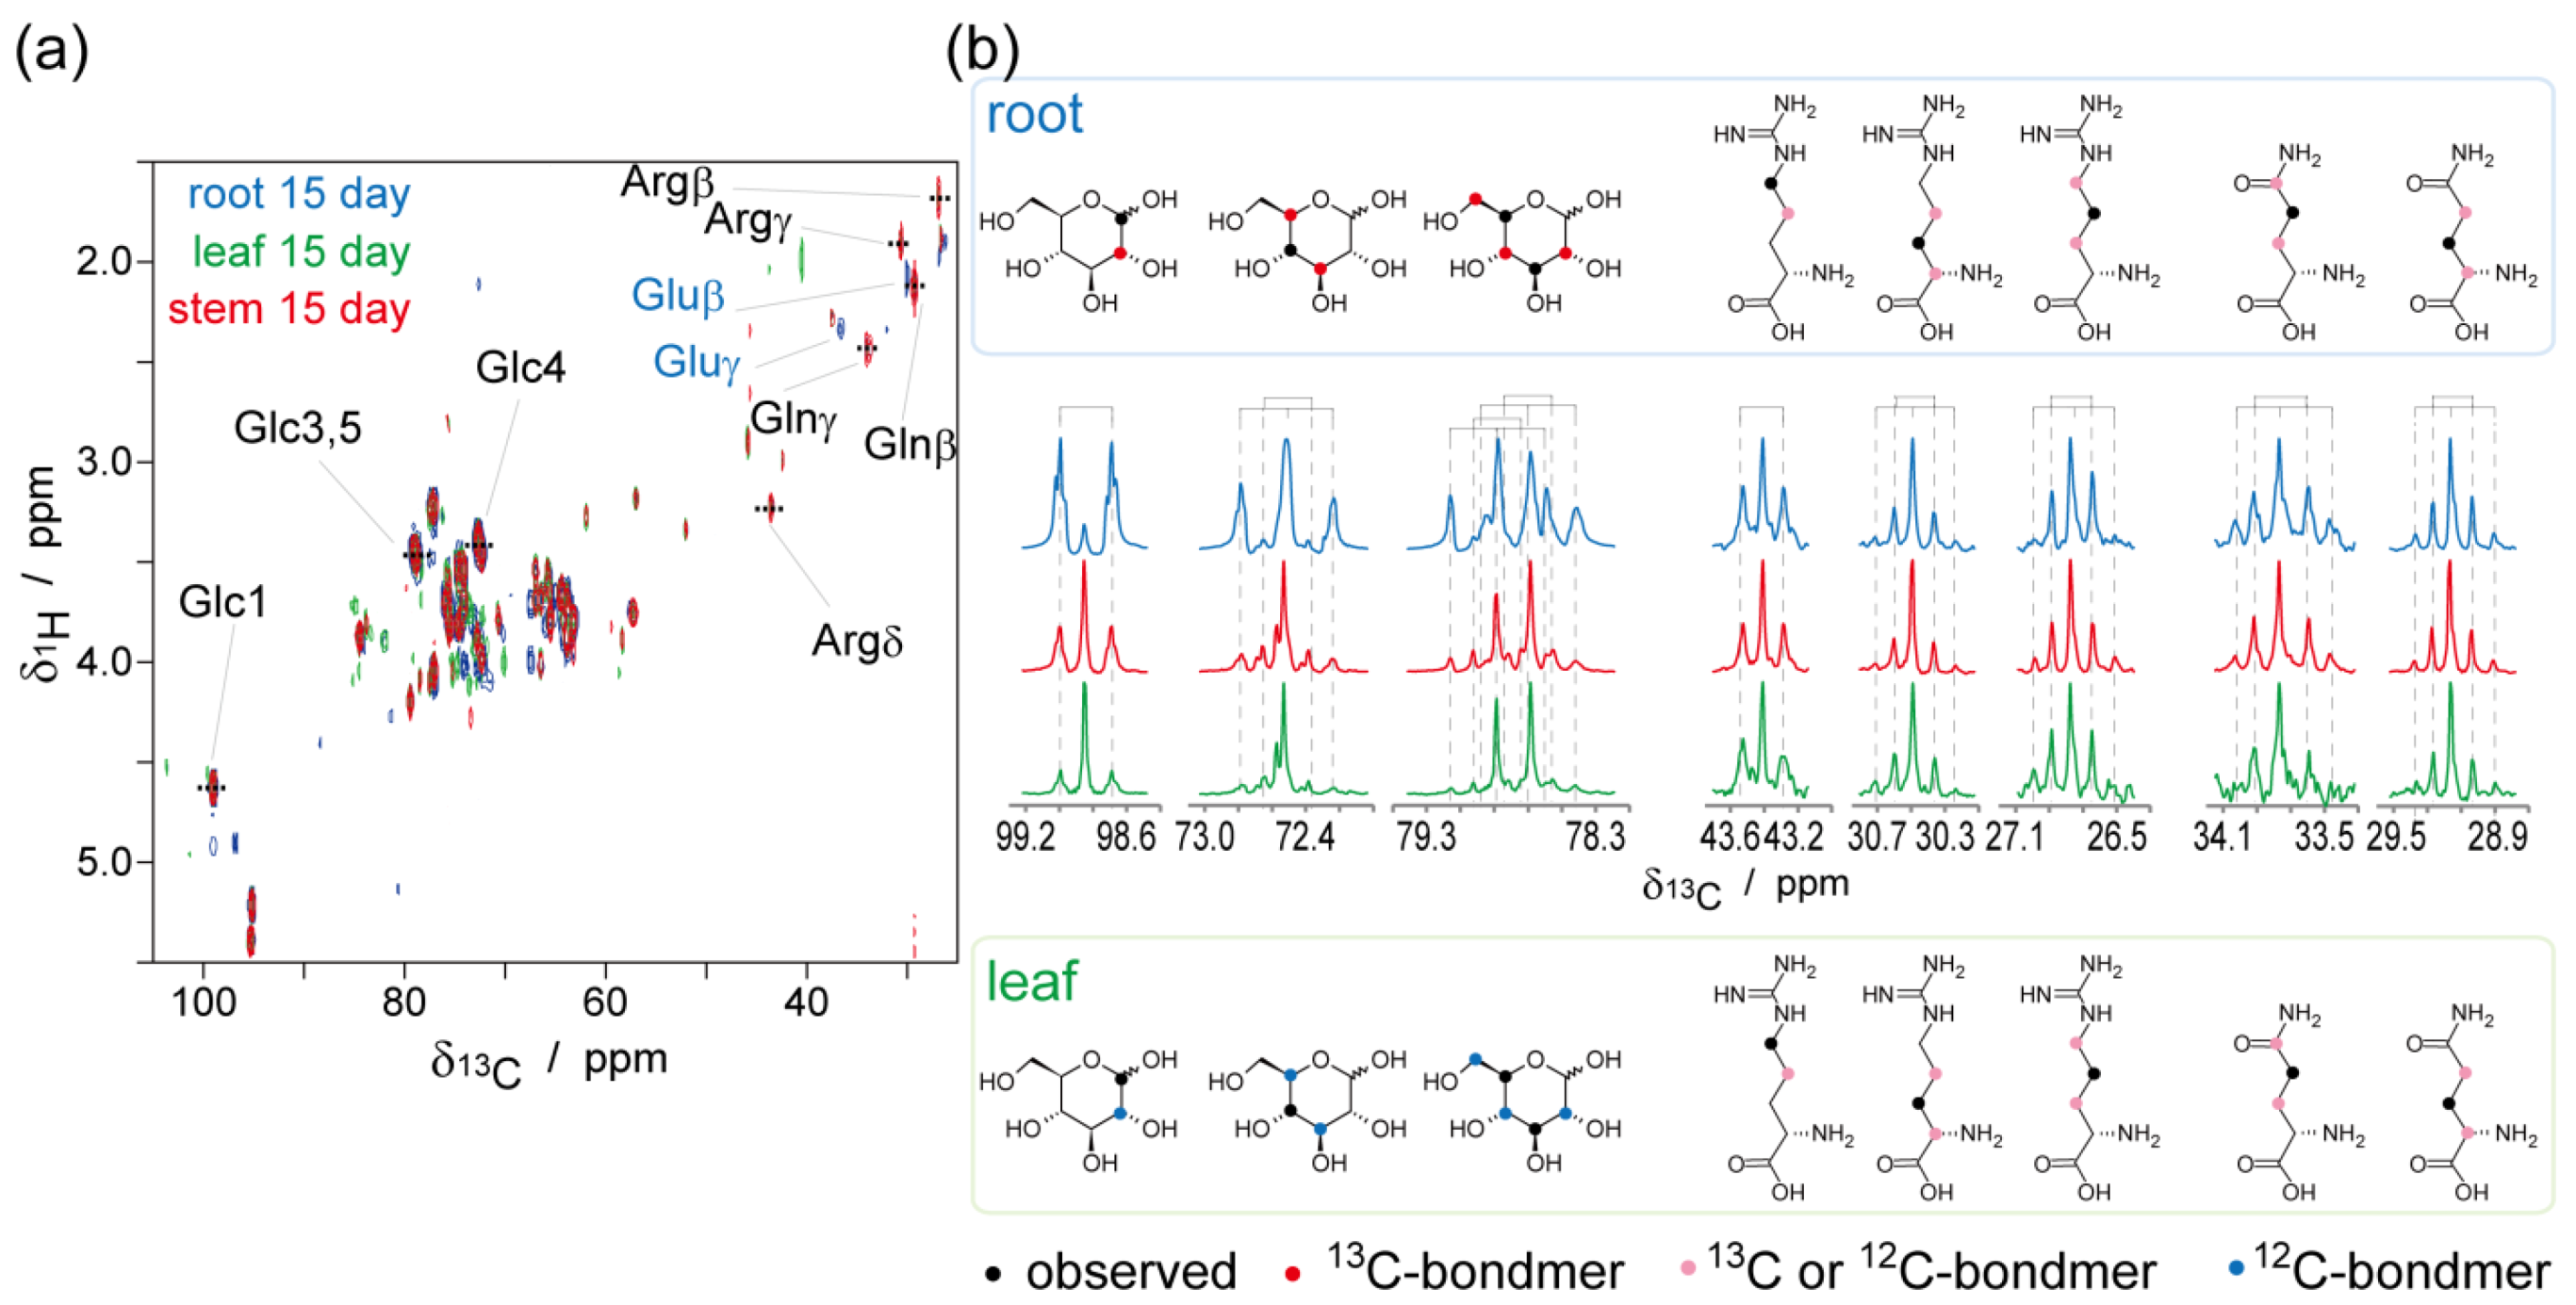
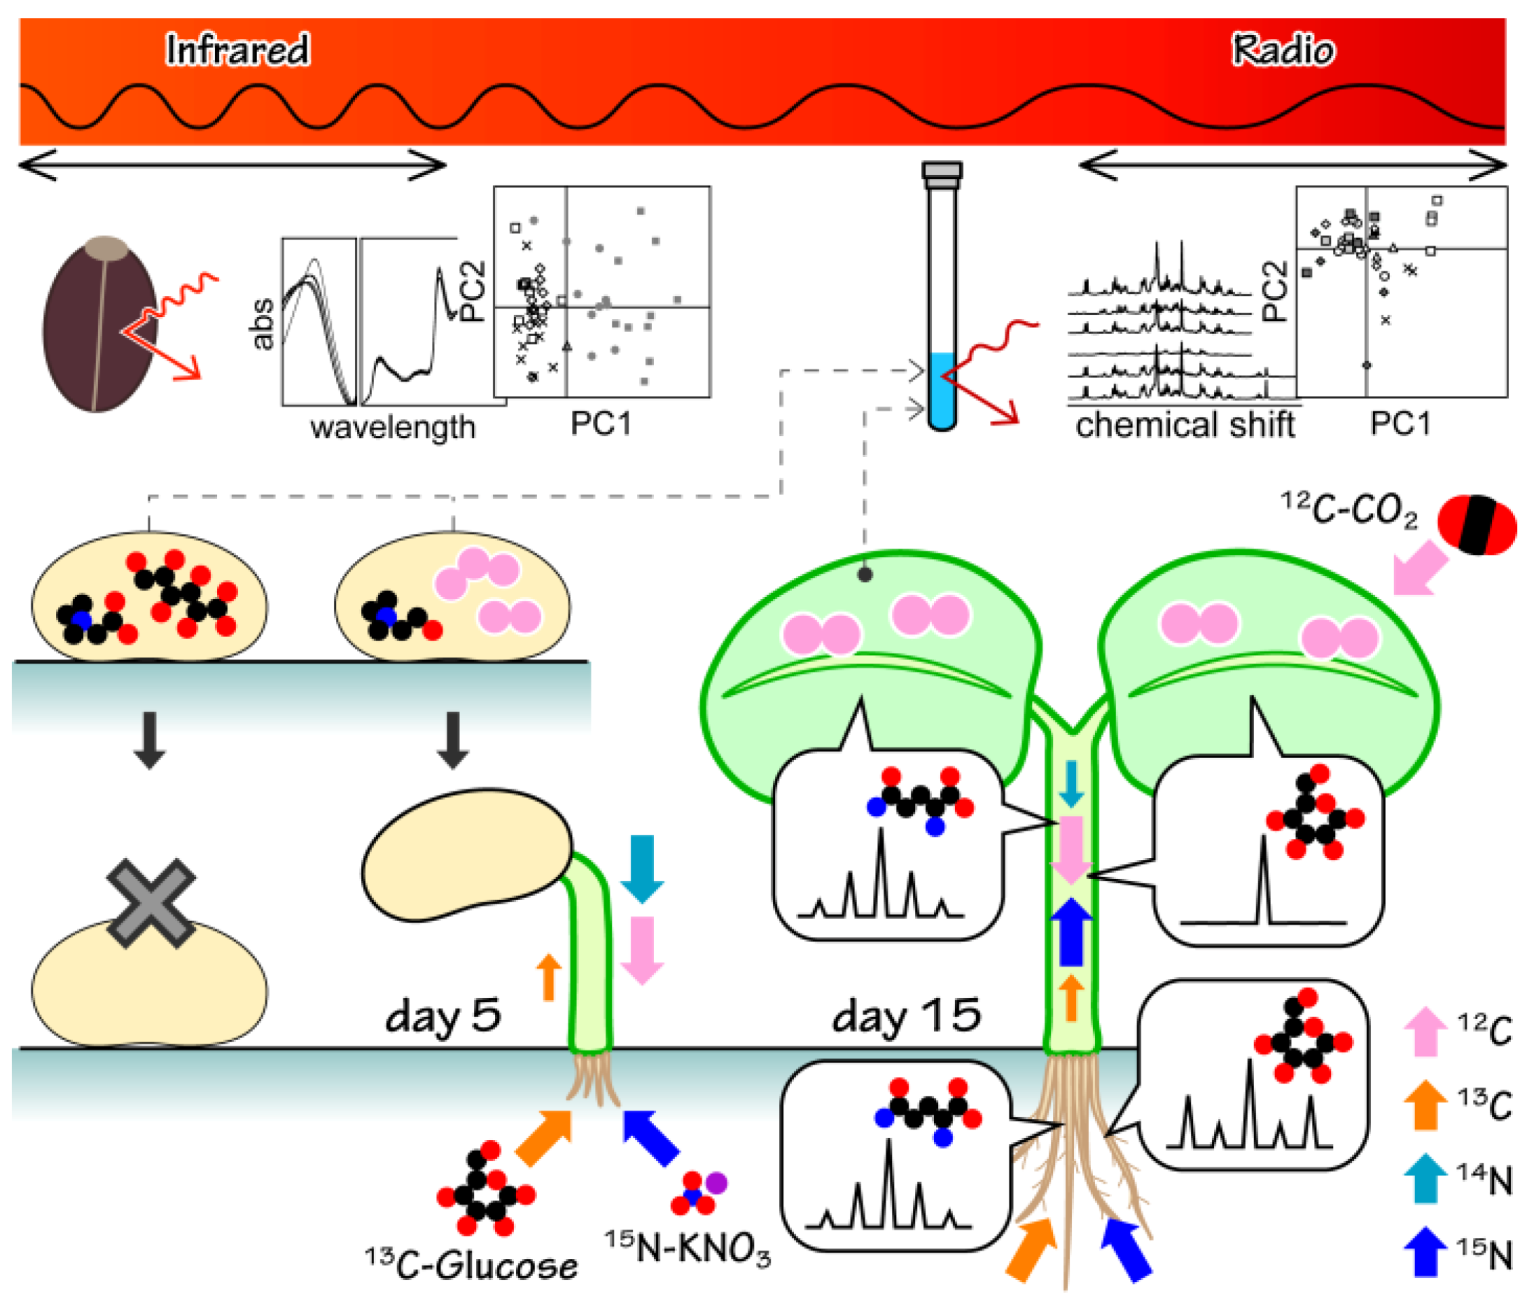
2.2. NMR-Based Metabolic Analysis in Primary Growth of J. curcas.

The 1H-1D NMR spectra of water-soluble metabolites from roots, stems, and leaves of J. curcas during primary growth stages (5, 10, and 15 days after seeding) are shown in Figure 3. The signal from the H1 proton of glucose residue in sucrose (5.40 ppm) was observed in each tissue at day 15, although it was not detected in days 5 and 10. The signal from the unsaturated part of proton (–C=CH–), methylene proton, and methyl proton in fatty acid, which were observed at 5.35–5.25, 1.35–1.15, and 0.90–0.85 respectively, were strongly generated in the leaves at days 5 and 10, whereas this decreased at day 15.
Figure 3. NMR analysis of water-soluble metabolites in different tissues of Jatropha curcas seedlings (2R09). (a) 1H-1D NMR spectra of leaves, stems, and roots harvested 5, 10, 15 days after germination. Signals from sucrose (b)–(d) were not detected or showed low levels at days 5 and 10. Signals from fatty acids (–C=CH–, –CH2–, and –CH3 for (e)–(g), respectively) were observed only in leaves.
Metabolites 04 01018 g003
These results indicate that metabolism in J. curcas had shifted from heterotrophic to autotrophic at a certain time point between days 10 and 15 of germination. Sucrose is the predominant product of photosynthesis and, therefore, accumulation of sucrose implies their autotrophic metabolism. On the other hand, large amounts of fatty acids in leaves were indicative of heterotrophic metabolism because gluconeogenesis from fatty acids via β-oxidation and glyoxylate cycle is a pivotal metabolic process of the seedlings. Glyoxysomes located in etiolated cotyledons contain enzymes of the fatty-acid β-oxidation cycle and the glyoxylate cycle [35]. Proteomics of germinating and post-germinating J. curcas have indicated that β-oxidation, glyoxylate cycle, glycolysis, citric acid cycle, gluconeogenesis, and the pentose phosphate pathway are involved in oil mobilization in seeds [11].
13C and 15N enrichments of the whole leaves, stems, and roots are shown in Table S1 and Figure S3. 13C enrichment in the roots was higher than that of the leaves and stems, which was 28.6% at day 15. 13C enrichments in the leaves and stems were limited; it was only 4.6% and 7.5% at day 15, respectively. This indicates that there are plenty of 12C, and not 13C-glucose. Contrary to this finding considerable 13C enrichments of glucose for NMR analysis were obtained in Arabidopsis thaliana [28,29,36,37]. It is considered that 13C and 15N-enrichemnts in this labeling strategy are depended on the mass of storage substrate in seeds because 13C and 15N-enrichemnts of them are natural abundant.
13C enrichments of each carbon atom in each metabolite were estimated using the ZQF-TOCSY spectra (Figure 4). In the 1H NMR spectra, 1H signals coupled with 13C gives doublet due to scalar coupling. Therefore, 13C-enrichments in each carbon atom in each metabolite was estimated from the ratio of integrations in 13C-coupled to non-coupled signals, although the IR-MS showed a 13C (and 15N) enrichment of total samples (Figure S3, these values were averaged 13C-enrichments from various metabolite and insoluble macromolecules such as proteins, nucleic acids, lignocelluloses, and plasma membranes). As described by Massou et al. [26,27], ZQF-TOCSY experiments are powerful methods for 13C-isotopic analysis that avoid significant signal overlapping of the 1H NMR spectra of the metabolite complex, thus enabling the estimation of 13C-enrichments in each carbon atom of every metabolite. ZQF-TOCSY experiments also provided better line shapes of signals than those of conventional TOCSY, thus, eliminating interference from zero-quantum coherence.
Figure 4. ZQF-TOCSY spectra for isotopic ratio estimation of each carbon in metabolites. (a) ZQF-TOCSY spectra of the roots (blue), leaves (green), and stems (red) at day 15; (b) The pseudo-1D 1H spectra generated from the ZQF-TOCSY spectra. Estimated 13C-enrichments are shown next to each pseudo-1D 1H spectra excepting Glc2 and 3. 1H signals coupled with 13C gives doublet due to scalar coupling. Therefore 13C-enrichments in each carbon atom in each metabolite were estimated from the ratio of integrations in 13C-coupled to non-coupled signals (Figure S4).
Metabolites 04 01018 g004
13C-enrichments estimated using the pseudo-1D 1H spectra are shown next to each spectrum in Figure 4b. Estimated 13C-enrichments of glucose C1 in root at 5, 10, and 15 days after seeding were 16.3%, 26.5%, and 51.4%, respectively. Additionally, estimated 13C-enrichments of glucose C1 in stem at 5, 10, and 15 days after seeding were 2.9%, 18.9%, and 13.9%, respectively. And estimated 13C-enrichments of glucose C1 in leaf at 5, 10, and 15 days after seeding were 0.4%, 7.4%, and 8.4%, respectively. This trend is the same as total 13C-enrichments measured with IR-MS, indicating that most glucose assimilated by the root was catabolized.
13C-detected 1H-13C HETCOR spectra of the leaves, stems, and roots are shown in Figure 5. The pseudo-1D 13C spectra of glucose, arginine, and glutamine generated from the 1H-13C-HETCOR spectra are shown in Figure 5b. In the roots, 13C-13C bond splitting were observed in all signals. In glucose, fully-labeled bondomers were predominant (Figure S4, doublets in C1 and double-doublets in C3, 4, and 5). On the other hand, in the leaves, the 13C-13C bond splitting of glucose significantly deceased. In arginine and glutamine, singlets, doublets, and double-doublets were observed, with the doublets occurring as a major component. Interestingly, the 13C-13C bond splitting patterns of arginine and glutamine in the leaves were identical to those in the roots. This indicates that arginine and glutamine were synthesized in the roots and were transferred to the leaves because there was only 4.6% of 13C in the leaves and trace amounts of the other amino acids in the 13C NMR spectrum.
Figure 5. 13C-detected 1H-13C-HETCOR spectra during 13C-13/12C bondmer analysis. (a) 13C-detected 1H-13C-HETCOR spectra of the roots (blue), leaves (green), and stems (red) at day 15; (b) The pseudo-1D 13C spectrum generated from the 1H-13C-HETCOR spectra. Generated points were indicated in (a) as a dotted line. Due to 13C-13C scalar couplings, the 13C signal is influenced by the labeling state of the adjacent carbons (Figure S4). Major bondmers estimated from signal splitting in the roots and leaves are shown as colored dots in molecular formula.
Metabolites 04 01018 g005
1H-13C HETCOR is a powerful tool for 13C-13/12C bondmer analysis compared to conventional methods. Signal splitting from 1JCC in 1D-13C NMR were conventionally used for 13C-13/12C bondmer analyses for the studies on metabolic flux and pathway investigations [22,38]. The 1H-13C-HSQC spectrum was also used instead of 1D-13C spectrum to avoid signal overlap of crowded molecules [23,28,29,39,40]. It is essential to enhance the spectral resolution of the indirect dimension (13C) to resolve splitting from 1JCC (typical value is 30–60 Hz). The experimental time was also extended based on the number of increments in the indirect dimension, which was gained to enhance the spectral resolution. In a 13C-detected 1H-13C HETCOR experiment, the resolution of the direct dimension 13C was gained by increasing the acquisition time. In the present study, the resolution of the direct dimension (13C) was 2.99 Hz, which was enough to distinguish splitting from 1JCC.
13C-optimized (a 13C radio frequency coil was located inside a 1H radio frequency coil) cryogenic probe promoted our strategy. 13C-NMR is lower sensitive than 1H-NMR (relative sensitivity to 1H-NMR is 0.016) because of their low natural abundance (~1.1%) and low gyromagnetic ratio of 13C nuclei (~25% of 1H). In the cryogenic probe technology, probe cooling reduces the contribution of electronic and thermal noise and provides an increase in signal-to-noise ratio. The 1H-optimized cryogenic probe has been used widely for 1H-NMR and 1H-13C-HSQC based metabolomics as well as protein NMR. In a few studies, 13C-detected-NMR was applied to metabolomics for example using 13C-13C-TOCSY for carbon backbone topology analysis of metabolites [15,41]. Keun et al. reported 13C-NMR metabolomics of natural abundant urine with 13C-optimized cryogenic probe [42]. 13C-optimized cryogenic probe enabled them recorded 13C-1D NMR spectra on a time scale that allows its routine use. In the present study, 1H-13C HETCOR spectra were recorded with 13C-optimized cryogenic probe. In 13C-detected 2D NMR including 1H-13C HETCOR, sensitivity improvement from 13C-optimized cryogenic probe is effective, because number of scan were limited compared to 13C-1D NMR.
Nitrates assimilated by the roots are immediately reduced and converted into an organic form such as amino acids, transported through the xylem to the leaves for reduction and synthesis of amino acids, or stored in the roots as vacuoles [43]. 15N enrichments obtained from IR-MS measurements indicated that most nitrogen from 15N-nitrates remained in the roots either in the inorganic or organic form (Table S1 and Figure S3), although 14N was introduced from degraded amino acids from stored proteins in the seeds. Ammonium, which is the reduced product of nitrates, is fixed into glutamine, with glutamate catalyzed by glutamine synthetase (GS). Subsequently, the ammonium molecule in glutamine is fixed into glutamate with 2-oxoglutarate and catalyzed by glutamine oxoglutarate aminotransferase (GOGAT). Glutamate was observed in the roots during 1H-13C HSQC (Figure S5), as well as ZQF-TOCSY (Figure 4), however trace amounts of glutamate were observed in the leaves and stems. These findings indicate that nitrogen fixation during the GS/GOGAT cycle and glutamate assimilation occurs in the roots during this condition. Two types of GS isoenzymes exist apparently non-redundantly in plants: cytosolic (GS1) or plastidic (GS2) [44,45]. GS1 plays important roles in the primary nitrogen assimilation in the roots [45].
Glutamine and arginine, as well as asparagine, are considered the major amino acids of the xylem, playing essentials roles in nitrogen transport [46,47,48]. Furthermore, arginine serves as a major storage form of nitrogen; most seeds contain 10%–40% of their nitrogen as arginine [49]. Glutamine and arginine are estimated as major organic nitrogen forms in nitrogen transport from observed 13C-13C splitting pattern in 13C-detected 1H-13C HETCOR spectra. Most of the stable isotope-labeled molecules assimilated by the plants are immediately metabolized in the roots. Part of the glutamine and arginine molecules in the roots was transferred to the leaves via the stems.
Further spectroscopic analyses could enable to monitor metabolic phenomena more dynamic in germinating seeds. We previously reported in vivo NMR techniques to mentor storage protein degradations in 15N-labled germinating seeds of Arabidopsis thaliana [37]. In the previous study, in vivo 1H-15N-HSQC detected glutamine, asparagine, glycine, arginine, and peptides as degradative product of storage protein. A magnetic resonance imaging (MRI) technique is also applicable to monitor water dynamics in germinating seeds. We previously demonstrated modulation of water dynamics with the circadian clock in a seedling of Arabidopsis thaliana by 1H-NMR microscopic imaging [50]. Recently 13C-NMR imaging (functional imaging) was also applied plant tissue fed 13C-labeled substrates [51,52,53]. Development and application of new spectroscopic techniques will contribute to plant science, as well as environmental science.

3. Experimental Section

3.1. Chemicals and Plant Materials

[13C6] glucose (99% 13C) was purchased from Sigma Aldrich JAPAN (Tokyo, JAPAN). Deuterium oxide (99% D) and potassium nitrate (99% 15N) were purchased from Cambridge Isotope Laboratories (MA, USA).
Seeds from 3 different breed varieties of J. curcas (IP1P, IP2P, and IP3P) were used. These were stored for 1–4 years in a refrigerator or a deep freezer at 277 and 243 K, respectively. These were then subjected to NIR and NMR analysis as described later. The seeds were germinated in a 0.8 wt % agar plate without any nutrient. Germination rates were calculated by numbers of germinated seedlings and total seeds. Germinated seedlings of 2R09 were transferred 3 days after seeding on a 0.8 wt % agar plate, according to Hirayama and Kikuchi [36], containing 37.6 mM [13C] glucose (99% 13C), 0.25 mM K15NO3, 0.5 mM potassium phosphate, 0.2 mM MgSO4, 0.2 mM CaCl2, and 5 μM Fe-EDTA at 313 K. 3 seedlings were harvested 5, 10, and 15 days after seeding. Seedlings were divided into leaves, stems, and roots, and subsequently lyophilized. The lyophilized tissue was ground to powder and submitted for IR-MS and NMR analysis.

3.2. Spectroscopic Analysis

The NIR spectra of seeds were non-invasively recorded using a NIRSCAN-MKII (Systems Engineering, Tokyo, Japan) and FQA NIRGUN (Shibuya Seiki, Shizuoka, Japan). The wavelength ranges employed were 1250–2500 and 600–1100 nm for NIRSCAN-MKII and FQA NIRGUN, respectively. Six samples (excepting 2R12) were used for NIR analysis.
Procedures of NMR sample preparation for metabolic analysis are described below. Seeds were divided into seed coat and kernel, comprising endosperm and embryo, and then the kernels were ground to pellets. Three pellets were suspended in 1 mL of hexane. The mixture was heated at 323 K for 5 min. The supernatants were removed after the mixture was centrifuged at 15,000 rpm for 5 min. This procedure was repeated three times to remove non-polar molecules. Remaining hexane was removed using a centrifugal evaporator (TOKYO RIKAKIKAI, Tokyo, Japan). The resultant powder was suspended in 600 μL of D2O/KPi buffer (100 mM, pH 7.0). The mixture was heated to 323 K for 5 min and centrifuged at 15,000 rpm for 5 min. The supernatant was directly used for solution NMR experiments. Seedling powders (15 mg) were also resuspended in 600 μL of D2O/ KPi buffer (100 mM, pH 7.0). The mixture was heated at 323 K for 5 min and centrifuged at 15,000 rpm for 5 min. The supernatant was directly used for solution NMR experiments. Due to the limitations of the sample amount, only one NMR sample was prepared to NMR analysis.
Sample solutions were transferred onto 5-mm NMR tubes. NMR spectra were recorded on an AvanceII-700 spectrometer (Bruker, MA, USA) equipped with an inverse triple resonance CryoProbe with a Z-axis gradient for 5-mm sample diameters operating at 700.15 MHz 1H frequency (for 1H-detect experiments) or an AvanceIII-600 spectrometer equipped with an 13C-optimized double resonance CryoProbe with a Z-axis gradient for 5-mm sample diameters operating at 600.13 MHz 1H frequency (for 13C-detect experiments). The temperature of the NMR samples was maintained at 298 K. 1H-1D spectra were recorded at pre-saturation or WATERGATE methods [54] to suppress water signals. The 2D 1H-13C HSQC spectra were measured using adiabatic refocus and inversion pulses. A total of 512 complex f1 (13C) and 1,024 complex f2 (1H) points were recorded with 16 and 8 scans per f1 increment for seeds and 13C-labled plant tissues, respectively. The spectral widths of the f1 and f2 dimensions for the 1H-13C HSQC spectra were 175 and 16 ppm, respectively. The ZQF-TOCSY were measured according to Thrippleton and Keeler [25]. The procedure was slightly modified to measure 13C enrichment by introducing a 13C refocusing pulse during t1 evolution to remove heteronuclear scalar coupling in the indirect dimension as described by Massou et al. [26,27] and to suppress water signals by introducing a pre-saturation pulse during a recycling delay. A total of 256 complex f1 (13C) and 16,384 complex f2 (1H) points were recorded with 16 scans per f1 increment. The spectral widths of the f1 and f2 dimensions for the ZQF-TOCSY spectra were 12 and 12 ppm, respectively. The 13C-detected 1H-13C HETCOR was measured using the phase-sensitive mode. A total of 128 complex f1 (1H) and 16,384 complex f2 (13C) points were recorded with 40 scans per f1 increment. The spectral widths of the f1 and f2 dimensions for the 1H-13C-HETCOR spectra were 10 and 162.4 ppm, respectively.
13C and 15N enrichments of plant tissues were measured using an IR-MS spectrometer (IsoPrime100, Isoprime, CA, USA) connected with an elemental analyzer (vario Micro cube, Elementar Analysensysteme, Hanau, Germany).

3.3. Multivariable Analysis of NIR and NMR Spectra

PCA was performed with the R software [55]. For NIR spectra, two regions (610–1070 and 1315–2450) recorded different spectrometer were used for PCA. Baseline of each spectrum was corrected, and then each spectrum was normalized to unit variance (without bucket integration). Subsequently, 2 different wavelength spectra were combined. Therefore, variances of 2 different wavelength spectra in resultant vector (combined spectrum) were the same. PCA was performed based on covariance matrix without scaling (a table raw operation), smoothing, truncation, and alignment. The Hotelling’s T2 95% confidence ellipse was drawn in the score plot. An outlier was removed, and then PCA was performed again. The 1D 1H spectra of the seeds were subdivided into sequential 0.05-ppm designated regions between 1H chemical shifts of 0.5 and 9.0. After exclusion of water resonance, each region was integrated. Integrated data was normalized with constant sum method (converted to unit total spectral integral). PCA was performed based on covariance matrix without scaling (a table raw operation), smoothing, truncation, and alignment. The Hotelling’s T2 95% confidence ellipse was drawn in the score plot.

4. Conclusions

A schematic summary of the present study is shown in Figure 6. In the first half of the figure, multi-spectroscopic analysis was applied to examine the viability of seeds of J. curcas. It was regretful that there was no discrimination based on their germination rate in PCA score plots of NIR spectra. On the other hand, there was discrimination based on their germination rate in PCA score plots of 1H-1D NMR spectra. Further multidimensional NMR analysis indicated that seeds worsened due to oxidative reactions of sugars. As a result, NMR metabolic profiling determined positive and negative biomarkers of seed germination. In the second half of the figure, stable-isotope labeling-facilitated NMR metabolic analysis was applied during their initial growth stage. Nutrients in medium were labeled with 13C and 15N, however storage compound and carbon dioxide were not labeled. Therefore, metabolites were labeled heterogeneously. 13C enrichments measured during 1H-NMR, as well as IR-MS were smaller than those of previous reports involving Arabidopsis thaliana. This finding indicates the occurrence of strong heterotrophic metabolism during their initial growth stage, using most of the stored carbon and nitrogen. Finally, 13C-detected 1H-13C HETCOR was applied for 13C-13C/12C bondmer analysis. The 13C-detected 1H-13C HETCOR experiment provided high-resolution 13C spectra of each metabolite. It is beneficial for 13C-13C/12C bondmer analysis, especially combined with 13C-optimized cryogenic probe. NMR metabolic analysis is a powerful method for evaluating seed quality and monitoring changes in metabolism in seedlings, which could contribute to the identification of chemotypes of common breeding varieties, as well as gene-modified plants.
Figure 6. A schematic summary of the present study. Two spectroscopy using different wavelength (NIR and NMR) were applied to examine the viability of seeds of J. curcas. PCA score plots of NMR spectra showed oxidative reaction made seeds worsen. Stable-isotope labeling of germinated seedlings was carried out with agar-plate containing 13C-glucose and 15N-nitrate. Estimated isotope flows were indicated in arrows. NMR isotopic analysis was applied during their initial growth stage. Isotopic analysis indicated isotope flow from root to leaf was small. Isotopic pattern in 13C-ditected 1H-13C HETCOR indicated glutamine and arginine were the major organic compounds for nitrogen and carbon transfer from roots to leaves.
Metabolites 04 01018 g006

Supplementary Files

Supplementary File 1

Acknowledgments

We thank the RIKEN NMR facility for the use of the 600-MHz NMR spectrometer (AvanceIII-600), as well as for their technical advice. We thank Kenji Sakata (RIKEN CSRS) for his technical assistance during our IR-MS measurements. We also thank Taiji Watanabe (Yokohama City University) for his help with the initial stage of this study. The RIKEN Junior Research Associate Program supported this study (T.K.). This research was also supported in part by Grants-in-Aid for Scientific Research (C) (J.K.) from the Ministry of Education, Culture, Sports, Science, and Technology, Japan, and Science and Technology Research Partnership for Sustainable Development (SATREPS to J.K., K.A.) from Japan Science and Technology Agency (JST) and the Japan International Cooperation Agency (JICA).

Author Contributions

All of the authors have given their approval to the final version of the manuscript.

Conflicts of Interest

The authors declare no conflict of interest.

References

  1. Fairless, D. Biofuel: The little shrub that could—maybe. Nature 2007, 449, 652–655. [Google Scholar] [CrossRef]
  2. Achten, W.M.J.; Verchot, L.; Franken, Y.J.; Mathijs, E.; Singh, V.P.; Aerts, R.; Muys, B. Jatropha bio-diesel production and use. Biomass Bioenergy 2008, 32, 1063–1084. [Google Scholar] [CrossRef] [Green Version]
  3. Martinez-Herrera, J.; Siddhuraju, P.; Francis, G.; Davila-Ortiz, G.; Becker, K. Chemical composition, toxic/antimetabolic constituents, and effects of different treatments on their levels, in four provenances of Jatropha curcas L. From mexico. Food Chem. 2006, 96, 80–89. [Google Scholar] [CrossRef]
  4. Maghuly, F.; Laimer, M. Jatropha curcas, a biofuel crop: Functional genomics for understanding metabolic pathways and genetic improvement. Biotechnol. J. 2013, 8, 1172–1182. [Google Scholar] [CrossRef] [PubMed]
  5. Sato, S.; Hirakawa, H.; Isobe, S.; Fukai, E.; Watanabe, A.; Kato, M.; Kawashima, K.; Minami, C.; Muraki, A.; Nakazaki, N.; et al. Sequence analysis of the genome of an oil-bearing tree, Jatropha curcas L. DNA Res. 2011, 18, 65–76. [Google Scholar] [CrossRef] [PubMed]
  6. Hirakawa, H.; Tsuchimoto, S.; Sakai, H.; Nakayama, S.; Fujishiro, T.; Kishida, Y.; Kohara, M.; Watanabe, A.; Yamada, M.; Aizu, T.; et al. Upgraded genomic information of Jatropha curcas L. Plant Biotechnol. 2012, 29, 123–130. [Google Scholar] [CrossRef]
  7. Finch-Savage, W.E.; Leubner-Metzger, G. Seed dormancy and the control of germination. New Phytol. 2006, 171, 501–523. [Google Scholar] [CrossRef] [PubMed]
  8. Moncaleano-Escandon, J.; Silva, B.C.F.; Silva, S.R.S.; Granja, J.A.A.; Alves, M.C.J.L.; Pompelli, M.F. Germination responses of Jatropha curcas L. Seeds to storage and aging. Ind. Crops Prod. 2013, 44, 684–690. [Google Scholar] [CrossRef]
  9. Costa, G.G.L.; Cardoso, K.C.; Del Bem, L.E.V.; Lima, A.C.; Cunha, M.A.S.; de Campos-Leite, L.; Vicentini, R.; Papes, F.; Moreira, R.C.; Yunes, J.A.; et al. Transcriptome analysis of the oil-rich seed of the bioenergy crop Jatropha curcas L. BMC Genomics 2010, 11. [Google Scholar] [CrossRef] [PubMed]
  10. Natarajan, P.; Parani, M. De novo assembly and transcriptome analysis of five major tissues of Jatropha curcas L. Using gs flx titanium platform of 454 pyrosequencing. BMC Genomics 2011, 12. [Google Scholar] [CrossRef] [PubMed]
  11. Yang, M.F.; Liu, Y.J.; Liu, Y.; Chen, H.; Chen, F.; Shen, S.H. Proteomic analysis of oil mobilization in seed germination and postgermination development of Jatropha curcas. J. Proteome Res. 2009, 8, 1441–1451. [Google Scholar] [CrossRef] [PubMed]
  12. Liu, H.; Liu, Y.J.; Yang, M.F.; Shen, S.H. A comparative analysis of embryo and endosperm proteome from seeds of Jatropha curcas. J. Integr. Plant Biol. 2009, 51, 850–857. [Google Scholar] [CrossRef] [PubMed]
  13. Liu, H.; Yang, Z.L.; Yang, M.F.; Shen, S.H. The differential proteome of endosperm and embryo from mature seed of Jatropha curcas. Plant Sci. 2011, 181, 660–666. [Google Scholar] [CrossRef] [PubMed]
  14. Bingol, K.; Bruschweiler, R. Multidimensional approaches to NMR-based metabolomics. Anal. Chem. 2014, 86, 47–57. [Google Scholar] [CrossRef] [PubMed]
  15. Bingol, K.; Zhang, F.; Bruschweiler-Li, L.; Bruschweiler, R. Carbon backbone topology of the metabolome of a cell. J. Am. Chem. Soc. 2012, 134, 9006–9011. [Google Scholar] [CrossRef] [PubMed]
  16. Chikayama, E.; Sekiyama, Y.; Okamoto, Y.; Nakanishi, Y.; Tsuboi, Y.; Akiyama, K.; Saito, K.; Shinozaki, K.; Kikuchi, J. Statistical indices for simultaneous large-scale metabolite detections for a single NMR spectrum. Anal. Chem. 2010, 82, 1653–1658. [Google Scholar] [CrossRef] [PubMed]
  17. Chikayama, E.; Suto, M.; Nishihara, T.; Shinozaki, K.; Kikuchi, J. Systematic NMR analysis of stable isotope labeled metabolite mixtures in plant and animal systems: Coarse grained views of metabolic pathways. PLoS One 2008, 3, e3805. [Google Scholar] [CrossRef] [PubMed]
  18. Sekiyama, Y.; Chikayama, E.; Kikuchi, J. Profiling polar and semipolar plant metabolites throughout extraction processes using a combined solution-state and high-resolution magic angle spinning NMR approach. Anal. Chem. 2010, 82, 1643–1652. [Google Scholar] [CrossRef] [PubMed]
  19. Sekiyama, Y.; Chikayama, E.; Kikuchi, J. Evaluation of a semipolar solvent system as a step toward heteronuclear multidimensional NMR-based metabolomics for 13C-labeled bacteria, plants, and animals. Anal. Chem. 2011, 83, 719–726. [Google Scholar] [CrossRef] [PubMed]
  20. An, Y.J.; Xu, W.J.; Jin, X.; Wen, H.; Kim, H.; Lee, J.; Park, S. Metabotyping of the C. elegans sir-2.1 mutant using in vivo labeling and 13C-heteronuclear multidimensional NMR metabolomics. ACS Chem. Biol. 2012, 7, 2012–2018. [Google Scholar] [CrossRef] [PubMed]
  21. Ratcliffe, R.G.; Shachar-Hill, Y. Revealing metabolic phenotypes in plants: Inputs from NMR analysis. Biol. Rev. Camb. Philos. Soc. 2005, 80, 27–43. [Google Scholar] [CrossRef] [PubMed]
  22. Allen, D.K.; Shachar-Hill, Y.; Ohlrogge, J.B. Compartment-specific labeling information in 13C metabolic flux analysis of plants. Phytochemistry 2007, 68, 2197–2210. [Google Scholar] [CrossRef] [PubMed]
  23. Flores, S.; Gosset, G.; Flores, N.; de Graaf, A.A.; Bolivar, F. Analysis of carbon metabolism in escherichia coli strains with an inactive phosphotransferase system by 13C labeling and NMR spectroscopy. Metab. Eng. 2002, 4, 124–137. [Google Scholar] [CrossRef] [PubMed]
  24. Masakapalli, S.K.; Ratcliffe, R.G.; Williams, T.C. Quantification of 13C enrichments and isotopomer abundances for metabolic flux analysis using 1D NMR spectroscopy. Methods Mol. Biol. 2014, 1090, 73–86. [Google Scholar] [PubMed]
  25. Thrippleton, M.J.; Keeler, J. Elimination of zero-quantum interference in two-dimensional NMR spectra. Angew. Chem.-Int. Ed. 2003, 42, 3938–3941. [Google Scholar] [CrossRef]
  26. Massou, S.; Nicolas, C.; Letisse, F.; Portais, J.C. NMR-based fluxomics: Quantitative 2D NMR methods for isotopomers analysis. Phytochemistry 2007, 68, 2330–2340. [Google Scholar] [CrossRef] [PubMed]
  27. Massou, S.; Nicolas, C.; Letisse, F.; Portais, J.C. Application of 2D-TOCSY NMR to the measurement of specific 13C-enrichments in complex mixtures of 13C-labeled metabolites. Metab. Eng. 2007, 9, 252–257. [Google Scholar] [CrossRef] [PubMed]
  28. Sekiyama, Y.; Kikuchi, J. Towards dynamic metabolic network measurements by multi-dimensional NMR-based fluxomics. Phytochemistry 2007, 68, 2320–2329. [Google Scholar] [CrossRef]
  29. Tian, C.; Chikayama, E.; Tsuboi, Y.; Kuromori, T.; Shinozaki, K.; Kikuchi, J.; Hirayama, T. Top-down phenomics of arabidopsis thaliana: Metabolic profiling by one- and two-dimensional nuclear magnetic resonance spectroscopy and transcriptome analysis of albino mutants. J. Biol. Chem. 2007, 282, 18532–18541. [Google Scholar] [CrossRef] [PubMed]
  30. Castillo, E.M.; Delumen, B.O.; Reyes, P.S.; Delumen, H.Z. Raffinose synthase and galactinol synthase in developing seeds and leaves of legumes. J. Agric. Food Chem. 1990, 38, 351–355. [Google Scholar] [CrossRef]
  31. ElSayed, A.I.; Rafudeen, M.S.; Golldack, D. Physiological aspects of raffinose family oligosaccharides in plants: Protection against abiotic stress. Plant Biol. 2014, 16, 1–8. [Google Scholar] [CrossRef] [PubMed]
  32. Saravitz, D.M.; Pharr, D.M.; Carter, T.E. Galactinol synthase activity and soluble sugars in developing seeds of 4 soybean genotypes. Plant Physiol. 1987, 83, 185–189. [Google Scholar] [CrossRef] [PubMed]
  33. Taji, T.; Ohsumi, C.; Iuchi, S.; Seki, M.; Kasuga, M.; Kobayashi, M.; Yamaguchi-Shinozaki, K.; Shinozaki, K. Important roles of drought- and cold-inducible genes for galactinol synthase in stress tolerance in arabidopsis thaliana. Plant J. 2002, 29, 417–426. [Google Scholar] [CrossRef] [PubMed]
  34. Dierking, E.C.; Bilyeu, K.D. Raffinose and stachyose metabolism are not required for efficient soybean seed germination. J. Plant Physiol. 2009, 166, 1329–1335. [Google Scholar] [CrossRef] [PubMed]
  35. Fukao, Y.; Hayashi, M.; Hara-Nishimura, I.; Nishimura, M. Novel glyoxysomal protein kinase, gpk1, identified by proteomic analysis of glyoxysomes in etiolated cotyledons of arabidopsis thaliana. Plant Cell Physiol. 2003, 44, 1002–1012. [Google Scholar] [CrossRef] [PubMed]
  36. Kikuchi, J.; Hirayama, T. Practical aspects of uniform stable isotope labeling of higher plants for heteronuclear NMR-based metabolomics. Methods Mol. Biol. 2007, 358, 273–286. [Google Scholar] [PubMed]
  37. Kikuchi, J.; Shinozaki, K.; Hirayama, T. Stable isotope labeling of arabidopsis thaliana for an NMR-based metabolomics approach. Plant Cell Physiol. 2004, 45, 1099–1104. [Google Scholar] [CrossRef]
  38. Eisenreich, W.; Menhard, B.; Hylands, P.J.; Zenk, M.H.; Bacher, A. Studies on the biosynthesis of taxol: The taxane carbon skeleton is not of mevalonoid origin. Proc. Natl. Acad. Sci. USA 1996, 93, 6431–6436. [Google Scholar] [PubMed]
  39. Goudar, C.; Biener, R.; Boisart, C.; Heidemann, R.; Piret, J.; de Graaf, A.; Konstantinov, K. Metabolic flux analysis of CHO cells in perfusion culture by metabolite balancing and 2D [13C, 1H] COSY NMR spectroscopy. Metab. Eng. 2010, 12, 138–149. [Google Scholar] [CrossRef] [PubMed]
  40. Szyperski, T.; Bailey, J.E.; Wuthrich, K. Detecting and dissecting metabolic fluxes using biosynthetic fractional 13C labeling and two-dimensional NMR spectroscopy. Trends Biotechnol. 1996, 14, 453–459. [Google Scholar] [CrossRef]
  41. Bingol, K.; Zhang, F.; Bruschweiler-Li, L.; Bruschweiler, R. Quantitative analysis of metabolic mixtures by two-dimensional 13C constant-time tocsy NMR spectroscopy. Anal. Chem. 2013, 85, 6414–6420. [Google Scholar] [CrossRef] [PubMed]
  42. Keun, H.C.; Beckonert, O.; Griffin, J.L.; Richter, C.; Moskau, D.; Lindon, J.C.; Nicholson, J.K. Cryogenic probe 13C NMR spectroscopy of urine for metabonomic studies. Anal. Chem. 2002, 74, 4588–4593. [Google Scholar] [CrossRef] [PubMed]
  43. Lea, P.J.; Ireland, R.J. Nitrogen metabolism in higher plants. In Plant Amino Acids: Biochemistry and Biotechnology; Marcel Dekker Inc: New York, NY, USA, 1999; pp. 1–47. [Google Scholar]
  44. Betti, M.; Garcia-Calderon, M.; Perez-Delgado, C.M.; Credali, A.; Estivill, G.; Galvan, F.; Vega, J.M.; Marquez, A.J. Glutamine synthetase in legumes: Recent advances in enzyme structure and functional genomics. Int. J. Mol. Sci. 2012, 13, 7994–8024. [Google Scholar] [CrossRef] [PubMed]
  45. Bernard, S.M.; Habash, D.Z. The importance of cytosolic glutamine synthetase in nitrogen assimilation and recycling. New Phytol. 2009, 182, 608–620. [Google Scholar] [CrossRef] [PubMed]
  46. Sauter, J.J.; Vancleve, B. Seasonal-variation of amino-acids in the xylem sap of populus x canadensis and its relation to protein body mobilization. Trees-Struct. Funct. 1992, 7, 26–32. [Google Scholar] [CrossRef]
  47. Dilworth, M.F.; Dure, L. Developmental biochemistry of cotton seed embryogenesis and germination 10. Nitrogen flow from arginine to asparagine in germination. Plant Physiol. 1978, 61, 698–702. [Google Scholar] [CrossRef] [PubMed]
  48. Escher, P.; Eiblmeier, M.; Hetzger, I.; Rennenberg, H. Spatial and seasonal variation in amino compounds in the xylem sap of a mistletoe (viscum album) and its hosts (populus spp. And abies alba). Tree Physiol. 2004, 24, 639–650. [Google Scholar] [CrossRef] [PubMed]
  49. Vanetten, C.H.; Kwolek, W.F.; Peters, J.E.; Barclay, A.S. Plant seeds as protein sources for food or feed. Evaluation based on amino acid composition of 379 species. J. Agric. Food Chem. 1967, 15, 1077. [Google Scholar] [CrossRef]
  50. Takase, T.; Ishikawa, H.; Murakami, H.; Kikuchi, J.; Sato-Nara, K.; Suzuki, H. The circadian clock modulates water dynamics and aquaporin expression in arabidopsis roots. Plant Cell Physiol. 2011, 52, 373–383. [Google Scholar] [CrossRef] [PubMed]
  51. Melkus, G.; Rolletschek, H.; Fuchs, J.; Radchuk, V.; Grafahrend-Belau, E.; Sreenivasulu, N.; Rutten, T.; Weier, D.; Heinzel, N.; Schreiber, F.; et al. Dynamic 13C/1H NMR imaging uncovers sugar allocation in the living seed. Plant Biotechnol. J. 2011, 9, 1022–1037. [Google Scholar] [CrossRef] [PubMed]
  52. Rolletschek, H.; Melkus, G.; Grafahrend-Belau, E.; Fuchs, J.; Heinzel, N.; Schreiber, F.; Jakob, P.M.; Borisjuk, L. Combined noninvasive imaging and modeling approaches reveal metabolic compartmentation in the barley endosperm. Plant Cell 2011, 23, 3041–3054. [Google Scholar] [CrossRef] [PubMed]
  53. Borisjuk, L.; Rolletschek, H.; Neuberger, T. Surveying the plant’s world by magnetic resonance imaging. Plant J. 2012, 70, 129–146. [Google Scholar] [CrossRef] [PubMed]
  54. Liu, M.L.; Mao, X.A.; Ye, C.H.; Huang, H.; Nicholson, J.K.; Lindon, J.C. Improved watergate pulse sequences for solvent suppression in NMR spectroscopy. J. Magn. Reson. 1998, 132, 125–129. [Google Scholar] [CrossRef]
  55. The R Project for Statistical Computing. Available online: http://www.r-project.org/ (accessed on 11 November 2014).

