Article

2D BAO vs. 3D BAO: Solving the Hubble Tension with Bimetric Cosmology

by
Sowmaydeep Dwivedi
1 and
Marcus Högås
2,*
1
Department of Physics, Indiana University Bloomington, Bloomington, IN 47405, USA
2
Oskar Klein Centre, Department of Physics, Stockholm University, SE-106 91 Stockholm, Sweden
*
Author to whom correspondence should be addressed.
Universe 2024, 10(11), 406; https://doi.org/10.3390/universe10110406
Submission received: 3 September 2024 / Revised: 11 October 2024 / Accepted: 24 October 2024 / Published: 28 October 2024
(This article belongs to the Special Issue Current Status of the Hubble Tension)

Abstract

:
Ordinary 3D Baryon Acoustic Oscillations (BAO) data are model-dependent, requiring the assumption of a cosmological model to calculate comoving distances during data reduction. Throughout the present-day literature, the assumed model is Λ CDM. However, it has been pointed out in several recent works that this assumption can be inadequate when analyzing alternative cosmologies, potentially biasing the Hubble constant ( H 0 ) low, thus contributing to the Hubble tension. To address this issue, 3D BAO data can be replaced with 2D BAO data, which are only weakly model-dependent. The impact of using 2D BAO data, in combination with alternative cosmological models beyond Λ CDM, has been explored for several phenomenological models, showing a promising reduction in the Hubble tension. In this work, we accommodate these models in the theoretically robust framework of bimetric gravity. This is a modified theory of gravity that exhibits a transition from a (possibly) negative cosmological constant in the early universe to a positive one in the late universe. By combining 2D BAO data with cosmic microwave background and type Ia supernovae data, we find that the inverse distance ladder in this theory yields a Hubble constant of H 0 = ( 71.0 ± 0.9 ) km / s / Mpc , consistent with the SH0ES local distance ladder measurement of H 0 = ( 73.0 ± 1.0 ) km / s / Mpc . Replacing 2D BAO with 3D BAO results in H 0 = ( 68.6 ± 0.5 ) km / s / Mpc from the inverse distance ladder. We conclude that the choice of BAO data significantly impacts the Hubble tension, with ordinary 3D BAO data exacerbating the tension, while 2D BAO data provide results consistent with the local distance ladder.

1. Introduction

In the early 20th century, the advent of Einstein’s general theory of relativity (GR) revolutionized our understanding of gravity, providing a robust framework that successfully describes a myriad of cosmic phenomena—ranging from the perihelion precession of Mercury to gravitational lensing and the existence of black holes [1]. This, together with the Standard Model of particle physics, has paved the path for the Λ Cold Dark Matter ( Λ CDM) model, providing a cosmological framework that accounts for the vast majority of current observations with astonishing precision.
However, as we have entered the era of high-precision cosmology, a handful of tensions have emerged. The most prominent is the Hubble tension which refers to the fact that the local measurement of the Hubble constant significantly exceeds the inferred value from the inverse distance ladder. The most discrepant estimates are between the local H 0 measurement from the SH0ES team, H 0 = ( 73.0 ± 1.0 ) km / s / Mpc  [2], and the inferred value from the inverse distance ladder using Planck satellite data, H 0 = ( 67.8 ± 0.5 ) km / s / Mpc  [3]. This amounts to a 5 σ discrepancy, making it difficult to explain as a mere statistical fluke. Despite diligent searches for possible systematic errors to explain the tension, it has just been increasing during the last decade.
Accordingly, there is an intense discussion in the contemporary literature about whether new physics can alleviate the tension. That is, lowering the local distance ladder (SH0ES) value or increasing the inverse distance ladder value1 [4]. The former can be achieved by postulating a new gravitational degree of freedom that modifies gravity on galactic and astronomical scales—a fifth force. This results in a recalibration of the cosmic distance ladder, changing the local distance ladder value of H 0 [5,6,7]. On the other hand, the inferred value of H 0 from the inverse distance ladder assumes a Λ CDM cosmological model. That is, alternative expansion histories can change the inferred value of H 0 which may result in increased consistency with the local distance ladder. This can be achieved by introducing new particles, changing the properties of dark matter or dark energy, or by modifying the theory of gravity itself, see Refs. [8,9,10,11,12] for some examples. The focus of this paper is on the latter option, and more precisely on the bimetric theory of gravity and its effect on the Hubble tension.
However, the combination of standard 3D BAO, cosmic microwave background (CMB), and type Ia supernovae (SNIa) data, tightly restricts any deviation from a Λ CDM expansion history at late times (redshift z 2 ), leaving little room for a late-time alternative expansion history to resolve the Hubble tension. On the other hand, several recent studies emphasize that the 3D BAO data reduction inherently assumes a cosmological model, universally assumed to be Λ CDM or some slight variation thereof [13,14,15]. This introduces a model dependence that is incompatible with alternative expansion histories, raising concerns about the appropriateness of using 3D BAO data to restrict non-standard cosmological models, see for example Refs. [16,17,18,19,20,21,22,23,24,25,26,27]. In particular, the  Λ CDM assumption may bias the Hubble constant low, thereby giving rise to the Hubble tension.
To address this issue, the 2D transverse BAO scale (2D BAO) can be used, as it is only weakly model-dependent [16,21,28,29,30,31,32]. As opposed to 3D BAO, 2D BAO allows for significant deviations from Λ CDM at late times. Recent studies suggest that 2D BAO, combined with a modified late-time expansion history, favors a Hubble constant consistent with the SH0ES measurement, thus alleviating the tension [33,34,35,36,37,38,39]. These results are based on phenomenological models such as the Λ s CDM model [35,36,37] and phenomenological emergent dark energy [40]. In the current paper, we analyze the cosmology of bimetric gravity which is a theoretically robust framework that accommodates a range of these phenomenological models. Thus, we are not surprised to find that this theory has beneficial effects on the Hubble tension when 2D BAO data are used in combination with CMB and SNIa.
Bimetric gravity is a natural extension of GR, exhibiting a massive spin-2 field in addition to the massless spin-2 field [41,42]. The theory is observationally viable, as demonstrated in a number of papers [43,44,45,46,47,48,49,50,51,52,53,54,55,56,57,58,59,60,61]. Among its virtues is the existence of self-accelerating cosmological solutions where the accelerated expansion of the Universe is a result of the interaction between the two spin-2 fields—no cosmological constant is needed [43,45,48,58,62,63,64,65,66]. Another interesting feature is that, under certain conditions, the massive spin-2 field provides a dark matter particle [67,68,69]. The theory is also scientifically tractable in the sense that even the most general version of the theory only introduces four additional theory parameters, which can be constrained observationally.
Nevertheless, bimetric gravity provides a rich spectrum of cosmological expansion histories that can modify the expansion rate both pre- and post-recombination, thus changing the H 0 value inferred from the inverse distance ladder. The effect of bimetric gravity on the Hubble tension was investigated in Ref. [70] for a restricted subclass of models—more precisely—for some special two-parameter models. It was shown that, for this subclass of models, the tension is eased only very slightly.
In the present work, however, we do not restrict ourselves to a limited type of submodel but analyze the most general bimetric model. We compare the results using ordinary 3D BAO data with the results using transverse 2D BAO data (BAOtr). We infer H 0 = ( 71.0 ± 0.9 ) km / s / Mpc from the inverse distance ladder when the general bimetric model is fitted with data from the cosmic microwave background (CMB), type Ia supernovae (SNIa), and 2D BAO. This is on the 2 σ border of the SH0ES value for H 0 . Using 3D BAO instead of 2D BAO, the inferred value is H 0 = ( 68.6 ± 0.5 ) km / s / Mpc , representing only a slight ease of the tension, being in the 4.4 σ tail of the SH0ES value. The disparate result of 2D BAO compared with 3D BAO suggests that the cosmological model dependence in ordinary 3D BAO data may bias H 0 to a low value.

Notation

Unless stated otherwise, we use geometrized units where the speed of light and Newton’s gravitational constant are unity, c = G = 1 . In this case, length, time, and mass all have the same units L = T = M . Geometrical quantities pertaining to the second metric f μ ν are denoted by tildes—if not—then pertaining to the physical metric g μ ν . Derivatives with respect to time are denoted by an overdot, so, for example, a ˙ = d a d t . We let ω x = Ω x , 0 h 2 where h = H 0 / ( 100 km / s / Mpc ) is the normalized Hubble constant and Ω x , 0 denotes the present-day density of the species x. The Hubble constant H 0 is given in units of km / s / Mpc .

2. Bimetric Gravity

2.1. Historical Background

Bimetric gravity posits the existence of two dynamical spin-2 fields, or metrics, governing gravitational interactions. The first steps towards the present-day, ghost-free formulation of this theory were taken by Fierz and Pauli in 1939 [71]. They formulated a consistent linearized theory for a freely propagating massive spin-2 field in Minkowski space-time. However, in 1972 Boulware and Deser examined the coherence of a broad range of nonlinear extensions of this theory. Their conclusion was that the introduction of an additional propagating ghost-like scalar mode is unavoidable in any nonlinear extension of the theory [72]. Nevertheless, building upon works by de Rham, Gabadadze, and Tolley [73,74,75,76,77,78], in 2011 Hassan and Rosen formulated the ghost-free version of bimetric gravity with two dynamical metrics (spin-2 fields) [41,79,80]. This marked the rebirth of massive gravity which has been intensely studied since.

2.2. Theory

The ghost-free action for bimetric gravity reads
S HR = d 4 x 1 2 κ g det g R + 1 2 κ f det f R ˜ det g n = 0 4 β n e n ( S ) + + det g L m + det f L ˜ m .
In the action, g μ ν and f μ ν are the two metrics (spin-2 fields) and R and R ˜ are the corresponding Ricci scalars. The two metrics are dynamical with each metric exhibiting an Einstein–Hilbert term, κ g = 8 π G / c 4 represents the gravitational constant for g μ ν , while κ f denotes the gravitational constant for f μ ν . The Lagrangians L m and L ˜ m characterize two independent matter sectors coupled to g μ ν and f μ ν , respectively [81,82]. For simplicity, we only consider matter fields coupled to g μ ν (i.e., assuming L ˜ m = 0 ), which we accordingly identify as the physical metric, determining the geodesics of freely falling observers. Further, the elementary symmetric polynomials of the square root (S) of the two metrics, denoted by e n ( S ) in (1), are
e 0 ( S ) = 1 , e 1 ( S ) = [ S ] , e 2 ( S ) = 1 2 ( [ S ] 2 [ S 2 ] ) , e 3 ( S ) = 1 6 ( [ S ] 3 3 [ S 2 ] [ S ] + 2 [ S 3 ] ) , e 4 ( S ) = det ( S ) .
In (2), [ S ] = Tr S. The square root of the two metrics, S, is defined by the equation2  S μ ρ S ρ ν = g μ ρ f ρ ν [83,84]. The five coefficients β n of the polynomials e n ( S ) are constants with the dimension of curvature 1 / L 2 with β 1 , β 2 , and  β 3 determining the interaction between the two metrics and β 0 and β 4 contributing with a cosmological constant to the g-metric and f-metric, respectively.
As opposed to some other modified gravity theories such as Horndeski theory [85], bimetric gravity features a finite number of theory parameters which makes the theory scientifically tractable, with the possibility to falsify the theory and constrain the theory parameters. As they stand, the β -parameters cannot be constrained by observations due to their invariance under the rescaling
( f μ ν , κ f , β n ) ( ω f μ ν , ω κ f , ω n / 2 β n ) ,
with ω being an arbitrary constant. Therefore, rescaling-invariant parameters are introduced [55,58] as
B n κ g β n c n H 0 2 .
Here, c is the proportionality constant between the metrics in the final de Sitter phase in the cosmological infinite future where f μ ν = c 2 g μ ν . For more details, see Refs. [58,61]. The Hubble constant H 0 is included in the definition of B n to render the B n -parameters dimensionless. Due to the B n -parameters being invariant under the rescaling, they can be observationally constrained.
To enable an intuitive interpretation, we reparameterize from ( B 0 , B 1 , B 2 , B 3 , B 4 ) to what we refer to as the physical parameters ( θ , m FP , Ω Λ , α , β ) , defined by,
tan 2 θ = B 1 + 3 B 2 + 3 B 3 + B 4 B 0 + 3 B 1 + 3 B 2 + B 3 ,
m FP 2 = B 1 + 2 B 2 + B 3 sin 2 θ ,
Ω Λ = B 0 3 + B 1 + B 2 + B 3 3 ,
α = B 2 + B 3 B 1 + 2 B 2 + B 3 ,
β = B 3 B 1 + 2 B 2 + B 3 .
As implied by their name, the physical parameters carry specific interpretations. Firstly, the mixing angle θ [ 0 , π / 2 ] governs the mixing of the massive and massless spin-2 fields, also known as mass eigenstates. In the limit θ 0 , GR is retained whereas in the limit θ π / 2 , dRGT massive gravity is retained. The parameter m FP represents the mass of the massive spin-2 field. The effective cosmological constant in the final de Sitter phase in the Universe’s expansion history is denoted by Ω Λ . Lastly, the parameters α and β play a crucial role in determining the Vainshtein screening mechanism that is responsible for recovering GR results on solar-system scales.

2.3. Cosmology

From the Hassan–Rosen action (1), one can derive the Friedmann equation governing the evolution of a homogeneous and isotropic universe, as a function of the redshift z,
H ( z ) H 0 2 = Ω m ( z ) + Ω r ( z ) + Ω DE ( z ) .
Thus, Ω i = ρ i / ρ c denotes the dimensionless energy density of species i, that is, the physical energy density ρ i measured in units if the present-day critical density ρ c = 3 H 0 2 / κ g . Here, we have set the spatial curvature to zero, Ω k = 0 . H = a ˙ / a is the Hubble parameter with a being the scale factor of the physical metric and H 0 is the present-day value of H, that is, the Hubble constant. Further, Ω m and Ω r denote the energy density of matter and radiation, respectively, both measured in units of the present-day critical energy density. What distinguishes Equation (10) from the ordinary Friedmann equation of the Λ CDM model is the last term, Ω DE , which results from the interaction between the two metrics. It reads,
Ω DE ( z ) = Ω Λ sin 2 θ m FP 2 1 y ( z ) 1 + α ( 1 y ( z ) ) + β 3 ( 1 y ( z ) ) 2 ,
where y a ˜ / a is the ratio of the scale factors of the two metrics. The first term, Ω Λ , gives a cosmological constant contribution whereas the remaining terms give a dynamical contribution that evolves with the redshift z.
From the conservation equations of matter and radiation, it follows that,
Ω m ( z ) = Ω m , 0 ( 1 + z ) 3 , Ω r ( z ) = Ω r , 0 ( 1 + z ) 4 ,
with Ω m , 0 and Ω r , 0 being the present-day matter density and radiation density, respectively. Finally, an equation can be derived for y in the form of a quartic polynomial in y. The full expression is shown in Equation (A1).
With y being a solution to a quartic polynomial, there are up to four real solutions. Here, we choose the solution which is commonly referred to as the “finite branch”. This branch guarantees the absence of the Higuchi ghost and allows for a screening mechanism that restores GR on solar-system scales [58,86,87,88,89]. This branch has a finite range in y, starting with y = 0 at the Big Bang, then monotonically increasing until y = 1 is reached in the infinite future, that is, in the final de Sitter phase.
In the early-time limit z , one can show that the bimetric contribution to the Friedmann equation, Ω DE , generically assumes the form of a cosmological constant with magnitude
Ω DE | z = Ω Λ sin 2 θ m FP 2 1 + α + β 3 .
That is, at early times the background evolution of the Universe is according to a Λ CDM model with a value of the, possibly negative, cosmological constant that is given by Equation (13) [58]. In the infinite future, the Universe approaches a de Sitter phase where the cosmological constant is set by Ω Λ  [58]. So, bimetric cosmology exhibits two Λ CDM phases with generically different cosmological constants, one in the early universe and one in the late universe. The redshift ranges of these phases are primarily set by the mass of the massive spin-2 field, m FP . In the transition between the two Λ CDM phases, there is a rich spectrum of expansion histories depending on the physical parameters (5)–(9). One can show that if Ω DE is negative, the equation of state w DE 1 whereas if Ω DE is positive the equation of state is w DE 1 3 [90]. In other words, Ω DE grows with time, thus presenting a phantom dark energy contribution to the Friedmann Equation (10). However, w DE 1 is fast enough in the late universe, thus avoiding a Big Rip [58,91].
To enable statistical data analysis, we must solve the Hubble parameter as a function of redshift H ( z ) . This is conducted by solving the cosmological equations of motion numerically, that is, Equations (10)–(12) and (A1). The value of y at z = 0 is determined by solving Equation (A2) numerically, choosing the finite branch solution with y 0 in the range 0 y 0 1 . Subsequently, this value of y 0 allows the calculation of Ω DE , 0 using Equation (11). Further, the application of Friedman’s Equation (10) at z = 0 yields
Ω m , 0 = 1 Ω DE , 0 Ω r , 0 ,
since H 2 ( z ) H 0 2 z = 0 = 1 , by definition. With Ω m , 0 and Ω r , 0 being determined4, the remaining step to obtain H ( z ) is to solve Equation (A1) for y at each redshift, plugging the solution into Equation (11) to determine Ω DE ( z ) and then finally H ( z ) via Equation (10).

3. Methodology and Data

3.1. The SH0ES H 0 Estimate

The SH0ES team estimate of H 0 is based on a three-rung cosmic distance ladder [2]. In the first rung, the period-luminosity relation (PLR) for Cepheid variable stars [92] is calibrated in three anchor galaxies, the Milky Way (MW), NGC 4258, and the Large Magellanic Cloud (LMC). To calibrate the PLR, the distance to these Cepheids must be known. In the MW, the distances can be estimated geometrically from parallax measurements [93,94]. The distance to NGC 4258 is estimated from water masers close to the center of this galaxy [95]. The distance to the LMC is estimated from observations of detached eclipsing binaries [96].
In the second rung, the absolute peak magnitude of type Ia supernovae is calibrated in galaxies hosting both SNIa and Cepheids. In the third rung, SNIa is observed in the Hubble flow which yields the magnitude-redshift relation [97]. With the calibrated value for the absolute SNIa peak magnitude, H 0 is finally obtained from the intercept of the magnitude-redshift relation. The 2022 baseline result from the SH0ES team, fitting all three rungs simultaneously, is H 0 = ( 73.0 ± 1.0 ) km / s / Mpc [2]. This can be used as a prior on H 0 in which case the contribution to the likelihood is given by
2 ln L SH 0 ES = H 0 model 73.0 km / s / Mpc 1.0 km / s / Mpc 2 .

3.2. Cosmic Microwave Background

As the temperature of the Universe had dropped sufficiently, neutral hydrogen was formed and the photons decoupled from the baryon–photon fluid and began to free stream. This is known as recombination, or photon decoupling, and happens at a redshift of z * 1090 . Today, we can observe these photons as cosmic microwave background radiation, carrying the imprint of the fluctuations in the baryon–photon fluid at the last-scattering surface at redshift z * .
The Planck satellite observations of the temperature fluctuations in the CMB can be used to estimate H 0 assuming a model, for example, Λ CDM [3]. Here, we investigate the inferred value of H 0 in the case of bimetric cosmology. For this purpose, we use the CMB compressed likelihood featuring the three parameters ( R , l A , ω b ) . The “shift parameter” R encodes the angular scale of the Hubble horizon at the photon decoupling epoch and is defined by [98]
R = Ω m , 0 H 0 2 D A ( z * ) .
The comoving angular diameter distance D A is calculated by
D A ( z ) = 0 z d z H ( z ) ,
assuming a spatially flat cosmology. The redshift z * of photon decoupling is given by the analytical approximation in Ref. [99].
The sound horizon at photon decoupling defines a standard ruler which is imprinted in the CMB temperature fluctuations. This manifests itself as a maximal correlation between hotspots in the CMB temperature map occurring at the angular scale θ CMB , given by
θ CMB = r s ( z * ) / D A ( z * ) .
The parameter l A is the multipole number corresponding to this angular scale,
l A = π D A ( z * ) / r s ( z * ) ,
where r s is the comoving sound horizon,
r s ( z ) = z c s ( z ) H ( z ) d z ,
and c s is the sound speed,
c s ( z ) = 1 3 1 + 3 ω b 4 ω γ 1 1 + z .
The photon energy density ω γ can be determined from the CMB temperature via the relation [100]
3 4 ω γ = 31500 2.7 K T CMB 4 , T CMB = 2.7255 K .
The present-day radiation density is set by,
Ω r , 0 = Ω γ , 0 ( 1 + 0.2271 N eff ) ,
with N eff being the effective number of neutrino species, which we set to N eff = 3.046 [3].
Finally,
ω b = Ω b , 0 h 2 ,
encodes the present-day baryon density.
The latest Planck values for ( R , l A , ω b ) are given in Table 1 and the CMB likelihood is calculated as,
2 ln L CMB = i j Δ i C i j 1 Δ j .
Here, Δ is the difference between the model prediction and the observed values,
Δ T = R model R obs , l A model l A obs , ω b model ω b obs ,
C 1 is the inverse covariance matrix and the covariance matrix C can be read off from the correlation matrix ρ via the relation C i j = σ i σ j ρ i j (no summation implied) with σ i and ρ i j given in Table 1.

3.3. Type Ia Supernovae

Type Ia supernovae are standardizable candles and can thus be used to probe the expansion history of the Universe. Here, we use the Pantheon+ data sample [97], probing the peak apparent magnitude m B of 1701 SNIa light curves in the redshift range 0.001 z 2.26 . To retain the supernovae in the Hubble flow, we use only those with a redshift greater than 0.0235. The model prediction of the peak B-band magnitude is given by,
m B ( z ) = M + 5 log 10 D L ( z ) ,
where we marginalize over the intercept M when calculating the likelihood. For details see, for example, Refs. [61,101]. Further, the dimensionless luminosity distance D L is defined as
D L ( z ) = ( 1 + z ) 0 z d z E ( z )
and E ( z ) is the normalized expansion rate, E ( z ) = H ( z ) / H 0 .

3.4. Baryon Acoustic Oscillations

The sound horizon of the baryon–photon fluid is not only imprinted in the CMB temperature fluctuations but also in the large-scale structure of matter (baryons). These fluctuations in the matter distribution are known as baryon acoustic oscillations and the angular scale θ BAO corresponding to the typical angular (transverse) separation of galaxies in the sky, at some redshift z, is given by,
θ BAO ( z ) = r s ( z d ) / D A ( z ) .
Here, r s ( z d ) is the comoving sound horizon at the baryon drag epoch which occurred when the baryons were released from the Compton drag of the photons. Due to the excess of photons over baryons, this occurred at a slightly later point in time than the photon decoupling. The redshift of the drag epoch z d is calculated using the analytical approximation in Ref. [99] and is z d 1060 .
In the standard 3D BAO data reduction, one infers, for example, D V ( z ) / r s ( z d ) . That is, the ratio of the volume-average distance and the sound horizon at the baryon drag epoch. The volume-average distance is defined as
D V ( z ) = D A 2 ( z ) z H ( z ) 3 .
One can identify the two factors of D A ( z ) as angular distances and z / H ( z ) as a radial distance. To infer D V ( z ) / r s ( z d ) from BAO data, one must calculate the 3D fiducial comoving distances, including the radial distance [16,27]. For the latter, a  cosmological model must be assumed, and the universal assumption in the literature is a Λ CDM model. Due to the assumption of a Λ CDM cosmological model in the BAO data reduction, in recent years it has been questioned whether it is appropriate to use ordinary 3D BAO data when analyzing alternative cosmological models, see for example Refs. [17,18,19,20,21,22,23,24,25,26]. In particular, the  Λ CDM assumption may bias the Hubble constant low when considering alternative cosmological models.
To circumvent this issue, one can use the 2D transversal BAO scale (BAOtr) which can be obtained without assuming any fiducial cosmology. Here, in the BAO data reduction one calculates the 2-point angular correlation function in thin, non-overlapping, redshift shells to infer θ BAO ( z ) at a set of redshifts. The weak model dependence that remains is due to corrections for projection effects, which is, however, minimized by choosing thin redshift bins (see, for example, Ref. [28]). The price to pay for minimizing the model-dependence is that the errors grow by roughly one order of magnitude, from ∼1% to ∼10%.
Here, we use 15 measurements of the angular BAO scale θ BAO in the redshift range 0.11 z 2.225 , obtained from the Sloan Digital Sky Survey (SDSS) data releases DR7, DR10, DR11, DR12, and DR12Q and compiled in Table 2. The likelihood is calculated as,
2 ln L BAOtr = i = 1 15 θ BAO model ( z i ) θ BAO obs ( z i ) σ i 2 .
When using ordinary 3D BAO data to compare with the BAOtr results, we use the data from the SDSS in combination with the Dark Energy Spectroscopic Instrument (DESI) [102].

3.5. Consistency Constraints

There are some regions in the bimetric parameter space ( θ , m FP , Ω Λ , α , β ) that must be avoided [58]. First, to have a continuous, real-valued cosmology devoid of the Higuchi ghost, we must restrict the range of possible values of the physical parameters. Second, observations require GR results to be restored on solar-system scales. Thus, a screening mechanism must exist to hide the extra degrees of freedom on these scales. To ensure the existence of such a mechanism, we must impose additional constraints on the parameter space. Those are presented in Ref. [58] and we refer to these, together with the restrictions imposed by the Higuchi bound, as consistency constraints.
Bimetric submodels are usually defined by setting one or several of the B-parameters (or, equivalently, β -parameters) to zero. We note that the consistency constraints presented here, together, require that B 1 , B 2 , and  B 3 are all non-zero6 [58]. Thus, the minimal submodel consistent with these constraints is the B 1 B 2 B 3 -model which is the reason why we do not consider submodels with fewer parameters. In the MCMC sampling, we set the likelihood to zero at the points where the consistency constraints are violated.

3.6. MCMC Sampling

Markov Chain Monte Carlo (MCMC) methods can be employed in sampling complex probability distributions. Its application is particularly prevalent in Bayesian statistics and computational physics. MCMC operates on the principle of constructing a Markov Chain, where each state in the chain represents a possible configuration of model parameters. The transition from one state to the next is governed by a Markov process, ensuring that the next state depends only on the current state. Over time, the chain converges to a stationary distribution, and samples drawn from this distribution provide an approximation of the posterior distribution. We have incorporated the emcee Python library [103], providing a robust and parallelized implementation of Goodman and Weare’s affine invariant MCMC ensemble sampling algorithm [104].

4. Results

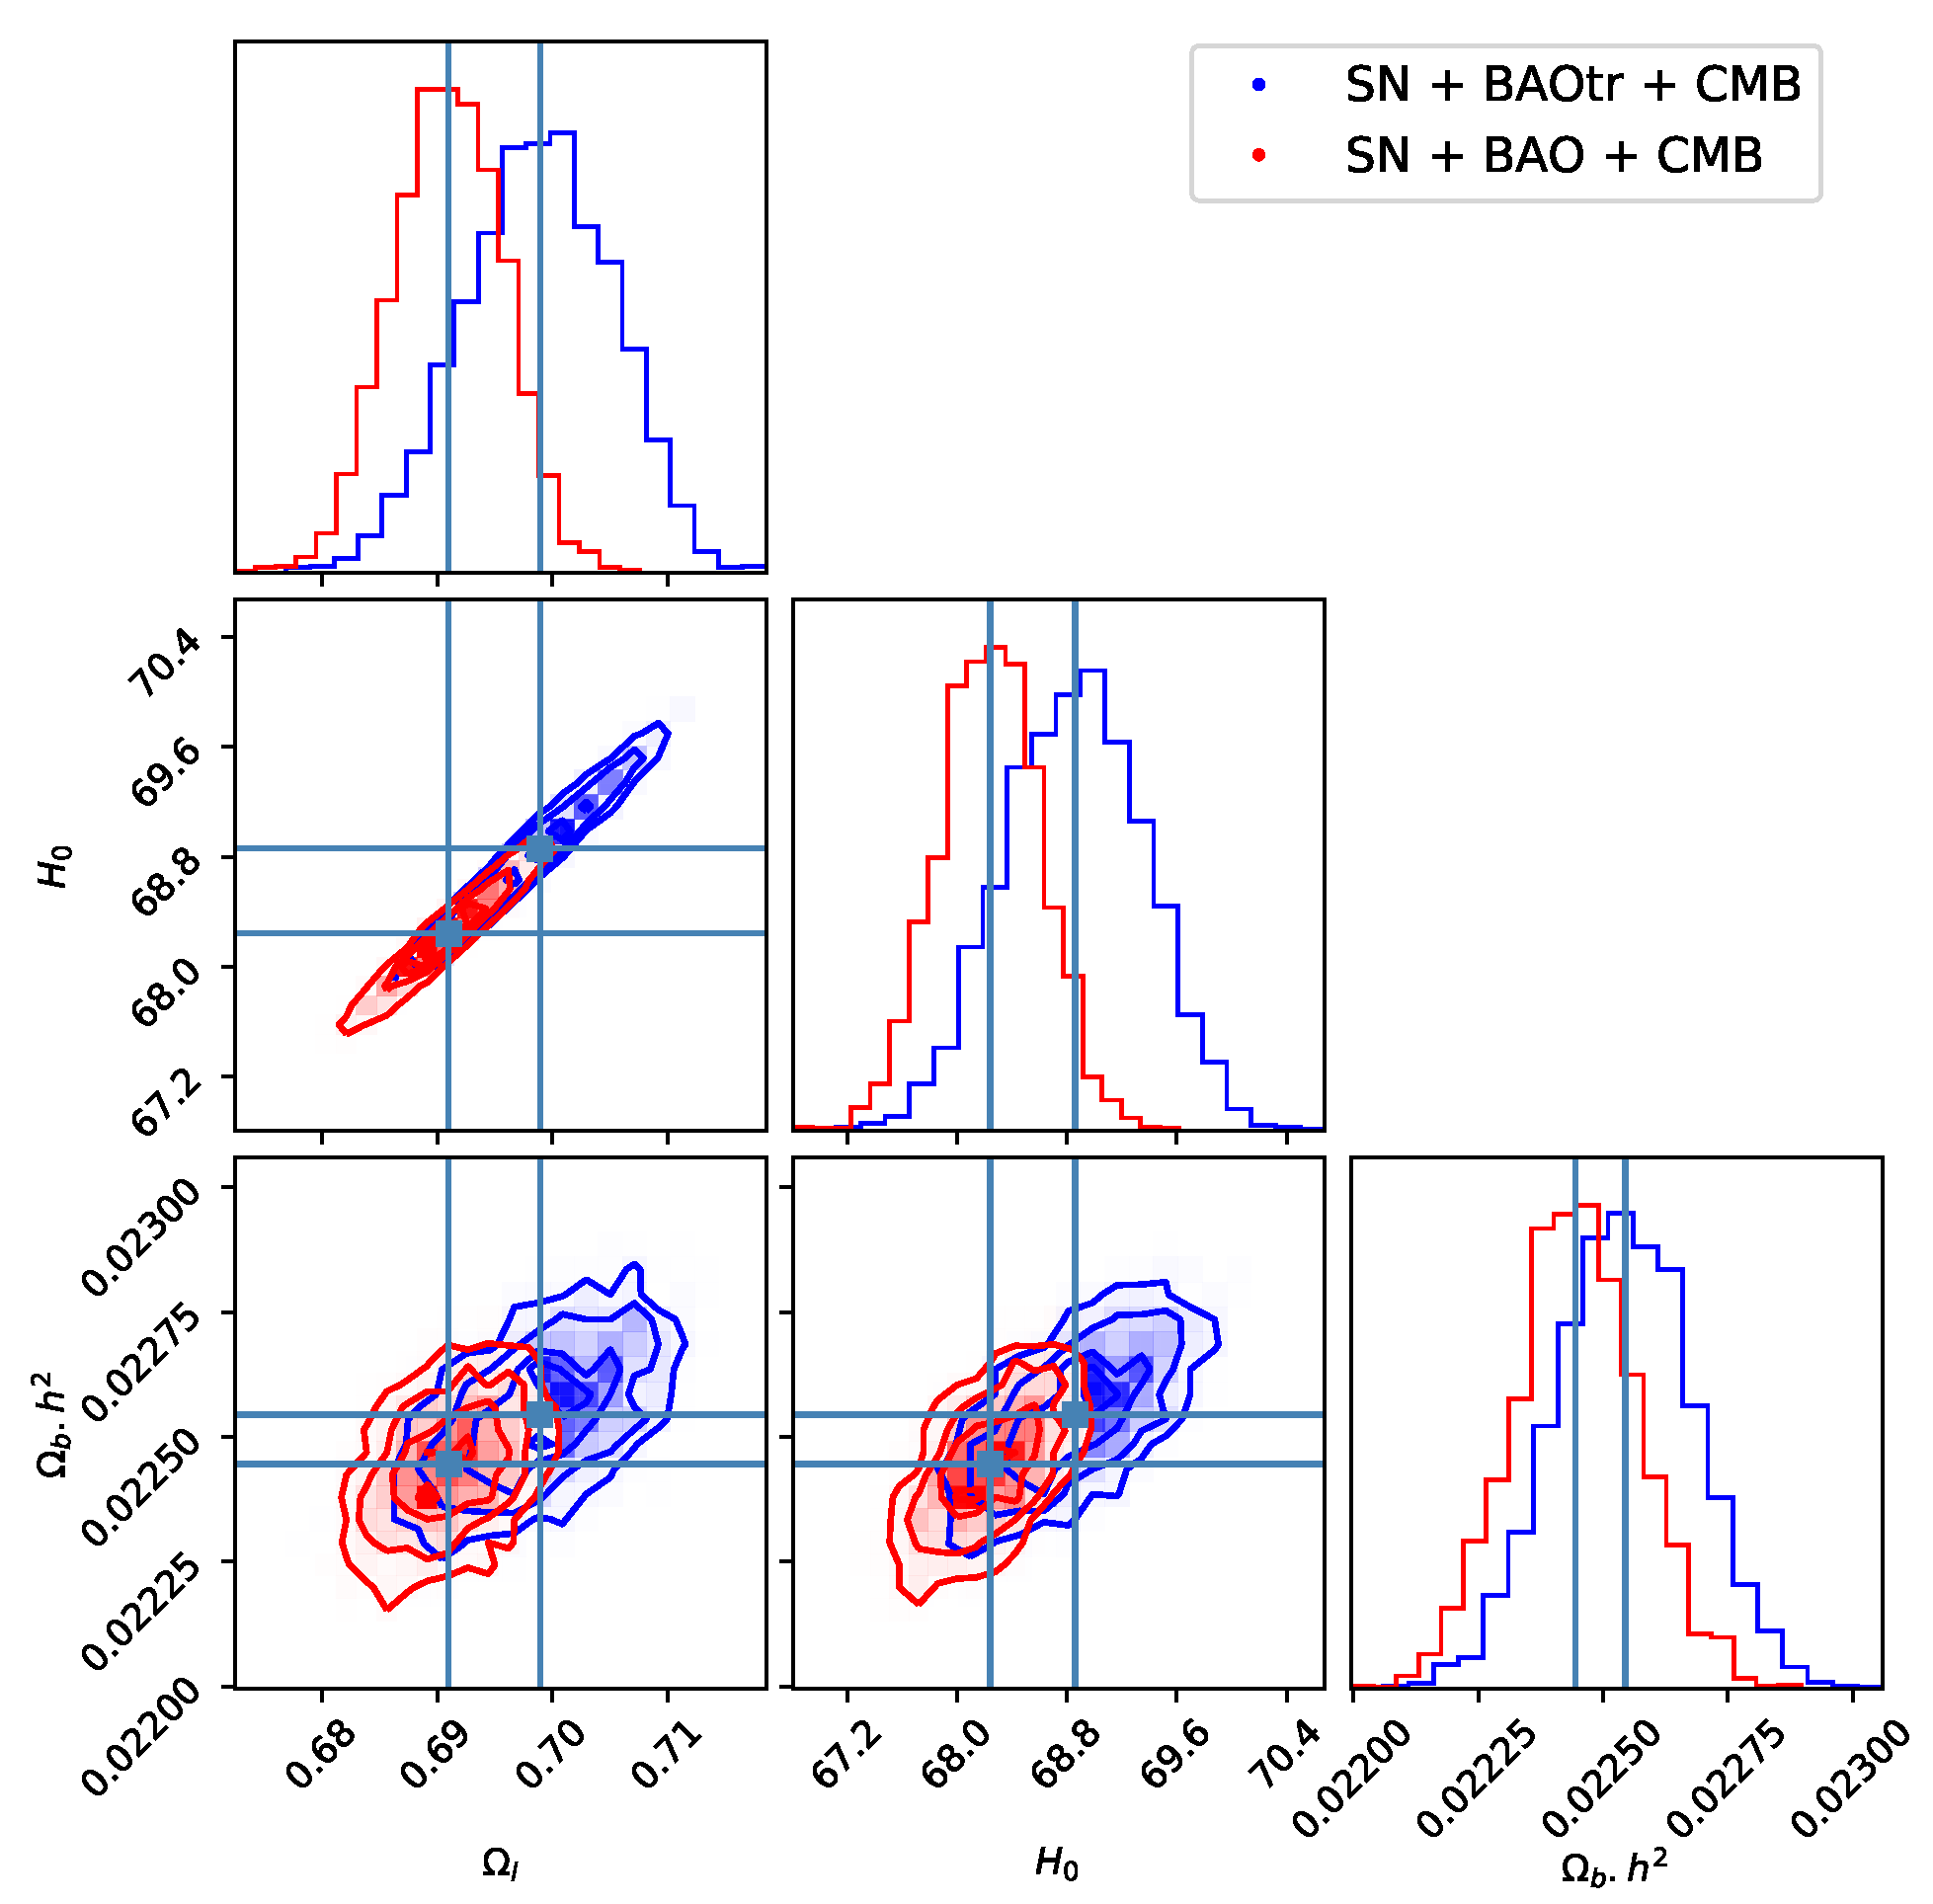
We present the results for the most general bimetric model. The free parameters and their flat prior ranges are presented in Table 3. In Figure 1, we show the 2D marginalized confidence level contours in the ( H 0 , θ ) -plane for different combinations of datasets. The 2D marginalized confidence contours in the full parameter space are displayed in Figure A1. In Appendix B, we also present the results for certain submodels.
In Figure 1, we see that SN + CMB yields a weakly constrained H 0 , allowing both for “high” values compatible with SH0ES and for “low” values compatible with the standard Λ CDM inverse distance ladder estimate. With SN + BAOtr + CMB, the inferred value H 0 = 71.0 ± 0.9 is consistent with SH0ES. This should be compared with H 0 = 68.9 ± 0.5 , which is the value obtained when a Λ CDM model is fitted to the same dataset. In summary, utilizing transverse BAO data, the Hubble tension is alleviated in bimetric cosmology.
On the other hand, imposing ordinary 3D BAO data instead of BAOtr, there is only a slight increase in H 0 compared with Λ CDM, so the tension remains, see Figure 1. More specifically with SN+BAO+CMB, we obtain H 0 = 68.6 ± 0.5 which is in the 4.4 σ tail of the SH0ES team estimate.
We conclude that there is a drastic difference in the inferred value of H 0 depending on whether BAOtr or 3D BAO is used. This indicates that the model dependence on the ordinary 3D BAO data can introduce a significant bias in H 0 .
To understand why the bimetric model alleviates the tension when using BAOtr, we start by analyzing the Λ CDM model. First, SNIa data constrain the shape of the expansion history at redshifts z 2.26 while being agnostic to the absolute scale of the expansion rate ( H 0 ). Since the low-redshift expansion history is set by Ω Λ in a Λ CDM model, SNIa data constrain the value of Ω Λ . Further, the CMB angular scale θ CMB (18) is sensitive to the value of H 0 . The observed value of θ CMB sets H 0 to be relatively low, that is, in tension with SH0ES. In other words, increasing H 0 to values compatible with SH0ES results in an increased angular scale θ CMB , violating its observational constraints.
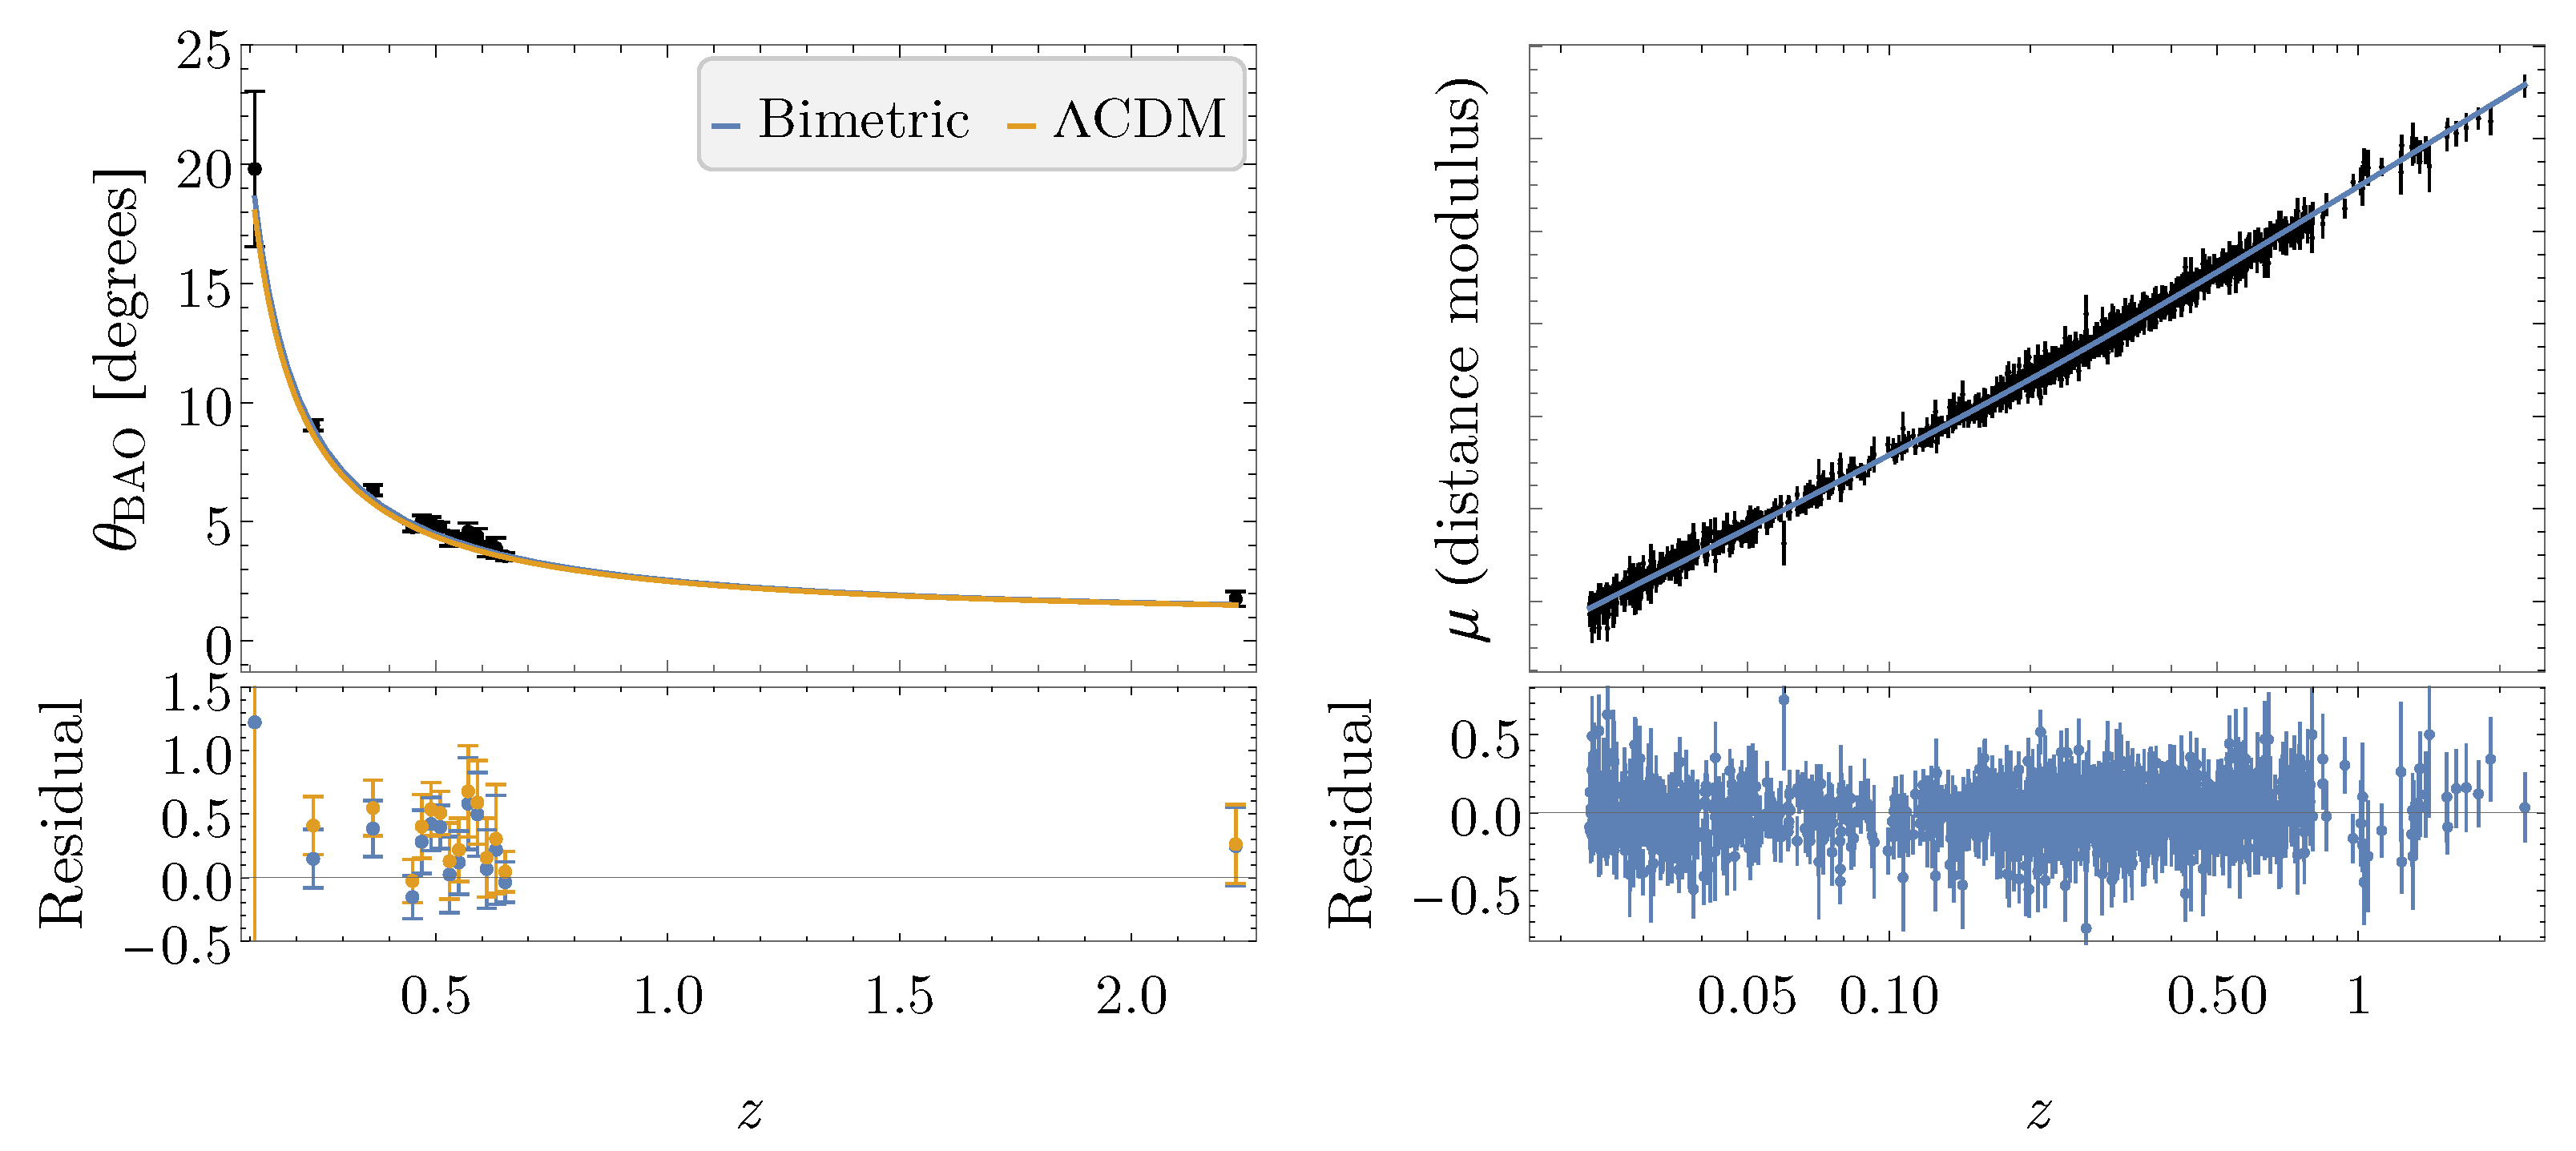
However, this argument does not apply to bimetric cosmology due to its increased flexibility. In this case, while the sound horizon stays the same, the expansion rate can be increased at small redshifts ( z 1 ) while decreased at intermediate redshifts ( 1 z 1000 ), compared with a Λ CDM model. In this way the angular scale θ CMB remains compatible with the observed value. An example is shown in Figure 2 for the best-fit bimetric model. However, it remains to explain why bimetric cosmology, in combination with BAOtr, actually prefers a cosmology with an increased expansion rate in the late universe. To understand this, in Figure 3 we plot the angular BAO scale θ BAO for this model. Upon inspection of the residuals, it is evident that the Λ CDM model prediction lies systematically below the observed values. This can be remedied by increasing the expansion rate at these redshifts. However, in Λ CDM this is not possible due to the tight constraints on H 0 from the CMB. In bimetric cosmology, on the other hand, this is possible, as explained above. In short, BAOtr prefers an increased expansion rate in the late universe which can be accommodated in bimetric cosmology as opposed to Λ CDM. This is possible without spoiling CMB data due to a decrease in the expansion rate at intermediate redshifts.
With 3D BAO data, on the other hand, there is no such offset between the Λ CDM model prediction and data. So, 3D BAO does not prefer an increased expansion rate at low redshifts, explaining the difference in H 0 between BAOtr and 3D BAO. In summary, the choice of the BAO dataset (BAOtr or 3D BAO) effectively splits the SN+CMB confidence contour in Figure 1 into two pieces with the model-independent BAOtr piece being compatible with the SH0ES measurement and the 3D BAO piece assuming “low” H 0 values in tension with SH0ES. The split between the 2D BAO and 3D BAO contours can be explained by the slight tension between these two datasets, which has been discussed and quantified, for example, in Refs. [20,25,26].
Finally, we check that the shape of the SH0ES-compatible bimetric expansion history is compatible with the SNIa data. To demonstrate this, in Figure 3 we plot the distance modulus, defined as the difference between the apparent magnitude and the absolute magnitude, μ = m M . The theory prediction for this quantity is given by
μ ( z ) = 5 log 10 D L ( z ) 5 log 10 H 0 + 25 .
As shown in Figure 3, the bimetric model exhibits an expansion rate that is compatible also with SNIa data.
To quantify the degree of success of the bimetric model compared with Λ CDM, we assess the goodness-of-fit versus the number of model parameters. Two common measures of this are the Akaike information criterion (AIC) and the Bayesian information criterion (BIC) [105,106]. The AIC is defined as
AIC = 2 N param + χ min 2 .
The BIC approximates the Bayesian evidence and is defined as
BIC = N param ln N data + χ min 2 ,
where N param is the number of model parameters and N data is the number of data points. Thus, the AIC and the BIC quantify how well a model is performing by balancing the goodness-of-fit of the model against its complexity, penalizing complex models that exhibit overfitting. In fact, the BIC exhibits a stronger penalty on models with more parameters compared with the AIC.
The degree to which one model is preferred over another is quantified by
Δ AIC = AIC Λ CDM AIC bimetric ,
Δ BIC = BIC Λ CDM BIC bimetric ,
so a positive value of Δ AIC or Δ BIC favors bimetric cosmology over Λ CDM, and vice versa. Following Jeffrey–Raftery’s terminology, Δ BIC in the range 0–2 is referred to as “weak evidence”, 2–6 as “positive evidence”, 6–10 as “strong evidence”, and > 10 as “very strong evidence” [107].
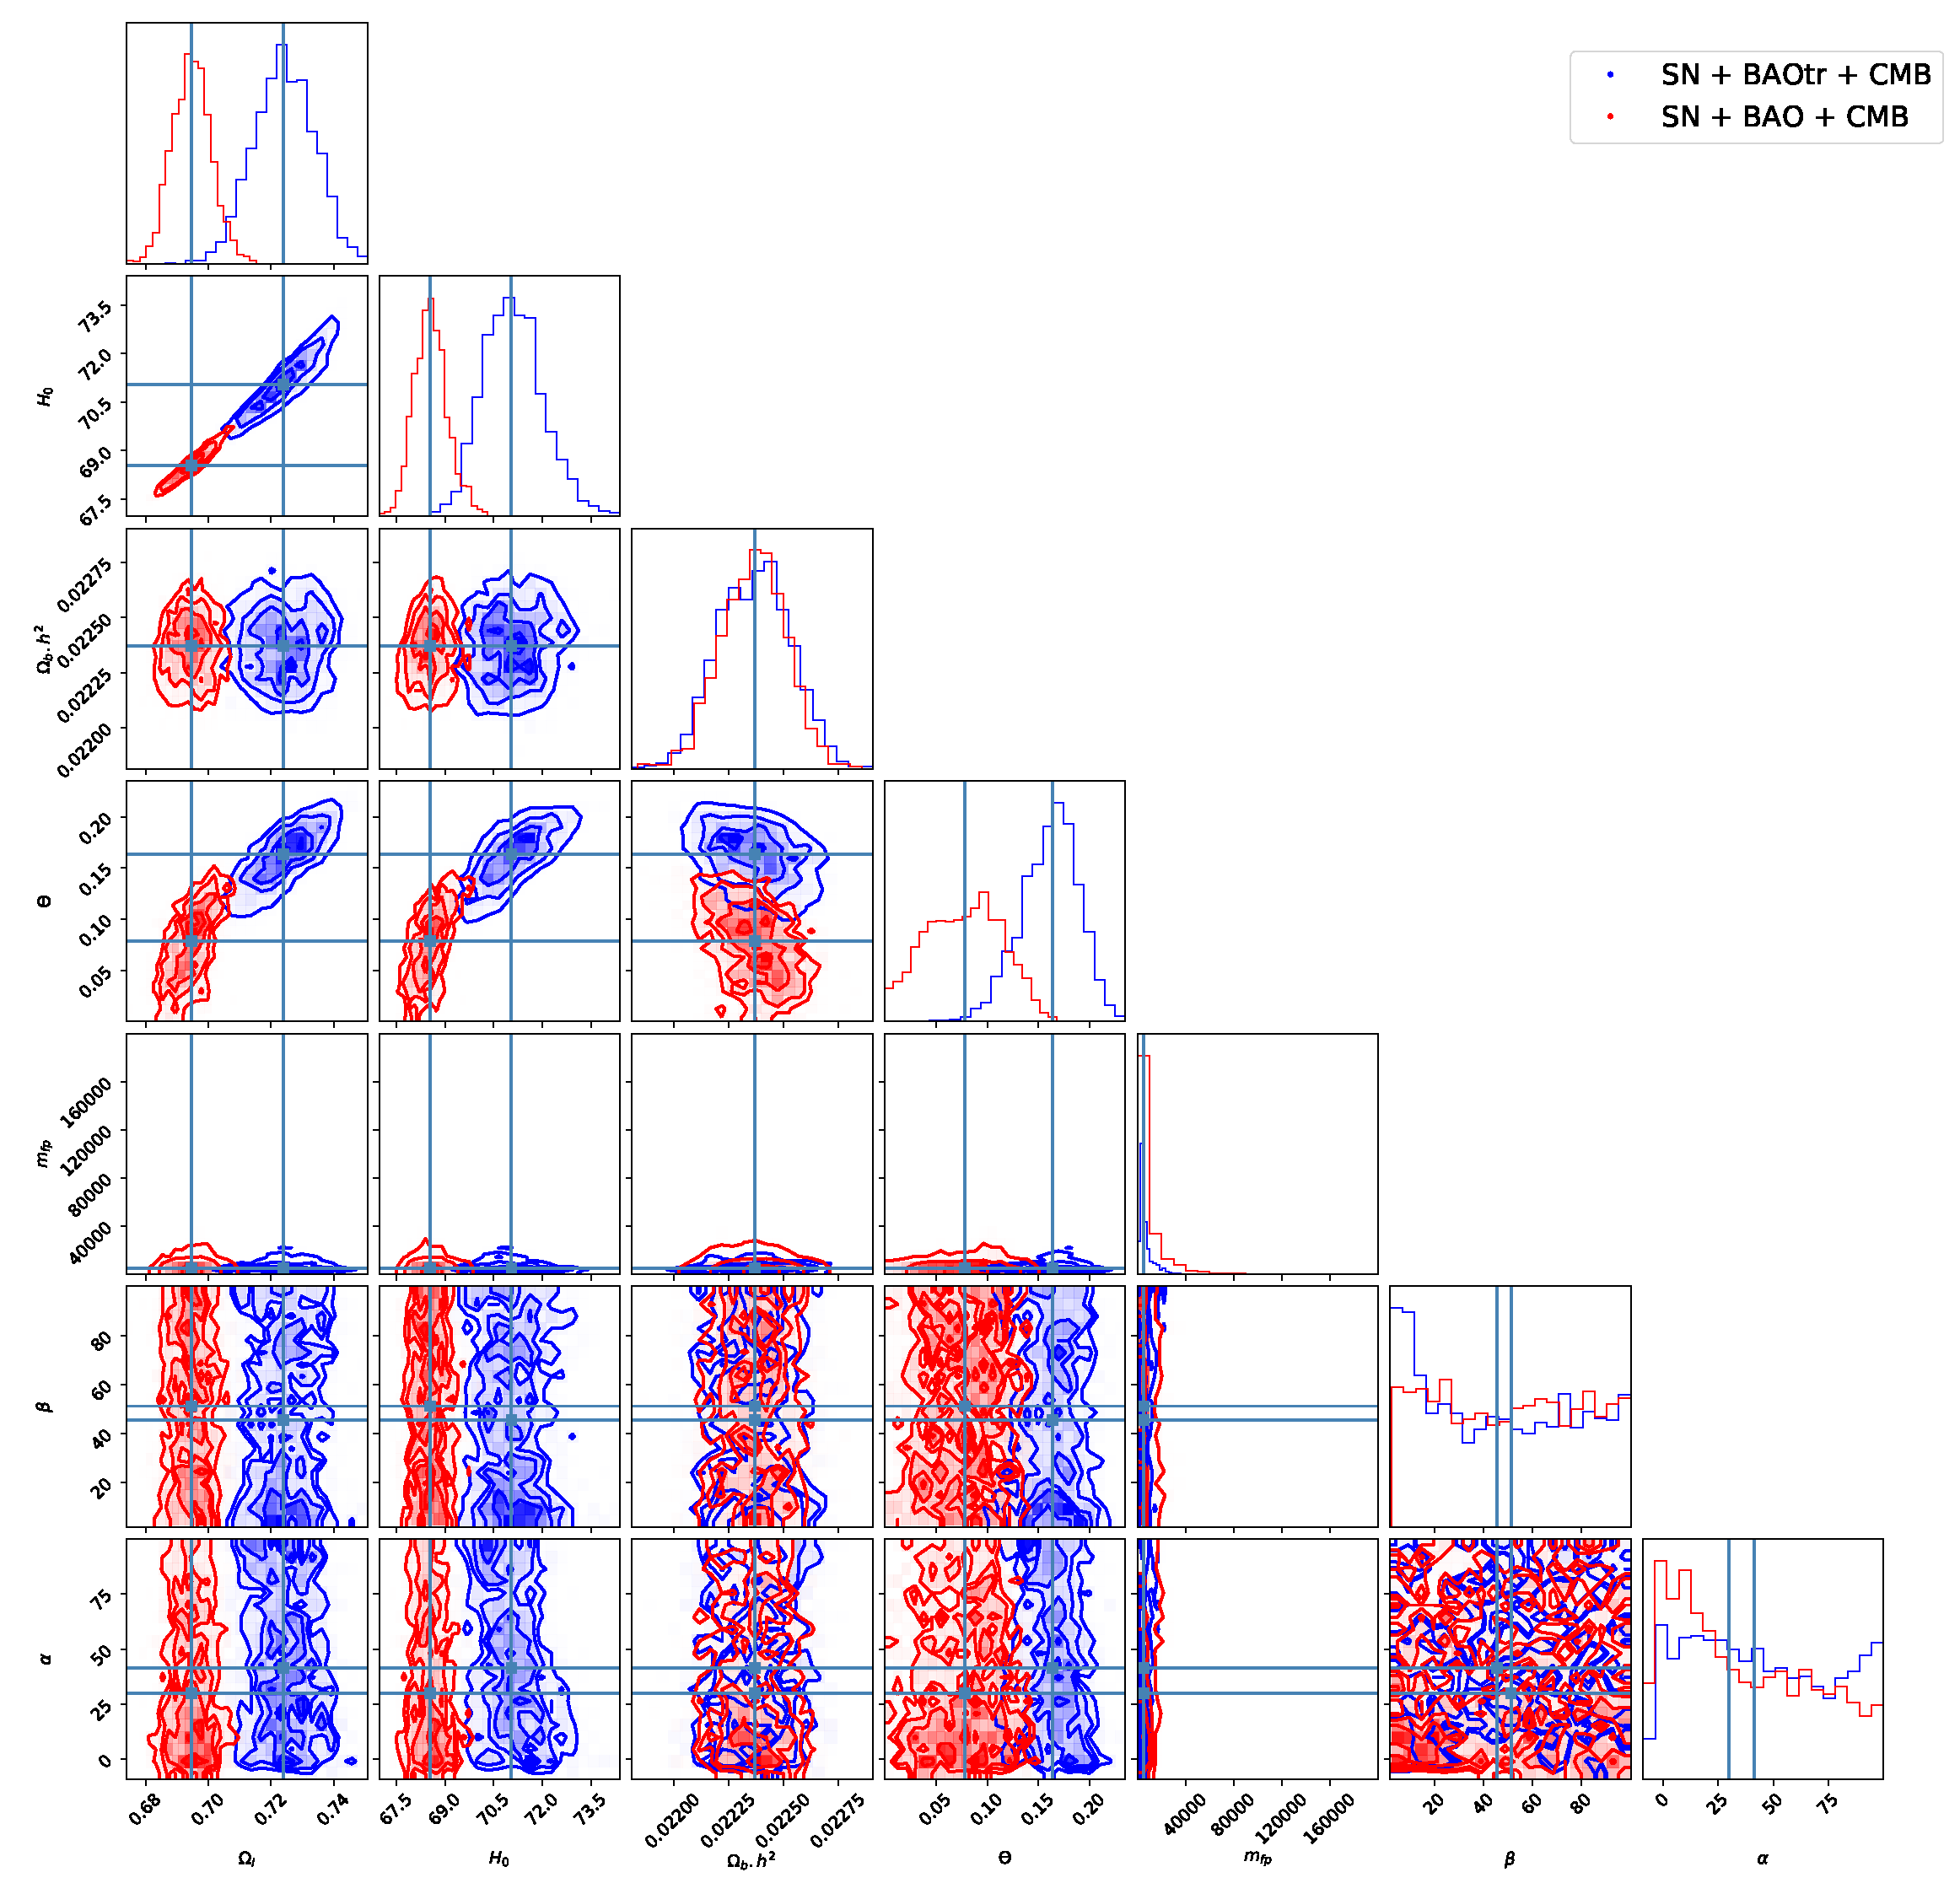
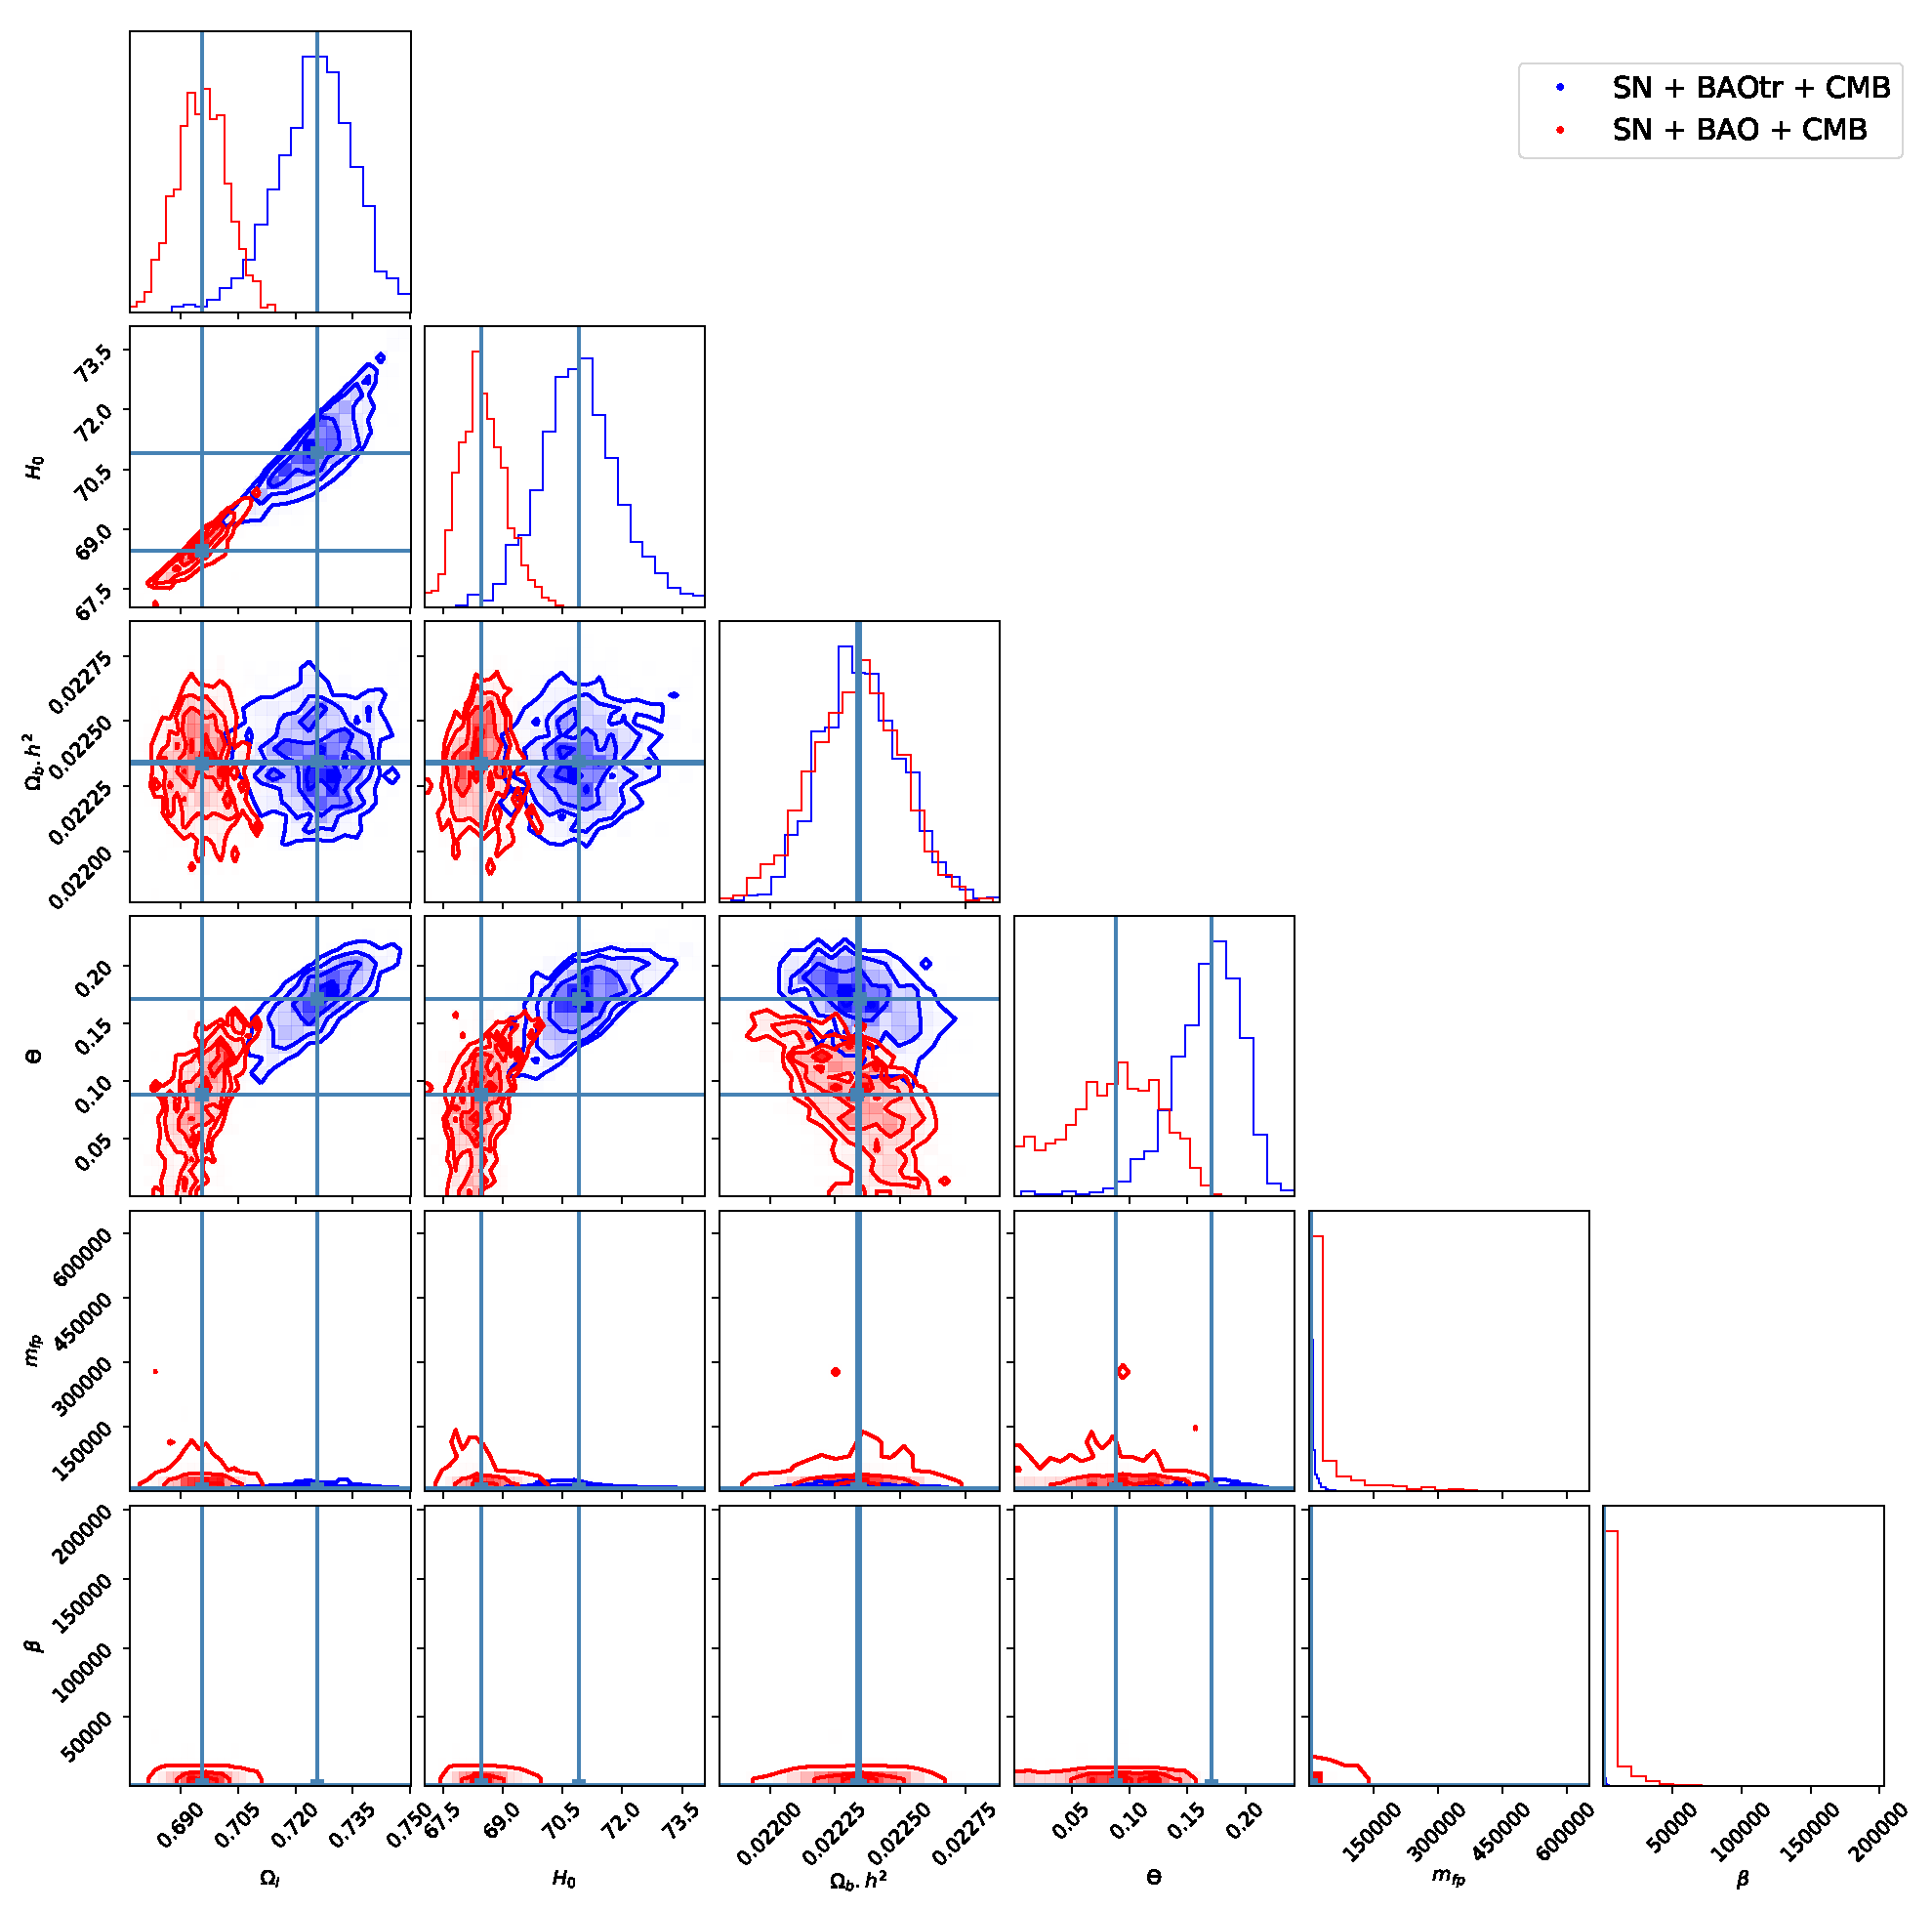
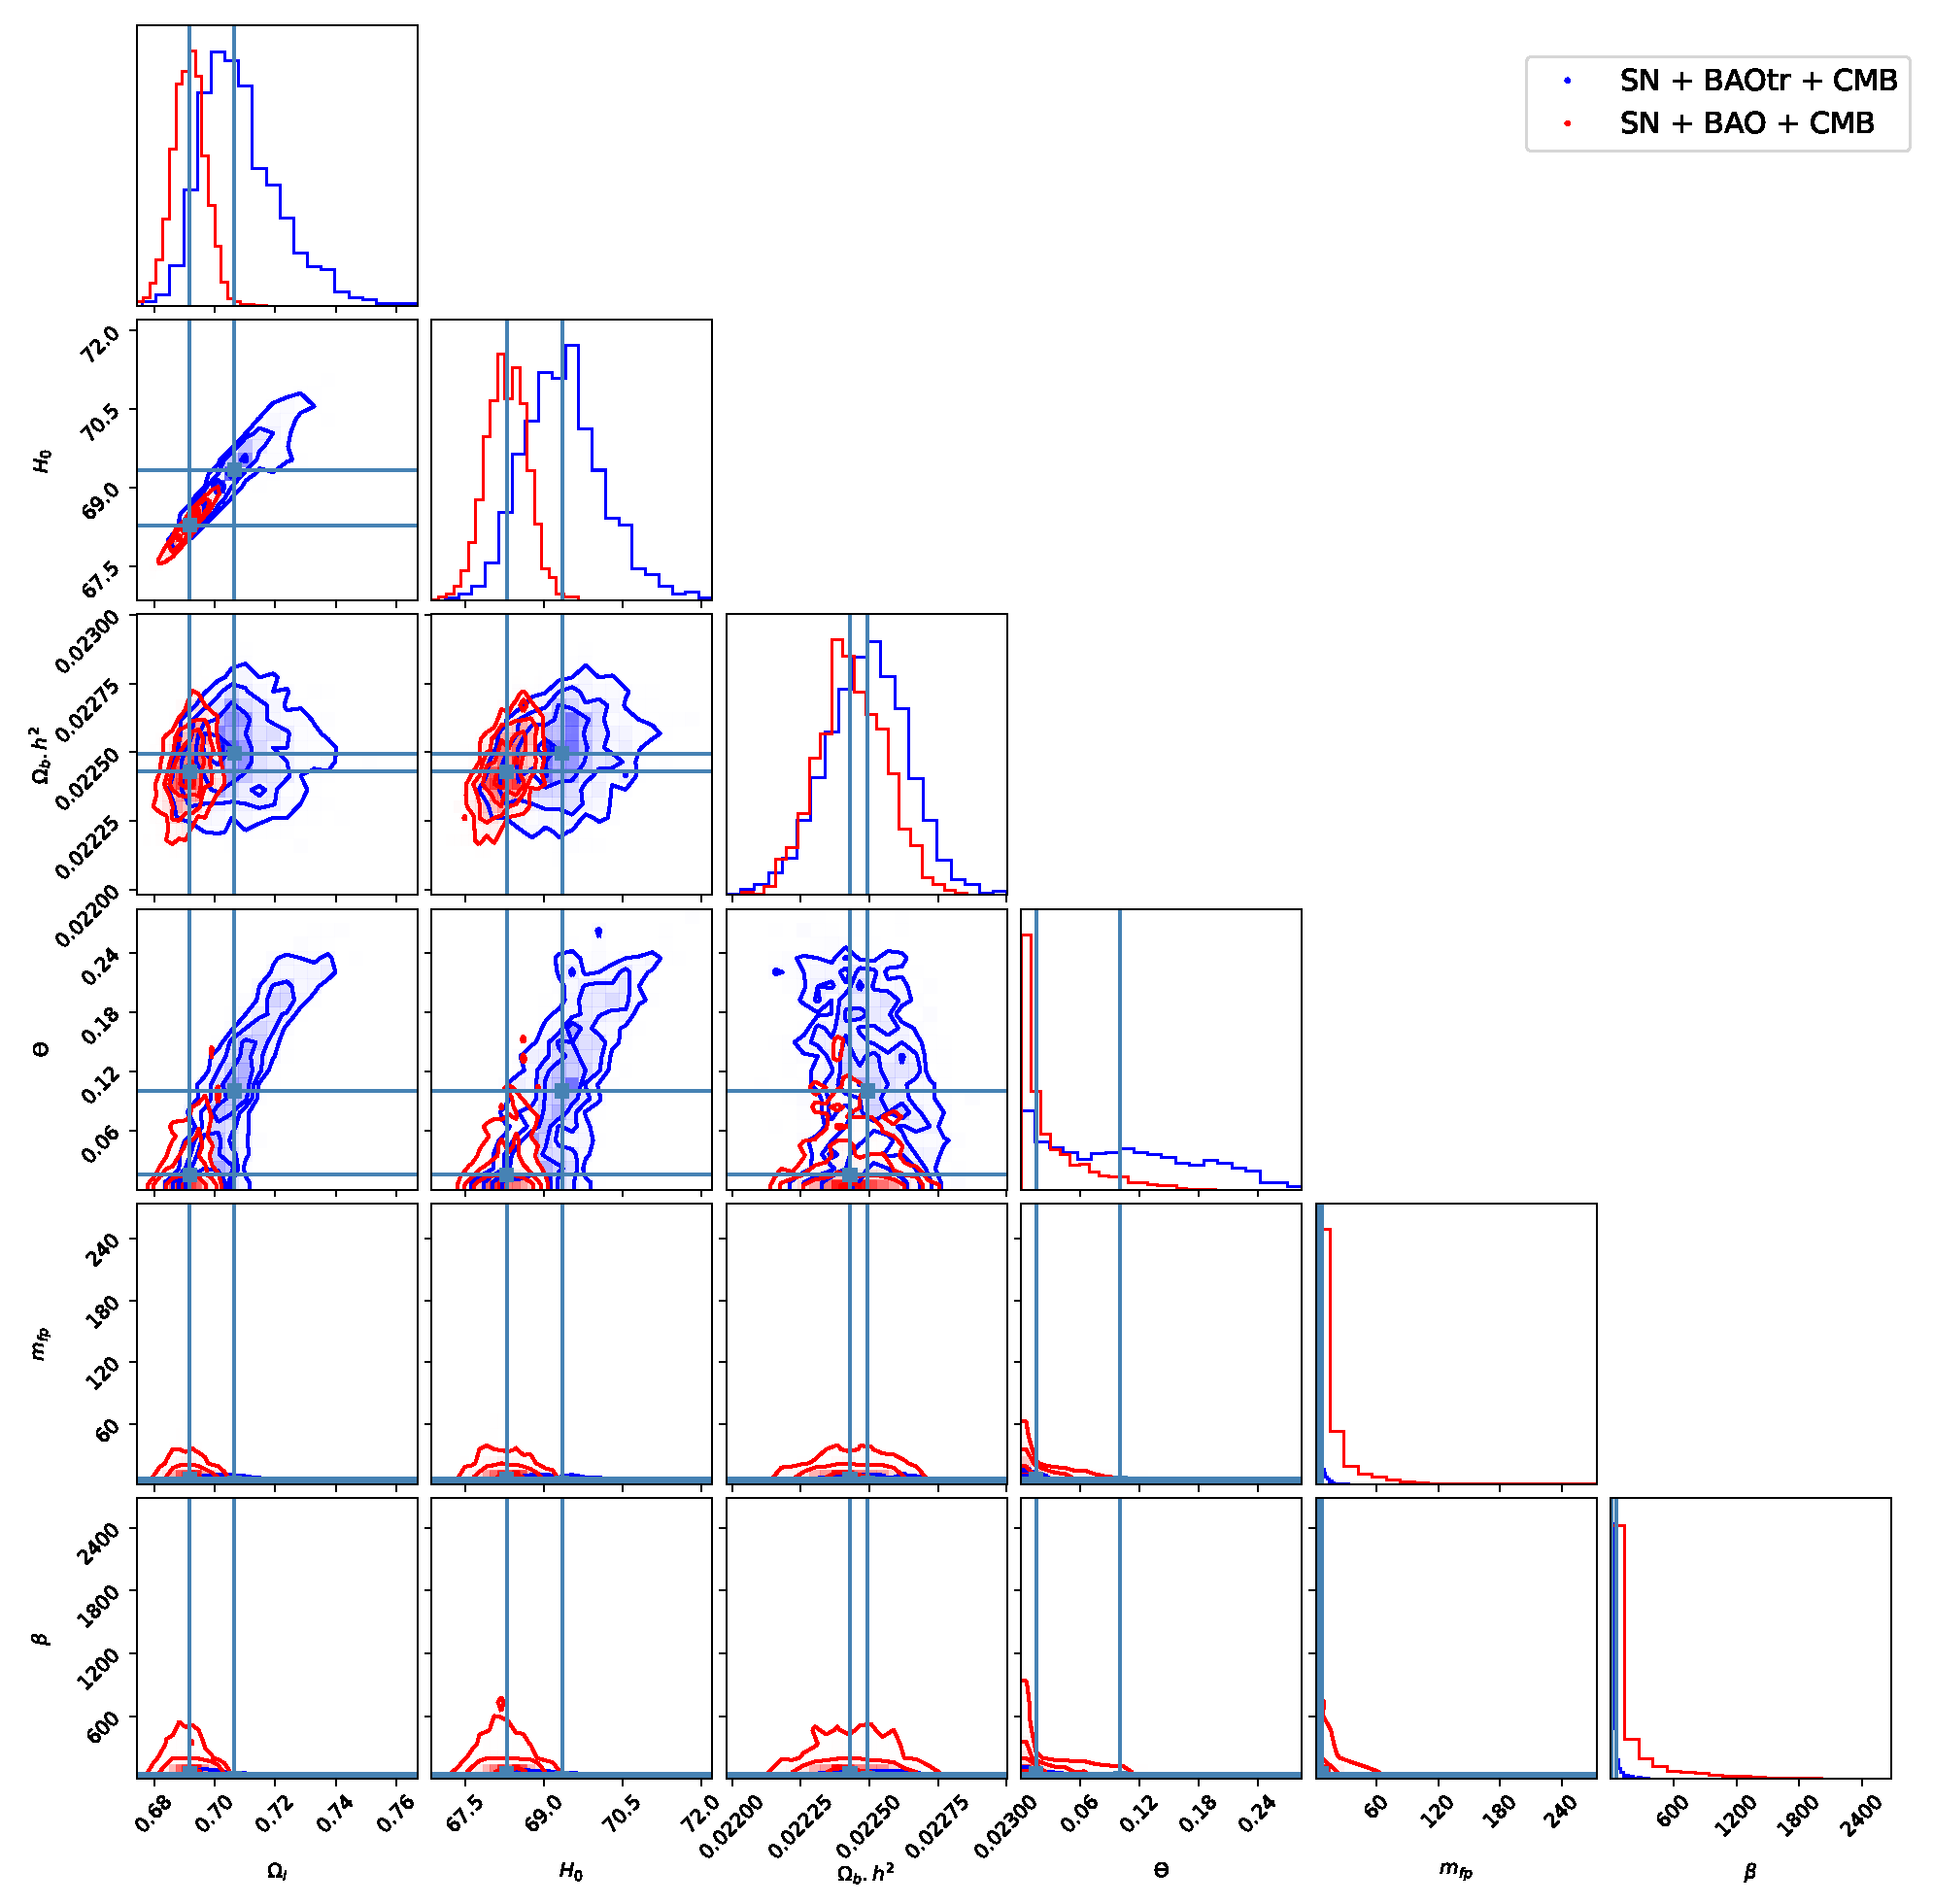
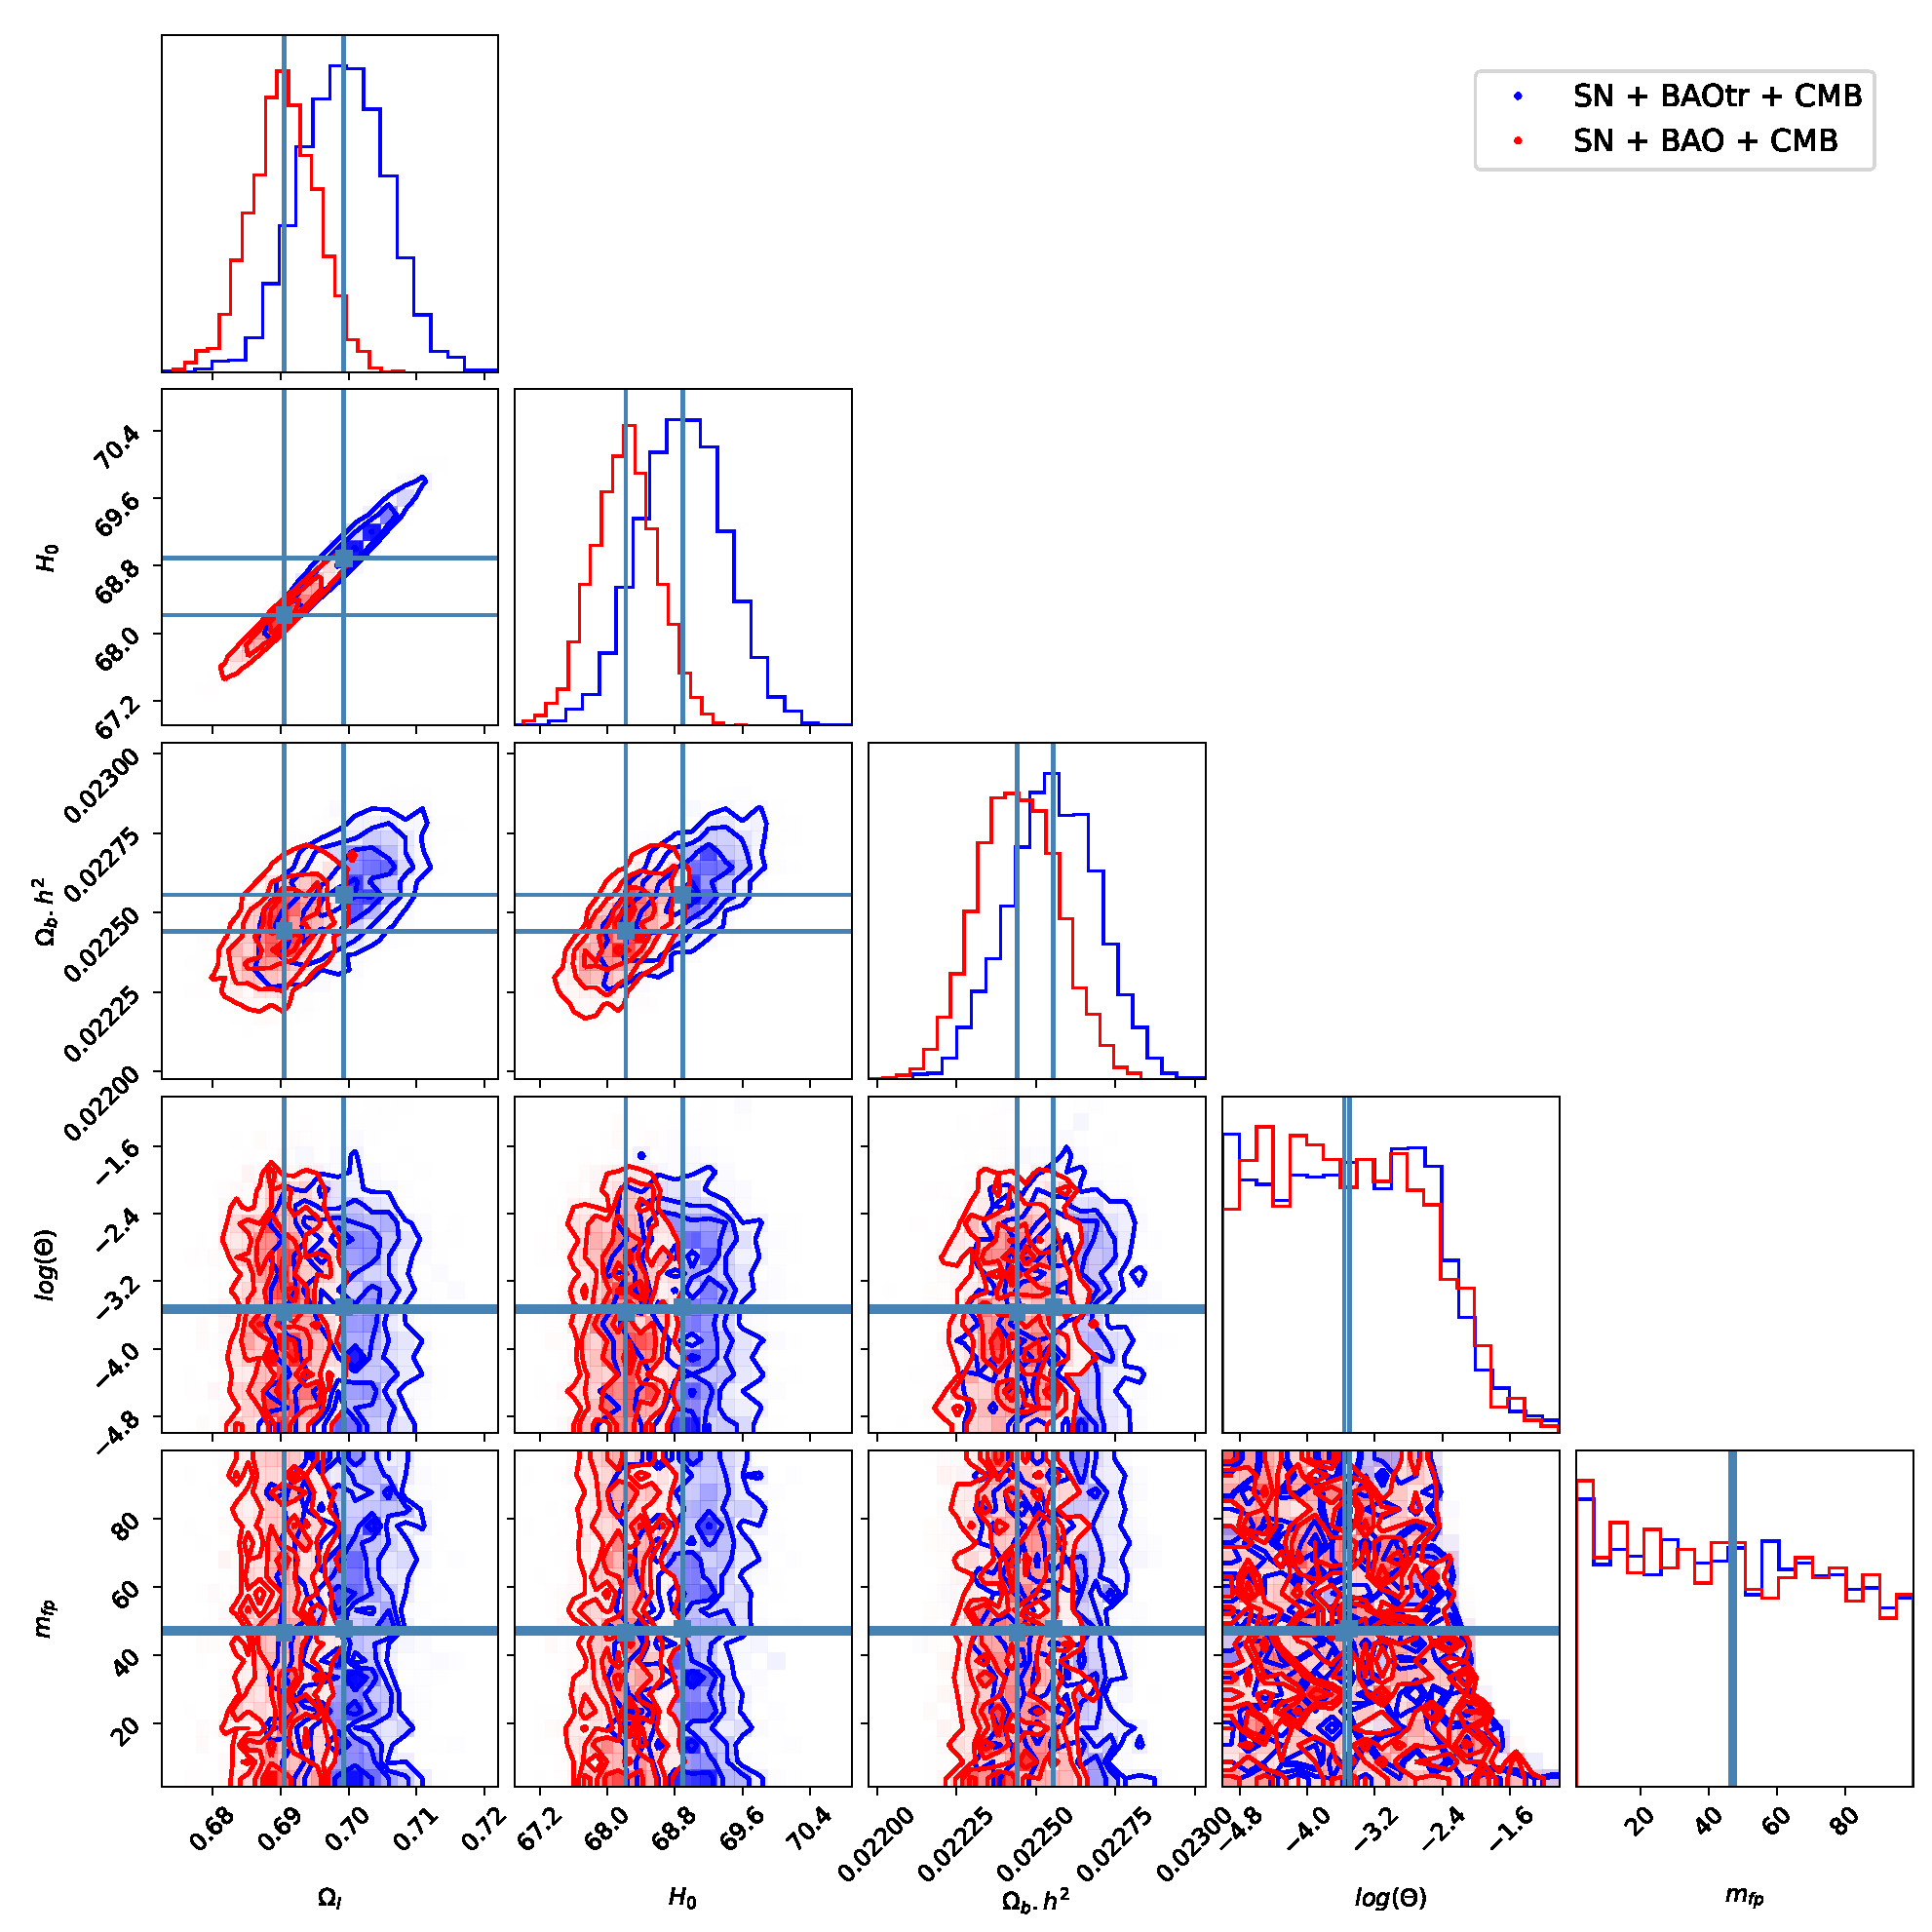
As seen in Table 4, we are facing an ambiguous situation where the bimetric model is preferred by the AIC but the Λ CDM model is preferred by the BIC. If we focus on the inverse distance ladder (CMB + SN + BAOtr, i.e., without the SH0ES prior), there is a slight preference for the bimetric model according to the AIC whereas there is a strong preference for the Λ CDM model according to the BIC. Taken together, the two information criteria are indecisive as to which model exhibits the best performance. In Table A1 and Table A2 in Appendix B, we also present the Deviance Information Criterion (DIC) which utilizes the full Monte Carlo Markov chains. However, caution is advised when interpreting the DIC, as its applicability depends on the posterior distributions being approximately multivariate. This condition is not met, as evidenced by Figure A1, Figure A2, Figure A3 and Figure A4. Nevertheless, we note that the DIC is generally more favorable towards bimetric cosmology compared with the AIC or the BIC.
This demonstrates the limitations of the AIC and BIC in distinguishing between models. However, it should be stressed that the bimetric model has the advantage of the inverse distance ladder predicting a Hubble constant which is consistent with the local distance ladder measurement.
As seen in Figure 2, the bimetric model alleviates the Hubble tension by increasing the expansion rate at low redshifts ( z 1 ), compensating for this by a decreased expansion rate at intermediate redshifts ( 1 z 1000 ) so that the CMB angular scale remains invariant. This expansion history is realized by the bimetric dark energy density Ω DE exhibiting a negative cosmological constant at high redshifts with a transition to a positive cosmological constant at low redshifts. In the example in Figure 2, Ω DE constitutes a few percent of the total energy budget at redshifts z 2 , to then drop below the subpercent level at redshifts z 1500 . At low redshifts ( z 1 ), Ω DE contributes significantly to the expansion history.
As such, with Ω DE increasing with time, it constitutes a phantom dark energy. Since Ω DE mimics a cosmological constant also in the early universe, the bimetric modification to the expansion history can be ignored in the early universe. This can be seen in Figure 2 as the expansion rate differs < 1 % at prerecombination redshifts z > z * . This also means that the sound horizon at recombination and at the baryon drag epoch are the same as in the Λ CDM model7. Accordingly, with θ CMB fixed from observations, the distance to the last scattering surface D A ( z * ) also remains invariant.

5. Discussion

Apparently, the choice between 2D BAO and 3D BAO makes a decisive difference with respect to the inferred value of H 0 with the more conservative option (BAOtr) alleviating the tension. This calls for further analysis of a possible bias in the 3D BAO data. Ideally, the 3D BAO data reduction should be redone assuming a bimetric cosmology. The goal of such an analysis would be to decrease the relatively large ∼ 10 % errors in BAOtr to ∼1% errors as in the ordinary 3D BAO data, to see whether any Hubble tension-solving cosmologies remain viable. In Ref. [14], such a re-analysis was carried out in the case of non-flat cosmology with the result that the 3D BAO data are robust with respect to the choice of spatial curvature. In Ref. [13], the authors analyzed the effects of assuming an inadequate fiducial cosmology for a set of wCDM cosmologies. It was concluded that it has little impact on the BAO shift parameters but leads to a notable misjudgment of the measured errors. With bimetric cosmology providing a solution to the Hubble tension with 2D BAO, we call for such a re-analysis of the 3D BAO data for this set of cosmologies. This will likely be demanding. Nevertheless, it is necessary to fully establish bimetric cosmology as an explanation of the Hubble tension.
With BAOtr, the Hubble constant inferred from the inverse distance ladder is brought into 2 σ agreement with the Cepheid-based local distance ladder estimate from the SH0ES team. The residual 2 σ difference might be explained due to the local effects of bimetric gravity, effectively providing a fifth force that can recalibrate the local distance ladder along the lines of Refs. [5,6]. In other words, bimetric gravity may not only re-calibrate the inverse distance ladder but also the local distance ladder. This should be assessed in a separate work.
The effectiveness of bimetric cosmology in alleviating the Hubble tension should also not be viewed in isolation. To be consistent, the theory parameters singled out by the inverse distance ladder should describe a gravitational phenomenology in accordance with complementary tests of gravity. In Figure 8.1 of Ref. [61], observational constraints from the following sources are compiled: solar-system tests, strong gravitational lensing (SGL) by galaxies, gravitational waves, and the abundance of the light elements (Big Bang nucleosynthesis).
With these additional probes, there remain viable regions in the parameter space in the range8  1 m FP 10 4 . Interestingly, the allowed region overlaps with the region where the Hubble tension is alleviated. The lower limit m FP 1 is due to the Higuchi bound which is a theoretical requirement ensuring the absence of the Higuchi ghost [86]. The upper limit m FP 10 4 is due to SGL. Recall that in the MCMC method, we set the likelihood to zero whenever there is no Vainshtein screening mechanism. In other words, the existence of a Vainshtein screening mechanism is guaranteed, making the region 1 m FP 10 4 observationally viable.
As an example, with m FP 1000 , the Vainshtein radius is r V 10 kpc for a M = 10 12 M galaxy, meaning that the typical lensing radius is of similar magnitude as the Vainshtein screening radius. This implies that m FP 1000 is on the boundary of what is observationally allowed by SGL. For a detailed analysis, see Ref. [108]. With future cosmological surveys such as Euclid, the sample size of strong gravitational lenses will increase by several orders of magnitude. This will probe larger portions of the parameter space (lower values of m FP ) where the Hubble tension-solving models are located.
Another, less significant, tension that has gained interest within the last decade is the tension between the observed distribution of galaxies predicted by CMB observations, assuming a Λ CDM cosmology and, for example, large-scale structure surveys and weak lensing. This is quantified by the parameter S 8 = σ 8 Ω m , 0 / 0.3 where σ 8 is the present-day average amplitude of matter fluctuations at 8 h 1 Mpc . In bimetric cosmology, such as the model ( H 0 , θ , m FP , Ω Λ , α , β ) = ( 71.0 , 9 . 4 , 5030 , 0.724 , 41 , 46 ) studied in Section 4, the present-day matter density Ω m , 0 is greater than in a Λ CDM model. For this model, Ω m , 0 = 0.284 . The decrease in Ω m , 0 is due to the fact that Ω Λ is the effective cosmological constant that Ω DE approaches at future infinity, and thus assumes a greater value than the present-day value Ω DE , 0 . With a decreased present-day matter density, S 8 decreases, also easing the S 8 tension, assuming that σ 8 is constant. However, one should be very careful to draw such a conclusion at this stage since there is currently no framework that allows to predict structure formation in this theory [54,89,109,110,111,112]. So, at present, we cannot justify the assumption of σ 8 being unchanged in this theory.
We have focused on the most general bimetric model. In Table A1 and Table A2 in Appendix B, we present the corresponding results for all viable submodel, that is, B 0 B 1 B 2 B 3 , B 1 B 2 B 3 B 4 , and B 1 B 2 B 3 . The four-parameter model B 0 B 1 B 2 B 3 is performing better than B 1 B 2 B 3 B 4 with respect to the Hubble tension. Due to the decreased number of theory parameters, these models are slightly favored over the general model when assessed by the BIC. The most restricted submodel ( B 1 B 2 B 3 ) on the other hand yields a Hubble constant which is in tension with SH0ES, just as the Λ CDM model.
In the literature, there are alternative cosmological models exhibiting qualitatively similar expansion histories as bimetric cosmology. Accordingly, the conclusions in the current paper apply, with appropriate adaptations, also to these models. Some of them are discussed below.

5.1. Minimal Theories of Bigravity (MTBG)

This set of theories [113] shares the cosmological background solutions with bimetric gravity. Therefore, the results in the current paper apply straightforwardly also to MTBG.

5.2. Λ s CDM

This is a phenomenological model exhibiting a sudden transition between a negative and a positive cosmological constant at some redshift [35,36,37]. Thus, bimetric gravity accommodates this set of models in a theoretically robust framework, only with a smooth transition instead of a discrete one. Similar to the results in the present paper, it was shown that the Λ s CDM model yields a value for H 0 which is compatible with SH0ES when using BAOtr data, thereby alleviating the tension. The main difference between bimetric cosmology and Λ s CDM is that the latter introduces only one additional model parameter compared with the four in bimetric cosmology. This results in an unambiguous preference for Λ s CDM, also by the BIC. A generalized version of the Λ s CDM model, dubbed Λ XCDM, was recently studied in Ref. [38]. The authors show that the Λ XCDM is even outperforming the successful Λ s CDM model, primarily by increasing the quality of fit to SNIa data. We note, however, that bimetric gravity does not accommodate the Λ XCDM model, due to the latter exhibiting a quintessence-like dark energy in the late universe. This is a feature that cannot be achieved within bimetric cosmology alone.

5.3. Quadratic Bimetric Gravity

A ghost-free generalization of bimetric gravity was studied in Refs. [114,115,116]. Here, in addition to the two Einstein–Hilbert terms of each metric, one adds, for each metric, a term which is quadratic in the Ricci scalar, similar to a Starobinsky model [117]. The interaction term remains the same as in the standard Hassan–Rosen bimetric action (1). Accordingly, the set of bimetric cosmologies studied in the current work is a subset of the expansion histories provided by the theory of quadratic bimetric gravity, obtained by setting the coefficients of the quadratic terms to zero. Therefore, the alternative expansion histories featured in the current paper are also found in quadratic bimetric gravity.

5.4. Phenomenological Emergent Dark Energy

Ref. [40] proposed a phenomenological dark energy model where the dark energy vanishes in the early universe. In the late universe, the energy density grows, becoming influential at redshifts z 1 to then approach a cosmological constant equation of state towards future infinity. In Refs. [33,34,39], the influence of this model on the Hubble tension was investigated. Interestingly, this phenomenological model is very similar to the self-accelerating bimetric cosmologies (i.e., B 0 = 0 ), where Ω DE 0 as z but approaching a cosmological constant Ω DE Ω Λ towards future infinity [58,59]. In other words, bimetric gravity accommodates this phenomenological model in a robust theoretical framework.

6. Conclusions

Recent works in the literature indicate that the Hubble tension may be alleviated if standard 3D BAO data are replaced by 2D BAO data [33,34,35,36,37,38,39]. Moreover, 2D BAO has the advantage of being only weakly model-dependent in the data reduction, thus offering a set of data points that can coherently be used to probe expansion histories beyond Λ CDM [16,21,28,29,30,31,32]. The effects of 2D BAO data on the Hubble tension have been studied in the case of phenomenological cosmologies such as the Λ s CDM model [35,36,37] and phenomenological emergent dark energy (PEDE) [40]. Both of these models exhibit an increased expansion rate relative to Λ CDM at redshifts z 1 , thereby easing the Hubble tension.
In the present work, we study bimetric gravity which is a consistent theory of gravity that accommodates the Λ s CDM model as well as PEDE, in addition to a much wider range of expansion histories. We show that, in bimetric cosmology, the inverse distance ladder with SN+2D BAO+CMB yields H 0 = ( 71.0 ± 0.9 ) km / s / Mpc which is compatible with SH0ES H 0 = ( 73.0 ± 1.0 ) km / s / Mpc at the 2 σ border, thus alleviating the Hubble tension. On the other hand, with ordinary 3D BAO data bimetric cosmology eases the tension only very slightly, with a 4.4 σ tension remaining.
Upon evaluating the Akaike Information Criterion (AIC) and the Bayesian Information Criterion (BIC), we encounter an ambiguous result: the AIC favors the bimetric model, while the BIC favors the Λ CDM model. This discrepancy highlights the limitations of both criteria in definitively determining which model performs better. Nonetheless, it is worth emphasizing that the bimetric model offers a key advantage: the inverse distance ladder (with 2D BAO) predicts a Hubble constant consistent with measurements from the local distance ladder.
A scientific advantage of bimetric cosmology, as opposed to the phenomenological models, is that the cosmological analysis can be supplemented with complementary observational tests of gravity to ensure that it offers a coherent picture of gravity at all observable scales. This includes solar-system tests, gravitational waves, strong gravitational lensing by galaxies, and the abundance of light elements (Big Bang nucleosynthesis). We show that a Hubble-tension-solving cosmology can indeed fit coherently within a gravitational theory. Unfortunately, there is currently no framework for calculating the growth of structure in this theory. So, at present the effect of this theory on the S 8 tension is unclear although a very preliminary assessment shows promising results also for this (less major) tension.
We have shown that, in bimetric cosmology, the inverse distance ladder yields significantly different values for the Hubble constant depending on whether 3D BAO data or 2D BAO data are used. This is due to 2D BAO preferring a greater angular BAO scale than 3D BAO. Accordingly, 2D BAO prefers a higher value for H 0 . In bimetric cosmology, this can be achieved by increasing the expansion rate (relative to Λ CDM) at redshifts z 1 , compensating for this by decreasing the expansion rate at redshifts z 1 so as to maintain the well-constrained angular CMB scale (the sound horizon remains unchanged). This expansion history is realized by a smooth transition from a negative cosmological constant at z 1 to a positive one at z 1 .
A possible explanation for the difference in H 0 between 2D BAO and 3D BAO is that the latter might bias H 0 low due to the assumption of Λ CDM cosmology during the 3D BAO data reduction. This is apparently an assumption that is incompatible with the alternative expansion histories studied here. If so, this could explain the Hubble tension. To definitely establish this as an explanation, we call for a reanalysis of the 3D BAO data reduction under less restrictive model assumptions.

Author Contributions

Methodology, M.H.; Software, S.D.; Validation, M.H.; Formal analysis, S.D. and M.H.; Investigation, S.D. and M.H.; Writing—original draft, S.D. and M.H.; Writing—review & editing, M.H.; Supervision, M.H. All authors have read and agreed to the published version of the manuscript.

Funding

This research received no external funding.

Data Availability Statement

The data used in the statistical analyses are provided in the tables or references cited in the manuscript. The resulting posterior distributions of the model parameters are presented in the figures and tables within this article.

Acknowledgments

Thanks to Armando Bernui and Rafael Nunes for valuable discussions on 2D BAO data and the Λ s CDM model. Thanks to two anonymous reviewers for useful comments that have improved the clarity of the manuscript. Special thanks to Edvard Mörtsell for valuable comments on the manuscript and fruitful discussions which led to significant improvements of the analysis.

Conflicts of Interest

The authors declare no conflicts of interest.

Appendix A. Ratio of the Scale Factors: Equation of Motion

The quartic polynomial governing the evolution of y, the ratio of the scale factors, is given by,
1 3 cos 2 θ m FP 2 ( 1 + 2 α + β ) + Ω tot ( z ) + Ω Λ + m FP 2 cos 2 θ ( α + β ) sin 2 θ 1 + α + β 3 y ( z ) + m FP 2 cos 2 θ β + sin 2 θ ( 1 + 2 α + β ) y 2 ( z ) Ω Λ + 1 3 m FP 2 cos 2 θ ( 1 + α β ) + 3 sin 2 θ ( α + β ) y 3 ( z ) + 1 3 sin 2 θ m FP 2 β y 4 ( z ) = 0 ,
where Ω tot ( z ) Ω m ( z ) + Ω r ( z ) . In the data analysis, we solve this equation numerically for each redshift, choosing the finite branch solution. That is, the solution satisfying 0 y 1 .
Evaluating Equations (A1) and (10) at z = 0 (present day), the equations can be combined to yield an equation involving only y 0 and the physical parameters. Here, y 0 is the value of y at z = 0 . The quartic term cancels and the equation reads,
  1 3 cos 2 θ m FP 2 ( 1 + 2 α + β ) 1 + cos 2 θ m FP 2 ( α + β ) y 0 + cos 2 θ m FP 2 β y 0 2 + Ω Λ + 1 3 cos 2 θ m FP 2 ( 1 + α β ) y 0 3 = 0 .

Appendix B. Complementary Results

In Table A1 and Table A2 we display results complementary to Table 4, including the possible bimetric submodels B 0 B 1 B 2 B 3 , B 1 B 2 B 3 B 4 , and B 1 B 2 B 3 .
Table A1. Best-fit values and 68 % confidence errors for H 0 , θ , and Ω Λ due to CMB + SN + BAO(tr) data. The remaining theory parameters, α and β are unconstrained as seen in Figure A1, Figure A2, Figure A3 and Figure A4, thus not tabulated. In the case where θ = 0 is contained within credible interval, m FP is unconstrained.
ModelCMB + SN + H 0 θ (rad) Ω Λ m FP Δ AIC Δ BIC Δ DIC
Λ CDMBAO68.3 ± 0.400.691 ± 0.005000
BAOtr68.9 ± 0.500.700 ± 0.006000
B 0 B 1 B 2 B 3 B 4 BAO68.6 ± 0.50.078 ± 0.0360.695 ± 0.006≤1.9 × 10 4 7.1 28.0 0.6
BAOtr71.0 ± 0.90.163 ± 0.0280.724 ± 0.010≤1.7 × 10 4 1.1 19.9 11.0
B 0 B 1 B 2 B 3 BAO68.5 ± 0.60.088 ± 0.0400.695 ± 0.007≤8.0 × 10 4 3.8 20.6 2.3
BAOtr70.9 ± 1.00.171 ± 0.0590.726 ± 0.015≤1.6 × 10 4 3.0 12.7 19.4
B 1 B 2 B 3 B 4 BAO68.3 ± 0.40.015 ± 0.0350.692 ± 0.005 8.6 21.3 0.1
BAOtr69.3 ± 0.80.1 ± 0.0730.707 ± 0.013 2.6 18.3 0.9
B 1 B 2 B 3 BAO68.2 ± 0.4 < 10 2.6 0.691 ± 0.005 4.0 14.5 0.1
BAOtr68.9 ± 0.5 < 10 2.6 0.699 ± 0.006 2.9 13.4 0.0
Table A2. Best-fit values and 68 % confidence errors for H 0 , θ , and Ω Λ due to CMB + SN + BAO(tr) + SH0ES. That is, including the H 0 prior from SH0ES. The remaining theory parameters, α and β are unconstrained as seen in Figure A1, Figure A2, Figure A3 and Figure A4, thus not tabulated. In the case where θ = 0 is contained within credible interval, m FP is unconstrained.
ModelCMB + SN + H 0 θ (rad) Ω Λ m FP Δ AIC Δ BIC Δ DIC
Λ CDMBAO + SH0ES68.9 ± 0.300.698 ± 0.004000
BAOtr + SH0ES69.7 ± 0.500.709 ± 0.006000
B 0 B 1 B 2 B 3 B 4 BAO + SH0ES69.4 ± 0.50.119 ± 0.0310.704 ± 0.006 9.9 × 10 4 1.8 22.7 2.7
BAOtr + SH0ES71.9 ± 0.70.178 ± 0.0230.732 ± 0.007 8.3 × 10 3 13.2 7.8 18.3
B 0 B 1 B 2 B 3 BAO + SH0ES69.2 ± 0.60.109 ± 0.0380.704 ± 0.006 1.4 × 10 5 0.2 15.5 2.8
BAOtr + SH0ES71.8 ± 0.80.183 ± 0.0220.733 ± 0.008 1.1 × 10 4 15.0 0.7 18.7
B 1 B 2 B 3 B 4 BAO + SH0ES69.0 ± 0.40.048 ± 0.0570.701 ± 0.006 1.5 17.2 2.0
BAOtr + SH0ES70.6 ± 0.70.173 ± 0.0670.723 ± 0.0106.7 9.0 6.8
B 1 B 2 B 3 BAO + SH0ES68.8 ± 0.4 < 10 2.5 0.698 ± 0.005 2.6 13.1 0.1
BAOtr + SH0ES69.7 ± 0.5 < 10 2.5 0.709 ± 0.006 1.0 11.5 0.1
In Figure A1, Figure A2, Figure A3 and Figure A4 we show the full 2D marginalized CL contours for all bimetric submodels, as well as the Λ CDM model in Figure A5. As apparent in Figure A1, the parameters α and β are unconstrained when combining SN+BAO(tr)+CMB. Concerning the B 1 B 2 B 3 -model, displayed in Figure A4, we notice that the best fit reduces to a Λ CDM model, that is, θ 0 . This explains the peak in the likelihood of m FP towards higher values of m FP . The reason is that for a B 1 B 2 B 3 -model, the consistency constraints, discussed in Section 3.5, enforce a small value for θ for large values of m FP . This is discussed in detail in Section 3.2 in Ref. [59]. Moreover, in the θ 0 limit, Λ CDM is retained. So, a peak at large m FP is consistent with θ 0 being the best-fit model. Already at m FP 100 , it is required that θ 0 . 1 for a B 1 B 2 B 3 -model which, for all practical purposes, represents a Λ CDM model. Thus, it is not necessary to increase the parameter range in m FP .
Figure A1. The corner plot shows the 2D marginalized CL contours for the most general bimetric model ( B 0 B 1 B 2 B 3 B 4 ). It is evident that the inclusion of BAOtr instead of ordinary 3D BAO results in a noticeable increment of the estimated value of the Hubble constant H 0 .
Universe 10 00406 g0a1
Figure A2. The B 0 B 1 B 2 B 3 -model. It is apparent that the inclusion of BAOtr instead of ordinary 3D BAO leads to a discernible increase in the estimated value of the Hubble constant H 0 . In this four-parameter submodel, α is not a free parameter but becomes dependent on the remaining physical parameters, which is why it is not shown in the plot.
Universe 10 00406 g0a2
Figure A3. The B 1 B 2 B 3 B 4 -model. Incorporating BAOtr instead of ordinary 3D BAO results in a slight augmentation of the estimated value of the Hubble constant H 0 . In this four-parameter submodel, α is not a free parameter but becomes dependent on the remaining physical parameters, which is why it is not shown in the plot.
Universe 10 00406 g0a3
Figure A4. The B 1 B 2 B 3 -model. The inclusion of BAOtr instead of ordinary 3D BAO leads to a slight increase in the estimated value of the Hubble constant H 0 . In this three-parameter submodel, α and β are not free parameters but become dependent on the remaining physical parameters, which is why they are not shown in the plot.
Universe 10 00406 g0a4
Figure A5. The corner plot shows the distribution of parameter values for a Λ CDM model. It is apparent that including BAOtr instead of ordinary 3D BAO leads to a slight increase in H 0 . However, the increment does not suffice to solve the Hubble tension and, moreover, for Λ CDM, the usage of ordinary 3D BAO is warranted since the assumptions of the 3D BAO data reduction are compatible with such a cosmology.
Universe 10 00406 g0a5

Notes

1
A combination of the two is of course also an option. See, e.g., [4].
2
Note that this equation has no unique solution generically. However, in Ref. [83] it was argued that the principal square root is the appropriate solution as it guarantees a sensible space-time interpretation of the theory.
3
For a more general discussion of a dark energy fluid with such properties, see Ref. [90].
4
In Section 3.2, we show how Ω r , 0 is determined from the CMB temperature.
5
The dataset is available at https://github.com/PantheonPlusSH0ES/DataRelease/tree/main/Pantheon%2B_Data, last checked 2 July 2024.
6
The B-parameters can be expressed in terms of the physical parameters by inverting Equations (5)–(9).
7
For the best-fit bimetric cosmology, shown in Figure 2, the sound horizons are r s ( z * ) = 144.4 Mpc and r s ( z d ) = 147.0 Mpc .
8
There are also windows of viable Fierz–Pauli masses in the ranges 10 6 m FP 10 8 and m FP 10 32 .

References

  1. Will, C.M. The Confrontation between General Relativity and Experiment. Living Rev. Rel. 2014, 17, 4. [Google Scholar] [CrossRef] [PubMed]
  2. Riess, A.G.; Yuan, W.; Macri, L.M.; Scolnic, D.; Brout, D.; Casertano, S.; Jones, D.O.; Murakami, Y.; Anand, G.S.; Breuval, L.; et al. A Comprehensive Measurement of the Local Value of the Hubble Constant with 1 km s−1 Mpc−1 Uncertainty from the Hubble Space Telescope and the SH0ES Team. Astrophys. J. Lett. 2022, 934, L7. [Google Scholar] [CrossRef]
  3. Aghanim, N.; Akrami, Y.; Ashdown, M.; Aumont, J.; Baccigalupi, C.; Ballardini, M.; Banday, A.J.; Barreiro, R.B.; Bartolo, N.; Basak, S.; et al. Planck 2018 results. VI. Cosmological parameters. Astron. Astrophys. 2020, 641, A6, Erratum in Astron. Astrophys. 2021, 652, C4. [Google Scholar] [CrossRef]
  4. Vagnozzi, S. Seven Hints That Early-Time New Physics Alone Is Not Sufficient to Solve the Hubble Tension. Universe 2023, 9, 393. [Google Scholar] [CrossRef]
  5. Desmond, H.; Jain, B.; Sakstein, J. Local resolution of the Hubble tension: The impact of screened fifth forces on the cosmic distance ladder. Phys. Rev. D 2019, 100, 043537, Erratum in Phys. Rev. D 2020, 101, 069904, 129901. [Google Scholar] [CrossRef]
  6. Högås, M.; Mörtsell, E. Hubble tension and fifth forces. Phys. Rev. D 2023, 108, 124050. [Google Scholar] [CrossRef]
  7. Högås, M.; Mörtsell, E. Impact of symmetron screening on the Hubble tension: New constraints using cosmic distance ladder data. Phys. Rev. D 2023, 108, 024007. [Google Scholar] [CrossRef]
  8. Knox, L.; Millea, M. Hubble constant hunter’s guide. Phys. Rev. D 2020, 101, 043533. [Google Scholar] [CrossRef]
  9. Vagnozzi, S. New physics in light of the H0 tension: An alternative view. Phys. Rev. D 2020, 102, 023518. [Google Scholar] [CrossRef]
  10. Di Valentino, E.; Mena, O.; Pan, S.; Visinelli, L.; Yang, W.; Melchiorri, A.; Mota, D.F.; Riess, A.G.; Silk, J. In the realm of the Hubble tension—A review of solutions. Class. Quant. Grav. 2021, 38, 153001. [Google Scholar] [CrossRef]
  11. Schöneberg, N.; Franco Abellán, G.; Pérez Sánchez, A.; Witte, S.J.; Poulin, V.; Lesgourgues, J. The H0 Olympics: A fair ranking of proposed models. Phys. Rept. 2022, 984, 1–55. [Google Scholar] [CrossRef]
  12. Abdalla, E.; Abellán, G.F.; Aboubrahim, A.; Agnello, A.; Akarsu, Ö.; Akrami, Y.; Alestas, G.; Aloni, D.; Amendola, L.; Anchordoqui, L.A.; et al. Cosmology intertwined: A review of the particle physics, astrophysics, and cosmology associated with the cosmological tensions and anomalies. J. High Energy Astrophys. 2022, 34, 49–211. [Google Scholar] [CrossRef]
  13. Carter, P.; Beutler, F.; Percival, W.J.; DeRose, J.; Wechsler, R.H.; Zhao, C. The impact of the fiducial cosmology assumption on BAO distance scale measurements. Mon. Not. Roy. Astron. Soc. 2020, 494, 2076–2089. [Google Scholar] [CrossRef]
  14. Sanz-Wuhl, S.; Gil-Marín, H.; Cuesta, A.J.; Verde, L. BAO cosmology in non-spatially flat background geometry from BOSS+eBOSS and lessons for future surveys. J. Cosmol. Astropart. Phys. 2024, 5, 116. [Google Scholar] [CrossRef]
  15. Pérez-Fernández, A. et al. [DESI Collaboration] Fiducial-Cosmology-dependent systematics for the DESI 2024 BAO Analysis. arXiv 2024, arXiv:2406.06085. [Google Scholar]
  16. Carvalho, G.C.; Bernui, A.; Benetti, M.; Carvalho, J.C.; Alcaniz, J.S. Baryon Acoustic Oscillations from the SDSS DR10 galaxies angular correlation function. Phys. Rev. D 2016, 93, 023530. [Google Scholar] [CrossRef]
  17. Anselmi, S.; Corasaniti, P.S.; Sanchez, A.G.; Starkman, G.D.; Sheth, R.K.; Zehavi, I. Cosmic distance inference from purely geometric BAO methods: Linear Point standard ruler and Correlation Function Model Fitting. Phys. Rev. D 2019, 99, 123515. [Google Scholar] [CrossRef]
  18. O’Dwyer, M.; Anselmi, S.; Starkman, G.D.; Corasaniti, P.S.; Sheth, R.K.; Zehavi, I. Linear Point and Sound Horizon as Purely Geometric standard rulers. Phys. Rev. D 2020, 101, 083517. [Google Scholar] [CrossRef]
  19. Di Valentino, E.; Melchiorri, A.; Mena, O.; Vagnozzi, S. Interacting dark energy in the early 2020s: A promising solution to the H0 and cosmic shear tensions. Phys. Dark Univ. 2020, 30, 100666. [Google Scholar] [CrossRef]
  20. Camarena, D.; Marra, V. A new method to build the (inverse) distance ladder. Mon. Not. Roy. Astron. Soc. 2020, 495, 2630–2644. [Google Scholar] [CrossRef]
  21. Nunes, R.C.; Yadav, S.K.; Jesus, J.F.; Bernui, A. Cosmological parameter analyses using transversal BAO data. Mon. Not. Roy. Astron. Soc. 2020, 497, 2133–2141. [Google Scholar] [CrossRef]
  22. Nunes, R.C.; Bernui, A. BAO signatures in the 2-point angular correlations and the Hubble tension. Eur. Phys. J. C 2020, 80, 1025. [Google Scholar] [CrossRef]
  23. Anselmi, S.; Starkman, G.D.; Renzi, A. Cosmological forecasts for future galaxy surveys with the linear point standard ruler: Toward consistent BAO analyses far from a fiducial cosmology. Phys. Rev. D 2023, 107, 123506. [Google Scholar] [CrossRef]
  24. Bernui, A.; Di Valentino, E.; Giarè, W.; Kumar, S.; Nunes, R.C. Exploring the H0 tension and the evidence for dark sector interactions from 2D BAO measurements. Phys. Rev. D 2023, 107, 103531. [Google Scholar] [CrossRef]
  25. Gómez-Valent, A.; Favale, A.; Migliaccio, M.; Sen, A.A. Late-time phenomenology required to solve the H0 tension in view of the cosmic ladders and the anisotropic and angular BAO datasets. Phys. Rev. D 2024, 109, 023525. [Google Scholar] [CrossRef]
  26. Favale, A.; Gómez-Valent, A.; Migliaccio, M. 2D vs. 3D BAO: Quantification of their tension and test of the Etherington relation. arXiv 2024, arXiv:2405.12142. [Google Scholar]
  27. Ruchika. 2D BAO vs 3D BAO: Hints for new physics? arXiv 2024, arXiv:2406.05453. [Google Scholar]
  28. Sanchez, E.; Carnero, A.; Garcia-Bellido, J.; Gaztanaga, E.; de Simoni, F.; Crocce, M.; Cabre, A.; Fosalba, P.; Alonso, D. Tracing The Sound Horizon Scale With Photometric Redshift Surveys. Mon. Not. Roy. Astron. Soc. 2011, 411, 277–288. [Google Scholar] [CrossRef]
  29. Alcaniz, J.S.; Carvalho, G.C.; Bernui, A.; Carvalho, J.C.; Benetti, M. Measuring baryon acoustic oscillations with angular two-point correlation function. Fundam. Theor. Phys. 2017, 187, 11–19. [Google Scholar] [CrossRef]
  30. de Carvalho, E.; Bernui, A.; Carvalho, G.C.; Novaes, C.P.; Xavier, H.S. Angular Baryon Acoustic Oscillation measure at z = 2.225 from the SDSS quasar survey. J. Cosmol. Astropart. Phys. 2018, 4, 064. [Google Scholar] [CrossRef]
  31. Carvalho, G.C.; Bernui, A.; Benetti, M.; Carvalho, J.C.; de Carvalho, E.; Alcaniz, J.S. The transverse baryonic acoustic scale from the SDSS DR11 galaxies. Astropart. Phys. 2020, 119, 102432. [Google Scholar] [CrossRef]
  32. de Carvalho, E.; Bernui, A.; Avila, F.; Novaes, C.P.; Nogueira-Cavalcante, J.P. BAO angular scale at zeff = 0.11 with the SDSS blue galaxies. Astron. Astrophys. 2021, 649, A20. [Google Scholar] [CrossRef]
  33. Li, X.; Shafieloo, A. Evidence for Emergent Dark Energy. Astrophys. J. 2020, 902, 58. [Google Scholar] [CrossRef]
  34. Yang, W.; Di Valentino, E.; Pan, S.; Shafieloo, A.; Li, X. Generalized emergent dark energy model and the Hubble constant tension. Phys. Rev. D 2021, 104, 063521. [Google Scholar] [CrossRef]
  35. Akarsu, O.; Kumar, S.; Özülker, E.; Vazquez, J.A. Relaxing cosmological tensions with a sign switching cosmological constant. Phys. Rev. D 2021, 104, 123512. [Google Scholar] [CrossRef]
  36. Akarsu, O.; Kumar, S.; Özülker, E.; Vazquez, J.A.; Yadav, A. Relaxing cosmological tensions with a sign switching cosmological constant: Improved results with Planck, BAO, and Pantheon data. Phys. Rev. D 2023, 108, 023513. [Google Scholar] [CrossRef]
  37. Akarsu, O.; Di Valentino, E.; Kumar, S.; Nunes, R.C.; Vazquez, J.A.; Yadav, A. ΛsCDM model: A promising scenario for alleviation of cosmological tensions. arXiv 2023, arXiv:2307.10899. [Google Scholar]
  38. Gomez-Valent, A.; Sola Peracaula, J. Phantom matter: A challenging solution to the cosmological tensions. arXiv 2024, arXiv:2404.18845. [Google Scholar] [CrossRef]
  39. Hernández-Almada, A.; Mendoza-Martínez, M.L.; García-Aspeitia, M.A.; Motta, V. Phenomenological emergent dark energy in the light of DESI Data Release 1. arXiv 2024, arXiv:2407.09430. [Google Scholar] [CrossRef]
  40. Li, X.; Shafieloo, A. A Simple Phenomenological Emergent Dark Energy Model can Resolve the Hubble Tension. Astrophys. J. Lett. 2019, 883, L3. [Google Scholar] [CrossRef]
  41. Hassan, S.F.; Rosen, R.A. Bimetric Gravity from Ghost-free Massive Gravity. J. High Energy Phys. 2012, 2, 126. [Google Scholar] [CrossRef]
  42. Hassan, S.F.; Schmidt-May, A.; von Strauss, M. On Consistent Theories of Massive Spin-2 Fields Coupled to Gravity. J. High Energy Phys. 2013, 5, 086. [Google Scholar] [CrossRef]
  43. von Strauss, M.; Schmidt-May, A.; Enander, J.; Mortsell, E.; Hassan, S.F. Cosmological Solutions in Bimetric Gravity and their Observational Tests. J. Cosmol. Astropart. Phys. 2012, 3, 042. [Google Scholar] [CrossRef]
  44. Sjors, S.; Mortsell, E. Spherically Symmetric Solutions in Massive Gravity and Constraints from Galaxies. J. High Energy Phys. 2013, 2, 080. [Google Scholar] [CrossRef]
  45. Akrami, Y.; Koivisto, T.S.; Sandstad, M. Accelerated expansion from ghost-free bigravity: A statistical analysis with improved generality. J. High Energy Phys. 2013, 3, 099. [Google Scholar] [CrossRef]
  46. Enander, J.; Mörtsell, E. Strong lensing constraints on bimetric massive gravity. J. High Energy Phys. 2013, 10, 031. [Google Scholar] [CrossRef]
  47. Babichev, E.; Crisostomi, M. Restoring general relativity in massive bigravity theory. Phys. Rev. D 2013, 88, 084002. [Google Scholar] [CrossRef]
  48. Koennig, F.; Patil, A.; Amendola, L. Viable cosmological solutions in massive bimetric gravity. J. Cosmol. Astropart. Phys. 2014, 3, 029. [Google Scholar] [CrossRef]
  49. Enander, J.; Mortsell, E. On stars, galaxies and black holes in massive bigravity. J. Cosmol. Astropart. Phys. 2015, 11, 023. [Google Scholar] [CrossRef]
  50. Max, K.; Platscher, M.; Smirnov, J. Gravitational Wave Oscillations in Bigravity. Phys. Rev. Lett. 2017, 119, 111101. [Google Scholar] [CrossRef]
  51. Dhawan, S.; Goobar, A.; Mörtsell, E.; Amanullah, R.; Feindt, U. Narrowing down the possible explanations of cosmic acceleration with geometric probes. J. Cosmol. Astropart. Phys. 2017, 7, 040. [Google Scholar] [CrossRef]
  52. Platscher, M.; Smirnov, J.; Meyer, S.; Bartelmann, M. Long Range Effects in Gravity Theories with Vainshtein Screening. J. Cosmol. Astropart. Phys. 2018, 12, 009. [Google Scholar] [CrossRef]
  53. Lüben, M.; Mörtsell, E.; Schmidt-May, A. Bimetric cosmology is compatible with local tests of gravity. Class. Quant. Grav. 2020, 37, 047001. [Google Scholar] [CrossRef]
  54. Högås, M.; Torsello, F.; Mörtsell, E. On the stability of bimetric structure formation. J. Cosmol. Astropart. Phys. 2020, 4, 046. [Google Scholar] [CrossRef]
  55. Lüben, M.; Schmidt-May, A.; Weller, J. Physical parameter space of bimetric theory and SN1a constraints. J. Cosmol. Astropart. Phys. 2020, 9, 024. [Google Scholar] [CrossRef]
  56. Lindner, M.; Max, K.; Platscher, M.; Rezacek, J. Probing alternative cosmologies through the inverse distance ladder. J. Cosmol. Astropart. Phys. 2020, 10, 040. [Google Scholar] [CrossRef]
  57. Caravano, A.; Lüben, M.; Weller, J. Combining cosmological and local bounds on bimetric theory. J. Cosmol. Astropart. Phys. 2021, 9, 035. [Google Scholar] [CrossRef]
  58. Högås, M.; Mörtsell, E. Constraints on bimetric gravity. Part I. Analytical constraints. J. Cosmol. Astropart. Phys. 2021, 5, 001. [Google Scholar] [CrossRef]
  59. Högås, M.; Mörtsell, E. Constraints on bimetric gravity. Part II. Observational constraints. J. Cosmol. Astropart. Phys. 2021, 5, 002. [Google Scholar] [CrossRef]
  60. Högås, M.; Mörtsell, E. Constraints on bimetric gravity from Big Bang nucleosynthesis. J. Cosmol. Astropart. Phys. 2021, 11, 001. [Google Scholar] [CrossRef]
  61. Högås, M. Was Einstein Wrong?: Theoretical and Observational Constraints on Massive Gravity. Ph.D. Thesis, Department of Physics, Faculty of Science, Stockholm University, Stockholm, Sweden, 2022. [Google Scholar]
  62. Volkov, M.S. Cosmological solutions with massive gravitons in the bigravity theory. J. High Energy Phys. 2012, 1, 035. [Google Scholar] [CrossRef]
  63. Comelli, D.; Crisostomi, M.; Nesti, F.; Pilo, L. FRW Cosmology in Ghost Free Massive Gravity. J. High Energy Phys. 2012, 3, 067, Erratum in J. High Energy Phys. 2012, 6, 020. [Google Scholar] [CrossRef]
  64. Volkov, M.S. Hairy black holes in the ghost-free bigravity theory. Phys. Rev. D 2012, 85, 124043. [Google Scholar] [CrossRef]
  65. Volkov, M.S. Exact self-accelerating cosmologies in the ghost-free massive gravity—The detailed derivation. Phys. Rev. D 2012, 86, 104022. [Google Scholar] [CrossRef]
  66. Volkov, M.S. Self-accelerating cosmologies and hairy black holes in ghost-free bigravity and massive gravity. Class. Quant. Grav. 2013, 30, 184009. [Google Scholar] [CrossRef]
  67. Aoki, K.; Mukohyama, S. Massive gravitons as dark matter and gravitational waves. Phys. Rev. D 2016, 94, 024001. [Google Scholar] [CrossRef]
  68. Babichev, E.; Marzola, L.; Raidal, M.; Schmidt-May, A.; Urban, F.; Veermäe, H.; von Strauss, M. Heavy spin-2 Dark Matter. J. Cosmol. Astropart. Phys. 2016, 9, 016. [Google Scholar] [CrossRef]
  69. Babichev, E.; Marzola, L.; Raidal, M.; Schmidt-May, A.; Urban, F.; Veermäe, H.; von Strauss, M. Bigravitational origin of dark matter. Phys. Rev. D 2016, 94, 084055. [Google Scholar] [CrossRef]
  70. Mörtsell, E.; Dhawan, S. Does the Hubble constant tension call for new physics? J. Cosmol. Astropart. Phys. 2018, 9, 025. [Google Scholar] [CrossRef]
  71. Fierz, M.; Pauli, W. On relativistic wave equations for particles of arbitrary spin in an electromagnetic field. Proc. Roy. Soc. Lond. A 1939, 173, 211–232. [Google Scholar] [CrossRef]
  72. Boulware, D.G.; Deser, S. Can gravitation have a finite range? Phys. Rev. D 1972, 6, 3368–3382. [Google Scholar] [CrossRef]
  73. Gabadadze, G. General Relativity With An Auxiliary Dimension. Phys. Lett. B 2009, 681, 89–95. [Google Scholar] [CrossRef]
  74. de Rham, C. Massive gravity from Dirichlet boundary conditions. Phys. Lett. B 2010, 688, 137–141. [Google Scholar] [CrossRef]
  75. de Rham, C.; Gabadadze, G. Selftuned Massive Spin-2. Phys. Lett. B 2010, 693, 334–338. [Google Scholar] [CrossRef]
  76. de Rham, C.; Gabadadze, G. Generalization of the Fierz-Pauli Action. Phys. Rev. D 2010, 82, 044020. [Google Scholar] [CrossRef]
  77. de Rham, C.; Gabadadze, G.; Tolley, A.J. Resummation of Massive Gravity. Phys. Rev. Lett. 2011, 106, 231101. [Google Scholar] [CrossRef]
  78. Hassan, S.F.; Rosen, R.A. On Non-Linear Actions for Massive Gravity. J. High Energy Phys. 2011, 7, 009. [Google Scholar] [CrossRef]
  79. Hassan, S.F.; Rosen, R.A. Confirmation of the Secondary Constraint and Absence of Ghost in Massive Gravity and Bimetric Gravity. J. High Energy Phys. 2012, 4, 123. [Google Scholar] [CrossRef]
  80. Hassan, S.F.; Lundkvist, A. Analysis of constraints and their algebra in bimetric theory. J. High Energy Phys. 2018, 8, 182. [Google Scholar] [CrossRef]
  81. de Rham, C.; Heisenberg, L.; Ribeiro, R.H. On couplings to matter in massive (bi-)gravity. Class. Quant. Grav. 2015, 32, 035022. [Google Scholar] [CrossRef]
  82. de Rham, C.; Heisenberg, L.; Ribeiro, R.H. Ghosts and matter couplings in massive gravity, bigravity and multigravity. Phys. Rev. D 2014, 90, 124042. [Google Scholar] [CrossRef]
  83. Hassan, S.F.; Kocic, M. On the local structure of spacetime in ghost-free bimetric theory and massive gravity. J. High Energy Phys. 2018, 5, 099. [Google Scholar] [CrossRef]
  84. Higham, N. Functions of Matrices: Theory and Computation; Society for Industrial and Applied Mathematics (SIAM): Philadelphia, PA, USA, 2008. [Google Scholar]
  85. Horndeski, G.W. Second-order scalar-tensor field equations in a four-dimensional space. Int. J. Theor. Phys. 1974, 10, 363–384. [Google Scholar] [CrossRef]
  86. Higuchi, A. Forbidden Mass Range for Spin-2 Field Theory in De Sitter Space-time. Nucl. Phys. B 1987, 282, 397–436. [Google Scholar] [CrossRef]
  87. Fasiello, M.; Tolley, A.J. Cosmological Stability Bound in Massive Gravity and Bigravity. J. Cosmol. Astropart. Phys. 2013, 12, 002. [Google Scholar] [CrossRef]
  88. De Felice, A.; Gümrükçüoğlu, A.E.; Mukohyama, S.; Tanahashi, N.; Tanaka, T. Viable cosmology in bimetric theory. J. Cosmol. Astropart. Phys. 2014, 6, 037. [Google Scholar] [CrossRef]
  89. Könnig, F. Higuchi Ghosts and Gradient Instabilities in Bimetric Gravity. Phys. Rev. D 2015, 91, 104019. [Google Scholar] [CrossRef]
  90. Ozulker, E. Is the dark energy equation of state parameter singular? Phys. Rev. D 2022, 106, 063509. [Google Scholar] [CrossRef]
  91. Mortsell, E. Cosmological histories in bimetric gravity: A graphical approach. J. Cosmol. Astropart. Phys. 2017, 2, 051. [Google Scholar] [CrossRef]
  92. Leavitt, H.S.; Pickering, E.C. Periods of 25 Variable Stars in the Small Magellanic Cloud. Harv. Obs. Circ. 1912, 173, 1–3. [Google Scholar]
  93. Riess, A.G.; Casertano, S.; Yuan, W.; Macri, L.; Bucciarelli, B.; Lattanzi, M.G.; MacKenty, J.W.; Bowers, J.B.; Zheng, W.; Filippenko, A.V.; et al. Milky Way Cepheid Standards for Measuring Cosmic Distances and Application to Gaia DR2: Implications for the Hubble Constant. Astrophys. J. 2018, 861, 126. [Google Scholar] [CrossRef]
  94. Riess, A.G.; Casertano, S.; Yuan, W.; Bowers, J.B.; Macri, L.; Zinn, J.C.; Scolnic, D. Cosmic Distances Calibrated to 1% Precision with Gaia EDR3 Parallaxes and Hubble Space Telescope Photometry of 75 Milky Way Cepheids Confirm Tension with ΛCDM. Astrophys. J. Lett. 2021, 908, L6. [Google Scholar] [CrossRef]
  95. Reid, M.J.; Pesce, D.W.; Riess, A.G. An Improved Distance to NGC 4258 and its Implications for the Hubble Constant. Astrophys. J. Lett. 2019, 886, L27. [Google Scholar] [CrossRef]
  96. Pietrzyński, G.; Graczyk, D.; Gallenne, A.; Gieren, W.; Thompson, I.B.; Pilecki, B.; Karczmarek, P.; Górski, M.; Suchomska, K.; Taormina, M.; et al. A distance to the Large Magellanic Cloud that is precise to one per cent. Nature 2019, 567, 200–203. [Google Scholar] [CrossRef]
  97. Scolnic, D.; Brout, D.; Carr, A.; Riess, A.G.; Davis, T.M.; Dwomoh, A.; Jones, D.O.; Ali, N.; Charvu, P.; Chen, R.; et al. The Pantheon+ Analysis: The Full Data Set and Light-curve Release. Astrophys. J. 2022, 938, 113. [Google Scholar] [CrossRef]
  98. Efstathiou, G.; Bond, J.R. Cosmic confusion: Degeneracies among cosmological parameters derived from measurements of microwave background anisotropies. Mon. Not. Roy. Astron. Soc. 1999, 304, 75–97. [Google Scholar] [CrossRef]
  99. Hu, W.; Sugiyama, N. Small scale cosmological perturbations: An Analytic approach. Astrophys. J. 1996, 471, 542–570. [Google Scholar] [CrossRef]
  100. Chen, L.; Huang, Q.G.; Wang, K. Distance Priors from Planck Final Release. J. Cosmol. Astropart. Phys. 2019, 2, 028. [Google Scholar] [CrossRef]
  101. Goliath, M.; Amanullah, R.; Astier, P.; Goobar, A.; Pain, R. Supernovae and the nature of the dark energy. Astron. Astrophys. 2001, 380, 6–18. [Google Scholar] [CrossRef]
  102. Adame, A.G.; Aguilar, J.; Ahlen, S.; Alam, S.; Alexander, D.M.; Alvarez, M.; Alves, O.; Anand, A.; Andrade, U.; Armengaud, E.; et al. DESI 2024 VI: Cosmological Constraints from the Measurements of Baryon Acoustic Oscillations. arXiv 2024, arXiv:2404.03002. [Google Scholar]
  103. Foreman-Mackey, D.; Hogg, D.W.; Lang, D.; Goodman, J. emcee: The MCMC Hammer. Publ. Astron. Soc. Pac. 2013, 125, 306. [Google Scholar] [CrossRef]
  104. Goodman, J.; Weare, J. Ensemble samplers with affine invariance. Commun. Appl. Math. Comput. Sci. 2010, 5, 65–80. [Google Scholar] [CrossRef]
  105. Akaike, H. A new look at the statistical model identification. IEEE Trans. Autom. Control 1974, 19, 716–723. [Google Scholar] [CrossRef]
  106. Schwarz, G. Estimating the Dimension of a Model. Ann. Statist. 1978, 6, 461–464. [Google Scholar] [CrossRef]
  107. Raftery, A.E. Bayesian Model Selection in Social Research. Sociol. Methodol. 1995, 25, 111–163. [Google Scholar] [CrossRef]
  108. Guerrini, S.; Mörtsell, E. Probing a scale dependent gravitational slip with galaxy strong lensing systems. Phys. Rev. D 2024, 109, 023533. [Google Scholar] [CrossRef]
  109. Aoki, K.; Maeda, K.I.; Namba, R. Stability of the Early Universe in Bigravity Theory. Phys. Rev. D 2015, 92, 044054. [Google Scholar] [CrossRef]
  110. Mortsell, E.; Enander, J. Scalar instabilities in bimetric gravity: The Vainshtein mechanism and structure formation. J. Cosmol. Astropart. Phys. 2015, 10, 044. [Google Scholar] [CrossRef]
  111. Akrami, Y.; Hassan, S.F.; Könnig, F.; Schmidt-May, A.; Solomon, A.R. Bimetric gravity is cosmologically viable. Phys. Lett. B 2015, 748, 37–44. [Google Scholar] [CrossRef]
  112. Lüben, M.; Schmidt-May, A.; Smirnov, J. Vainshtein Screening in Bimetric Cosmology. Phys. Rev. D 2020, 102, 123529. [Google Scholar] [CrossRef]
  113. De Felice, A.; Larrouturou, F.; Mukohyama, S.; Oliosi, M. Minimal Theory of Bigravity: Construction and cosmology. J. Cosmol. Astropart. Phys. 2021, 4, 015. [Google Scholar] [CrossRef]
  114. Gialamas, I.D.; Tamvakis, K. Bimetric-affine quadratic gravity. Phys. Rev. D 2023, 107, 104012. [Google Scholar] [CrossRef]
  115. Gialamas, I.D.; Tamvakis, K. On the absence of ghosts in quadratic bigravity. J. Cosmol. Astropart. Phys. 2024, 3, 016. [Google Scholar] [CrossRef]
  116. Gialamas, I.D.; Tamvakis, K. Bimetric Starobinsky model. Phys. Rev. D 2023, 108, 104023. [Google Scholar] [CrossRef]
  117. Starobinsky, A.A. A New Type of Isotropic Cosmological Models Without Singularity. Phys. Lett. B 1980, 91, 99–102. [Google Scholar] [CrossRef]
Figure 1. The 2D marginalized confidence level contours ( 68 % , 95 % , 99 % ) in the ( H 0 , θ ) -plane for the general bimetric model. Gray: the SH0ES estimate of H 0 . Green: SN + CMB. With these datasets, the bimetric model yields a wide confidence contour, spanning from “low” values of H 0 to “high” values compatible with SH0ES. Blue: adding BAOtr. Notably, in this case, the inferred value of H 0 is consistent with SH0ES. In other words, there is no Hubble tension in bimetric cosmology when BAOtr is used. Red: using ordinary 3D BAO data instead of BAOtr. In this case, H 0 centers around “low” values and a tension in H 0 is manifest.
Universe 10 00406 g001
Figure 2. (Left) Relative difference in the expansion rate H ( z ) , comparing the CMB + SN + BAOtr best-fit bimetric and Λ CDM models. The bimetric model exhibits ( H 0 , θ , m FP , Ω Λ , α , β ) = ( 71.0 , 9 . 4 , 5030 , 0.724 , 41 , 46 ) and the Λ CDM model has ( H 0 , Ω Λ ) = ( 68.9 , 0.699 ) . (Right) The dimensionless dark energy density Ω DE for the same bimetric model, defined as the physical energy density ρ DE measured in units of the present-day critical energy density ρ c = 3 H 0 2 / κ g . As apparent, there is a transition from a negative cosmological constant at high redshifts to a positive cosmological constant at lower redshifts.
Universe 10 00406 g002
Figure 3. (Left) Angular BAO scale for a bimetric model and a Λ CDM model. Data points are black. The bimetric model has the parameters ( H 0 , θ , m FP , Ω Λ , α , β ) = ( 71.0 , 9 . 4 , 5030 , 0.724 , 41 , 46 ) . The Λ CDM model has ( H 0 , Ω Λ ) = ( 68.9 , 0.699 ) . By inspection, it can be seen that the Λ CDM residuals have a systematic offset. This offset is reduced in the bimetric model. (Right) Distance modulus as a function of redshift for the same bimetric model. Since the SNIa data constrain only the shape of the distance modulus μ rather than its intercept on the y-axis, we do not specify the absolute scale of the y-axis.
Universe 10 00406 g003
Table 1. The 68 % CL limits on the CMB compressed likelihood [100]. The last three columns show the correlation matrix ρ i j .
Planck R l A ω b
R 1 . 7493 0.0047 + 0.0046 1.0 0.47 0.66
l A 301 . 462 0.090 + 0.089 0.47 1.0 0.34
ω b 0.02239 ± 0.00015 0.66 0.34 1.0
Table 2. Transversal BAO data (BAOtr). Adopted from Ref. [21], compiling data points from Refs. [16,29,30,31,32].
z0.110.2360.3650.450.470.490.510.53
θ BAO [deg]19.89.066.334.775.024.994.814.29
σ BAO [deg]3.260.230.220.170.250.210.170.30
z0.550.570.590.610.630.652.225 
θ BAO [deg]4.254.594.393.853.903.551.77 
σ BAO [deg]0.250.360.330.310.430.160.31 
Table 3. Priors on the free model parameters for the general bimetric model. All priors are uniform, spanning the range indicated in the table. The upper limits of α and β are set to 100 while their lower limits are effectively set by imposing the consistency constraints, explained in Section 3.5.
Model Parameter: H 0 ω b θ m FP Ω Λ
Prior: U [ 50 , 85 ] U ( 0 , 1 ] U [ 0 , π 2 ] U ( 0 , 10 8 ] U ( 0 , 1 ]
Table 4. Best-fit values and 68 % confidence errors for H 0 , θ , and Ω Λ . Recall that H 0 is given in units of km/s/Mpc. With CMB + SN + BAOtr, the bimetric model exhibits a significant increase in H 0 , thus being consistent with the local distance ladder measurement. Δ BIC is the difference in the Bayesian information criterion between the Λ CDM model and the bimetric model. A positive value of Δ BIC indicates a favored bimetric model. The corresponding applies to Δ AIC.
ModelCMB + SN + H 0 θ (rad) Ω Λ Δ AIC Δ BIC
Λ CDMBAOtr68.9 ± 0.500.700 ± 0.00600
BimetricBAOtr71.0 ± 0.90.16 ± 0.030.724 ± 0.0101.1 19.9
Λ CDMBAOtr + SH0ES69.7 ± 0.500.709 ± 0.00600
BimetricBAOtr + SH0ES71.9 ± 0.70.18 ± 0.020.732 ± 0.00713.2 7.8
Disclaimer/Publisher’s Note: The statements, opinions and data contained in all publications are solely those of the individual author(s) and contributor(s) and not of MDPI and/or the editor(s). MDPI and/or the editor(s) disclaim responsibility for any injury to people or property resulting from any ideas, methods, instructions or products referred to in the content.