Abstract
The present study deals with the investigation of the oscillatory morphology of guided slow body MHD modes in inhomogeneous magnetic waveguides that appear in the solar photospheric plasmas in the forms of pores or sunspots. The eigenvalues and eigenfunctions related to these waves in an isothermal plasma are obtained numerically by solving a Sturm-Liouville problem with Dirichlet boundary conditions set at the boundary of the waveguide. Our results show that the inhomogeneities in density (pressure) and magnetic field have a strong influence on the morphology of waves, and higher-order more are sensitive to the presence of inhomogeneity. Our results suggest that he identification of modes just by a simple visual inspection can lead to a misinterpretation of the nature of modes.
1. Introduction
The investigation of the nature, properties and propagation of magnetohydrodynamic (MHD) waves in solar magnetic structures has received a new impetus thanks to the available high resolution and high cadence observational facilities. Waves generated in the solar photosphere are able to transport mass and momentum into the upper solar atmosphere, contributing to the heating of upper layers. Waves have also been used to infer quantities characterising the state of the plasma and magnetic field that cannot be estimated by the current observational facilities.
Recent observations have revealed the existence of multiple MHD modes in large solar magnetic structures using intensity, line-of-sight (LOS) velocity, and polarisation signals within the magnetic structures such as pores and sunspots [1,2,3,4,5,6,7]. The modification in the perturbed area of magnetic structure has been used to infer the properties of sausage MHD modes [8,9,10,11]. Sausage modes in a flux tube generate periodic changes in the area of the flux tube (contraction and expansion), due to variations in the plasma density and magnetic field within the structure as the wave passes along it. Using empirical decomposition methods on time variations of the size of magnetic pores, ref. [12] found multiple signatures of magnetoacoustic sausage modes with periods in the range of 30–450 s. The study by [13] found upwardly propagating (slow surface) sausage modes in a magnetic pore, with a period range of 181–412 s. Furthermore, ref. [14] identified both surface and body sausage modes in several magnetic photospheric pores, with frequencies in the range 2–12 mHz.
Oscillations that preserve the cross-sectional area of the tube, but imply transversally swinging oscillations of the symmetry axis of the tube are labelled as kink modes [15,16]. These modes are nearly incompressible and, therefore, more difficult to dissipate their energy compared to, for instance, sausage modes. Very often kink modes are generated by lateral buffeting of flux tubes by granular motion. Sausage and kink modes have often been simultaneously detected in a number of the above-mentioned studies proving that these modes coexist in the same magnetic concentration and can interact with each other due to the coupling of their oscillatory motions [2,3,4,5,7].
The magnetic field that permeates the solar atmospheric plasma has a major role in structuring the plasma environment and magnetic structures are currently observed in all regions of the solar atmosphere (e.g., [17]). Plasma and field inhomogeneities can strongly modify the properties of waves, including changes in the waves’ spectral properties, wave amplification, mode conversion, etc. ([3,4,12,18,19,20,21] to name a few). Sunspots, pores, spicules, prominences, or coronal loops are just a few examples of magnetic waveguides that are frequently observed in the solar atmosphere in various wavelengths. A boundary can be found in the magnetic field strength or in intensity data that are somehow connected to a jump in the plasma density. Inhomogeneities in the magnetic field or density pose a serious challenge when describing the properties of waves, because the equations that one has to solve, will have inhomogeneous (i.e., coordinate-dependent) coefficients. On the other hand, traversal inhomogeneities are necessary requirements to describe the plasma heating by waves, i.e., the effectiveness of transferring waves’ kinetic energy into heat requires strong inhomogeneities (see the very large number of studies on phase mixing, resonant absorption or turbulence).
The most simplistic and natural inhomogeneity is the one conferred by the gravitational stratification that, in the case of an isothermal plasma, leads to an Klein-Gordon differential equation for slow MHD waves describing the spatial and temporal variation of physical parameters (see, e.g., [22,23,24,25,26,27,28]). This sort of inhomogeneity is known to modify the properties of waves in many ways, for instance the appearance of cut-off frequencies (the stratified atmosphere plays the role of a low-frequency filter), the increase in the amplitudes of waves due to the decay of density and their evolution into shocks that could heat the non-magnetic atmosphere, etc. When the inhomogeneity is present in the transversal direction (e.g., the radial direction of a flux tube) the nature of waves’ spectrum is modified in the sense that the spectrum of slow and Alfvén waves becomes continuous, while the spectrum of fast waves remains a discrete one. When the frequency of an externally impinging wave matches one of the frequencies in the continuum spectrum, resonant absorption or phase mixing is taking place that are very efficient ways to damp waves’ energy. In this case the governing equations become singular and the values of eigenfunction can be determined by using, e.g., Frobenius series (see, e.g., [29,30,31,32]). More recently resonant absorption was proposed as the mechanism responsible for damping of kink oscillations of coronal loops when the global standing kink waves are resonantly coupled with local Alfvén waves [33,34,35,36,37].
In order to perform a mathematical analysis of wave propagation and solve the governing equation, the inhomogeneous equilibrium has to be rather specific so that the complexity is reduced. One typical example was used earlier by [19], where the authors investigated the physical structure of slow body modes and their propagation (phase) speeds assuming that the plasma- is constant. A similar approach will be applied here, too, where we will assume that the inhomogeneity in all the equilibrium physical quantities (magnetic field, pressure, density) is such that the plasma remains isothermal, i.e., the plasma pressure and density vary following the same dependence on coordinates.
The current analysis and the numerical recipe that is developed and used to solve the governing equation can be viewed as a follow-up attempt in the exploration of waves in realistic solar photospheric waveguides, where equilibrium density profile inhomogeneity generated from observations can be built in the study of the property of slow body MHD waves. The aim of our study is to investigate the modification of the spatial structure of slow MHD waves propagating in a photospheric magnetic flux tubes in the presence of plasma and field inhomogeneity.
The structure of our paper follows: in Section 2 we discuss the properties of the considered equilibrium inhomogeneity in density and pressure, and we derive the form of the equilibrium inhomogeneous magnetic field based on the principle of conservation of the total pressure, i.e., equilibrium of forces. The governing equation for the spatial variation of eigenfunctions is derived in Section 3 and we introduce key assumptions that will be necessary to solve the derived Sturm-Liouville problem. The spatial structure of modes is obtained numerically in Section 4 and these are compared to the results obtained in the case of a homogeneous waveguide. Finally, our results are summarised and research conclusions are drawn in Section 5.
2. Variation of Equilibrium Quantities
Our analysis will focus on the changes in the spatial structure and phase speed of slow body MHD waves in a magnetic flux tube with circular symmetry, when all equilibrium parameters (density, pressure, magnetic field) have radial and azimuthal dependence. One of the key ingredients in our analysis is the result by [38], which showed that in the case slow body modes the total pressure perturbations are negligible at the boundary of the waveguide. In this case the slow body waves under photospheric conditions, the dispersive character of waves and their properties can be confidently described by solving a Helmholtz differential equation upon which we impose Dirichlet boundary condition, i.e., at the boundary of the waveguide the total pressure perturbation becomes zero. For the specific inhomogeneity we consider here the sound speed is going to be a constant quantity, i.e., we are dealing with an isothermal magnetic flux tube.
In our model the inhomogeneous equilibrium plasma density profile is given as a local density enhancement/depression as a function on the radial and azimuthal variables, r and , as [19],
where is the homogeneous density of the annulus surrounding the inhomogeneous density distribution and the dimensionless quantity is is given by
with being the density ratio between the maximum value inside the inhomogeneous density region () and the homogeneous density in the annulus between the density enhancement/depletion and the circular waveguide. The function , that contains all the information regarding the inhomogeneous character of density, is defined as
where and give the center of the density enhancement/depletion’ location, represents the ratio of the radii of the density inhomogeneity and the circular magnetic flux tube, and the parameter denotes the width of the region with the gradual transition of the density. The case corresponds to the concentric case, while for any other pair of values, we are dealing with so-called eccentric cases.
Our working assumption of isothermal plasma implies that the equilibrium plasma pressure has a similar dependence on the coordinates, therefore the equilibrium plasma pressure inhomogeneity will be represented by a localised enhanced or depleted region and it can be written as
where now represent the pressure outside the inhomogeneous region. Thanks to our choices of equilibrium density and pressure, the sound speed will a constant quantity and is defined as .
We consider an equilibrium magnetic field oriented along the z-axis (the longitudinal symmetry axis of the cylindrical waveguide, i.e., , where is an unknown function that can be determined using the radial and azimuthal components of the equilibrium momentum Equation (11). Indeed, taking into account the inhomogeneous nature of the equilibrium pressure and magnetic field, these two equation can be written as
Let us integrate the first equation with respect to the radial coordinate r, that leads to , where is an integration constant that depends on the variable . Combining this relation with the other equilibrium equation in the system (4) leads to , i.e., C is a genuine constant, which we will denote by a. As a result we have
In order to determine the constant quantity a, let us consider the particular case when the inhomogeneity is placed in the center of the waveguide, i.e., we are dealing with a concentric case that corresponds to in Equation (1). The equilibrium pressure at can be written as
Combining this result with Equation (5), the constant quantity a can be expressed as
where . With this, Equation (5) becomes
In what follows we are going to denote the dimensionless quantity , that is defined like a plasma-beta parameter, however this is just apparent, as it involves the ratio of kinetic pressure from the homogeneous annulus () and the value of the magnetic field at the centre (inside the inhomogeneous region). As a result, the equilibrium magnetic field can be written as
The above result can be generalised in a straightforward way for an arbitrary position of the position of the inhomogeneity. Let us consider that in the eccentric case the inhomogeneity is centered in a position where and . In this case the profile of the inhomogeneous equilibrium magnetic field is given as
where
and
Here the quantity is defined as .
3. Governing Equation
The spatial and temporal variation of plasma and field parameters is described by the set of MHD equations that contains highly nonlinear terms and mathematical progress can be achieved in the so-called linear approximation. In this approach each physical quantity is expressed as the sum of the background (equilibrium) value denoted by the index 0, and its perturbation. That is why we write all variables as the sum between their equilibrium value and their perturbation. We assume that the perturbations are just small changes of equilibrium quantities, therefore, every term consisting of the product of two perturbations becomes negligibly small. The equilibrium state will be considered to be static and stationary.
We assume a straight magnetic cylinder (with the usual cylindrical coordinates ) having constant radius, R. The inhomogeneous equilibrium magnetic field aligned with the longitudinal axis of the tube is and is the inhomogeneous equilibrium plasma density. In this case the system of linearised MHD equations becomes
where , , p, , denote the perturbation of velocity, magnetic field, pressure and density, is the square of the constant adiabatic sound speed and is the permeability of free space.
The perturbation of various physical quantities will Fourier-analysed with respect to z and t and we write them proportional to the factor , with k being the wavenumber along the symmetry axis of the cylinder. In this case the linearised and ideal MHD equations transform into
The above equations can be combined into the expression of the total pressure perturbation, is given by
Combining the above relations results in a second-order differential equation for the total pressure of the form
where the magnetoacoustic parameter, is given as [15]
We should mention here that although the form of is identical with its analogue known in a homogeneous plasma, in our case all characteristic speeds depend on the variables r and . Our investigation will limit itself to the wide flux tube limit, i.e., the case when the radius of the tube is much larger than the wavelength of waves (). Our working hypothesis is that in this case the slow body MHD wave behave in a similar fashion as their counterparts in a homogeneous flux tube [15], so their phase speed of waves is given as , where is a small dimensionless quantity and .
We can rewrite the governing equation Equation (23) in a dimensionless form by employing the new variable . In what follows the tilde will be omitted for the sake of simplicity. In this dimensionless form the parameter takes vales between 0 and 1. In addition, the magnetoacoustic parameter becomes
where the quantities and contain the information on the dependence of the equilibrium pressure and magnetic field on the coordinates r and . Furthermore, the coefficient functions of governing equation contain the expression that can be written as
After applying all the above considerations, the governing equation for in dimensionless form can be written as
which constitutes a Sturm-Liouville eigenvalue equation. We will employ numerical methods to determine the eigenvalues and the associated eigenfunctions for given inhomogeneous density distribution considering that the value of when .
4. Slow Body MHD Modes with Inhomogeneous Density and Magnetic Field Distributions
In this section, we will analyze the modification of the spatial structure of the total pressure perturbation corresponding to trapped slow body MHD modes propagating in a cylindrical waveguide in the presence of inhomogeneous equilibrium under photospheric conditions, assuming a short wavelength limit and an isothermal plasma. The particular values of the constants used in our simulations are shown in Table 1.

Table 1.
Values of the physical quantities in numerical modeling. In all our investigations we take and .
Solutions of the governing Equation (27) are obtained numerically using the Galerkin finite element method (FEM) and -factorisation. This method is able to handle our eigenvalue problem in a most efficient way. The built-in MATLAB function ‘’ (based on the factorization) is employed to determine the generalized eigenvalues and eigenvectors of the problem.
As a benchmark for our study that allows us to discern the alterations in wave properties resulting from a non-uniform plasma and field equilibrium, first we show the results we obtain in the case of homogeneous equilibrium, i.e., when the value of the parameter is equal to one. These results cover the earlier findings by [15]. The results presented in our earlier study [19] suggest that the effect of inhomogeneity is more pronounced for higher order modes, therefore, here we consider the results not only for the standard sausage, kink and fluting modes, but also for several higher order modes. Figure 1 displays the dimensionless phase speeds and the spatial structure of slow body modes of various radial and azimuthal order in the case of a homogeneous equilibrium, i.e., when . The equilibrium density and magnetic field distribution are shown in the first two panels of the upper row and they have a constant value, expected from a homogeneous density and magnetic field distribution. The remaining panels stand for the spatial structure of fundamental slow body sausage mode (third panel), the two orthogonally polarised fundamental slow kink modes (last panel of the first row and first panel of the second row), the pair of the fluting mode of order (second and third panels of the second row), slow sausage overtone (fourth panel, second row), the pair of fluting mode of order (first two panels of the third row), the pair of slow body kink overtone (last two panels of the third row), the pair of the slow body fluting mode of order (first two panels of the fourth row), and the pair of the fluting overtone mode of order (last two panels of the fourth row). In addition, we chose to represent the corresponding orthogonal companion of particular waves (kink, fluting). In a homogeneous plasma these modes would appear identical with their counterpart, however shifted by a 90 degree rotation. In an inhomogeneous plasma, the inhomogeneity will influence these modes differently, depending on the direction of their polarisation.
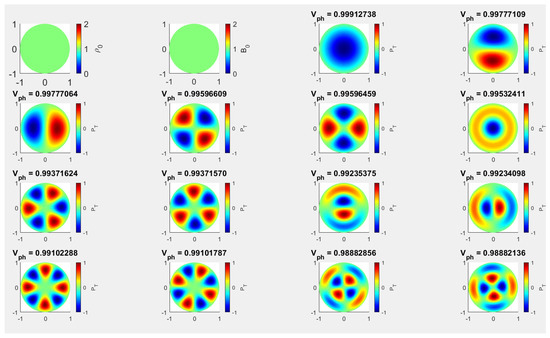
Figure 1.
The spatial structure of slow body waves in the case of a homogeneous () cylindrical waveguide under photospheric conditions together with the density and magnetic field distribution (first two panels in the first row). The remaining panels show the spatial structure of slow body modes sausage (top row, third panel), followed by kink and its corresponding orthogonal mode. The second row contains the two orthogonally polarised fluting mode of order (second and third panel), followed by slow sausage overtone, the fluting modes of order (first two panels in the third row) and the pair of slow body kink overtones, the pair of slow body fluting modes of order (the first two panels of the fourth row, and the pair of fluting overtone of order .
As our problem involves the short wavelength limit, all dimensionless speeds (shown on the top of each panel) are converging to one, i.e., the constant sound speed. The obtained results provide clear evidence that, under the assumption of a homogeneous equilibrium, the eigenmodes exhibit global harmonic oscillations and possess well-known symmetrical characteristics along their respective axes. The colour bars represent the amplitude of the total pressure perturbation normalised by its maximum value for each mode. The red/blue regions denote to the maxima/minima of the total pressure’s amplitude. This result also proves our working assumption, i.e., the vanishing total pressure condition will not modify the meaning of the outcome of the dispersion relation obtained for slow body modes (as suggested by the study [38]). The modes are listed in the descending order of their phase speed in units of the constant sound speed.
The modifications in the morphology of slow body MHD waves and the associated dimensionless phase speed as functions of the parameters of local equilibrium plasma density given by Equation (1) and magnetic field (Equation (8)) will be discussed in the specific situations when the inhomogeneity is given by a enhanced local density () and depleted density (). We should note here that due to the requirement of the conservation of the equilibrium total pressure, an enhancement in density (or pressure) would mean that the magnetic field will be depleted. The changes in the oscillatory patterns of waves are analyzed for three particular locations of the equilibrium inhomogeneity, e.g., concentric (case C2.1), right eccentric (case C2.2), and upper right eccentric (case C2.3). The values of model constants chosen for the specified three cases are given in Table 1.
4.1. The Modifications in the Morphology of Slow Body Modes Induced by Concentric and Eccentric Equilibrium Density (Pressure) Enhancements
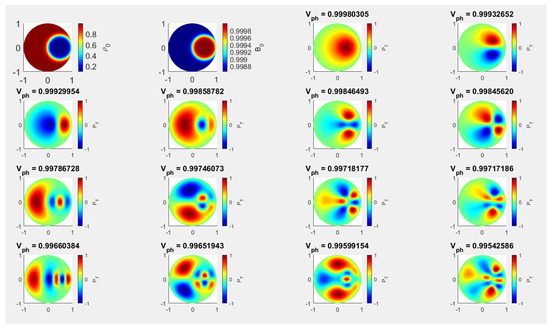
The modification in the values of the radial distribution of equilibrium density, pressure and magnetic field will result in modifications to the dimensionless phase speed and the oscillatory morphology of slow body modes represented by the changes in the total pressure perturbation. Let us first discuss the case of a concentric loading (Figure 2), for which the parameters used in finding numerically solutions to Equation (27) are given by case C2.1 in Table 1. The panels in Figure 2 show the equilibrium density and magnetic field distributions (first two panels in the upper row), the spatial structure of the fundamental slow body sausage mode (third panel) and the two orthogonal fundamental slow body kink modes (last panel of the upper row and first panel of the second row), the two orthogonal fluting mode of order (second and third panel of the second row) the two orthogonal fluting modes of order (last panel of second row and first panel of the third row), the sausage overtone (second panel of the third row), the two orthogonal fluting modes (the last two panels of the third row), the pair of kink overtone (first two panels of the fourth row) and the pair of fluting mode (the last two panels of the fourth row). As before, in all panels the amplitude of the total pressure was normalised by the maximum value of this quantity.
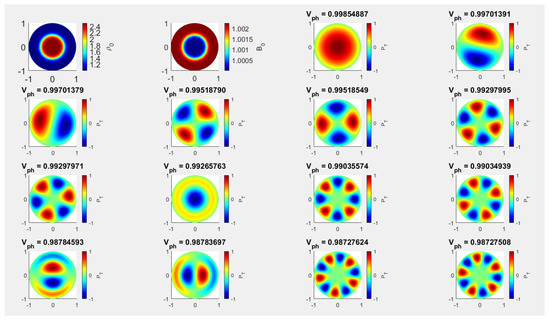
First of all, it is evident that the eigenvalues of the studied waves exhibited a very small decrease in comparison to the uniform case. Comparing Figure 1 and Figure 2, it becomes apparent that the modes exhibit symmetry in relation to the central axis of the circular waveguide. The findings indicate that the presence of a concentric inhomogeneous equilibrium density enhancement leads to an incremental decrease in the eigenvalues of modes, however the oscillating modes have global harmonic oscillations character, as compared to the scenario where the density enhancement is uniform. The most affected modes appear to be the kink overtone and the fluting overtone of order shown in the last row of Figure 2. When comparing the concentric density enhancement case to the uniform case, it is evident that the phase speed of the sausage overtone decreases and becomes less than the phase speed of the fluting mode of order . Furthermore, the kink overtone’s phase speed decreases relative to the order fluting mode’s phase speed. Remarkably, in the first eighteen low order slow body modes, the concentric density enhancement case does not exhibit the sausage overtone of order , and the overtone fluting of order drops below the phase speed of the fluting mode of order .
The enhanced eccentric equilibrium inhomogeneity distribution in density and magnetic field corresponds to an inhomogeneity loading whose position is moved away from the origin and the position of its centre is determined by the values of the parameters, and . As a matter of fact, the position of the localised inhomogeneity can be arbitrary. We define specific directions along which the inhomogeneity will be displaced. First the horizontal direction corresponds to a direction that starts at the origin of the polar coordinate system and points in the horizontal direction (similar to the x-direction in a Cartesian coordinate system), the vertical direction as the direction perpendicular to the horizontal one (corresponding to the y-direction in a Cartesian coordinate system) and the direction along the first bisector, i.e., along the line that starts in the origin and has the property that any point along this line is at equal distance from the horizontal and vertical axes. In the present investigation we analyse only cases that correspond to the inhomogeneous density shifted along the horizontal axis (see Figure 3), with model constants given by case C2.2), and a position where both quantities describing the location of the density load are different from zero (Figure 4, with parameters given by case C2.3 in Table 1). All the figures we are going to present display the morphology of the normalised total pressure of the same slow body modes as before.
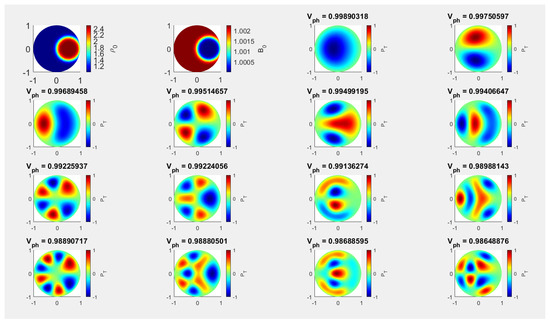
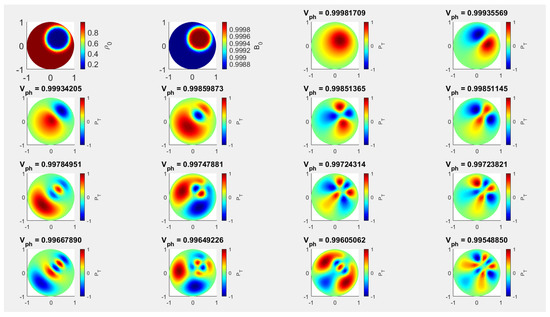
Figure 3.
Here we display the oscillatory morphology of the same MHD modes as in Figure 1, however here we show the results obtained considering an eccentric density (and magnetic field) inhomogeneity, displaced along the horizontal direction. The model constants employed for these results are shown by Case C2.2 in Table 1.
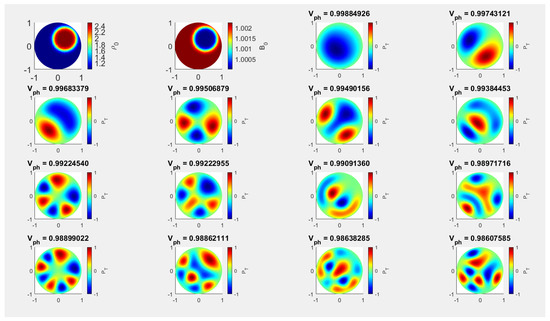
Figure 4.
The oscillatory morphology of the same MHD modes as in Figure 1, however here we display the findings obtained for an equilibrium density (and magnetic field) in an eccentric position, displaced in the direction of the bisector. The model constants empoloyed for this numerical solution are shown by Case C2.3 in Table 1.
The interplay between the effects of inhomogeneous density and magnetic field leads to some interesting patterns in the oscillatory morphology of waves. Compared with the spatial structures of modes we obtained when only the equilibrium density was considered inhomogeneous (Figures 4 and 5 in the study by [19]), the difference in the oscillatory patterns of the studied modes highlights the effect of the magnetic field homogeneity. While for the results shown in [19] the conclusion on the behaviour of modes was clear (i.e., waves were shifted to regions of decreased density), for the case presented in this study, a unified conclusion on the behaviour of waves is difficult to draw. The presence of magnetic field inhomogeneity affects the studied modes in a differential way, clearly the higher order modes are the most affected. In contrast to the results obtain in the case of only the density inhomogeneity, the modes do not migrate towards lower density regions (as the regions where body wave solutions were allowed shrunk), here the magnetic field inhomogeneity compensates the effect of inhomogeneous density enhancement, extending the size of the regions where modes are possible. Equally, the effect of all considered inhomogeneities results in a different effect on waves depending on whether the polarisation direction of waves coincides with the radial direction along which the inhomogeneous regions are shifted. As a result, the symmetry of the modes is distorted, and a categorisation of certain higher order modes based on a simple visual inspection is no longer possible.
When the inhomogeneous region is displaced along the horizontal axis, compared to the concentric density enhancement case, it is evident that the phase speed of the sausage overtone decreases and becomes less than the phase speed of the fluting mode of order . Furthermore, the kink overtone’s phase speed decreases relative to the order fluting mode’s phase speed. Remarkably, in the first eighteen low order slow body modes, the concentric density enhancement case does not exhibit the sausage overtone of order , and the overtone fluting of order drops below the phase speed of the fluting mode of order . Low order modes such as the sausage, kink, and kink overtone fluting modes of order and can still be distinguished in terms of their spatial structure. Their orthogonal slow body modes, on the other hand, exhibit contradictory behaviour, with some modes shifting leftward and others rightward in the direction of the higher density.
When this inhomogeneity is placed along the first bisector the changes in the morphology of wave modes persists qualitatively the same (see Figure 4) as the one presented when the inhomogeneity loading was placed along the horizontal axis.
4.2. The Modifications in the Morphology of Slow Body Modes Induced by Concentric and Eccentric Equilibrium Density (Pressure) Depletions
When the inhomogeneous density ((and consequently, plasma pressure) is represented as a depleted region, the maximum value attained by the plasma density in the inhomogeneous region is less than the density of the homogeneous part of the waveguide, so we consider the case when . At the same time, given the requirement of the conservation of the total pressure, the equilibrium magnetic field attains its maximum value inside the inhomogeneous region. In this section we are going to investigate the modifications in the spatial structure of the same slow body modes as before, when the inhomogeneity has a concentric position () and an eccentric position when the values of the centre of inhomogeneity, and take any value but zero at the same time.
The values of model constants used for the numerical analysis are displayed in Table 1, case C3). Figure 5, with parameters given by Case C3.1 shows the morphology of the normalized corresponding to the same guided slow body MHD modes as before for a concentric loading, while (Figure 6, Case C3.2 in Table 1) and (Figure 7, Case C3.3 in Table 1) show the morphology of , in an eccentric position, when the density inhomogeneity is placed along the horizontal axis and in a position along the first bisector. The modes in the panels of the Figure 5, Figure 6 and Figure 7 are listed in the descending order of their dimensionless eigenvalues (propagation speed in units of the sound speed in the homogeneous region) shown at the top of the panels.
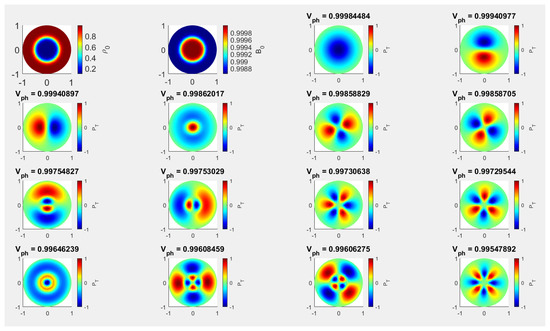
Figure 5.
The oscillatory morphology of same wave modes as in Figure 1, however here we display the findings obtained considering a concentric depleted density (and magnetic field) enhancement. The particular values of the model constants employed in these numerical solutions are given as case C3.1 in Table 1.
Compared to the case when only the density inhomogeneity was considered [19], the oscillatory morphology of the slow body modes we recovered in this case show a distinctive behaviour, and this is due solely to the inhomogeneity in the equilibrium magnetic field. Although from Figure 2 and Figure 5 is evident that the central symmetry is maintained (also similar to the symmetry in the homogeneous case), the spatial extent where modes are possible has increased. The associated eigenmodes exhibit new pattern features differing from those seen in the case of uniform and concentric densities in the presence of concentric equilibrium depletion density inhomogeneities. These results demonstrate that the eigenvalues have a very small decrease in the presence of concentric non-uniform equilibrium density. As the spatial extent of size of modes’ space structure decreases, it may become more challenging to detect them compared to the scenario where density enhancement is uniform, particularly along the internal scattered nodes where centres are more reduced. The overtones of fluting modes of order (Figure 5) and the kink overtones displayed in the last row of the figure appear to be the most affected modes. Moreover, the spatial structure of these modes also tends to extend very near to the boundaries in the case of concentric equilibrium density depletion, indicating that they adhere to lower densities with less migration than that seen in the results when only density was inhomogeneous [19]. These intriguing findings have significant ramifications for optimising modal structures that may be viewed, compared, and correlated in observational data as well as for constructing and organising modes in circular structures.
In a similar vein, the eigenmodes are associated with eccentrically balanced enhanced density inhomogeneities (placed along the horizontal axis and the first bisector, Figure 3 and Figure 4) differ from those obtained for an eccentrically placed depleted density inhomogeneities shown in Figure 6 and Figure 7, respectively. The investigated modes are differentially affected by the presence of magnetic field and density inhomogeneities, with the higher order modes being the most affected. Here, the magnetic field inhomogeneity offsets the effect of inhomogeneous density, expanding the size of the regions where modes are possible. This contrasts the results obtained in the case when only the density inhomogeneity was considered, where the modes migrated towards lower density regions (as the regions where body wave solutions are possible shrunk). Similarly, depending on whether the polarisation direction of the waves coincides with the radial direction along which the inhomogeneous areas are shifted, the influence of all relevant inhomogeneities results in a varied effect on waves. This leads to a distortion of the modes’ symmetry, making it impossible to classify some higher order modes by a mere visual inspection. As before, the higher order modes are the most affected by the presence of density and magnetic field in equilibrium. Similar to the conclusion obtained in the case of enhanced density, the spatial structure (morphology) of slow body modes does remains invariant when the density inhomogeneity is displaced along the horizontal or vertical axes. This result means that an observation of wave pattern in the umbral region of a sunspot might serve as a mean for the identification of the plasma and field inhomogeneity, even if this inhomogeneity cannot be detected in observations.
5. Conclusions
High resolution observations of the last few decades have shown that inhomogeneities in plasma and field parameters are one of the basic ingredients of magnetic flux tubes, from the solar photosphere to the solar corona. The mathematical description of wave propagation in such media is cumbersome, as the inhomogeneous character poses difficulties that cannot be resolved and the determination of the dispersion relation and properties of waves cannot be conducted. Numerical solutions to this complex problem are the only way forward. The solutions presented in our study aimed to emphasise the properties of waves modelled in a realistic solar magnetic waveguide.
Here we extended the study presented by [19] by considering not only the equilibrium density as function of coordinates, but also equilibrium pressure and magnetic field, in line with observations and numerical modelling. Analytical progress has been made by considering that the plasma pressure and density vary following the same dependency on coordinates, meaning that we are dealing with a constant sound speed (isothermal equilibrium). The equilibrium density profile inhomogeneity was represented by a local circular density enhancement or depletion whose strength, size and position can change. The profile of the equilibrium magnetic field has been determined based on the principle of force balance in the equilibrium state. Based on this physical requirement, a decrease in the magnetic field would result from an increase in density or pressure due to the conservation of the equilibrium total pressure. We derived a Helmholtz-like governing equation upon which Dirichlet boundary conditions were used to determine the eigenvalues and eigenvectors as a Sturm-Liouville problem and a Galerkin FEM method was employed to solve the governing equation.
In our analysis we concentrated on slow body waves in the short wavelength limit, therefore, the dimensionless phase speed of waves is converging to one, i.e., the constant sound speed. Our investigation dealt with the modifications in the oscillatory morphology of waves driven by the presence of inhomogeneity. As expected, under the assumption of a homogeneous equilibrium, the eigenmodes exhibit global harmonic oscillations and possess symmetrical characteristics along their respective axes. Our results showed that higher order modes are the most sensitive to the presence of localised inhomogeneities, here we analysed several higher order modes to provide a clearer picture of the impact of the considered inhomogeneities.
First, compared to the uniform equilibrium scenario, the eigenvalues of the waves under study showed a very slight drop. The corresponding eigenmodes in the presence of concentric equilibrium density inhomogeneity are similar to those found in the case of uniform density and the modes show symmetry with respect to the circular waveguide’s centre axis. The kink overtone and the fluting overtone of order were the most affected modes.
The interaction between the inhomogeneous equilibrium magnetic field and density causes some intriguing patterns in the spatial structure of waves. The spatial structure of waves maintains its global character when compared to the spatial structures of modes we obtained when only the equilibrium density was considered (eccentric cases along the horizontal axis). However, the symmetry is distorted, making it impossible to categorise certain higher order modes based only on a visual inspection.
The inhomogeneity of the magnetic field will offset the effect of density inhomogeneity, in contrast to the results obtained in the case of only the inhomogeneous density. The recovered modes do not migrate towards lower density regions (as the regions where body wave solutions were allowed reduced). Modes tend to operate in the opposite way and have their greatest amplitude in the regions that correspond to higher densities. The modification of various higher order modes also depends on the direction in which the inhomogeneity is shifted with respect to the central symmetry axis, the degree of distortion is greater when the direction along which this inhomogeneity is moved coincides with the direction of wave polarisation.
When the depleted inhomogeneous equilibrium density is placed in concentric position the corresponding eigenmodes display novel pattern features that differ from those observed in the case of uniform and concentric densities. As before, the eigenvalues exhibit a negligible drop in the presence of concentric non-uniform equilibrium density depletion. Compared to the case of uniform density augmentation, it may become harder to detect modes when their spatial structure shrinks, especially along the interior scattered nodes where the centres are more diminished. These results have important implications for optimising the structures that can be observed, compared, and correlated in observational data.
Our investigations can be considered as a very first step in studying the properties of waves in sunspots and pores in the presence of local inhomogeneities in the form of umbral dots (UD) and light bridges (LB). Multi-structure density distributions (as observations show) can often be replaced by a resulting structure that adequately captures the effects of multiple UDs present in the sunspot umbra. This means that the equilibrium density inhomogeneity profile is represented by a single local density inhomogeneity, which simulates the UDs observed in the sunspot umbra region, assuming that they are placed close to each other. Furthermore, the LB observed in sunspots can be modelled by a single local density inhomogeneity that separates the sunspot umbra region. The more complex the shape of the density inhomogeneity, the more complex the spatial structure of modes will become. As a result, the pattern of possible waves loses the high-degree of symmetry one can meet in homogeneous cases, especially for higher-order modes, which means that the pattern is no longer global and, therefore, cannot be easily identified. Local wave observations in sunspots may be a way to identify the location and size of density inhomogeneities in the umbra region.
The existence of the location of modes in the presence of density inhomogeneity determined for the density augmentation and depletion indicates one major implications for observations. Even in cases when a density inhomogeneity in the umbral area is not visible in observations, the location of the inhomogeneity may be determined by means of a localised wave observation in a sunspot or pore.
Our study employed a series of simplifications in order to make the mathematics tractable, probably the most stringent being the perfect symmetry of the waveguide. An earlier study by the authors [7] showed that the shape of the waveguide (realistic) has a strong influence on the spatial structure of modes. However, giving up the perfect symmetry means that mathematical progress cannot be made and a full numerical analysis will be needed to address the problem. It is our intention investigate the nature and morphology of waves in realistic waveguides in the near future.
Author Contributions
Conceptualization, I.B., V.F. and G.V.; methodology, I.B. and F.A.; software, F.A. and E.F.-D.; validation, F.A., V.F., G.V. and A.B.A.; formal analysis, I.B.; investigation, I.B. and F.A.; resources, I.B. and F.A.; data curation, F.A.; writing—original draft preparation, I.B. and F.A.; writing—review and editing, I.B., F.A., V.F., G.V., E.F.-D. and A.B.A.; visualization, F.A.; supervision, I.B., V.F. and G.V.; project administration, I.B. All authors have read and agreed to the published version of the manuscript.
Funding
F.A. is grateful to Taibah University’s Deanship of Scientific Research (DSR) for enabling him to pursue his PhD studies at the University of Sheffield. V.F. and G.V. are grateful to the Science and Technology Facilities Council (STFC) grant ST/V000977/1. V.F., G.V. and I.B. thank the Institute for Space-Earth Environmental Research (ISEE, International Joint Research Program, Nagoya University, Japan); Royal Society, International Exchanges Scheme, collaboration with Chile (IE170301), Brazil (IES/R1/191114), Greece (IES/R1/221095), Australia (IES/R3/213012) and India (IES/R1/211123) for the support provided. This research has also received financial support from the European Union’s Horizon 2020 research and innovation program under grant agreement No. 824135 (SOLARNET) and No. 955620 (SWATNet).
Data Availability Statement
The data underlying this article will be shared on reasonable request to the corresponding author(s).
Conflicts of Interest
The authors declare no conflicts of interest. The funders had no role in the design of the study; in the collection, analyses, or interpretation of data; in the writing of the manuscript; or in the decision to publish the results.
References
- Jess, D.B.; Van Doorsselaere, T.; Verth, G.; Fedun, V.; Krishna, P.S.; Erdélyi, R.; Keys, P.H.; Grant, S.D.T.; Uitenbroek, H.; Christian, D.J. An inside look at sunspot sscillations with sigher azimuthal wavenumbers. Astrophys. J. 2017, 842, 59. [Google Scholar] [CrossRef]
- Stangalini, M.; Jess, D.B.; Verth, G.; Fedun, V.; Fleck, B.; Jafarzadeh, S.; Keys, P.H.; Murabito, M.; Calchetti, D.; Aldhafeeri, A.A.; et al. A novel approach to identify resonant MHD wave modes in solar pores and sunspot umbrae: B-ω analysis. Astron. Astrophys. 2021, 649, A169. [Google Scholar] [CrossRef]
- Albidah, A.B.; Brevis, W.; Fedun, V.; Ballai, I.; Jess, D.B.; Stangalini, M.; Highman, J.; Verth, G. Proper orthogonal and dynamic mode decomposition of sunspot data. Phil. Trans. R. Soc. 2021, 379, 20200181. [Google Scholar] [CrossRef]
- Stangalini, M.; Verth, G.; Fedun, V.; Aldhafeeri, A.A.; Jess, D.B.; Jafarzadeh, S.; Keys, P.H.; Fleck, B.; Terradas, J.; Murabito, M.; et al. Large scale coherent magnetohydrodynamic oscillations in a sunspot. Nat. Commun. 2022, 13, 479. [Google Scholar] [CrossRef] [PubMed]
- Albidah, A.B.; Fedun, V.; Aldhafeeri, A.A.; Ballai, I.; Brevis, W.; Jess, D.B.; Higham, J.; Stangalini, M.; Silva, S.S.A.; Verth, G. Magnetohydrodynamic wave mode identification in circular and elliptical sunspot umbrae: Evidence for high-order modes. Astrophys. J. 2022, 927, 201. [Google Scholar] [CrossRef]
- Grant, S.D.T.; Jess, D.B.; Stangalini, M.; Jafarzadeh, S.; Fedun, V.; Verth, G.; Keys, P.H.; Rajaguru, S.P.; Uitenbroek, H.; MacBride, C.D.; et al. The propagation of coherent waves across multiple solar magnetic pores. Astrophys. J. 2022, 938, 143. [Google Scholar] [CrossRef]
- Albidah, A.B.; Fedun, V.; Aldhafeeri, A.A.; Ballai, I.; Jess, D.B.; Brevis, W.; Higham, J.; Stangalini, M.; Silva, S.S.A.; MacBride, C.D.; et al. The temporal and spatial evolution of magnetohydrodynamic wave modes in sunspots. Astrophys. J. 2023, 954, 30. [Google Scholar] [CrossRef]
- Erdélyi, R.; Morton, R.J. Magnetohydrodynamic waves in a compressible magnetic flux tube with elliptical cross-section. Astron. Astrophys. 2009, 494, 295–309. [Google Scholar] [CrossRef]
- Moreels, M.G.; Van Doorsselaere, T. Phase relations for seismology of photospheric flux tubes. Astron. Astrophys. 2013, 551, 137. [Google Scholar] [CrossRef]
- Moreels, M.G.; Freij, N.; Erdélyi, R.; Van Doorsselaere, T.; Verth, G. Observations and mode identification of sausage waves in a magnetic pore. Astron. Astrophys. 2015, 579, A73. [Google Scholar] [CrossRef][Green Version]
- Feng, S.; Deng, Z.; Yuan, D.; Xu, Z.; Yang, X. Propagating slow sausage waves in a sunspot observed by the New Vacuum Solar Telescope. Res. Astron. Astrophys. 2020, 20, 117. [Google Scholar] [CrossRef]
- Morton, R.J.; Erdélyi, R.; Jess, D.B.; Mathioudakis, M. Observations of sausage modes in magnetic pores. Astrophys. J. Lett. 2011, 729, 18–23. [Google Scholar] [CrossRef]
- Grant, S.D.T.; Jess, D.B.; Moreels, M.G.; Morton, R.J.; Christian, D.J.; Giagkiozis, I.; Verth, G.; Fedun, V.; Keys, P.H.; Van Doorsselaere, T.; et al. Wave Damping Observed in Upwardly Propagating Sausage-mode Oscillations Contained within a Magnetic Pore. Astrophys. J. 2015, 806, 132. [Google Scholar] [CrossRef]
- Keys, P.H.; Morton, R.J.; Jess, D.B.; Verth, G.; Grant, S.D.T.; Mathioudakis, M.; Mackay, D.H.; Doyle, J.G.; Christian, D.J.; Keenan, F.P.; et al. Photospheric observations of surface and body modes in solar magnetic pores. Astrophys. J. 2018, 857, 28. [Google Scholar] [CrossRef]
- Edwin, P.; Roberts, B. Wave Propagation in a magnetic cylinder. Sol. Phys. 1983, 88, 179–191. [Google Scholar] [CrossRef]
- Nakaraikov, V.M.; Yelagandula, N.V. Damping scenarios of kink oscillations of solar soronal loops. Universe 2023, 9, 95. [Google Scholar] [CrossRef]
- Williams, T.; Walsh, R.W.; Peter, H.; Winebarger, A.R. Evidence for and analysis of multiple hidden coronal strands in cross-sectional emission profiles: Further results from NASA’s high-resolution Solar Coronal Imager. Astrophys. J. 2020, 902, 90. [Google Scholar] [CrossRef]
- Skirvin, S.; Verth, G.; González-Avilés, J.J.; Shelyag, S.; Sharma, R.; Guzmán, F.S.; Ballai, I.; Scullion, E.; Silva, S.S.A.; Fedun, V. Small-scale solar jet formation and their associated waves and instabilities. Adv. Space Res. 2023, 71, 1866–1892. [Google Scholar] [CrossRef]
- Asiri, F.; Ballai, I.; Fedun, V.; Verth, G.; Ruzheinikov, S.N.; Albidah, A.B. Slow body magnetohydrodynamic waves in solar photospheric flux tubes with density inhomogeneity. Mon. Not. R. Astron. Soc. 2024, 529, 748–760. [Google Scholar] [CrossRef]
- Skirvin, S.J.; Fedun, V.; Verth, G. The effect of symmetric and spatially varying equilibria and flow on MHD wave modes: Slab geometry. Mon. Not. R. Astron. Soc. 2021, 504, 4077–4092. [Google Scholar] [CrossRef]
- Skirvin, S.J.; Fedun, V.; Silva Suzana, S.A.; Verth, G. The effect of axisymmetric and spatially varying equilibria and flow on MHD wave modes: Cylindrical geometry. Mon. Not. R. Astron. Soc. 2022, 510, 2689–2706. [Google Scholar] [CrossRef]
- Rae, I.C.; Roberts, B. Pulse propagation in a magnetic flux tube. Astrophys. J. 1982, 256, 761–767. [Google Scholar] [CrossRef]
- Kalkofen, W.; Rossi, P.; Bodo, G.; Massaglia, S. Propagation of acoustic waves in a stratified atmosphere I. Astron. Astrophys. 1994, 284, 976–984. [Google Scholar]
- Sutmann, G.; Musielak, Z.E.; Ulmschneider, P. Acoustic wave propagation in the solar atmosphere. III. Analytic solutions for adiabatic wave excitations. Astron. Astrophys. 1998, 340, 556–568. [Google Scholar]
- Ballai, I.; Erdélyi, R.; Hargreaves, J. Slow magnetohydrodynamic waves in stratified and viscous plasmas. Phys. Plasmas 2006, 13, 042108–042115. [Google Scholar] [CrossRef]
- Goedbloed, J.P.; Keppens, R.; Poedts, S. Advanced Magnetohydrodynamics: With Applications to Laboratory and Astrophysical Plasmas; Cambridge University Press: Cambridge, UK, 2010. [Google Scholar]
- Roberts, B. MHD Waves in the Solar Atmosphere; Cambridge University Press: Cambridge, UK, 2019. [Google Scholar]
- Alharbi, A.; Ballai, I.; Fedun, V.; Verth, G. Slow magnetoacoustic waves in gravitationally stratified two-fluid plasmas in strongly ionized limit. Mon. Not. R. Astron. Soc. 2021, 501, 1940–1950. [Google Scholar] [CrossRef]
- Sakurai, T.; Goossens, M.; Hollweg, J.V. Resonant Behaviour of Magnetohydrodynamic Waves on Magnetic Flux Tubes—Part One. Sol. Phys. 1991, 133, 227–245. [Google Scholar] [CrossRef]
- Goossens, M.; Hollweg, J.V.; Sakurai, T. Resonant Behaviour of Magnetohydrodynamic Waves on Magnetic Flux Tubes—Part Three. Sol. Phys. 1992, 138, 233–255. [Google Scholar] [CrossRef]
- Soler, R.; Terradas, J.; Oliver, R.; Ballester, J.L. Propagation of torsional Alfvén waves from the photosphere to the corona: Reflection, transmission, and heating in expanding flux tubes. Astrophys. J. 2017, 840, 20. [Google Scholar] [CrossRef]
- Pagano, P.; De Moortel, I.; Morton, R.J. Effect of coronal loop structure on wave heating through phase mixing. Astron. Astrophys. 2020, 643, A73. [Google Scholar] [CrossRef]
- Ruderman, M.S.; Roberts, B. The damping of coronal loop oscillations. Astrophys. J. 2002, 577, 475–486. [Google Scholar] [CrossRef]
- Tomczyk, S.; McIntosh, S.W.; Keil, S.L.; Judge, P.G.; Schad, T.; Seeley, D.H.; Edmondson, J. Alfvén waves in the solar corona. Science 2007, 317, 1192. [Google Scholar] [CrossRef] [PubMed]
- Van Doorsselaere, T.; Nakariakov, V.M.; Verwichte, E. Detection of Waves in the Solar Corona: Kink or Alfvén? Astrophys. J. 2008, 676, L73. [Google Scholar] [CrossRef]
- Morton, R.J.; Tomczyk, S.; Pinto, R. Investigating Alfvénic wave propagation in coronal open-field regions. Nat. Commun. 2015, 6, 7813. [Google Scholar] [CrossRef] [PubMed]
- Morton, R.J.; Weberg, M.J.; McLaughlin, J.A. A basal contribution from p-modes to the Alfvénic wave flux in the Sun’s corona. Nat. Astron. 2019, 3, 223. [Google Scholar] [CrossRef]
- Aldhafeeri, A.A.; Verth, G.; Fedun, V.; Lennard, M.; Ballai, I. Comparison of exact and approximate MHD slow body mode solutions in photospheric waveguides. Astrophys. J. 2022, 938, 32. [Google Scholar] [CrossRef]
Disclaimer/Publisher’s Note: The statements, opinions and data contained in all publications are solely those of the individual author(s) and contributor(s) and not of MDPI and/or the editor(s). MDPI and/or the editor(s) disclaim responsibility for any injury to people or property resulting from any ideas, methods, instructions or products referred to in the content. |
© 2024 by the authors. Licensee MDPI, Basel, Switzerland. This article is an open access article distributed under the terms and conditions of the Creative Commons Attribution (CC BY) license (https://creativecommons.org/licenses/by/4.0/).