Article

From Known to Unknown: Cosmic Ray Transitions from the Sun, the Galaxy, and Extra-Galactic Systems

1
College of Physics, Chongqing University, Chongqing 401331, China
2
Key Laboratory of Particle Astrophysics, Institute of High Energy Physics, Chinese Academy of Sciences, Beijing 100049, China
3
College of Physics, University of Chinese Academy of Sciences, Beijing 100049, China
4
Tianfu Cosmic Ray Research Center, Chengdu 610213, China
*
Authors to whom correspondence should be addressed.
Current address: Wisconsin IceCube Particle Astrophysics Center, University of Wisconsin–Madison, Madison, WI 53703, USA.
Universe 2025, 11(3), 96; https://doi.org/10.3390/universe11030096
Submission received: 25 January 2025 / Revised: 3 March 2025 / Accepted: 7 March 2025 / Published: 14 March 2025
(This article belongs to the Special Issue Universe: Feature Papers 2025—Space Science)

Abstract

:
The question of at which energy the transition from galactic to extra-galactic cosmic rays takes place has been a long-standing conundrum in cosmic ray physics. The sun stands out as the closest and clearest astrophysical accelerator of cosmic rays, while other objects within and beyond the galaxy remain enigmatic. It is probable that the cosmic ray spectrum and mass components from these celestial sources share similarities, offering a novel approach to study their origin. In this study, we perform joint analysis of spectra and mass in the energy range from MeV to 10 EeV, and find the following: (1) lnA demonstrates three clear peaks, tagging component transition; (2) a critical variable Δ is adopted to define the location of the transition; (3) for protons, the knee is located at ∼1.8 PeV, and the boundary between the galaxy and extra-galaxy occurs at ∼60 PeV, marked by a spectral dip; and (4) the all-particle spectrum exhibits hardening at ∼60 PeV due to the contribution of nearby galaxies, and the extra-galaxy dominates ∼0.8 EeV. We hope the LHAASO experiment can perform spectral measurements of individual species to validate these specific observations.

1. Introduction

The all-particle spectrum of cosmic rays (CRs) with energies ranging from MeV to over 100 EeV roughly follows a power law with an index close to −2.7. It is widely accepted that CRs above 10 EeV are of extra-galactic origin, as their gyroradii exceed the scale constrained by the magnetic fields of the Milky Way, although definitive sources have yet to be identified. In contrast, particles in the energy region below PeV are primarily attributed to galactic sources. Supernova remnants (SNRs) have long been proposed as the primary accelerators of galactic cosmic rays (GCRs) through diffusive shock acceleration. Considering SNRs as the sole source of CRs in the galaxy, approximately 10% of their energy would need to be converted into CRs to sustain the observed level of the galactic CR “sea” [1]. Recently, growing observations [2,3,4,5,6] have identified several intriguing sources, such as pulsars, collimated microquasars, and young massive star clusters, which may play a significant role as dominant PeVtrons. A transition of CRs from galactic to extra-galactic origins is theoretically anticipated; however, the precise energy at which this transition occurs remains a topic of ongoing debate.
A comprehensive understanding of the transition is crucial for elucidating the complete landscape of CR origins, encompassing aspects such as source maximum acceleration energy, the capacity of the galaxy to confine CRs up to high energies, and thus the intensity and structure of the galactic magnetic field. Also, it concerns the source composition of extra-galactic CRs (EGCRs), and the propagation of CRs in extra-galactic magnetic fields [7].
Two promising transition possibilities correspond to key features of the CR spectrum: the second knee at around 0.1–0.5 EeV and the ankle at approximately 3 EeV. These are explained by three models: the ankle model, the dip model, and the mixed composition model, which primarily differ in transition energy and the mass composition of the extra-galactic component. The ankle model, which positions the ankle as the transition point, has been proposed for many years. However, this perspective is inconsistent with the measured average depth of the air shower maximum, X m a x in the energy range of 1–5 EeV, as well as with the observed large-scale anisotropy at energies above 3 EeV [8,9]. Additionally, this interpretation necessitates the incorporation of an extra component to bridge the gap between the galactic iron knee and the ankle [10]. In the dip model, the transition from GCRs to EGCRs occurs at the second knee [11,12]. While this model provides a robust framework for describing data collected at the Telescope Array (TA), it faces challenges due to tensions with the mass composition inferred from measurements at the Pierre Auger Observatory (PAO) [13]. The transition in mixed composition models occurs from iron to lighter nuclei and may take place at or near the ankle, depending on the choice of parameters [10]. Unlike the other two models, the mixed composition model requires higher accuracy in the fluorescent method to differentiate the mixed extra-galactic composition from proton-dominated or iron-dominated scenarios, as there are currently no reliable predictions for the mass composition of EGCRs [14]. For a comprehensive introduction and comparison of these transition models, one can refer to [13,15,16].
As noted above, spectra, mass composition, and CR anisotropy are three key factors that distinguish different transition models and can help us gain insights into the origins of CRs [9,10]. Fluxes of CR with energies above the PeV scale are so low that they can only be measured through ground-based experiments, leading to various systematic errors and calibration effects. Near the knee region, there have been few experimental measurements of mass composition, with the exception of the recent precise observations from LHAASO [17]. In the higher energy range of 0.1–3 EeV, conflicting data on mass composition between HiRes and TA on one side and PAO on the other have hindered consensus on different composition models and the GCR-EGCR transition issue [10].
While the origins of GCRs and EGCRs remain elusive, the sun is a well-studied entity known for its ability to accelerate solar CRs (SCRs) from MeV to a few GeV. There are several types of SCRs in the MeV range, with coronal mass ejection (CME)-related solar energetic particle (SEP) events being among the most intense and reaching the highest energies in the solar system [18]. These events are accelerated by CME-driven shocks, dissipating approximately 5–10% of kinetic energy. Similarly, GCRs are believed to be accelerated by diffusive shocks with a comparable efficiency (e.g., [19]). The production of GCRs can be considered analogous to the formation of the time-averaged SEP spectrum [20]. In addition, the energy spectrum of an SEP is typically fitted as a power law with an exponential cutoff, with the similar knee-like structure occurring at around 1 GeV [21]. It is likely that similarities exist in the CR observations from the Sun to the galaxy, as well as from galactic to extra-galactic systems, providing a fresh perspective for investigating their origins. SCRs have been extensively researched, serving as a valuable standard for exploring the relatively less understood GCRs and the GCR-EGCR transition.
Previous research has predominantly centered on the knee-to-ankle region. In this study, our focus extends across the entire CR energy spectrum, ranging from MeV to EeV, performing joint analysis of spectrum and composition. Our aim is to explore the GCR-EGCR transition by drawing comparisons to the SCR-GCR transition. The former transition is impeded by incomplete measurement data for the composition spectrum, as well as notable measurement statistics and uncertainties. In contrast, the elemental flux of the latter transition is well established. In the following, we employ a phenomenological function to characterize the spectra of each individual element in Section 2. Subsequently, in Section 3, we present the findings related to the all-particle spectrum and mean logarithmic mass, highlighting the shared patterns observed between these two transitions. Finally, Section 4 provides our conclusions, followed by a short discussion in Section 5.

2. Dataset and Method

The main framework idea of this article is depicted in Figure 1. The spectra of each nucleus in SCRs exhibit a maximum energy cutoff, with lighter nuclei dropping first, followed by intermediate ones, and ultimately iron-dominated nuclei. At higher energies, lighter GCRs begin to dominate. In other words, the signature of the transition in composition is the gradual disappearance of solar elements from protons to iron and the increase of a lighter or intermediate galactic component. We designate the energy where protons start to drop as point A, the interaction where solar protons and galactic iron intersect as point B, and the location dominated by galactic protons as point C. This means the mean mass with energy plots should start increasing at A, reaching the peak at point B, and falling back to a trough at point C. It is natural to assume and investigate whether there are similar structures and changes at the transition from within the Milky Way to outside the Milky Way.
As mentioned earlier, SEP events bear similarities to GCRs. Two notable SEP events with relatively complete nuclei energy spectra, which occurred on 29 October 2003 and 25 August 1998 [22,23], have been selected for analysis as representatives of SCRs. Despite numerous recorded SCR events, the composition and energy spectra of these two events for key elements from hydrogen to iron are characterized by high statistical accuracy. Space-borne experiments can detect CRs with energies up to 100 TeV, providing valuable data on elemental species. Data from various satellite experiments such as AMS-02, DAMPE, CREAM, etc., are utilized. However, for events with even higher energies, measurements are limited to ground-based facilities, with the majority of these observations presenting an all-particle spectrum and showing significant uncertainties in mass composition. Therefore, ground-based measurements of partially available nuclei spectra (P, He, Fe), the all-particle spectrum, and mean logarithmic mass distributions are employed, including the most precise measurement to date achieved by the LHAASO experiment [17]. The caption of Figure 2 lists all the spectral datasets used in this work.
It is important to acknowledge several assumptions throughout this work. When comparing the transition from GCR-EGCR to SCR-GCR, it is assumed that the transition of GCR-EGCR is charge-dependent. Additionally, we consider three source populations to explain GCRs, and two source populations for the EGCRs. For the GCR spectrum, SNRs are usually considered potential CR sources. However, growing evidence shows that this is not sufficient [24]. Therefore, at least two source populations are adopted, one of which is typically described as in terms of a smooth broken power law when considering solar modulation [25]. With the observation of spectral hardening of protons and helium in the tens of TeV range [26,27,28], we assume there is a nearby source population [29]. For the EGCR spectrum, it is often assumed that at least two main source populations contribute to the observed spectrum [30,31]. The main particle acceleration mechanism, diffusive shock acceleration theory, usually predicts a power law distribution with an exponential cutoff [32]. Thus, we expect all these populations to follow a cutoff power law spectrum. In addition, due to a lack of observations for the high-energy range of middle-heavy elements, their flux is manually adjusted based on the spectral index of light-heavy elements and their own low-energy observations. The all-particle spectrum and mean logarithmic mass measurements provide constraints on the total elemental composition. The caption of Figure 2 lists all the spectral datasets used in this work.
Mathematically, the multiple-segment power law function describes the total CR energy flux in the MeV to 10 EeV range as
F = Φ p l , 1 ( S o l a r ) + Φ s b p l + Φ p l , 2 + Φ p l , 3 ( G C R ) + Φ p l , 4 + Φ p l , 5 ( E G C R )
where
Φ p l , i ( E ) = Φ i E γ i e E E c , i ,
and Φ i , γ i , and E c , i are the normalized factor, the power law index, and the cutoff energy position of the energy spectrum for the i-th component ranging from 1 to 5. Φ s b p l is a broken power law component:
Φ s b p l ( E ) = Φ 0 E α 1 1 + E E b , 0 1 / δ ( α 1 α 2 ) δ e E E c , 0 .
where Φ 0 is the normalized factor, while α 1 and α 2 are the power law indices before and after the break energy E b , 0 , and δ stands for the smoothness of the break.
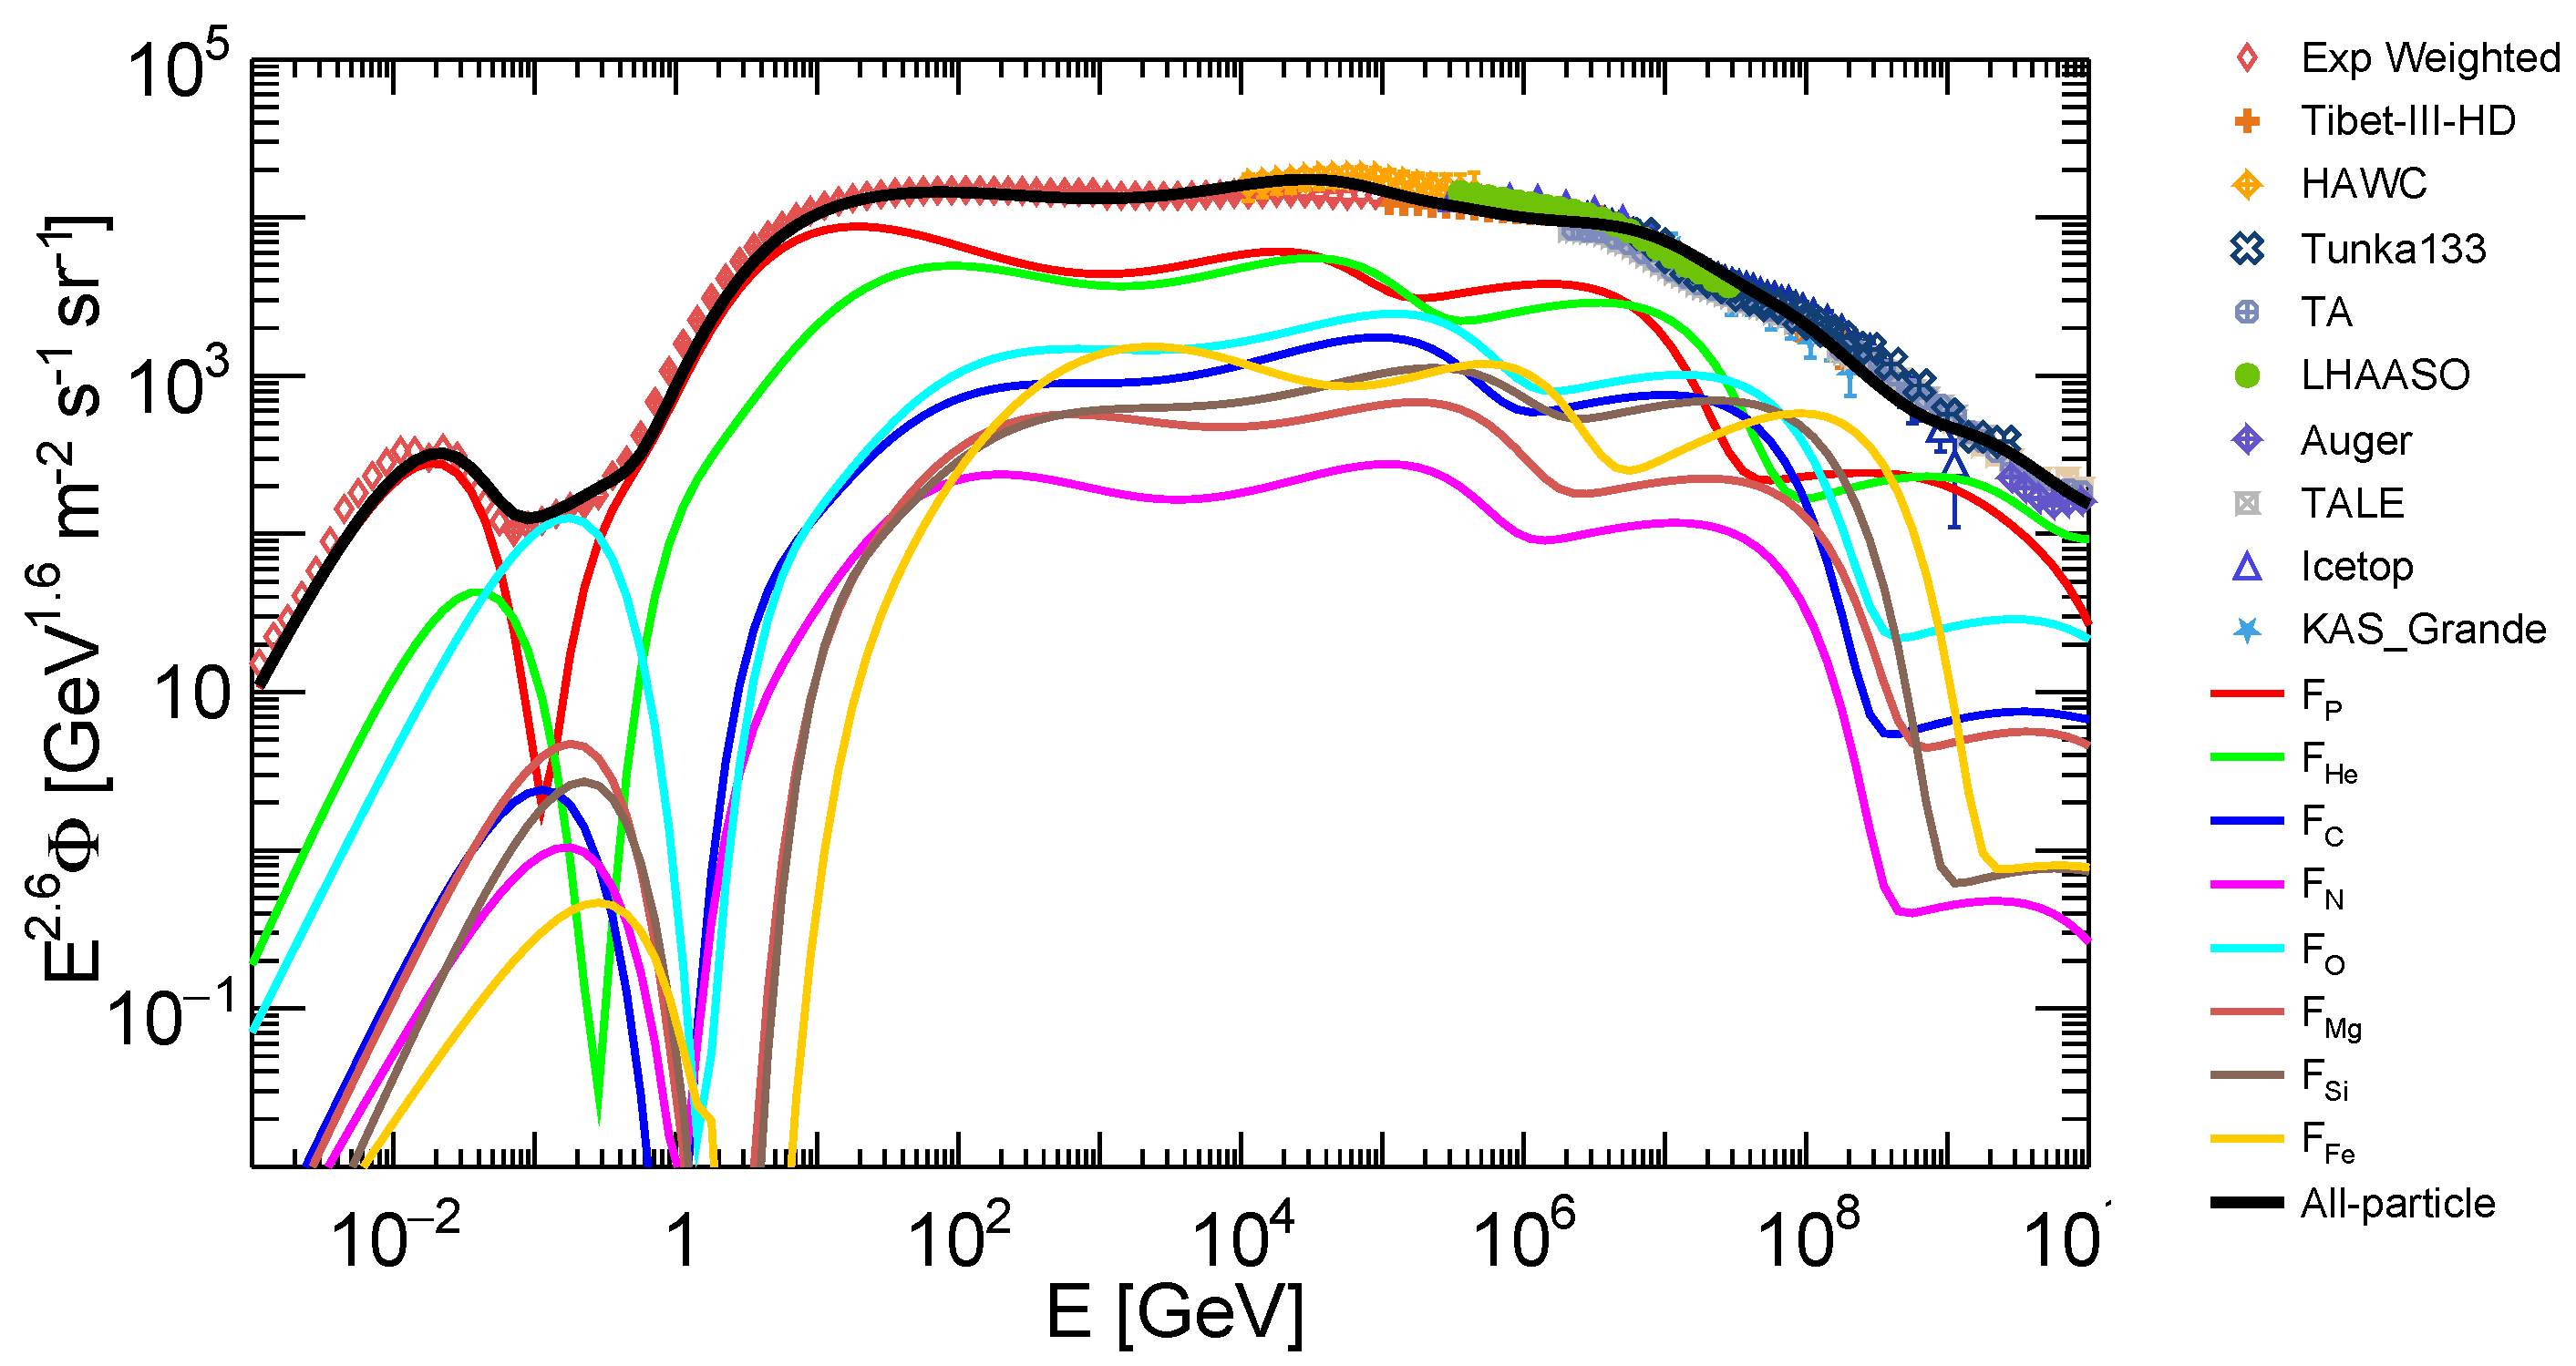
The energy spectra of individual elements (P, He, C, N, O, Mg, Si, Fe) are individually described with a complementary function, as shown in Figure 2. The details of each power law component for the protons are depicted in Figure A1 in Appendix A, while the function descriptions of each nucleus species, compared with the all-particle spectrum, are presented on the right. The detailed parameters of each species are listed in Table 1. A hyperbolic cosine is adopted for the solar modulation, which is approximately 450 MV, and a similar galactic modulation as 0.1 EV in the data comparison.
Figure 2. Spectra of all-particle and elemental species from MeV to EeV, described with multi-segment function and compared with experimental data from experiments. All-particle spectra are from Tibet-III [33], HAWC [34], IceTop [35], TALE [36], KASCADE [37], KASCADE-Grande [38], Auger [39], Tunka-133 [40], LHAASO [17], and Exp-weighted are observations from space-borne experiments. Proton data are from AMS-02 [41], DAMPE [26], CALET [27], CREAM [42], PAMELA [43], GRAPES-3 [44], Nucleon [45], IceTop [46], KASCADE [47], and KASCADE-Grande [38]. KASCADE-Grande is abbreviated as KAS-Grande in plot due to limited legend space. Helium data are from AMS-02 [41], CREAM [42], DAMPE [28], PAMELA [43], Nucleon [45], IceTop [46], KASCADE [47], KASCAEDE-Grande [38]. Carbon: AMS-02 [41], CREAM [48], Nucleon [45], KASCADE [47], and KASCADE-Grande [38]. Nitrogen: AMS-02 [41] and CREAM [48]. Oxygen: AMS-02 [41], CREAM [48], IceTop [46]. Magnesium: AMS-02 [49], Nucleon [45], and CREAM [48]. Silicon: AMS-02 [49], CREAM [48], Nucleon [45], and KASCADE [47], KASCADE-Grande [38]. Iron: AMS-02 [50], CREAM [48], Nucleon [45], IceTop [46], KASCADE [47], and KASCADE-Grande [38].
Universe 11 00096 g002
The mean logarithmic mass, an often-used quantity to characterize the CR mass composition, below PeV could be calculated with an analytical expression as well as the direct observational spectra data of each element, using
ln A = ln A i × F i F i
where ln A i and F i are the logarithmic mass and flux of a nuclei. The l n A calculated through the flux function could be compared with l n A observations from ground-based facilities.
To obtain the quantitative changes in the energy spectrum and l n A , and ultimately determine the transition point, we defined a slope variable Δ as follows:
Δ = Δ y Δ r = Δ y ( Δ x ) 2 + ( Δ y ) 2 .
Here, when there is a localized change Δ x on the x-axis, there is a corresponding change Δ y on the y-axis. Δ is a slope variable in mathematics that we aim to measure in order to assess the steepness or inclination of the mass composition and spectrum as they change with energy, tracing their evolution. With Δ , the changes in the energy spectrum and l n A with respect to energy can be tracked and quantitatively calculated. This enables an effective capture of the variations illustrated in Figure 1, specifically at points A, B, and C marked on the energy spectra.

3. Results

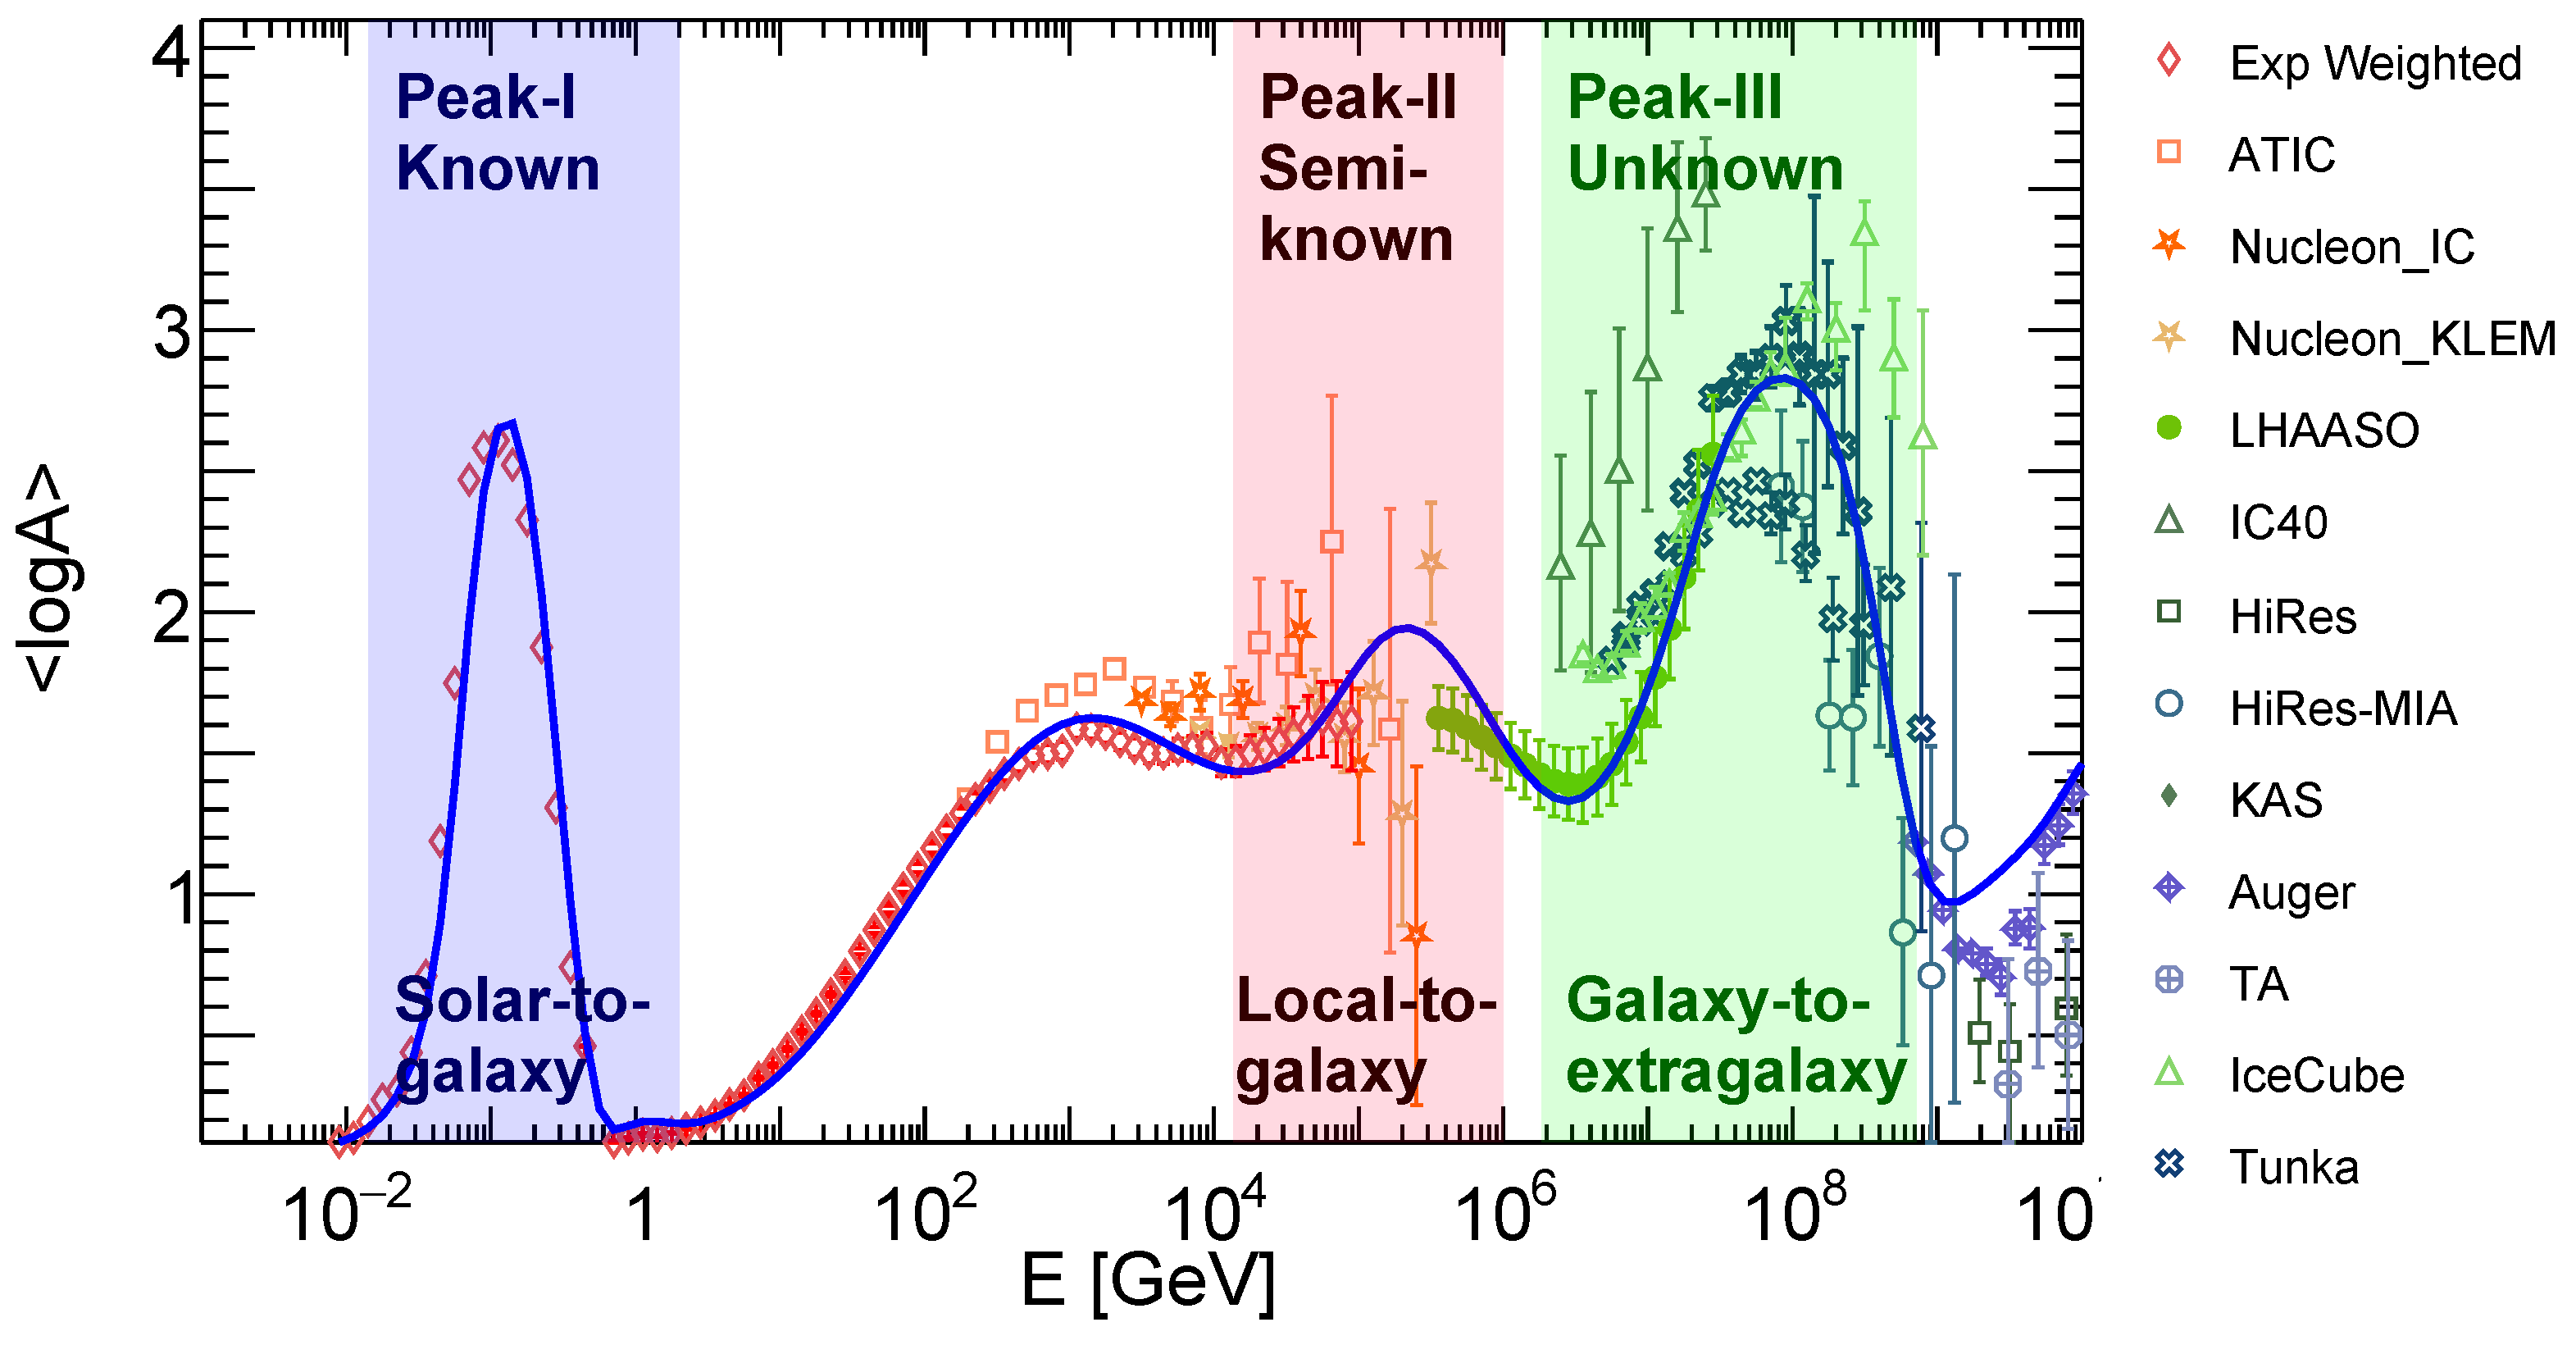
In this section, we first demonstrate that the mean logarithmic mass l n A is a reliable indicator for identifying the component transition. We then present the variation of Δ with energy in the joint spectrum and mass, providing a quantitative description of this transition with the help of Δ . Figure 3 illustrates the variation of l n A across energies from MeV to 10 EeV. It is evident that there are three peaks. The first peak is clearly associated with the transition from SCRs to GCRs. The second peak, occurring around 200 TeV, indicates the contribution of local sources [51,52]. This is supported by recent observations of unexpected changes in elemental spectra within the hundreds of GeV to tens of TeV range [26,27,28], as well as the amplitude and phase of large-scale anisotropies around 100 TeV, which necessitate the existence of a local source for their explanation. The third peak can be readily linked to the transition from GCRs to EGCRs, drawing upon the implications of the previous two peaks. The significance of Peak-II suggests that the local transition from local sources to the galaxy is not as pronounced as that of SCR-GCR and GCR-EGCR. A large portion of the light component dominates, although heavy components from local sources may contribute to the total flux, leading to an upward shift in the log mass distribution. On the other hand, the presence of local transitions underscores the effectiveness of using the Δ distribution to verify these transitions. However, from an experimental standpoint, there are limited detailed observations around Peak-II, even when considering the latest LHAASO measurements. Therefore, additional measurements of the composition spectrum are needed at around 200 TeV to validate our calculations.
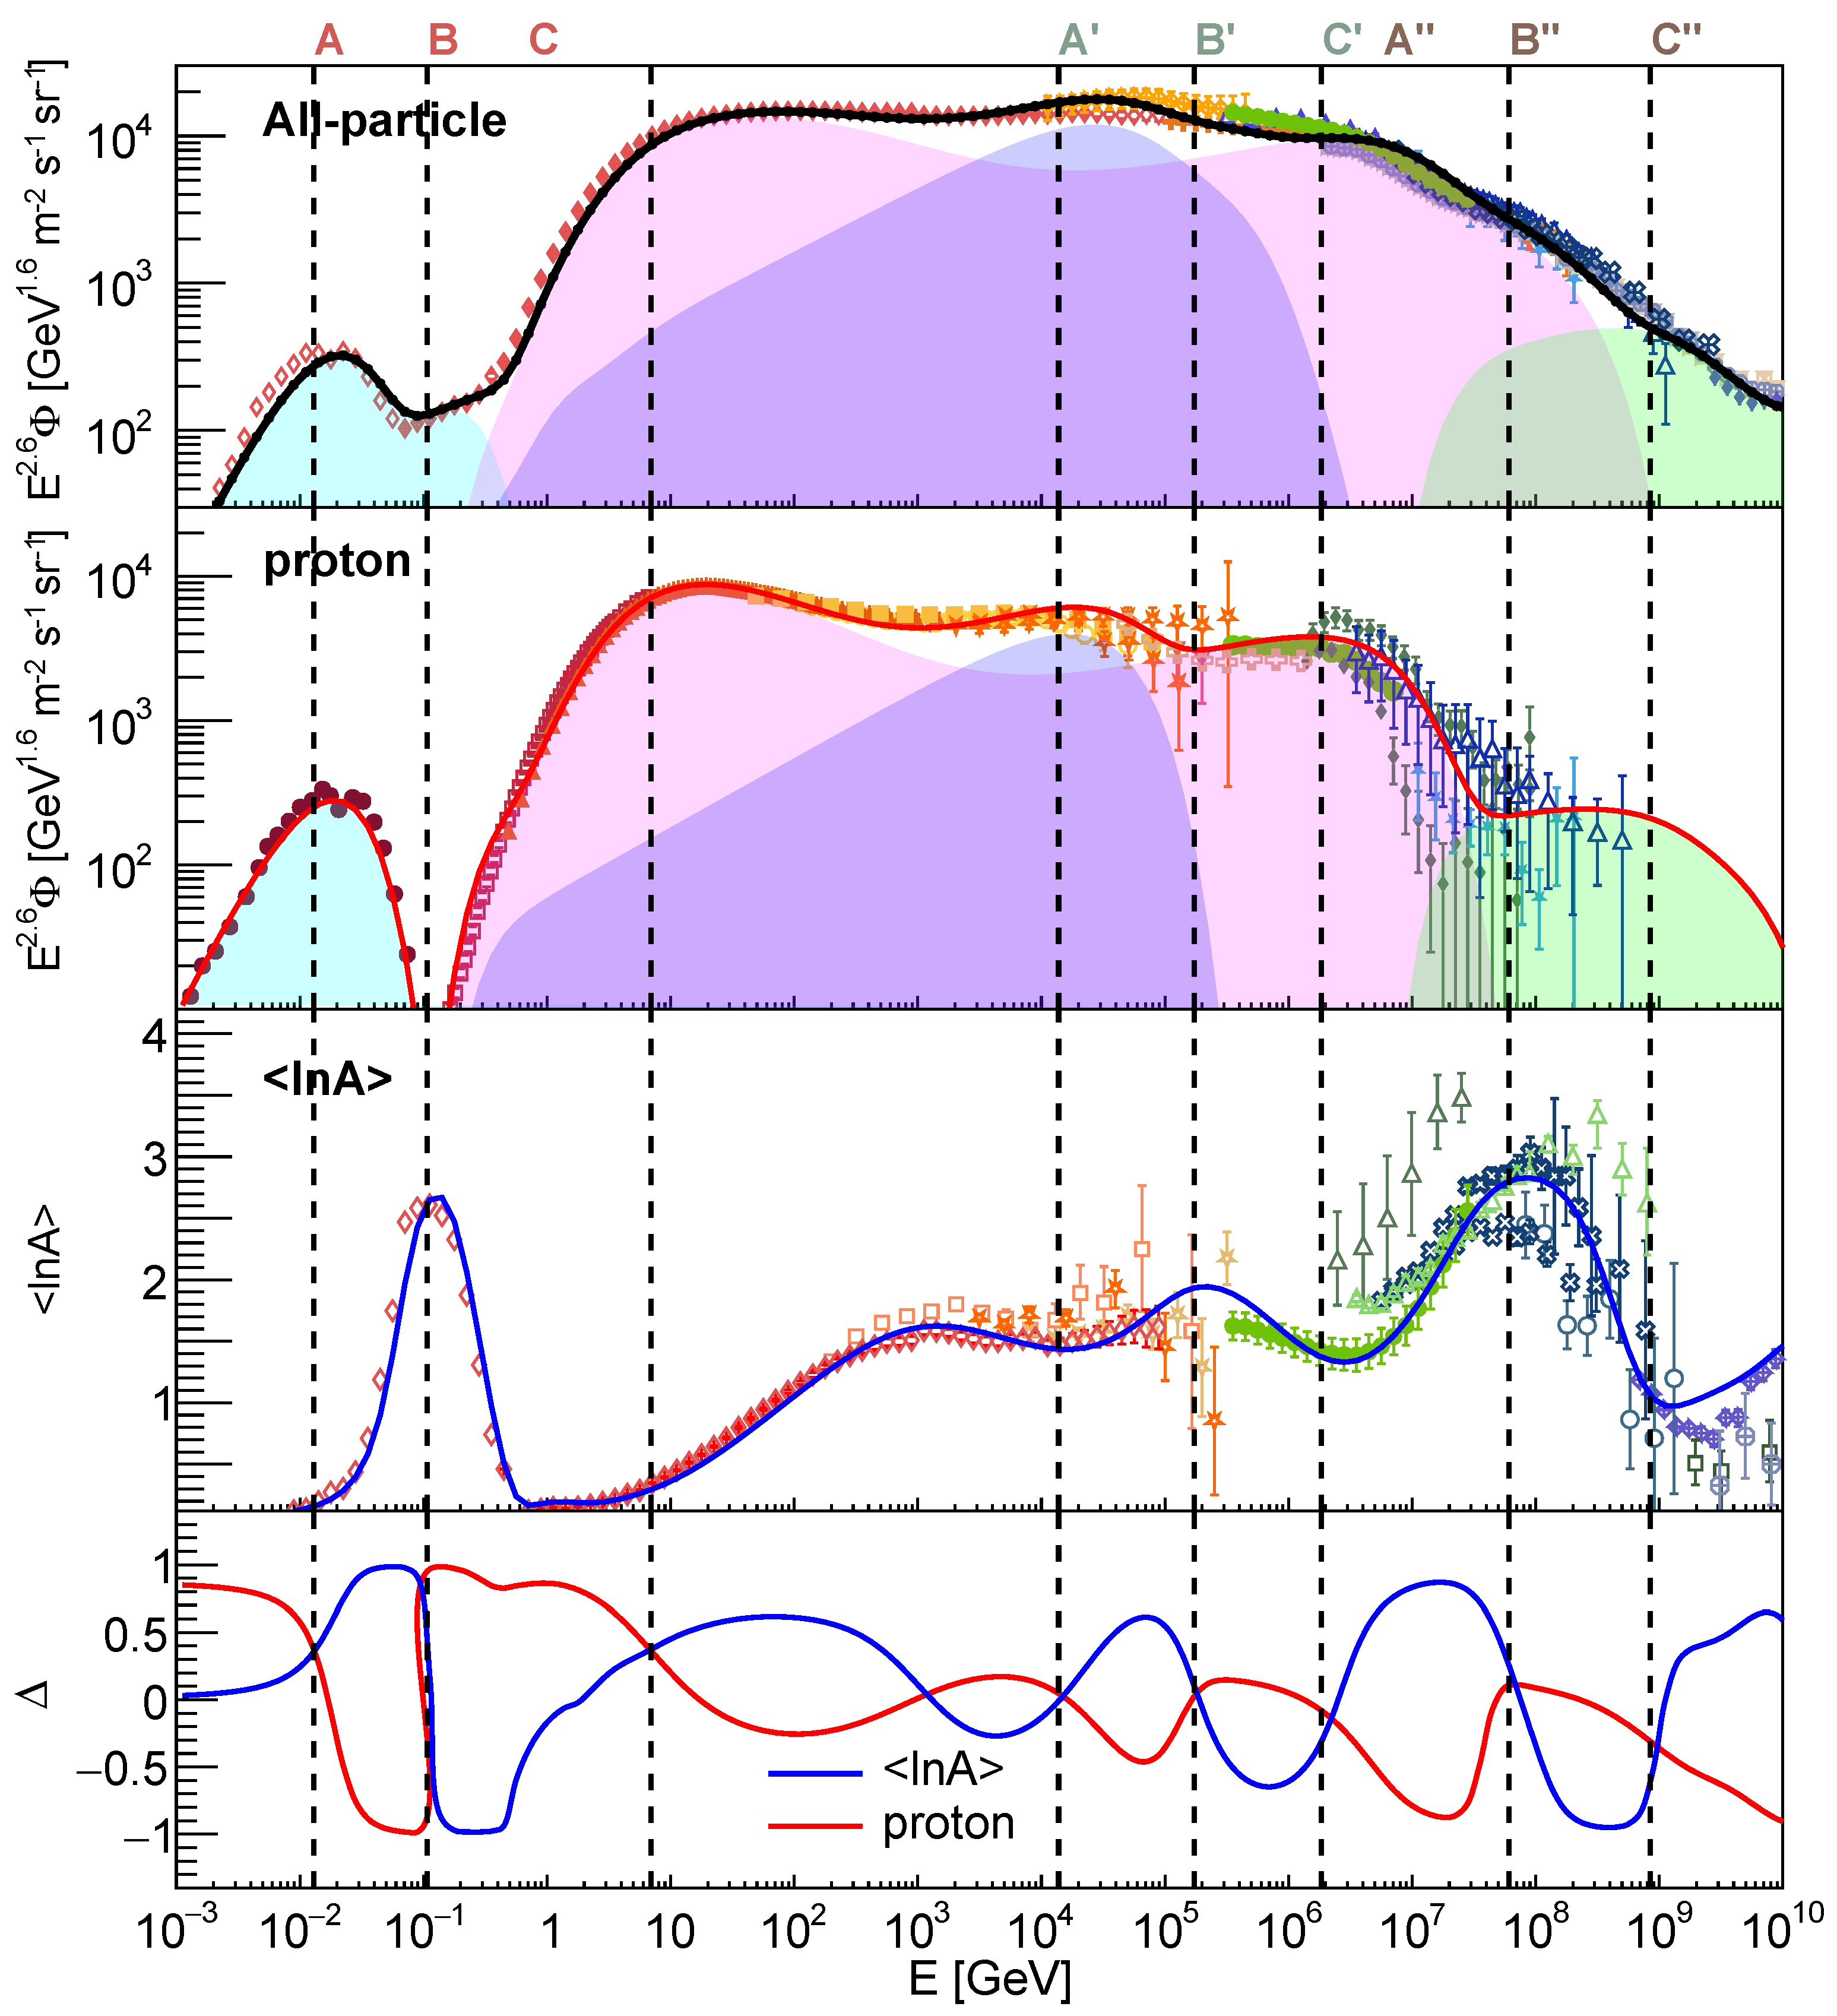
From top to bottom, Figure 4 presents the all-particle and proton spectra, l n A distribution, and the Δ of protons and l n A , across energies from MeV to 10 EeV. From the flux of the all-particle spectrum and protons in the first and second panels, it can be seen that the function described the flux comparison with the observed spectrum from the experiments well, demonstrating that the multi-segment function aligns well with the experiment data. In both spectral plots, distinct colored shaded areas are utilized to delineate the entire energy spectrum structure. As previously mentioned, the CRs within the solar system are accurately represented by a truncated power law spectrum, illustrated by the blue shaded area in the plot. The pink shaded area signifies the background spectrum of CRs within the galaxy, while the purple shaded area represents the contribution from nearby sources. Additionally, the green shaded area corresponds to the contribution from extra-galactic flux.
The third panel presents l n A with energy, calculated using Equation (4), and includes observations from ground-based detectors, including the latest data release from LHAASO [17]. It can be seen that two peaks arise at around 0.1 GeV and 60 PeV, which indicate where the proton ratio is highest in the solar system and within the Milky Way, and that one shallow peak presents near 200 TeV, which suggest the location of nearby source contributions. The features in the l n A distribution provide more evidence than the information in the spectral plot.
To quantitatively illustrate the variability of spectra and l n A with energy, the changes in the spectra and l n A distributions are presented at the bottom of Figure 4. The intersections of the Δ distributions of proton spectra and l n A are labeled and drawn with vertical lines across the entire figure. A joint analysis of the intersections, spectral distribution, and the l n A could provide a better understanding.
It is evident that three cross-points effectively describe a transition from the solar system to the galactic system, labeled A–B–C. The proton ratio is highest at point A within the solar system. This is evident from the energy spectrum and l n A distribution, where point A represents the peak flux in the energy spectrum and is located at the base of the peak in the l n A distribution. Point B, on the other hand, represents the opposite of point A, where the solar proton proportion decreases to the lowest point and l n A reaches the peak. From A to B, the flux of SEP is successively truncated from hydrogen to iron. From B to C, the CR flux from the galaxy begins to increase, resulting in a transition of l n A from being dominated by heavy nuclei to being dominated by light nuclei, where point C has the local maximum proton ratio. This transition occurred from the solar system to the galactic system, where the mass components and spectra are clearly known.
It is worth noting that two other similar transitions occur at the A′–B′–C′ and A″–B″–C″ regions. The A′–B′–C′ region indicates a relatively gradual process of l n A transitioning from light to heavy and then back to light, suggesting that nearby source(s) in the galaxy start to contribute at around several tens of TeV, the nearby iron reaches its peak at around 200 TeV, and the galactic proton flux cuts off at about 2 PeV. The A″–B″–C″ region likely marks the transition from the galactic to the extra-galactic at around 60 PeV, also implying that the dominant flux contributions are from nearby galaxies at energies around 0.8 EV and above.

4. Conclusions

Understanding the precise location of the GCR-EGCR transition is crucial for unraveling the origins of CRs. In this study, we employed several basic power law functions to characterize the observed elemental flux. Using characteristic nucleus spectra with a five-segment cutoff power law function, we derived the total all-particle flux, which closely mirrored observational all-particle spectra. Additionally, we analyzed the mass distribution across MeV to 10 EeV, which aligned with the observations.
While SCRs have been extensively studied and serve as a valuable benchmark, they also provide a basis for exploring the less understood GCR-EGCR transition. To pinpoint the transition locations more accurately, we introduced a variable Δ to capture and amplify changes in the spectrum and mass components alongside energy. Building on our comprehension of the SCR-GCR transition at lower energies, we directed our focus towards the high-energy GCR-EGCR transition. The Δ distribution for these transitions displayed similar structures, with the presence of local transitions highlighting the efficacy of utilizing the Δ distribution to validate these transition points. Therefore, by leveraging this similarity, we were able to determine the specific locations of GCR-EGCR transitions based on Δ .
To be specific, we performed a comprehensive analysis of cosmic ray energy spectra and mass composition across a broad energy range from MeV to 10 EeV. We identified three critical points where intersections of the energy spectrum and l n A with Δ could signify a system transition. Through this work, we found that the distribution of mass composition, l n A , exhibits clearer trends compared to the energy spectrum. Each transition presents a peak in the l n A ; thus, we expect a peak in the l n A value near 200 TeV, likely resulting from contributions of nearby sources. Furthermore, the intersections A″ (with a minimum l n A ) represent the galactic proton knee location at 2 PeV, while the intersections B″ (with a peak l n A value) indicate the iron reaching its peak, where the transition occurs from galactic to extra-galactic at ∼60 PeV, with extra-galactic particles taking precedence over galactic ones at energies surpassing 0.8 EeV. This result aligns closely with previous studies [15] that concluded that the second knee (0.1–0.5 EeV) marks the transition between GCRs and EGCRs, while also challenging models that suggest a transition at ankle energy.

5. Discussion

Previous research has predominantly centered on the knee-to-ankle observational region, often relying on specific models. In this paper, we suggest isomg instead the similarity between transitions of SCR-GCR and GCR-EGCR to derive and locate the GCR-EGCR transition. The analysis is model-independent, and based on several key assumptions outlined in the Methodology section. First and most importantly, similarity is a prerequisite foundation. We briefly indicated in the previous sections that the similarities in aspects such as shock acceleration, energy conversion rates, power law forms, and the knee structure of energy spectra suggest that these two transitions share similarities. If this similarity turns out to be absent, the foundation of this paper would be undermined. Thus, to reproduce the observed energy spectra, we assume there are three source components within the Milky Way and two populations in the extra-galactic case; future identification of specific sources and their populations would provide a clearer basis for the current categorization of sources.
Additionally, the current functional description may not be optimal as, strictly speaking, the analytical expression describing the spectrum process is not a complete parameter-free fitting process. This is mainly because there are currently many parameters, and the fitting process depends on the initial values of the parameters and may not necessarily yield a unique solution. Another vital factor that contributes to this is the current observations. As readers can also see in Figure 2, there are currently no experimental observational fluxes for medium-weight isotopes at energies above several tens of TeV. For the observed nucleon spectra, the results obtained from different experiments have significant errors.
In any case, precise and uncontroversial experimental observations are the most effective tools. Measuring the elemental component spectra from 0.1 PeV to several PeV or observing mass composition from tens of TeV to several PeV will be crucial for validating or refuting our proposed calculation for the second transition, which we suggest is attributable to local source contributions. This might count on LHAASO, the extension of IceTop [57], or future HERD [58] observations. Furthermore, increasing the statistical data from high-resolution UHECR measurements provided by the Pierre Auger Observatory, Telescope Array, and other experiments will be essential for reaching a consensus on the transition from GCRs to EGCRs.
Finally, from a technical standpoint, the current results have been manually fitted and qualitatively assessed. There is potential to employ more advanced simultaneous fitting methods, such as Markov Chain Monte Carlo, to achieve finer fitting values and gain access to fitting uncertainties. Nevertheless, if the previous assumptions and results hold true, while these refined fitting approaches may not fundamentally change our conclusions, they could result in adjustments to the specific transition energy to some extent.

Author Contributions

Conceptualization, Y.G. and Y.Y.; methodology, Y.G.; software, Y.Y.; validation, Y.Y., Y.G. and W.L.; formal analysis, Y.Y.; investigation, Y.Y.; resources, Y.Y.; data curation, Y.Y.; writing—original draft preparation, Y.Y., Y.G. and W.L.; writing—review and editing, Y.Y. and Y.G.; visualization, Y.Y.; supervision, Y.G.; project administration, Y.G.; funding acquisition, Y.Y., Y.G. and W.L. All authors have read and agreed to the published version of the manuscript.

Funding

This work was supported by the National Natural Science Foundation of China (Nos. 12405124, 12275279, U2031110).

Data Availability Statement

The experimental data used in this article are all from papers published by various experiments in official scientific journals. We have not created a dedicated dataset link yet. If anyone requires the relevant data, please contact the following email addresses: yyao255@wisc.edu; guoyq@ihep.ac.cn.

Conflicts of Interest

The authors declare no conflicts of interest. The funders had no role in the design of the study; in the collection, analyses, or interpretation of data; in the writing of the manuscript; or in the decision to publish the results.

Appendix A. Fitting Results

The results of the functional description of the elemental species spectrum and all-particle spectra are illustrated in Figure A1 and Figure A2.
Figure A1. Proton spectrum from MeV to EeV, fitted with multi-segment function and compared with experimental data from experiments [26,27,34,35,37,38,41,42,45,46,59,60].
Universe 11 00096 g0a1
Figure A2. Sum flux of individual species, compared with all-particle spectrum data from experiments [39,40]. Magenta pentagrams represent total-error-weighted average observational spectra of key species, with data from AMS-02 [41,50], DAMPE experiments [26,28], and CREAM [61]. All-particle spectra data for comparison are from Tibet-III [33], HAWC [34], LHAASO [17], Tunka-133 [40], Auger [39], TALE [36], KASCADE [37], IceTop [35], and KASCADE-Grande [38]. Solid lines in different colors represent each nuclei spectrum.
Universe 11 00096 g0a2

References

  1. Owen, E.R.; Wu, K.; Inoue, Y.; Yang, H.Y.K.; Mitchell, A.M.W. Cosmic Ray Processes in Galactic Ecosystems. Galaxies 2023, 11, 86. [Google Scholar] [CrossRef]
  2. Cao, Z.; Aharonian, F.A.; An, Q.; Axikegu, L.X.B.; Bai, Y.X.; Bao, Y.W.; Bastieri, D.; Bi, X.J.; Bi, Y.J.; Cai, H.; et al. Ultrahigh-energy photons up to 1.4 petaelectronvolts from 12 γ-ray Galactic sources. Nature 2021, 594, 33–36. [Google Scholar] [CrossRef]
  3. Cao, Z. et al. [Lhaaso Collaboration] An ultrahigh-energy γ-ray bubble powered by a super PeVatron. Sci. Bull. 2024, 69, 449–457. [Google Scholar] [CrossRef]
  4. Cao, Z.; Aharonian, F.; An, Q.; Axikegu; Bai, Y.X.; Bao, Y.W.; Bastieri, D.; Bi, X.J.; Bi, Y.J.; Cai, J.T.; et al. The First LHAASO Catalog of Gamma-Ray Sources. Astrophys. J. Suppl. Ser. 2024, 271, 25. [Google Scholar] [CrossRef]
  5. Alfaro, R.; Alvarez, C.; Arteaga-Velázquez, J.C.; Avila Rojas, D.; Ayala Solares, H.A.; Babu, R.; Belmont-Moreno, E.; Caballero-Mora, K.S.; Capistrán, T.; Carramiñana, A.; et al. Ultra-high-energy gamma-ray bubble around microquasar V4641 Sgr. Nature 2024, 634, 557–560. [Google Scholar] [CrossRef]
  6. Liu, R. et al. [LHAASO Collaboration] Ultrahigh-Energy Gamma-ray Emission Associated with Black Hole-Jet Systems. arXiv 2024, arXiv:2410.08988. [Google Scholar] [CrossRef]
  7. Aharonian, F.; Bykov, A.; Parizot, E.; Ptuskin, V.; Watson, A. Cosmic Rays in Galactic and Extragalactic Magnetic Fields. Space Sci. Rev. 2012, 166, 97–132. [Google Scholar] [CrossRef]
  8. Aloisio, R.; Berezinsky, V.; Blasi, P.; Ostapchenko, S. Signatures of the transition from galactic to extragalactic cosmic rays. Phys. Rev. D—Part. Fields Gravit. Cosmol. 2008, 77, 025007. [Google Scholar] [CrossRef]
  9. Giacinti, G.; Kachelrieß, M.; Semikoz, D.V.; Sigl, G. Cosmic ray anisotropy as signature for the transition from galactic to extragalactic cosmic rays. J. Cosmol. Astropart. Phys. 2012, 2012, 031. [Google Scholar] [CrossRef]
  10. Aloisio, R.; Berezinsky, V.; Gazizov, A. Transition from galactic to extragalactic cosmic rays. Astropart. Phys. 2012, 39, 129–143. [Google Scholar] [CrossRef]
  11. Berezinsky, V.; Gazizov, A.Z.; Grigorieva, S.I. Dip in UHECR spectrum as signature of proton interaction with CMB [rapid communication]. Phys. Lett. B 2005, 612, 147–153. [Google Scholar] [CrossRef]
  12. Berezinsky, V.; Gazizov, A.; Grigorieva, S. On astrophysical solution to ultrahigh energy cosmic rays. Phys. Rev.—Part Fields Gravit. Cosmol. 2006, 74, 043005. [Google Scholar] [CrossRef]
  13. Deligny, O. Cosmic rays around 1018 eV: Implications of contemporary measurements on the origin of the ankle feature. C. R. Phys. 2014, 15, 367–375. [Google Scholar] [CrossRef]
  14. Aloisio, R.; Berezinsky, V.; Blasi, P.; Gazizov, A.; Grigorieva, S.; Hnatyk, B. A dip in the UHECR spectrum and the transition from galactic to extragalactic cosmic rays. Astropart. Phys. 2007, 27, 76–91. [Google Scholar] [CrossRef]
  15. Kachelrieß, M.; Semikoz, D.V. Cosmic ray models. Prog. Part. Nucl. Phys. 2019, 109, 103710. [Google Scholar] [CrossRef]
  16. Cristofari, P. The transition from Galactic to extragalactic cosmic rays: The high-energy end of the Galactic spectrum. Eur. Phys. J. Web Conf. 2023, 283, 04002. [Google Scholar] [CrossRef]
  17. Cao, Z.; Aharonian, F.; Axikegu; Bai, Y.X.; Bao, Y.W.; Bastieri, D.; Bi, X.J.; Bi, Y.J.; Bian, W.; Bukevich,, A.V.; et al. Measurements of All-Particle Energy Spectrum and Mean Logarithmic Mass of Cosmic Rays from 0.3 to 30 PeV with LHAASO-KM2A. Phys. Rev. Lett. 2024, 132, 131002. [Google Scholar] [CrossRef]
  18. Giacalone, J.; Fahr, H.; Fichtner, H.; Florinski, V.; Heber, B.; Hill, M.E.; Kóta, J.; Leske, R.A.; Potgieter, M.S.; Rankin, J.S. Anomalous Cosmic Rays and Heliospheric Energetic Particles. Space Sci. Rev. 2022, 218, 22. [Google Scholar] [CrossRef]
  19. Ptuskin, V.S. Propagation, Confinement Models, and Large-Scale Dynamical Effects of Galactic Cosmic Rays. In The Astrophysics of Galactic Cosmic Rays; Diehl, R., Parizot, E., Kallenbach, R., Von Steiger, R., Eds.; Springer: Berlin/Heidelberg, Germany, 2001; Volume 13, pp. 281–293. [Google Scholar] [CrossRef]
  20. Lipari, P.; Vernetto, S. The shape of the cosmic ray proton spectrum. Astropart. Phys. 2020, 120, 102441. [Google Scholar] [CrossRef]
  21. von Rosenvinge, T.; Cane, H.V. Solar Energetic Particles: An Overview. Geophys. Monogr. Ser. 2006, 165, 103–114. [Google Scholar] [CrossRef]
  22. Mewaldt, R.; Cohen, C.; Mason, G.; Desai, M.; Labrador, A.; Lee, M.; Li, G. Solar Energetic Particle Spectral Breaks. In Proceedings of the AGU Spring Meeting Abstracts, San Francisco, CA, USA, 15–19 December 2008; Volume 2008, p. SH41A-10. [Google Scholar]
  23. Mewaldt, R.A. Solar Energetic Particle Composition, Energy Spectra, and Space Weather. In Solar Dynamics and Its Effects on the Heliosphere and Earth; Series: Space Sciences Series of ISSI; Baker, D.N., Klecker, B., Schwartz, S.J., Schwenn, R., von Steiger, R., Eds.; Springer: Berlin/Heidelberg, Germany, 2007; Volume 22, pp. 303–316. [Google Scholar] [CrossRef]
  24. Peron, G.; Casanova, S.; Gabici, S.; Baghmanyan, V.; Aharonian, F. The contribution of winds from star clusters to the Galactic cosmic-ray population. Nat. Astron. 2024, 8, 530–537. [Google Scholar] [CrossRef]
  25. Corti, C.; Bindi, V.; Consolandi, C.; Whitman, K. Solar Modulation of the Local Interstellar Spectrum with Voyager 1, AMS-02, PAMELA, and BESS. Astrophys. J. 2016, 829, 8. [Google Scholar] [CrossRef]
  26. An, Q.; Asfandiyarov, R.; Azzarello, P.; Bernardini, P.; Bi, X.J.; Cai, M.S.; Chang, J.; Chen, D.Y.; Chen, H.F.; Chen, J.L.; et al. Measurement of the cosmic ray proton spectrum from 40 GeV to 100 TeV with the DAMPE satellite. Sci. Adv. 2019, 5, eaax3793. [Google Scholar] [CrossRef]
  27. Adriani, O.; Akaike, Y.; Asano, K.; Asaoka, Y.; Berti, E.; Bigongiari, G.; Binns, W.R.; Bongi, M.; Brogi, P.; Bruno, A.; et al. Observation of Spectral Structures in the Flux of Cosmic-Ray Protons from 50 GeV to 60 TeV with the Calorimetric Electron Telescope on the International Space Station. Phys. Rev. Lett. 2022, 129, 101102. [Google Scholar] [CrossRef]
  28. Alemanno, F.; An, Q.; Azzarello, P.; Barbato, F.C.T.; Bernardini, P.; Bi, X.J.; Cai, M.S.; Catanzani, E.; Chang, J.; Chen, D.Y.; et al. Measurement of the Cosmic Ray Helium Energy Spectrum from 70 GeV to 80 TeV with the DAMPE Space Mission. Phys. Rev. Lett. 2021, 126, 201102. [Google Scholar] [CrossRef]
  29. Qiao, B.Q.; Guo, Y.Q.; Liu, W.; Bi, X.J. Nearby SNR: A Possible Common Origin of Multi-messenger Anomalies in the Spectra, Ratios, and Anisotropy of Cosmic Rays. Astrophys. J. 2023, 956, 75. [Google Scholar] [CrossRef]
  30. Mollerach, S.; Roulet, E. Extragalactic cosmic rays diffusing from two populations of sources. Phys. Rev. D 2020, 101, 103024. [Google Scholar] [CrossRef]
  31. Das, S.; Razzaque, S.; Gupta, N. Modeling the spectrum and composition of ultrahigh-energy cosmic rays with two populations of extragalactic sources. Eur. Phys. J. C 2021, 81, 59. [Google Scholar] [CrossRef]
  32. Blandford, R.; Eichler, D. Particle acceleration at astrophysical shocks: A theory of cosmic ray origin. Phys. Rep. 1987, 154, 1–75. [Google Scholar] [CrossRef]
  33. Amenomori, M.; Bi, X.J.; Chen, D.; Cui, S.W.; Danzengluobu; Ding, L.K.; Ding, X.H.; Fan, C.; Feng, C.F.; Feng, Z.; et al. The All-Particle Spectrum of Primary Cosmic Rays in the Wide Energy Range from 1014 to 1017 eV Observed with the Tibet-III Air-Shower Array. Astrophys. J. 2008, 678, 1165–1179. [Google Scholar] [CrossRef]
  34. Alfaro, R.; Alvarez, C.; Álvarez, J.D.; Arceo, R.; Arteaga-Velázquez, J.C.; Avila Rojas, D.; Ayala Solares, H.A.; Barber, A.S.; Becerril, A.; Belmont-Moreno, E.; et al. All-particle cosmic ray energy spectrum measured by the HAWC experiment from 10 to 500 TeV. Phys. Rev. D 2017, 96, 122001. [Google Scholar] [CrossRef]
  35. Aartsen, M.G.; Abbasi, R.; Ackermann, M.; Adams, J.; Aguilar, J.A.; Ahlers, M.; Ahrens, M.; Alispach, C.; Amin, N.M.; Andeen, K.; et al. Cosmic ray spectrum from 250 TeV to 10 PeV using IceTop. Phys. Rev. D 2020, 102, 122001. [Google Scholar] [CrossRef]
  36. Abbasi, R.U.; Abe, M.; Abu-Zayyad, T.; Allen, M.; Azuma, R.; Barcikowski, E.; Belz, J.W.; Bergman, D.R.; Blake, S.A.; Cady, R.; et al. The Cosmic Ray Energy Spectrum between 2 PeV and 2 EeV Observed with the TALE Detector in Monocular Mode. Astrophys. J. 2018, 865, 74. [Google Scholar] [CrossRef]
  37. Antoni, T.; Apel, W.D.; Badea, A.F.; Bekk, K.; Bercuci, A.; Blümer, J.; Bozdog, H.; Brancus, I.M.; Chilingarian, A.; Daumiller, K.; et al. KASCADE measurements of energy spectra for elemental groups of cosmic rays: Results and open problems. Astropart. Phys. 2005, 24, 1–25. [Google Scholar] [CrossRef]
  38. Apel, W.D.; Arteaga-Velázquez, J.C.; Bekk, K.; Bertaina, M.; Blümer, J.; Bozdog, H.; Brancus, I.M.; Cantoni, E.; Chiavassa, A.; Cossavella, F.; et al. KASCADE-Grande measurements of energy spectra for elemental groups of cosmic rays. Astropart. Phys. 2013, 47, 54–66. [Google Scholar] [CrossRef]
  39. Aab, A.; Abreu, P.; Aglietta, M.; Albury, J.M.; Allekotte, I.; Almela, A.; Alvarez Castillo, J.; Alvarez-Muñiz, J.; Alves Batista, R.; Anastasi, G.A.; et al. Measurement of the cosmic-ray energy spectrum above 2.5 × 10 18 eV using the Pierre Auger Observatory. Phys. Rev. D 2020, 102, 062005. [Google Scholar] [CrossRef]
  40. Budnev, N.M.; Chiavassa, A.; Gress, O.A.; Gress, T.I.; Dyachok, A.N.; Karpov, N.I.; Kalmykov, N.N.; Korosteleva, E.E.; Kozhin, V.A.; Kuzmichev, L.A.; et al. The primary cosmic-ray energy spectrum measured with the Tunka-133 array. Astropart. Phys. 2020, 117, 102406. [Google Scholar] [CrossRef]
  41. Aguilar, M.; Ali Cavasonza, L.; Ambrosi, G.; Arruda, L.; Attig, N.; Barao, F.; Barrin, L.; Bartoloni, A.; Başeğmez-du Pree, S.; Bates, J.; et al. The Alpha Magnetic Spectrometer (AMS) on the international space station: Part II—Results from the first seven years. Phys. Rep. 2021, 894, 1–116. [Google Scholar] [CrossRef]
  42. Yoon, Y.S.; Anderson, T.; Barrau, A.; Conklin, N.B.; Coutu, S.; Derome, L.; Han, J.H.; Jeon, J.A.; Kim, K.C.; Kim, M.H.; et al. Proton and Helium Spectra from the CREAM-III Flight. Astrophys. J. 2017, 839, 5. [Google Scholar] [CrossRef]
  43. Adriani, O.; Barbarino, G.C.; Bazilevskaya, G.A.; Bellotti, R.; Boezio, M.; Bogomolov, E.A.; Bonechi, L.; Bongi, M.; Bonvicini, V.; Borisov, S.; et al. PAMELA Measurements of Cosmic-Ray Proton and Helium Spectra. Science 2011, 332, 69. [Google Scholar] [CrossRef]
  44. Varsi, F.; Ahmad, S.; Chakraborty, M.; Chandra, A.; Dugad, S.R.; Goswami, U.D.; Gupta, S.K.; Hariharan, B.; Hayashi, Y.; Jagadeesan, P.; et al. Evidence of a Hardening in the Cosmic Ray Proton Spectrum at around 166 TeV Observed by the GRAPES-3 Experiment. Phys. Rev. Lett. 2024, 132, 051002. [Google Scholar] [CrossRef] [PubMed]
  45. Grebenyuk, V.; Karmanov, D.; Kovalev, I.; Kudryashov, I.; Kurganov, A.; Panov, A.; Podorozhny, D.; Tkachenko, A.; Tkachev, L.; Turundaevskiy, A.; et al. Energy spectra of abundant cosmic-ray nuclei in the NUCLEON experiment. Adv. Space Res. 2019, 64, 2546–2558. [Google Scholar] [CrossRef]
  46. Aartsen, M.G.; Ackermann, M.; Adams, J.; Aguilar, J.A.; Ahlers, M.; Ahrens, M.; Alispach, C.; Andeen, K.; Anderson, T.; Ansseau, I.; et al. Cosmic ray spectrum and composition from PeV to EeV using 3 years of data from IceTop and IceCube. Phys. Rev. D 2019, 100, 082002. [Google Scholar] [CrossRef]
  47. Kuznetsov, M.Y.; Petrov, N.A.; Plokhikh, I.A.; Sotnikov, V.V. Energy spectra of elemental groups of cosmic rays with the KASCADE experiment data and machine learning. J. Cosmol. Astropart. Phys. 2024, 2024, 125. [Google Scholar] [CrossRef]
  48. Ahn, H.S.; Allison, P.; Bagliesi, M.G.; Barbier, L.; Beatty, J.J.; Bigongiari, G.; Brandt, T.J.; Childers, J.T.; Conklin, N.B.; Coutu, S.; et al. Energy Spectra of Cosmic-ray Nuclei at High Energies. Astrophys. J. 2009, 707, 593–603. [Google Scholar] [CrossRef]
  49. Aguilar, M.; Ali Cavasonza, L.; Ambrosi, G.; Arruda, L.; Attig, N.; Barao, F.; Barrin, L.; Bartoloni, A.; Başeǧmez-du Pree, S.; Battiston, R.; et al. Properties of Neon, Magnesium, and Silicon Primary Cosmic Rays Results from the Alpha Magnetic Spectrometer. Phys. Rev. Lett. 2020, 124, 211102. [Google Scholar] [CrossRef]
  50. Aguilar, M.; Cavasonza, L.A.; Allen, M.S.; Alpat, B.; Ambrosi, G.; Arruda, L.; Attig, N.; Barao, F.; Barrin, L.; Bartoloni, A.; et al. Properties of Iron Primary Cosmic Rays: Results from the Alpha Magnetic Spectrometer. Phys. Rev. Lett. 2021, 126, 041104. [Google Scholar] [CrossRef]
  51. Qiao, B.Q.; Liu, W.; Guo, Y.Q.; Yuan, Q. Anisotropies of different mass compositions of cosmic rays. J. Cosmol. Astropart. Phys. 2019, 2019, 007. [Google Scholar] [CrossRef]
  52. Zhao, B.; Liu, W.; Yuan, Q.; Hu, H.B.; Bi, X.J.; Wu, H.R.; Zhou, X.X.; Guo, Y.Q. Geminga SNR: Possible Candidate of the Local Cosmic-Ray Factory. Astrophys. J. 2022, 926, 41. [Google Scholar] [CrossRef]
  53. Panov, A.D.; Adams, J.H.; Ahn, H.S.; Bashinzhagyan, G.L.; Watts, J.W.; Wefel, J.P.; Wu, J.; Ganel, O.; Guzik, T.G.; Zatsepin, V.I.; et al. Energy spectra of abundant nuclei of primary cosmic rays from the data of ATIC-2 experiment: Final results. Bull. Russ. Acad. Sci. Phys. 2009, 73, 564–567. [Google Scholar] [CrossRef]
  54. Fitoussi, T. et al. [Pierre Auger Collaboration] Depth of Maximum of Air-Shower Profiles above 1017.8 eV Measured with the Fluorescence Detector of the Pierre Auger Observatory and Mass Composition Implications. In Proceedings of the 38th International Cosmic Ray Conference (ICRC2023)—Outreach & Education (O&E), Nagoya, Japan, 26 July–3 August 2023; p. 319. [Google Scholar] [CrossRef]
  55. Abu-Zayyad, T.; Belov, K.; Bird, D.J.; Boyer, J.; Cao, Z.; Catanese, M.; Chen, G.F.; Clay, R.W.; Covault, C.E.; Dai, H.Y.; et al. A measurement of the average longitudinal development profile of cosmic ray air showers between 10 17 and 10 18 eV. Astropart. Phys. 2001, 16, 1–11. [Google Scholar] [CrossRef]
  56. Berezhnev, S.F.; Besson, D.; Budnev, N.M.; Chiavassa, A.; Chvalaev, O.A.; Gress, O.A.; Dyachok, A.N.; Epimakhov, S.N.; Haungs, A.; Karpov, N.I.; et al. The Tunka-133 EAS Cherenkov light array: Status of 2011. Nucl. Instrum. Methods Phys. Res. A 2012, 692, 98–105. [Google Scholar] [CrossRef]
  57. Haungs, A. A Scintillator and Radio Enhancement of the IceCube Surface Detector Array. Eur. Phys. J. Web Conf. 2019, 210, 06009. [Google Scholar] [CrossRef]
  58. Cagnoli, I.; Kyratzis, D.; Serini, D. HERD space mission: Probing the Galactic Cosmic Ray frontier. Nucl. Instrum. Methods Phys. Res. A 2024, 1068, 169788. [Google Scholar] [CrossRef]
  59. Bartoli, B.; Bernardini, P.; Bi, X.J.; Cao, Z.; Catalanotti, S.; Chen, S.Z.; Chen, T.L.; Cui, S.W.; Dai, B.Z.; D’Amone, A.; et al. Cosmic ray proton plus helium energy spectrum measured by the ARGO-YBJ experiment in the energy range 3–300 TeV. Phys. Rev. D 2015, 91, 112017. [Google Scholar] [CrossRef]
  60. Adriani, O.; Barbarino, G.C.; Bazilevskaya, G.A.; Bellotti, R.; Boezio, M.; Bogomolov, E.A.; Bongi, M.; Bonvicini, V.; Borisov, S.; Bottai, S.; et al. Time Dependence of the Proton Flux Measured by PAMELA during the 2006 July–2009 December Solar Minimum. Astrophys. J. 2013, 765, 91. [Google Scholar] [CrossRef]
  61. Yoon, Y.S.; Ahn, H.S.; Allison, P.S.; Bagliesi, M.G.; Beatty, J.J.; Bigongiari, G.; Boyle, P.J.; Childers, J.T.; Conklin, N.B.; Coutu, S.; et al. Cosmic-ray Proton and Helium Spectra from the First CREAM Flight. Astrophys. J. 2011, 728, 122. [Google Scholar] [CrossRef]
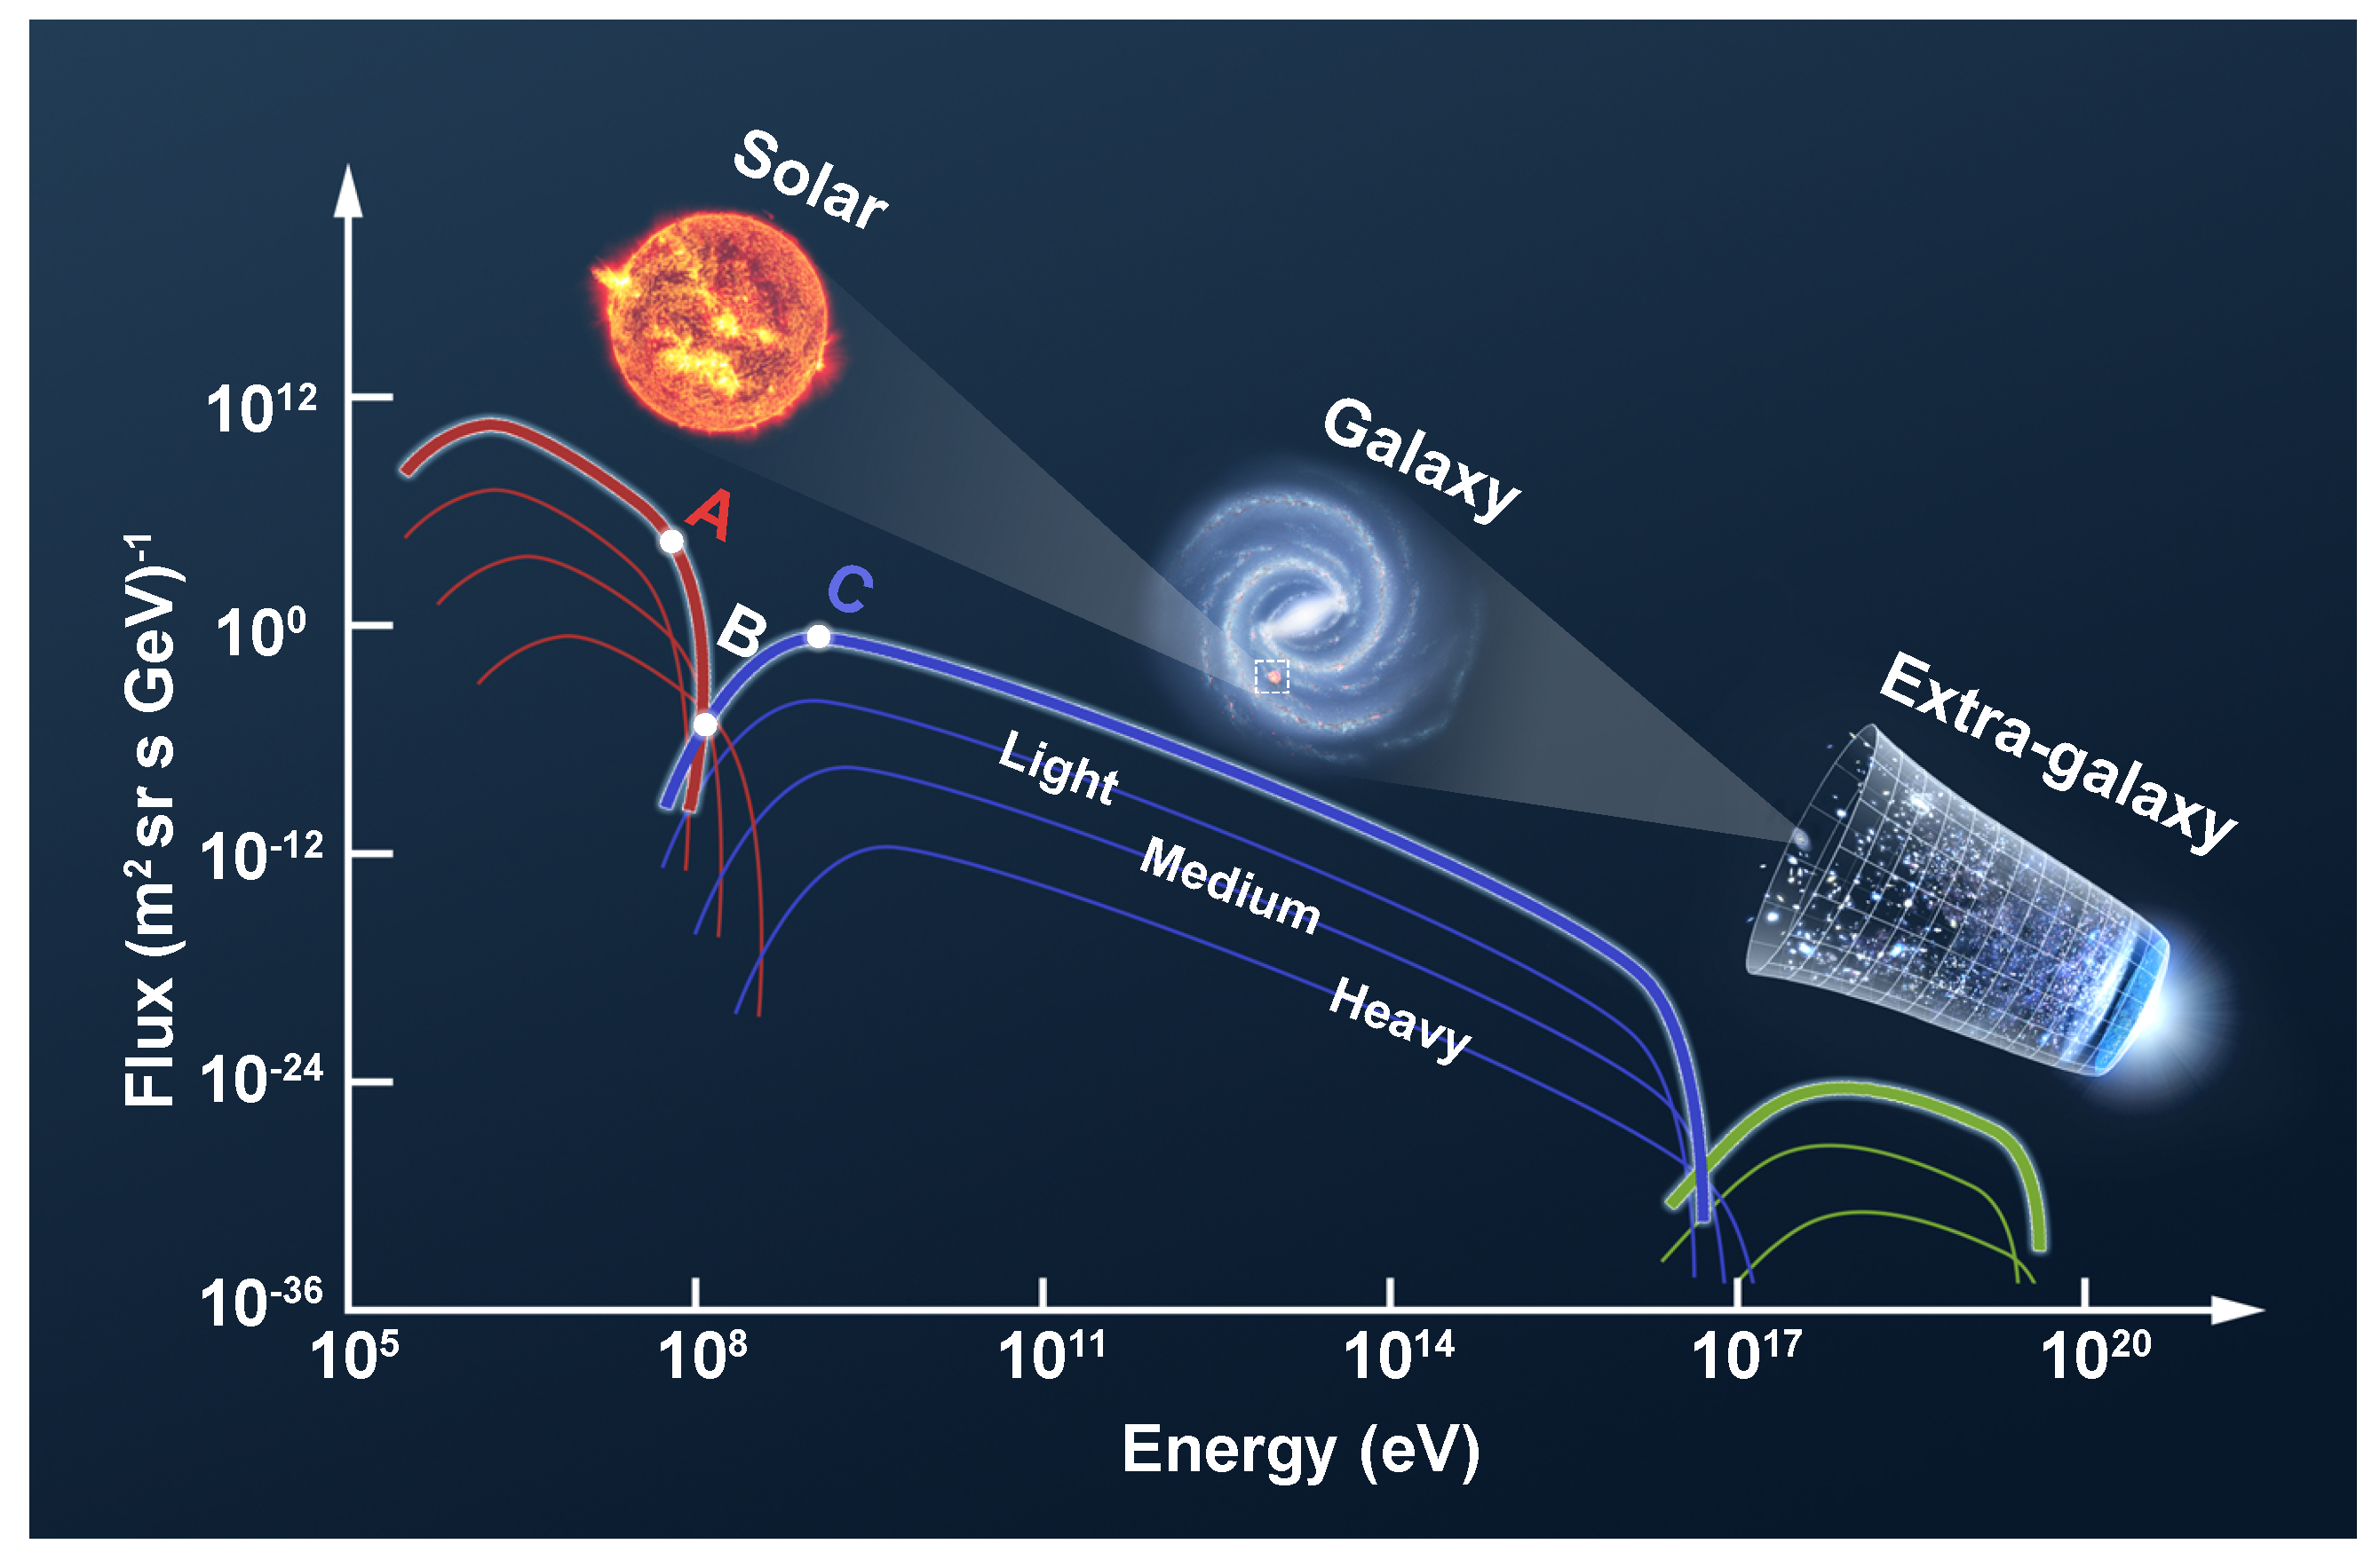
Figure 1. Graphic of spectral features of charged particles from our solar system to the galaxy and extra-galaxy. The included images of the Sun, the Milky Way, and the expansion of the Universe are credited to NASA.
Universe 11 00096 g001
Figure 3. l n A is a good tracer to identify the component transition. The blue solid line is obtained using Equation (4) with multi-segment power law functions of individual elemental flux. The weighted exp represents calculations of observational flux of key species from space-borne experiments. Other points are observational data from ATIC [53], Auger [54], Hires-MIA [55], KASCADE [47], Tunka-133 [56], LHAASO [17], and IceCube [46]. It can be seen that Peak-I and Peak-III exhibit a high degree of similarity.
Universe 11 00096 g003
Figure 4. The intersections of the changes in the proton energy spectrum and the distribution of l n A are presented as gray dashed lines running through four plots, as detailed in the main text. Three intersections (A–B–C, A′–B′–C′, and A″–B″–C″) determine the transitions of the system. Top: All-particle spectrum. The black solid line represents the sum flux of each key species. The parameters and results of individual elements are listed in Table 1 and shown in Figure A2. The light blue shade represents the contribution from SEPs, the pink shade represents the background CRs, the light violet shade comes from nearby sources, and the green shade represents the contribution from extra-galactic sources. The magenta pentagrams represent the total-error-weighted average observational spectra of key species. The data used to calculate the weighted spectra and all-spectra data are also listed in the caption of Figure A2. Second: Proton spectrum. The different components are shown on the left of Figure A1, and experimental data comparisons can also be found there. Third: l n A distribution. Bottom: the Δ distributions of the proton spectrum and l n A . The overall vertical gray dashed lines are determined by their intersections.
Universe 11 00096 g004
Table 1. Spectral parameters of different species.
SCRGCREGCR
Φ 1 γ 1 Φ 0 α 1 δ α 2 Φ 2 γ 2 Φ 3 γ 3 Φ 4 γ 4 Φ 5 γ 5
P 1 × 1.5 6 0.87 3.67 × 10 9 −5.581.573.20602.122052.3832.4202.5
He 2 × 10 5 0.60 4.63 × 10 5 −3.322.203.53952.191002.360.62.30.042.26
C10000.736.64−4.071.903.26152.19202.360.012.30.0022.26
N90110.72−3.901.93.4542.1932.360.0012.3 1 × 10 5 2.26
O 1.8 × 10 4 0.87.54−4.091.913.24252.19252.360.052.30.0032.26
Mg8000.70.27−4.081.913.2562.1952.360.012.3 1 × 10 4 2.26
Si4000.60.048−4.151.913.1882.19152.360.0012.3 1 × 10 4 2.26
Fe101.2512.67−3.53.23.890.720.12.10.012.4 1 × 10 4 2.3
E c = 3.5 × 10 4 Z GeV and 7 × 10 6 Z GeV for galactic and extra-galactic CRs; Z is the charge of each species.
Disclaimer/Publisher’s Note: The statements, opinions and data contained in all publications are solely those of the individual author(s) and contributor(s) and not of MDPI and/or the editor(s). MDPI and/or the editor(s) disclaim responsibility for any injury to people or property resulting from any ideas, methods, instructions or products referred to in the content.