Abstract
We report an extensive and elaborate theoretical study of atomic properties for Pm-like and Eu-like Tungsten using Flexible Atomic Code (FAC). Excitation energies for 304 and 500 fine structure levels are presented respectively, for W11+ and W13+. Properties of the 4f-core-excited states are evaluated. Different sets of configurations are used and the discrepancies in identifications of the ground level are discussed. We evaluate transition wavelength, transition probability, oscillator strength, and collisional excitation cross section for various transitions. Comparisons are made between our calculated values and previously available results, and good agreement has been achieved. We have predicted some new energy levels and transition data where no other experimental or theoretical results are available. The present set of results should be useful in line identification and interpretation of spectra as well as in modelling of fusion plasmas.
PACS:
32.70; Cs oscillator strengths
1. Introduction
There has been strong interest in the spectroscopy of tungsten as it is planned to be used in plasma facing components of future fusion devices, such as International Thermonuclear Experimental Reactor (ITER) due to its favourable physical and chemical properties, e.g., high energy threshold of sputtering, low sputtering yield, low tritium retention, and high melting temperature [1,2]. Since tungsten is a high-Z element (Z = 74), where Z is the atomic number, it will contribute a large fraction of energy carried out from the plasma, which leads to plasma cooling. Atomic data such as energy levels, radiative transition rates, and photoionization cross sections for low-charged and medium-charged ions are of great importance in the ITER plasma diagnostics [3]. In the past few decades, atomic data for several highly charged tungsten ions have been determined using different experimental and theoretical methods [4,5,6,7,8], but still there is demand for more accurate atomic data, especially for low and medium ionization states of tungsten.
In the present work, spectra of moderately charged states of tungsten (W11+ and W13+) are theoretically investigated. Several observations and theoretical calculations have been performed for Pm-like W but, for Eu-like W, only a few experimental data are available in the literature. In fact, only one theoretical energy value can be found for Eu-like W in the Atomic Spectra Database of the National Institute of Standards and Technology (NIST) [9]. These ionized states of tungsten are complex due to an open 4f shell, and obtaining accurate atomic data for these ions is a largely unsolved problem. For example, by inclusion of different configuration sets in the calculations, one will obtain a different ground state. The accuracy of a calculation can be estimated by considering (i) the convergence rate, (ii) the agreement between experimental measurements and theoretical calculations, and (iii) the difference between the velocity and length gauges of oscillator strength. Furthermore, results of calculations depend on the configuration-interaction (CI) effects, and, to ensure good accuracy, the most essential interactions must be included. In the past few years, we have calculated accurate atomic data by taking into account the essential interactions [10,11,12,13,14,15]. Brage and Froese Fischer [16] and Froese Fischer [17] presented a detailed review of analysis and evaluation of the CI effect in different atomic structure codes. In our present work, we have compared our calculated results with the available theoretical and experimental results and found good agreement.
2. Available Atomic Data
2.1. Pm-Like W (W13+)
Promethium-like ions have been studied both experimentally and theoretically over many years. There is still no full understanding of this sequence due to the open 4f shell, and obtaining accurate atomic data for this sequence is a largely unsolved problem. There is contradiction over the ground state for various charged states of Pm-like ions. Reliable atomic data for Pm-like ions are much needed, as some of these ions are promising candidates for the development of future optical clocks [18] and measurement of variation of the fine structure constant [19,20]. Curtis and Ellis [21] by their Hartree-Fock-Pauli (HFP) calculations showed that, in Pm-like W, the ground state is 4f145s 2S1/2 and dominant resonance lines are 5s-5p doublets. Theodosiou and Raftopoulos [22] performed a fully relativistic but single configuration calculation, using the Dirac-Fock approximation, and determined that the ground state of W13+ is odd parity 4f135s2 2F7/2. Hutton et al. [23] identified the transitions 4f145s 2S1/2- 4f145p 2P1/2,3/2 using an electron beam ion trap (EBIT). Vilkas et al. [24] evaluated transition wavelengths and lifetimes in Pm-like ions (including W13+) by taking 4f135s2, 4f135p2, 4f135s5p, 4f125s25p, 4f125s5p2, and 4f125p3 configurations using relativistic multi-reference Møller-Plesset second order perturbation theory (MR-MP). They claim to have accuracy of a predicted wavelength of about 0.25 Å for Pm-like W. Their [24] work targeted the 4f145s 2S1/2- 4f145p 2P1/2,3/2 transitions between excited states.
Kramida and Shirai [25] predicted that the ground state of Pm-like W is 4f135s2 2F7/2 while the first excited state is 4f135s2 2F5/2, which is separated by 18,000 cm−1 from the ground state. Wu and Hutton [26] discussed the behaviour of relative intensities of strong lines at different electron beam energies. Kramida [27] in his review noted the effect on the calculated energies from inclusion of two additional configurations (4f115s25p2 and 4f105s25p3). Safronova et al. [28] calculated excitation energies of some levels in Pm-like ions (including Pm-like W) using relativistic many body perturbation theory (RMBPT), Hebrew university Lawrence Livermore atomic code (HULLAC), and Hartree-Fock relativistic method (Cowan’s code). They confirmed that the ground state is 4f135s2 2F7/2. Qiu et al. [29] studied the visible and soft X-ray spectral regions and concluded that 4f collapse is not complete in W13+. According to them [29], four lines that were identified in the Berlin EBIT spectra [30] do not appear to originate from tungsten. Kobayashi et al. [31] observed extreme ultraviolet and visible spectra of W13+ using EBIT. Zhao et al. [32] observed visible transitions in W13+ using Shanghai high temperature superconducting EBIT. They predicted that, out of eight observed lines, five belong to transitions from 4f125s25p. Recently, Ding et al. [33] calculated wavelengths and transition rates of the 5s-5p transitions of tungsten ions (including W13+) using the relativistic configuration interaction method as implemented in the Flexible Atomic Code (FAC) [34].
2.2. Eu-Like W (W11+)
Ions of the Eu isoelectronic sequence (63 electron systems) are complex systems due to open 5s, 5p, and 4f subshells, but atomic structure calculations for these ions are needed to interpret the observed features. In the past, no extensive calculations for Eu-like W have been carried out. In fact, no spectral lines are available at the NIST website [9] for this particular ion. However, some authors reported selected transition wavelengths. Several studies contradict over the ground state for this ion. Kramida and Shirai [25] predicted that the ground state of Eu-like W is 4f135s25p2 4F7/2, while the first excited state is 4f145s25p 2P1/2 located approximately 11,000 cm−1 above it. They showed that the ground state of this ion is uncertain. Li et al. [30] reported spectra for some transitions in the range of 150–400 Å using the Shanghai high-temperature superconducting electron beam ion trap (SH-HtscEBIT). They have also performed calculations using the fully relativistic FAC using nine configurations, which generated 2538 fine-structure levels. They confirmed that the ground state is 4f135s25p2 4F7/2. Mita et al. [34] observed EUV spectra for multiple charged tungsten ions (including W11+). They have compared experimental measurements with collisional-radiative (CR) model calculations.
3. Theoretical Method
In spite of calculations performed by different authors for Pm-like and Eu-like W, there are no medium-scale calculations for these ions, and the shortage of complete and accurate data for these ions motivates this work. Most past calculations included very limited CI with an arbitrary choice of configurations. Therefore, in the present work, extensive calculations for W11+ and W13+ have been performed within the framework of FAC, which was developed by Gu [35]. FAC is a fully relativistic program used to compute the atomic structure, photoionization cross sections, and other atomic data. It is based on the Dirac-Hartree-Fock-Slater (DHFS) method, which uses perturbation theory. Optimization of orbitals is performed in a self-consistent-field iterative procedure in which the average energy of a fictitious mean configuration is minimized. This mean configuration represents the average electron cloud of the configurations retained in the CI expansion. In FAC, the Hamiltonian and configuration atomic state functions are similar to those of the MCDF (multi-configuration Dirac-Fock) method, including relativistic effects and higher-order QED effects, e.g., the Breit interaction in the zero-energy limit for the exchanged photon, and hydrogenic approximations for self-energy and vacuum polarization effects.
The effective Hamiltonian for an N-electron system is given by:
where is the Dirac one-particle operator for the ith-electron and Vij represents effective electron-electron interactions.
An atomic state function (ASF) with total angular momentum J, its z-projection M, and parity p is assumed in the following form.
where are configuration state functions (CSF), cm(s) are configuration mixing coefficients for the states, and represents all information required to uniquely define a certain CSF. A detailed description of this theoretical approach can be found in the literature [35].
4. Result and Discussion
4.1. Eu-Like W
There is scarcity of complete, consistent, and reliable atomic data for Eu-like W in the literature. Therefore, in the present calculations, we have evaluated energy levels and radiative transition rates using FAC for Eu-like W with a set of electronic configurations ([Kr]4d10) 4f125s25p5d2, 4f125s25p25d, 4f125s25p3, 4f125s5p25d2, 4f135s25p5d, 4f135s25p2, 4f135p25d2, 4f135s5p5d2, 4f135s5p25d, 4f135s5p3, 4f145s25d, 4f145d5f2, 4f145d25f, 4f145d3, 4f145s25f, 4f145f3, 4f145s25p, 4f145p5d5f, 4f145p5d2, 4f145p5f2, 4f145p25d, 4f145p25f, 4f145p3, 4f145s5d2, 4f145s5f2, 4f145s5p5d, 4f145s5p5f, and 4f145s5p2, which generate 20,573 fine structure levels. Previous studies have not included so many configurations. Our ground state with this set of configurations is 4f135s25p2 2F7/2, which is also shown by Li et al. [30].
We found complexity in the energy levels of Eu-like W. We have performed several calculations with different configurations included and found significant differences in the results, especially for the ground state. We are discussing one such difference. We have performed calculations by including the 4f145l3 (l = s,p,d,f,g), 4f135s25p2, 4f135s5p3, 4f135s25p5d, 4f135s5p25d, 4f125s25p3, and 4f125s25p25d configurations, which generate 4653 fine structure levels. Using these configurations, the ground state is found to be 4f145s25p 2P1/2. This problem is due to an insufficient account for inter-electron correlations, as accurate calculation of energies of open-f-shell configurations requires accounting for single and double excitations not only from the valence shells (including 4f), but also from the core shells such as 4d, which makes the study of Eu-like W more difficult. Therefore, we decided to check the reliability of our calculated results by comparison with the other available theoretical and experimental results, as suggested by Froese Fischer [17].
We present energy levels (in Ryd.) of the lowest 304 levels in Table 1 calculated using FAC. In the column “configuration,” we give the configuration in LS coupling, while, in the “2J” column, the relativistic designation ending with the 2J value of a particular level is provided. Each shell is denoted so that 4f+7(7) represents seven electrons in the 4f7/2 subshell (J = 7/2), and 4f-5(5) represents five electrons in the 4f5/2 subshell (J = 5/2). The number in parentheses is two times the total angular momentum of the coupled shell. Immediately after the parentheses, there is a number indicating the 2J value obtained after all preceding shells are coupled. Completely filled relativistic subshells, such as (4f5/2)6 and (5s1/2)2, are omitted in the ‘2J’ designations. For example, 4f+6(8)p+1(3)11 represents [(4f5/26)0(4f7/26)4(5s2)0(5p1/22)0(5p3/21)3/2] (J = 11/2).

Table 1.
Energies (in eV) of 304 lowest levels of Eu-like W.
A widely used method of accuracy assessment is to match the calculated results with the critically evaluated data compiled by National institute of Standard and Technology (NIST). For Eu-like W, there is only one energy value present in the Atomic Spectra Database (ASD) [9] for the level 4f145s25p 2P1/2, which is 0.10 Rydberg (Ryd) with the uncertainty of 0.18 Ryd., while our calculated result for the same level is 0.105 Ryd. The NIST value was obtained in a very primitive Cowan-code (HFR) calculation made with only a few configurations included. Furthermore, Li et al. [36] reported the calculated value for the energies of the lowest 18 levels for W11+. They have included 4f135s25p2, 4f145s25p, 4f125s25p3, 4f135s25p5l, 4f135s25p6l, 4f125p25s25l, 4f125p25s26l, 4f145s25l, and 4f145s26l configurations, which generate 16,752 levels. The 4f145s25p 2P1/2 level does not appear among their list of the lowest 18 levels, while, in our calculation, this is the second level, which is also suggested by Kramida and Shirai [25]. We have performed a calculation by taking the same configurations as Li et al. [37] and found that 4f145s25p 2P1/2 is the second level, but they have not reported that. Our level designations for the first three levels are unambiguous, as the dominant eigenvector components constitute 96.3%, 97%, and 95.7%, respectively. For some levels, designations can be ambiguous due to mixing. The basis state given as the label of our calculated level 211 (59%) is mixed with that of level 217 (23%). Level designations of Li et al. [37] differ from our present calculation for some levels. This is because they have not included many important configurations within n = 5. Furthermore, for the 4f135s25p2 2F°7/2–2F°5/2 transition, Li et al. [37] reported the transition wavelength calculated using FAC. They have also measured the transition wavelength for the same transition using SH-HtscEBIT, which is 527.60 ± 0.06 nm, while their calculated wavelength is 516.37 nm for the same transition. Our wavelength for this transition calculated using FAC is 472.06 nm.
In Table 2, we present a comparison of wavelengths calculated with FAC with other experimental and theoretical wavelengths [30] for the (4f135s25p2)5/2–(4f135s5p3)3/2,5/2,7/2 transitions in Eu-like W, which is also shown in Figure 1. For all transitions, our calculated transition wavelengths agree with the experimental results of Li et al. [30] within 4.7%, while the theoretical results of Li et al. [30] deviate from their experimental results by up to 3.1%. Li et al. [30] also used FAC as in the present calculations, but with a different number of configurations. They have included the 4f145s25p, 4f145s5p2, 4f145s5p5d, 4f135s25p2, 4f135s25p5d, 4f135s5p3, 4f135s5p25d, 4f125s25p3, and 4f125s25p25d configurations, which generate 2538 fine structure levels.
Table 2.
Comparison of calculated wavelengths (in nm) using FAC with other wavelengths for various transitions in Eu-like W. i and j represent the sequential numbers assigned in Table 1 to the lower and upper levels, respectively.
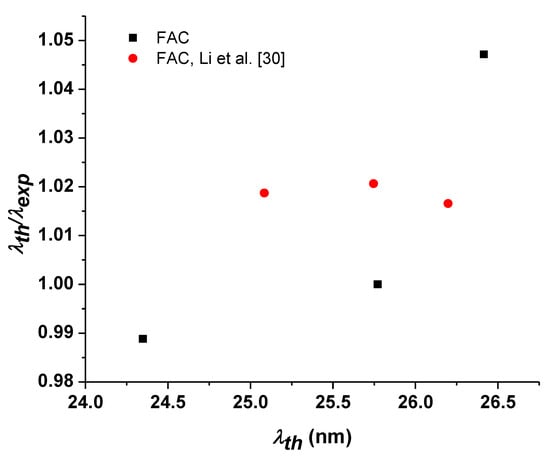
Figure 1.
Comparison of theoretical wavelengths with the experimental wavelengths of Reference [30].
Table 3 presents transition data for some strong electric dipole (E1) transitions (transition probability A > 108 s−1), respectively, from the ground state to various levels among the lowest 304 levels. We present a transition wavelength λ (in nm), a weighted oscillator strength gf (dimensionless) (both the length and velocity forms), and a transition rate Aji (s−1) calculated using FAC for Eu-like W. In Figure 2, a comparison of the ‘length’ and ‘velocity’ forms of gf (actually, results in the Babushkin and Coulomb gauges) is made for a few of the strongest transitions given in Table 3. One can see that the plot has the usual regular behaviour of increasing scatter with a decreasing line strength. However, for the strongest transitions, although the scatter is small, there is a systematic offset. The velocity form is smaller than the length form by 30%. Thus, all E1 transitions in Table 3 are estimated to have a common uncertainty of 30%.
Table 3.
Oscillator strengths (length and velocity form) gfL and gfv, vacuum wavelengths λ (in nm), and transition probabilities Aji (in s−1) for some strong electric dipole (E1) transitions from the ground state to various levels of Eu-like W.
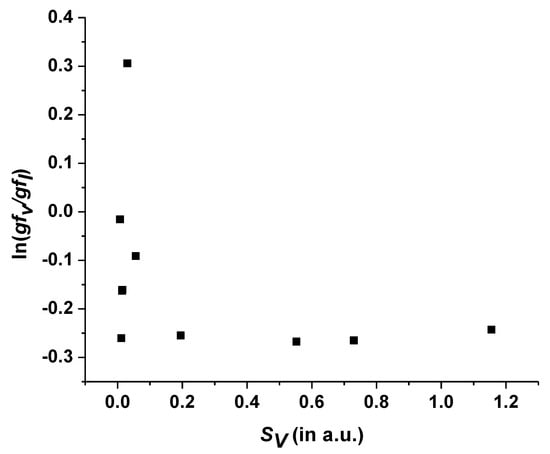
Figure 2.
A comparison of the length and velocity forms of oscillator strengths for a few of the strongest transitions of W11+.
Table 4 and Table 5 present transition data for magnetic dipole (M1) and magnetic quadrupole (M2) transitions from the ground state to some of the lowest 304 levels. We have presented transition wavelength λ (in nm), weighted oscillator strength gf (dimensionless), and transition rate Aji (s−1) calculated using FAC for Eu-like W. We predict new oscillator strength and transition probability data, where no other theoretical or experimental results are available, which will form the basis for future experimental work.
Table 4.
Oscillator strengths gfij, vacuum wavelengths λ (in nm), and transition probabilities Aji (in s−1) for magnetic dipole (M1) transitions from the ground state calculated for Eu-like W.
Table 5.
Oscillator strengths gfij, vacuum wavelengths λ (in nm), and transition probabilities Aji (in s−1) for magnetic quadrupole (M2) transitions from the ground state in Eu-like W.
In Table 6, we provide collisional excitation cross-sections of Eu-like W from the ground state for the incident electron energy range of 65 to 125 eV. To the best of our knowledge, there are no other data points for collisional cross sections of Eu-like W in the literature within the given energy range.
Table 6.
Collisional excitation cross-sections (100 Mb) of Eu-like W from the ground state to various levels.
4.2. Pm-Like W
Realizing the importance of Pm-like W and considering the paucity of atomic data for this ion, in the present work, we have calculated energy levels and radiative transition rates using FAC. To check the convergence of results, we have calculated results with different sets of configurations. Table 7 shows the configurations used in various calculations and the number of levels generated using these configurations. In the present work, we have increased the number of configurations in the sets in a systematic way to study the CI effect. In INP1, we have included 4f145s, 4f135s2, 4f135s5p, 4f145p, and 4f135p2 configurations, which generate 59 fine structure levels. In INP2, we have added the 4f125s25p, 4f125s5p2, and 4f125p3 configurations. These three configurations generate 621 levels. Furthermore, in order to check the effect on energies, INP3 forms a complex system by adding 4f115s25p2, 4f115s5p3, 4f105s25p3, and 4f105s5p4 to INP2, which generates a total of 7790 fine structure levels. We observe that the energies of these additional configurations are distributed inside the interval between the 4f145s and 4f145p energies, which shows the importance of adding these configurations. Finally, in the INPF column of Table 7, we have considered a larger CI for Pm-like W, which includes 4f145s, 4f135s2, 4f135s5p, 4f145p, 4f135p2, 4f125s25p, 4f125s5p2, 4f125p3, 4f115s25p2, 4f115s5p3, 4f105s25p3, 4f105s5p4, 4f125s25d, 4f125s5d2, 4f135d2, 4f135p5d, 4f135d2, 4f135p5d, 4f125p5d2, 4f125p25d, and 4f135s5d configurations. This set generates 13,160 levels. Table 8 shows the list of configurations included and the number of fine structure levels arising from each configuration of Pm-like W. The ground state configuration in each case is the same. Table 9 lists the energy values from each input for the 4f135s5p configuration. To check convergence, the difference between various output levels (Out1, Out2, Out3) and OutF is plotted in Figure 3. The different colors correspond to the different levels of Table 9. For levels 19 to 24, the difference is very large. Although the differences do not tend to zero with an increasing size of the calculation, the level splitting is almost the same in each output using different configuration sets for the first 18 levels, as shown in Figure 4. The root-mean-square (rms) difference from OUTF for the intervals ΔEj is 0.16 eV for OUT1, 0.10 eV for OUT2, and 0.08 eV for OUT3.
Table 7.
Configurations included in the different inputs with the number of fine structure levels for Pm-like W.
Table 8.
List of configurations included and the number of fine-structure levels arising from each configuration of Pm-like W.
Table 9.
Energy values (in eV) from each input for the 4f135s5p configuration of Pm-like W.
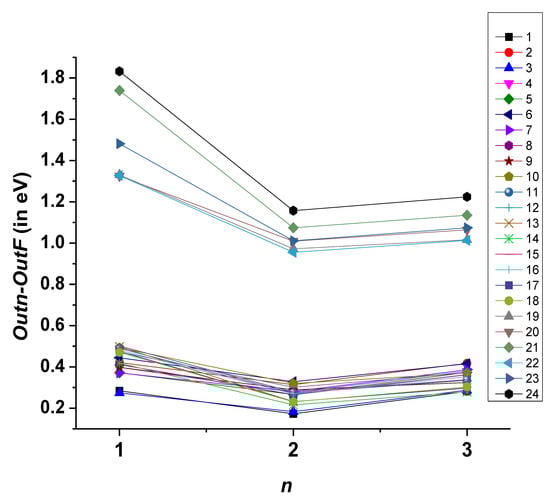
Figure 3.
Difference of energy values of each output OUTn (n = 1, 2, 3) from the final calculation for the 4f135s5p configuration.
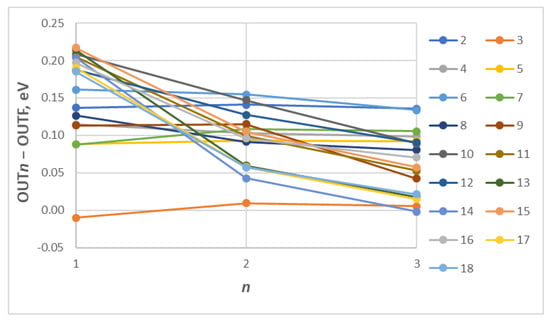
Figure 4.
Differences of energy intervals relative to the lowest level (with index 1) for each output OUTn (n = 1, 2, 3) from the final calculation for the 4f135s5p configuration.
Table 10 presents the energy levels (in Rydberg) for the lowest 500 levels calculated with FAC for Pm-like W. As can be seen from this table, we report results for many new levels that are not listed in the NIST tables [9]. The format of Table 10 is the same as in Table 1. Since 85 levels out of 500 of Table 8 have the same ‘2J’ label as some other levels, we report the eigenvector compositions and mixing coefficients of W13+ in Table S2 of the supplementary material. In this table, we report the composition of the levels given in Table 10. In the column, the ‘Comp. No.’ of Table S2 contains sequential numbers of the basis states in decreasing order of contribution. We have included only a few basis states with the largest contributions. For each basis state, Table S2 gives an electronic configuration in the JJ coupling scheme. In these designations, ‘4f13’ represents that there are 13 electrons in the 4f subshell. In ‘4f+7(7)7,’ the ‘+’ sign denotes the larger of the two possible values of the angular momentum for the f electron, i.e., ‘4f+’ corresponds to 4f7/2. ‘7’ after the ‘+’ sign shows the number of electrons in the relativistic subshell 4f7/2, ‘(7),’ which means that the total 2J value of the 4f7/2 subshell is 7, and ‘7’ at the end denotes the final 2J value of the configuration.
Table 10.
Energy levels (in eV) for the lowest 500 levels calculated with FAC using INPF configurations for Pm-like W.
In Table 11, some of the calculated energies are compared with those from critically evaluated data compiled by NIST [9], which are commonly used as a reference set for atomic results. The calculated values of Safronova et al. [28] and Zhou et al. [32] are also presented for comparison in Table 11. For the level 4f135s2 2F5/2, our calculated value matches the results of Zhou et al. [32]. For this level, the NIST value is from Vilkas et al. [24] whose results have been proven wrong by many authors in the recent past. They have used the MR-MP method for their calculation. For the 4f135s5p levels, the maximum difference between our calculation using FAC and the calculation of Safronova et al. [28] is 3.1%.
Table 11.
Comparison of energy levels (in Rydberg) calculated with FAC for Pm-like W with other available results.
In Table 12, we present the transition data for the 4f135s2–4f135s5p and 4f145s-4f145p transitions including transition wavelengths (in nm), transition probabilities (Aji in s−1), and oscillator strengths (gfij, dimensionless). We give the oscillator strengths both in the velocity and length forms to check the accuracy of the calculated results, as it is one of the criteria used to assess the accuracy. The ratio of the velocity and length forms of the oscillator strength should be close to unity in accurate calculations. It is a necessary condition, even though it is not sufficient. As one can see in Table 12, this ratio is close to unity for most of the strong transitions. It is plotted in Figure 5 against line strength. For the Pm-like W, the systematic offset between the length and velocity forms is significantly smaller, at only about 10%. Therefore, the strongest E1 transitions with the line strength SV > 0.017 a.u. can be assigned an uncertainty of 10%. Those with 0.004 a.u. < SV < 0.017 a.u. can be assigned an uncertainty of 15%, and weaker transitions can be estimated as accurate to 30%. In Table 12, we also present the transition rates from the OUT3 results for comparison since, for magnetic transitions, the velocity form is not available. From Table 12, one can see that transition rates of OUTF have large differences from OUT3 for many levels, which is due to additional configurations in OUTF. In Table S1 of the supplementary material, we report M1 and E2 transition data for the transitions to various levels for 4f125s25p of Pm-like W, as these transitions could help to analyze experimental EBIT and tokamak spectra.
Table 12.
Transition data for the 4f135s2 2F-4f135s5p and 4f145s-4f145p transitions in Pm-like W. Oscillator strength are given in both the length form (gfL) and velocity form (gfv).
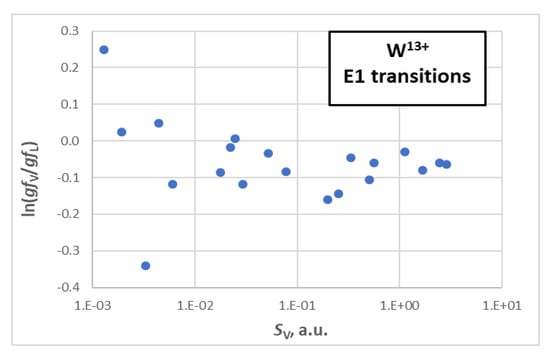
Figure 5.
A comparison of the velocity and length forms of oscillator strength for a few of the strongest transitions (E1) of W13+.
In the 4f135s2 2F7/2 and 4f135s2 2F5/2 levels, the mixing is very low, and their labeling is unambiguous. For both levels, the dominant eigenvector component contributes 98.3% and 98.4%, respectively. We would also like to mention that mixing among some of the levels is strong in our calculations. We found that level 250 is strongly coupled with level 317 with percentages of the corresponding components of 71% and 23%, respectively. We found that the level 277 is composed of 52% of the basis state used in its label mixed with 39% of the state used to label the level 357. Similarly, mixing among some other levels is very strong. Hence, the labeling of a particular level is not always based on the dominant eigenvector component. The configuration and J values given in Table 8 are definite, but the labels are not unique and can be interchanged.
Table S1 provides the means to estimate the uncertainties of the M1 and E2 transitions in Pm-like W. For example, Figure 6 plots the natural logarithm of the ratio AoutF/Aout3 of the E2 transition rates calculated in the two largest calculations. From this figure, one can see that, except for a few strongly discrepant transitions, the two data sets agree with each other fairly well. This figure is consistent with a typical behavior of calculated transition rates. For the strongest transitions (in this case, SoutF > 0.94 a.u.), the mean (i.e., root-mean-square, rms) of the logarithmic ratio is 0.014, corresponding to an agreement within 1.4% on average. For weaker transitions, the scatter of the data points increases, but, even for the weakest transitions with S < 0.00212 a.u., the mean disagreement is only 52%.
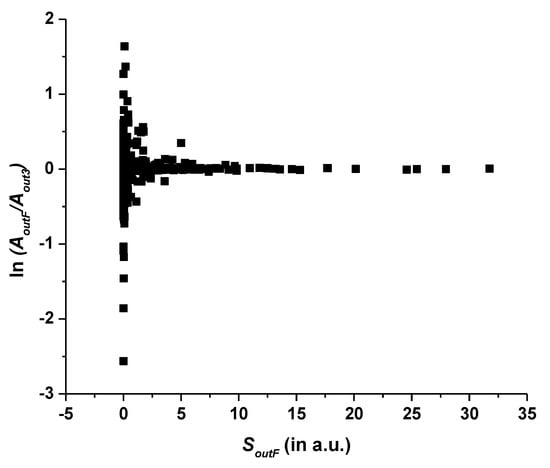
Figure 6.
Natural logarithm of the ratio AoutF/Aout3 of the E2 transition rates calculated in the two largest calculations for W13+. The horizontal axis contains the line strengths SoutF of the largest calculation in atomic units.
For M1 transitions, if three strongly discrepant transitions are excluded, the comparison of out3 and outF looks qualitatively similar, as shown in Figure 7. Here again, the strongest transitions (SoutF > 2.8 a.u. in this case) exhibit a mean discrepancy of 3.2%, while, for weaker transitions, it increases, but, even for the weakest transitions with S < 0.1 a.u., the mean discrepancy is only 15%. The three transitions excluded from this plot are 47 → 38, 65 → 38, and 74 → 38. For them, the discrepancies amount to a factor between 10 and 100.
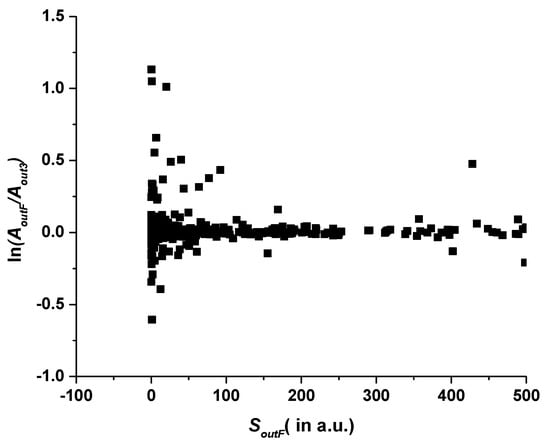
Figure 7.
Natural logarithm of the ratio AoutF/Aout3 of the M1 transition rates calculated in the two largest calculations for W13+. The horizontal axis contains the line strengths SoutF of the largest calculation in atomic units.
In Table 13, we compare transition wavelengths (in nm) calculated using FAC with the data compiled by NIST [9] and with experimental and theoretical results of Kobayashi et al. [31] along with theoretical results of Safronova et al. [28] and Ding et al. [33]. For the transitions 0–91, 0–263, and 0–326, our calculated transition wavelengths are comparable (maximum difference of 5%) with the data compiled by NIST. For the transitions 0–433, 0–434, and 0–451, our calculated transition wavelength agrees well with the experimental results of Kobayashi et al. [31] (error within 0.4%) and are more accurate than the theoretical results of Safronova et al. [28] and Kobayashi et al. [31]. Furthermore, our calculated transition wavelengths for all transitions are in excellent agreement with the recent results of Ding et al. [33]. This is a clear indication of accuracy of our results.
Table 13.
Comparison of a transition wavelength (in nm) calculated using FAC with NIST [9] and other results for Pm-like W. The indexes of the lower and upper levels, i and j, respectively, correspond to those given in Table 10.
In Table 14, we have compared transition wavelength (in nm) calculated with FAC for the transition 4f135s2 2F5/2–2F7/2 with other results for Pm-like W. The theoretical wavelengths are calculated in vacuum, while the experimental wavelengths are measured in standard air. Li et al. [30] and Zhao et al. [32] in Shanghai and Kobayashi et al. [31] in Tokyo observed similar spectra, but the charge state assignments differ by one. Recently, the Shanghai group confirmed [36] that their assignment made in References [30,32] was wrong and confirmed the assignment in Reference [31]. In addition, recent theoretical calculations by Ding et al. [33] also support the assignment in Reference [31]. Our theoretical result agrees within 2% with the experimental wavelengths of Kobayashi et al. [31]. This is better than the result of Safronova et al. [28], who used the COWAN code, and Vilkas et al. [24]. The differences of those two results from the measurement of Kobayashi et al. are larger (4% and 30%, respectively). The maximum discrepancy of 29% is between the experimental wavelength and the results of Vilkas et al. [24], which are responsible for discrepancies between our calculated results and the NIST data [9] quoted from Vilkas et al. [24]. Furthermore, our transition wavelength is in good agreement with the recent results of Ding et al. [33] as well as with other theoretical results listed in Table 14. In Table 15, we give the collisional excitation cross-sections of Pm-like W from the ground state for incident electron energy ranging from 45 to 75 eV. The collision cross section is given in units of 100 Mb.
Table 14.
Comparison of transition wavelength (nm) calculated with FAC for the transition 4f135s2 2F5/2-2F7/2 with other results for Pm-like W. Experimental wavelengths are given in standard air, while theoretically calculated wavelengths are in vacuum.
Table 15.
Collisional excitation cross-sections (100 Mb) of Pm-like W from the ground state to various levels.
5. Conclusions
Motivated by the need of atomic data for fusion plasma research, in the present paper, we have reported energy levels and radiative data, such as transition wavelengths and oscillator strengths, as well as collisional excitation cross sections for W11+ and W13+. For the calculations, the fully relativistic FAC has been adopted with the inclusion of CI. The effect of CI has been examined and investigated systematically by including different configurations. The present calculations provide new energy level data and are useful for accuracy assessments. Based on several comparisons with NIST and other available results, our listed energies are accurate (error <1%) for most levels of both ions. Energies have been listed for the lowest 304 and 500 levels of W11+ and W13+, respectively, but the remaining data for higher levels can be obtained from the authors on request. We have also presented radiative transition rates for both ions that are expected to be highly useful in analysis and modeling of plasmas. We have presented oscillator strengths in both velocity and length forms for both ions. We have compared our calculated data with the other available theoretical and experimental data and no (major) discrepancies have been found, except for some levels of Pm-like W calculated by Vilkas et al. [24]. Furthermore, we observed discrepancies in the ground state of Eu-like W, which depends on the configurations included. There is scope for further work in these complex systems.
Supplementary Materials
The following are available online at https://www.mdpi.com/2218-2004/8/4/92/s1. Table S1: Magnetic dipole (M1) and electric quadrupole (E2) transition data for transitions within the 4f13.5s2 and 4f12.5s2.5p configurations of Pm-like W. Table S2: Eigenvector compositions and mixing coefficients for Pm-like W.
Author Contributions
All authors have contributed equally in preparation of the manuscript. All authors have read and agreed to the published version of the manuscript.
Funding
This research was funded by IAEA grant number 23244.
Acknowledgments
We are thankful to IAEA for providing financial support through a research coordination project entitled “Atomic data for vapour shielding in fusion devices” contract no. 23244. “Drafts of Figure 2, Figure 3, Figure 4, Figure 5, Figure 6 and Figure 7, as well as Tables S1 and S2 of the Supplementary Materials, were made for us by an anonymous Reviewer, whose help in preparation of this article for publication is gratefully acknowledged”.
Conflicts of Interest
The authors declare no conflict of interest.
References
- Matthews, G.; Coad, P.; Greuner, H.; Hill, M.; Hirai, T.; Likonen, J.; Maier, H.; Mayer, M.; Neu, R.; Philipps, V.; et al. Development of divertor tungsten coatings for the JET ITER-like wall. J. Nucl. Mater. 2009, 390, 934–937. [Google Scholar] [CrossRef]
- Hirai, T.; Escourbiac, F.; Carpentier-Chouchana, S.; Fedosov, A.; Ferrand, L.; Jokinen, T.; Komarov, V.; Kukushkin, A.; Merola, M.; Mitteau, R.; et al. ITER tungsten divertor design development and qualification program. Fusion Eng. Des. 2013, 88, 1798–1801. [Google Scholar] [CrossRef]
- Clementson, J.; Lennartsson, T.; Beiersdorfer, P. Extreme Ultraviolet Spectra of Few-Times Ionized Tungsten for Divertor Plasma Diagnostics. Atoms 2015, 3, 407–421. [Google Scholar] [CrossRef]
- Radtke, R.; Biedermann, C.; Schwob, J.L.; Mandelbaum, P.; Doron, R. Line and band emission from tungsten ions with charge 21+ to 45+ in the 45–70–Å range. Phys. Rev. A 2001, 64, 012720. [Google Scholar] [CrossRef]
- Harte, C.S.; Suzuki, C.; Kato, T.; Sakaue, H.; Kato, D.; Sato, K.; Tamura, N.; Sudo, S.; D’Arcy, R.; Sokell, E.; et al. Tungsten spectra recorded at the LHD and comparison with calculations. J. Phys. B At. Mol. Opt. Phys. 2010, 43, 205004. [Google Scholar] [CrossRef]
- Suzuki, C.; Koike, F.; Murakami, I.; Tamura, N.; Sudo, S.; Sakaue, H.A.; Nakamura, N.; Morita, S.; Goto, M.; Kato, D.; et al. EUV spectroscopy of highly charged high Z ions in the Large Helical Device plasmas. Phys. Scripta 2014, 89, 114009. [Google Scholar] [CrossRef]
- Jonauskas, V.; Kučas, S.; Karazija, R. On the interpretation of the intense emission of tungsten ions at about 5 nm. J. Phys. B At. Mol. Opt. Phys. 2007, 40, 2179–2188. [Google Scholar] [CrossRef]
- Jonauskas, V.; Kisielius, R.; Kynienė, A.; Kučas, S.; Norrington, P.H. Magnetic dipole transitions in 4 d N configurations of tungsten ions. Phys. Rev. A 2010, 81, 012506. [Google Scholar] [CrossRef]
- Kramida, A.; Ralchenko, Y. Reader and NIST ASD Team 2019. Version 5.7.1. Available online: https://physics.nist.gov/asd (accessed on 8 October 2019).
- Singh, A.K.; Aggarwal, S.; Mohan, M. Level energies, lifetimes and radiative rates in the 4p44d configurations of bromine-like ions. Phys. Scr. 2013, 88, 35301. [Google Scholar] [CrossRef]
- Goyal, A.; Khatri, I.; Aggarwal, S.; Singh, A.; Mohan, M. Atomic structure calculations for Br-like ions. Can. J. Phys. 2015, 93, 487–495. [Google Scholar] [CrossRef]
- Goyal, A.; Khatri, I.; Aggarwal, S.; Singh, A.; Mohan, M. Atomic structure calculations and identification of EUV and SXR spectral lines in Sr XXX. J. Quant. Spectrosc. Radiat. Transf. 2015, 161, 157–170. [Google Scholar] [CrossRef]
- Goyal, A.; Khatri, I.; Aggarwal, S.; Singh, A.K.; Sharma, R.; Mohan, M. Collisional excitation of Florine like Tungsten using relativistic Dirac atomic R-matrix method. JAMNCP 2015, 2, 1. [Google Scholar]
- Goyal, A.; Khatri, I.; Aggarwal, S.; Singh, A.K.; Mohan, M. Calculation of energy levels, lifetimes and radiative data for La XXIX to Sm XXXIV. At. Data Nucl. Data Tables 2016, 107, 406. [Google Scholar] [CrossRef]
- Aggarwal, S.; Singh, J.; Mohan, M. Atomic structure calculations for Br-like ions. At. Data Nucl. Data Tables 2013, 99, 394. [Google Scholar] [CrossRef]
- Brage, T.; Froese Fischer, C.; Brage, T. Systematic calculations of correlation in complex ions. PhysicaScripta 1993, T47, 18. [Google Scholar] [CrossRef]
- Fischer, C.F. Correlation effects on transition probabilities in Mo vi. J. Phys. B At. Mol. Opt. Phys. 2011, 44, 125001. [Google Scholar] [CrossRef]
- Berengut, J.C.; Dzuba, V.A.; Flambaum, V.V.; Ong, A. Highly charged ions with E1, M1, and E2 transitions within laser range. Phys. Rev. A 2012, 86, 22517. [Google Scholar] [CrossRef]
- Berengut, J.C.; Dzuba, V.A.; Flambaum, V.V. Enhanced Laboratory Sensitivity to Variation of the Fine-Structure Constant using Highly Charged Ions. Phys. Rev. Lett. 2010, 105, 120801. [Google Scholar] [CrossRef]
- Berengut, J.C.; Dzuba, V.A.; Flambaum, V.V.; Ong, A. Electron-hole transitions in multiply charged ions for precision laser spectroscopy and searching for variations in α. Phys. Rev. Lett. 2011, 106, 210802. [Google Scholar] [CrossRef]
- Curtis, L.J.; Ellis, D.G. Alkalilike spectra in the promethium isoelectronic sequence. Phys. Rev. Lett. 1980, 45, 2099. [Google Scholar] [CrossRef]
- Theodosiou, C.E.; Raftopoulos, V. Further studies of the promethium isoelectronic sequence. Phys. Rev. A 1983, 28, 1186–1188. [Google Scholar] [CrossRef]
- Hutton, R.; Zou, Y.; Almandos, J.R.; Biedermann, R.; Radtke, R.; Greier, A.; Neu, R. EBIT Spectroscopy of Pm-like Tungsten. Nucl. Instrum. Methods Phys. Res B 2003, 205, 114. [Google Scholar] [CrossRef]
- Vilkas, M.J.; Ishikawa, Y.; Träbert, E. Electric-dipole 5 s—5 p transitions in promethiumlike ions. Phys. Rev. A 2008, 77, 42510. [Google Scholar] [CrossRef]
- Kramida, A.; Shirai, T. Energy levels and spectral lines of tungsten, W III through W LXXIV. At. Data Nucl. Data Tables 2009, 95, 305–474. [Google Scholar] [CrossRef]
- Wu, S.; Hutton, R. Applications of EBITs to spectra of multi-electron ions: Some solved and some unsolved problems. Can. J. Phys. 2008, 86, 125. [Google Scholar] [CrossRef]
- Kramida, A. Recent progress in spectroscopy of tungsten1This review is part of a Special Issue on the 10th International Colloquium on Atomic Spectra and Oscillator Strengths for Astrophysical and Laboratory Plasmas. Can. J. Phys. 2011, 89, 551–570. [Google Scholar] [CrossRef]
- Safronova, U.I.; Safronova, A.S.; Beiersdorfer, P. Contribution of the 4f -core-excited states in determination of atomic properties in the promethium isoelectronic sequence. Phys. Rev. A 2013, 88, 32512. [Google Scholar] [CrossRef]
- Qiu, M.L.; Li, W.; Zhao, Z.Z.; Yang, Y.; Xiao, J.; Brage, T.; Hutton, R.; Zou, Y. Review of highly charged tungsten spectroscopy research using low energy EBITs at the Shanghai EBIT laboratory. J. Phys. B At. Mol. Opt. Phys. 2015, 48, 144029. [Google Scholar] [CrossRef]
- Li, W.; Shi, Z.; Yang, Y.; Xiao, J.; Brage, T.; Hutton, R.; Zou, Y. Tungsten spectroscopy in the EUV range observed at a high-temperature superconducting electron-beam ion trap. Phys. Rev. A 2015, 91, 62501. [Google Scholar] [CrossRef]
- Kobayashi, Y.; Kubota, K.; Omote, K.; Komatsu, A.; Sakoda, J.; Minoshima, M.; Kato, D.; Li, J.; Sakaue, H.A.; Murakami, I.; et al. Extreme ultraviolet and visible spectroscopy of promethiumlike heavy ions. Phys. Rev. A 2015, 92, 022510. [Google Scholar] [CrossRef]
- Zhao, Z.; Qiu, M.L.; Zhao, R.F.; Li, W.X.; Guo, X.L.; Xiao, J.; Chen, C.Y.; Zou, Y.; Hutton, R. Experimental and theoretical study of visible transitions in promethium-like tungsten. J. Phys. B At. Mol. Opt. Phys. 2015, 48, 115004. [Google Scholar] [CrossRef]
- Ding, X.; Zhang, F.; Yang, Y.; Zhang, L.; Koike, F.; Murakami, I.; Kato, D.; Sakaue, H.A.; Nakamura, N.; Dong, C. Collisional-radiative modeling of the 5 p—5 s spectrum of W xiv–W xvi ions. Phys. Rev. A 2020, 101, 42509. [Google Scholar] [CrossRef]
- Mita, M.; Sakaue, H.A.; Kato, D.; Murakami, I.; Nakamura, N. Extreme ultraviolet spectra of multiply charged tungsten ions. J. Phys. Conf. Ser. 2017, 875, 12019. [Google Scholar] [CrossRef]
- Gu, M.F. The flexible atomic code. Can. J. Phys. 2008, 86, 675–689. [Google Scholar] [CrossRef]
- Liang, S.; Lu, Q.; Wang, X.; Yang, Y.; Yao, K.; Shen, Y.; Wei, B.; Xiao, J.; Chen, S.; Zhou, P.; et al. A low-energy compact Shanghai-Wuhan electron beam ion trap for extraction of highly charged ions. Rev. Sci. Instrum. 2019, 90, 93301. [Google Scholar] [CrossRef]
- Li, M.; Qiu, M.; Xiao, J.; Yao, K.; Brage, T.; Hutton, R.; Zou, Y. A strong visible line in the spectrum of W11+. Phys. Scr. 2016, 91, 105401. [Google Scholar] [CrossRef]
- Nandy, D.K.; Sahoo, B.K. Highly charged W13+, Ir16+, and Pt17+ ions as promising optical clock candidates for probing variations of the fine-structure constant. Phys. Rev. A 2016, 94, 032504. [Google Scholar] [CrossRef]


Publisher’s Note: MDPI stays neutral with regard to jurisdictional claims in published maps and institutional affiliations. |
© 2020 by the authors. Licensee MDPI, Basel, Switzerland. This article is an open access article distributed under the terms and conditions of the Creative Commons Attribution (CC BY) license (http://creativecommons.org/licenses/by/4.0/).