Article

Significance of STAT3 in Immune Infiltration and Drug Response in Cancer

1
Department of Pathophysiology, School of Basic Medical Sciences, Zhengzhou University, Zhengzhou 450001, Henan, China
2
Collaborative Innovation Center of Henan Province for Cancer Chemoprevention, Zhengzhou University, Zhengzhou 450001, Henan, China
3
State Key Laboratory of Esophageal Cancer Prevention and Treatment, Zhengzhou University, Zhengzhou 450001, Henan, China
*
Author to whom correspondence should be addressed.
Biomolecules 2020, 10(6), 834; https://doi.org/10.3390/biom10060834
Submission received: 28 March 2020 / Revised: 19 May 2020 / Accepted: 25 May 2020 / Published: 29 May 2020

Abstract

:
Signal transducer and activator of transcription 3 (STAT3) is a transcription factor and regulates tumorigenesis. However, the functions of STAT3 in immune and drug response in cancer remain elusive. Hence, we aim to reveal the impact of STAT3 in immune infiltration and drug response comprehensively by bioinformatics analysis. The expression of STAT3 and its relationship with tumor stage were explored by Tumor Immune Estimation Resource (TIMER), Human Protein Altas (HPA), and UALCAN databases. The correlations between STAT3 and immune infiltration, gene markers of immune cells were analyzed by TIMER. Moreover, the association between STAT3 and drug response was evaluated by the Cancer Cell Line Encyclopedia (CCLE) and Cancer Therapeutics Response Portal (CTRP). The results suggested that the mRNA transcriptional level of STAT3 was lower in tumors than normal tissues and mostly unrelated to tumor stage. Besides, the protein expression of STAT3 decreased in colorectal and renal cancer compared with normal tissues. Importantly, STAT3 was correlated with immune infiltration and particularly regulated tumor-associated macrophage (TAM), M2 macrophage, T-helper 1 (Th1), follicular helper T (Treg), and exhausted T-cells. Remarkably, STAT3 was closely correlated with the response to specified inhibitors and natural compounds in cancer. Furthermore, the association between STAT3 and drug response was highly cell line type dependent. Significantly, the study provides thorough insight that STAT3 is associated with immunosuppression, as well as drug response in clinical treatment.

1. Introduction

Signal transducer and activator of transcription 3 (STAT3) is a transcription factor transmitting signals from numerous receptors. Besides, it can also regulate the expression of various genes contributing to tumorigenesis [1,2,3]. STAT3 is constitutively activated by cytokines and growth factors in a large percentage of human tumors. Cytokine interleukin 6 (IL-6) and growth factor vascular endothelial growth factor (VEGF) can activate the tyrosine phosphorylation cascade. And STAT3 tightly mediates diverse processes influencing tumor progression, including proliferation, apoptosis, angiogenesis, and immune response [4,5,6].
Apart from tumor cells, STAT3 is also implicated in many other non-malignant cells in the tumor microenvironment [7]. The tumor microenvironment is a network containing various cells like fibroblasts, epithelial cells, cytokines, chemokines, and infiltrating immune cells [8]. In addition, numerous studies have shown that the tumor immune microenvironment is complex, and the tumor-infiltrating immune cells play the leading role in the tumor microenvironment. Infiltrating immune cells include T-cells, B-cells, monocytes, macrophages, natural killer cells, and dendritic cells (DCs). Moreover, the infiltrating immune cells are tightly associated with the progression of cancer [9]. Furthermore, aberrant STAT3 activation is also observed in tumor-interacting immune cells; it can increase the production of diverse immunosuppressive factors and decrease the number of immune activation factors [10,11]. Hyper-activated STAT3 regulates the expression of interferon γ (IFNγ), interleukin 12 (IL-12), CD86, C-C motif chemokine ligand 5 (CCL5), and C-X-C motif chemokine ligand 10 (CXCL10) in the tumor microenvironment to promote immune evasion [12,13]. Moreover, it has been investigated that STAT3 activation can suppress the maturation of DCs, meaning that STAT3 regulates the antigen-presenting process in the immune system [14]. Additionally, Janus Kinase (JAK)/STAT3 signaling is involved in the differentiation of immature DCs under the stimulation of the tumor microenvironment [15]. Programmed cell death protein 1 (PD-1) and programmed cell death ligand 1 (PD-L1) are important immune checkpoint molecules, and blocking PD-1/PD-L1 reduces the tumor burden and indicate promising outcomes in many tumor types [16,17]. Interestingly, it has ben reprted that STAT3 can bind to PD-L1 promoter in cancer cells [18,19], then induce immunosuppression by regulating PD-1/PD-L1 expression [20,21]. Although STAT3 is considered to be crucial to regulate the immune response in the tumor microenvironment, few studies have systematically reported the impact of STAT3 in different immune cells. Therefore, a detailed investigation of the association between STAT3 and multiple kinds of infiltrating immune cells is needed.
Growing evidence points to the aberrant activity of STAT3 in cancer providing a potential therapeutic option [22]. It has been demonstrated that metformin inhibits angiogenesis by suppressing the JAK/STAT3 signaling pathway in esophageal squamous cell carcinoma [6], and aspirin exhibits anticancer effects by regulating STAT3 signaling in colorectal cancer [23]. Aside from that, some kinase inhibitors targeting JAK and Src kinases have shown antitumor activity by disrupting STAT3 activity [24]. Plenty of small molecule compounds have been approved in cancer prevention and therapy by inhibiting the activity of STAT3 [25]. Although the role of STAT3 in tumorigenesis needs to be elucidated, it is clear that STAT3 is an advantageous drug target for cancer treatment. However, the efficacy of specific inhibitors regulating STAT3 varies among tumor types because the percentage of activated STAT3 is individualized in cancer cells. Then, a detailed analysis is needed to reveal the correlation between STAT3 and compounds in different cancer types, and it may provide a better understanding of STAT3 in cancer therapy.
Owing to the recent advancement in bioinformatics, we aim to reveal the impact of STAT3 in tumor immune microenvironment and drug response comprehensively by bioinformatics analysis. Our results shed light on the potential role of STAT3 in mediating the immune response in the tumor microenvironment. Moreover, the study have also indicated the association between STAT3 expression and drug response in different cancer cell lines. Importantly, the data provide a new insight into the combination of immunotherapy and STAT3 related inhibitors in clinical cancer treatment.

2. Materials and Methods

2.1. TIMER Database

The database Tumor Immune Estimation Resource (TIMER, https://cistrome.shinyapps.io/timer/) includes more than 10,000 samples across 23 cancer types from The Cancer Genome Atlas (TCGA) [26]. The database was used to explore the mRNA transcriptional level of STAT3 in multiple cancer types. As a convenient web-based resource, TIMER can also make the relationship between gene expression and tumor purity in cancer visible [27]. The gene module on TIMER estimates the correlation between gene expression and tumor-infiltrating immune cells (TIICs) [28]. Based on TIMER, we analyzed the relationship between STAT3 expression and tumor purity in diverse cancer types. We also evaluated the association between STAT3 and the abundance of six TIICs in cancer, including B-cells, CD8+ T-cells, CD4+ T-cells, macrophages, neutrophils, and dendritic cells. Some candidate marker genes of certain immune cells were selected from previous studies [29,30], then the correlation between STAT3 and these genes was also analyzed by TIMER. STAT3 was used for the x-axis with gene symbols, and related marker genes were represented on the y-axis as gene symbols. The transcriptional level was displayed with log2 RSEM. The correlation was exhibited by the purity-corrected partial Spearman method (partial-cor).

2.2. UALCAN Database

The database UALCAN (http://ualcan.path.uab.edu/) was used to analyze the correlation between STAT3 mRNA transcriptional level and pathological stage in cancer. The pathological stage in cancer was divided into Stages 1, 2, 3, and 4. The platform UALCAN is a web-based tool to analyze gene expression data deeply using genomics data from TCGA and clinical data from 31 cancer types [31].

2.3. The Human Protein Altas Database

The protein expressions of STAT3 in human normal tissues and tumor tissues were validated via the Human Protein Altas (HPA, https://www.proteinatlas.org/). The antibody used in the database was HPA001671. The HPA database represents the protein expression in 44 major human tissues and some cancer tissues by immunohistochemistry [32]. All the images and annotations in the database are available for download. The analysis of the data for the immunohistochemical staining of STAT3 protein expression refers to a previous study [33]. Statistical analysis was performed using SPSS version 21.0, and the p-value was determined using the Mann–Whitney U-test.

2.4. Drug Response

The mRNA profiles for 823 cancer cell lines were downloaded from the Cancer Cell Line Encyclopedia (CCLE, https://portals.broadinstitute.org/ccle/data). The drug response was measured by the area under the curves (AUCs) for 545 compounds across cancer cell lines, and the datasets were obtained from the Cancer Therapeutics Response Portal (CTRP, https://ocg.cancer.gov/programs/ctd2/dataporta), including CTRPv2.0 2015 ctd2 Expanded Dataset, CTRPv2.1 2016 pub Nat Chem Biol 12 109, and CTRPv2.2 2015 pub Cancer Disc 5 1210. The compounds contain FDA-approved drugs, clinical candidates, and small molecule probes. Then, the correlation between drug sensitivity and gene expression level was evaluated by Pearson correlation coefficients [34,35]. In the study, we used the transcriptomic data from CCLE and drug response data from CTRP to generate the correlation analysis between STAT3 expression and drug response AUC for all 823 cancer cell lines by Pearson correlation. Besides, the correlation between STAT3 expression and each cancer cell line type with at least 30 cell line replicates was analyzed separately. The threshold was set at a p-value of less than 0.05. The data analysis was conducted in RStudio Version 1.2.5033.

3. Results

3.1. The mRNA Expression of STAT3 and Correlation to Pathological Stage in Cancer

The mRNA expression levels of STAT3 were explored by TIMER in many cancer types. Additionally, the results revealed that STAT3 mRNA expression levels were significantly lower in most cancer samples than their corresponding normal samples, including bladder urothelial carcinoma (BLCA), breast invasive carcinoma (BRCA), cholangiocarcinoma (CHOL), colon adenocarcinoma (COAD), head and neck squamous cell carcinoma (HNSC), kidney chromophobe (KICH), kidney renal clear cell carcinoma (KIRC), kidney renal papillary cell carcinoma (KIRP), liver hepatocellular carcinoma (LIHC), lung adenocarcinoma (LUAD), lung squamous cell carcinoma (LUSC), and prostate adenocarcinoma (PRAD). Besides, the data also showed that STAT3 expression was aberrantly higher in HPV-positive HNSC than HPV-negative HNSC (Figure 1A).
Subsequently, to have a better understanding of the relationship between STAT3 and clinicopathological features, we analyzed the STAT3 expression level in different pathological stages by UALCAN. The results showed that STAT3 expression was lower in different pathological stages of BLCA, COAD, KICH, KIRC, LUAD, and LUSC compared with normal tissues. Meanwhile, STAT3 in KIRC with Stage 3 was significantly lower than that with Stage 1. However, there was no significant difference in STAT3 expression level among Stages 1–4 in BLCA, COAD, KICH, LUAD, and LUSC (Figure 1B), suggesting that mRNA transcriptional level of STAT3 might not relate to pathological stages in these cancer types.

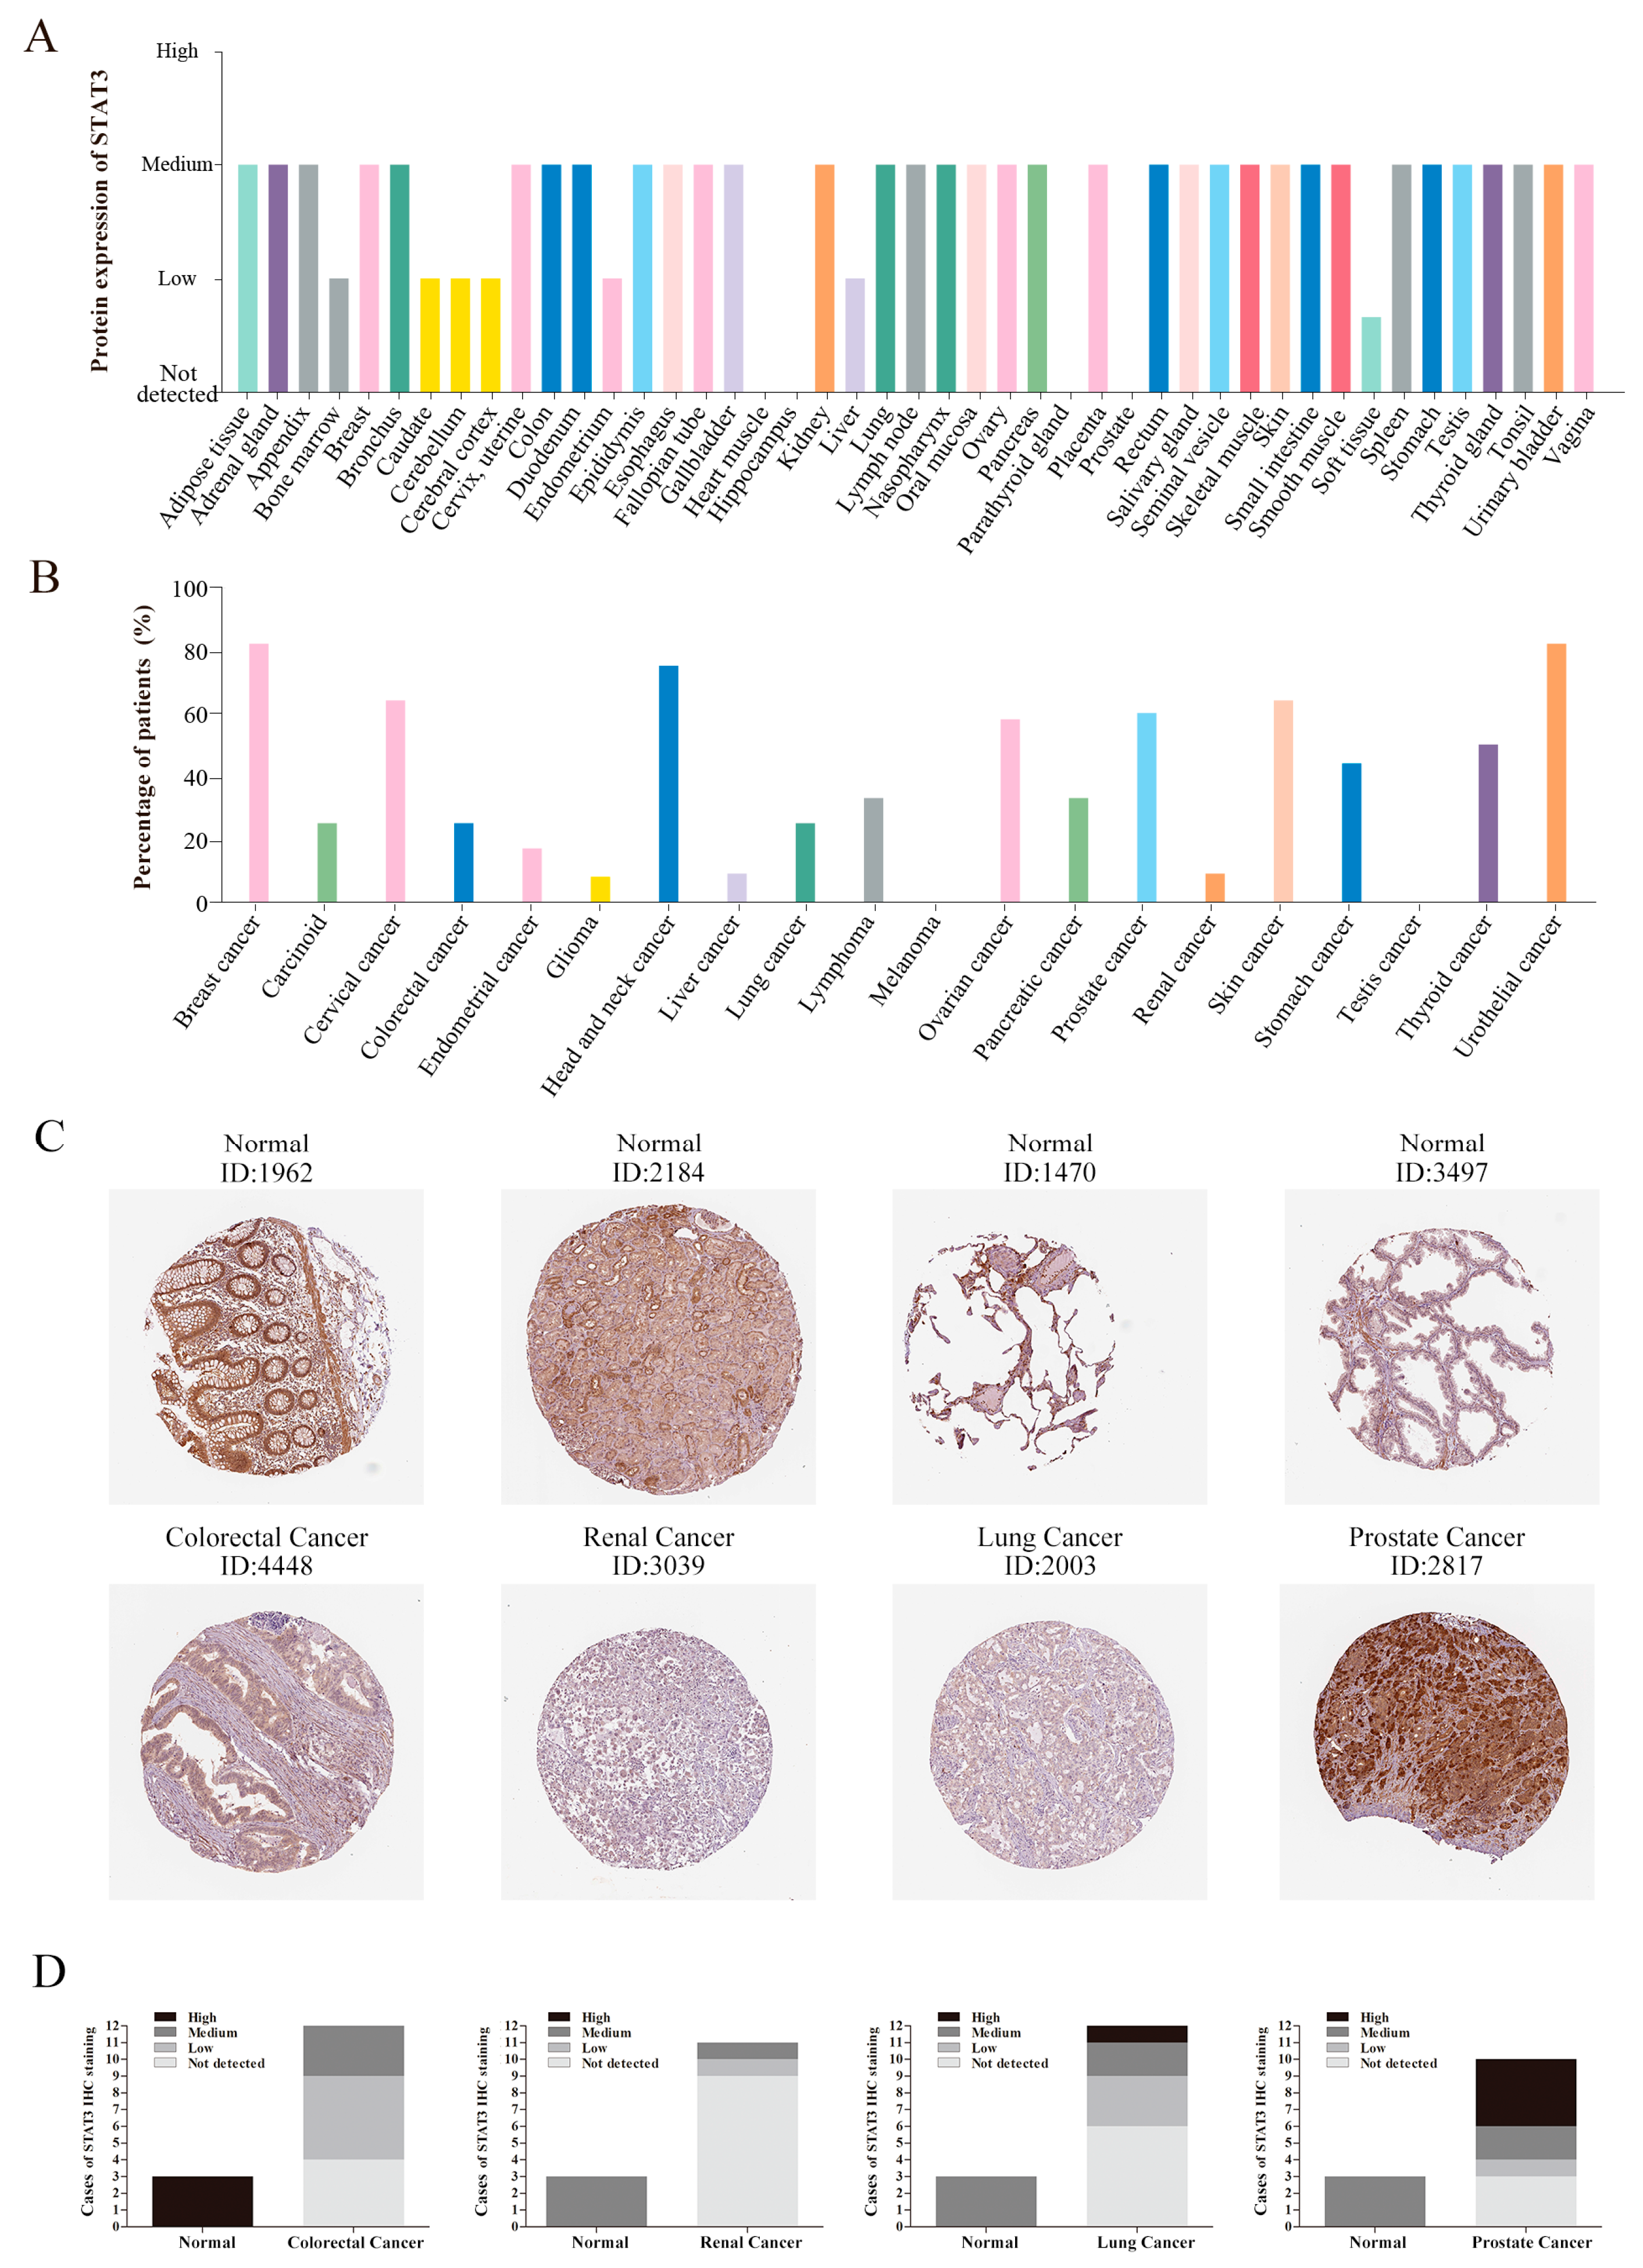
3.2. The Protein Expression of STAT3 in Cancer

Additionally, the protein expression level of STAT3 was found by using clinical specimens from the HPA database. The STAT3 protein expression data was shown for each of the 44 normal tissues (Figure 2A), and it revealed that most of the normal tissues presented medium staining. As for heart muscle, hippocampus, parathyroid gland, and prostate tissues, STAT3 was undetectable. Moreover, we also summarized the ratio of patients (maximum 12 patients) with the high and medium levels of STAT3 in 20 cancer tissues (Figure 2B). STAT3 protein expression levels might diverse in different cancer types. About 80% of patients with breast cancer, head and neck cancer, and urothelial cancer showed medium or high expression. Fewer patients with glioma, liver cancer, melanoma, and testis cancer could detect medium or high expression of STAT3. Compared with normal tissues, most kinds of cancer would display a lower protein expression of STAT3. Meanwhile, we also selected some typical immunohistochemistry images. The immunohistochemistry images revealed that STAT3 showed low staining in colorectal cancer, but high staining in normal colon tissue. Consistent with that, STAT3 protein expression was undetected in renal cancer and lung cancer, while the expression in normal tissues was medium. Hence, the protein expression of STAT3 in colorectal cancer, renal cancer, and lung cancer revealed lower levels compared with normal tissues, showing a similar result to mRNA transcriptional levels. However, the medium staining of STAT3 was found in normal prostate tissues and high staining in prostate cancer (Figure 2C), suggesting that the STAT3 protein expression was higher in prostate cancer than normal tissue. Although the statistical analysis (Figure 2D) showed that there was no significance for STAT3 staining in lung cancer and prostate cancer, which might be owing to the small sample size, the abnormal expression of STAT3 in cancer was obvious.

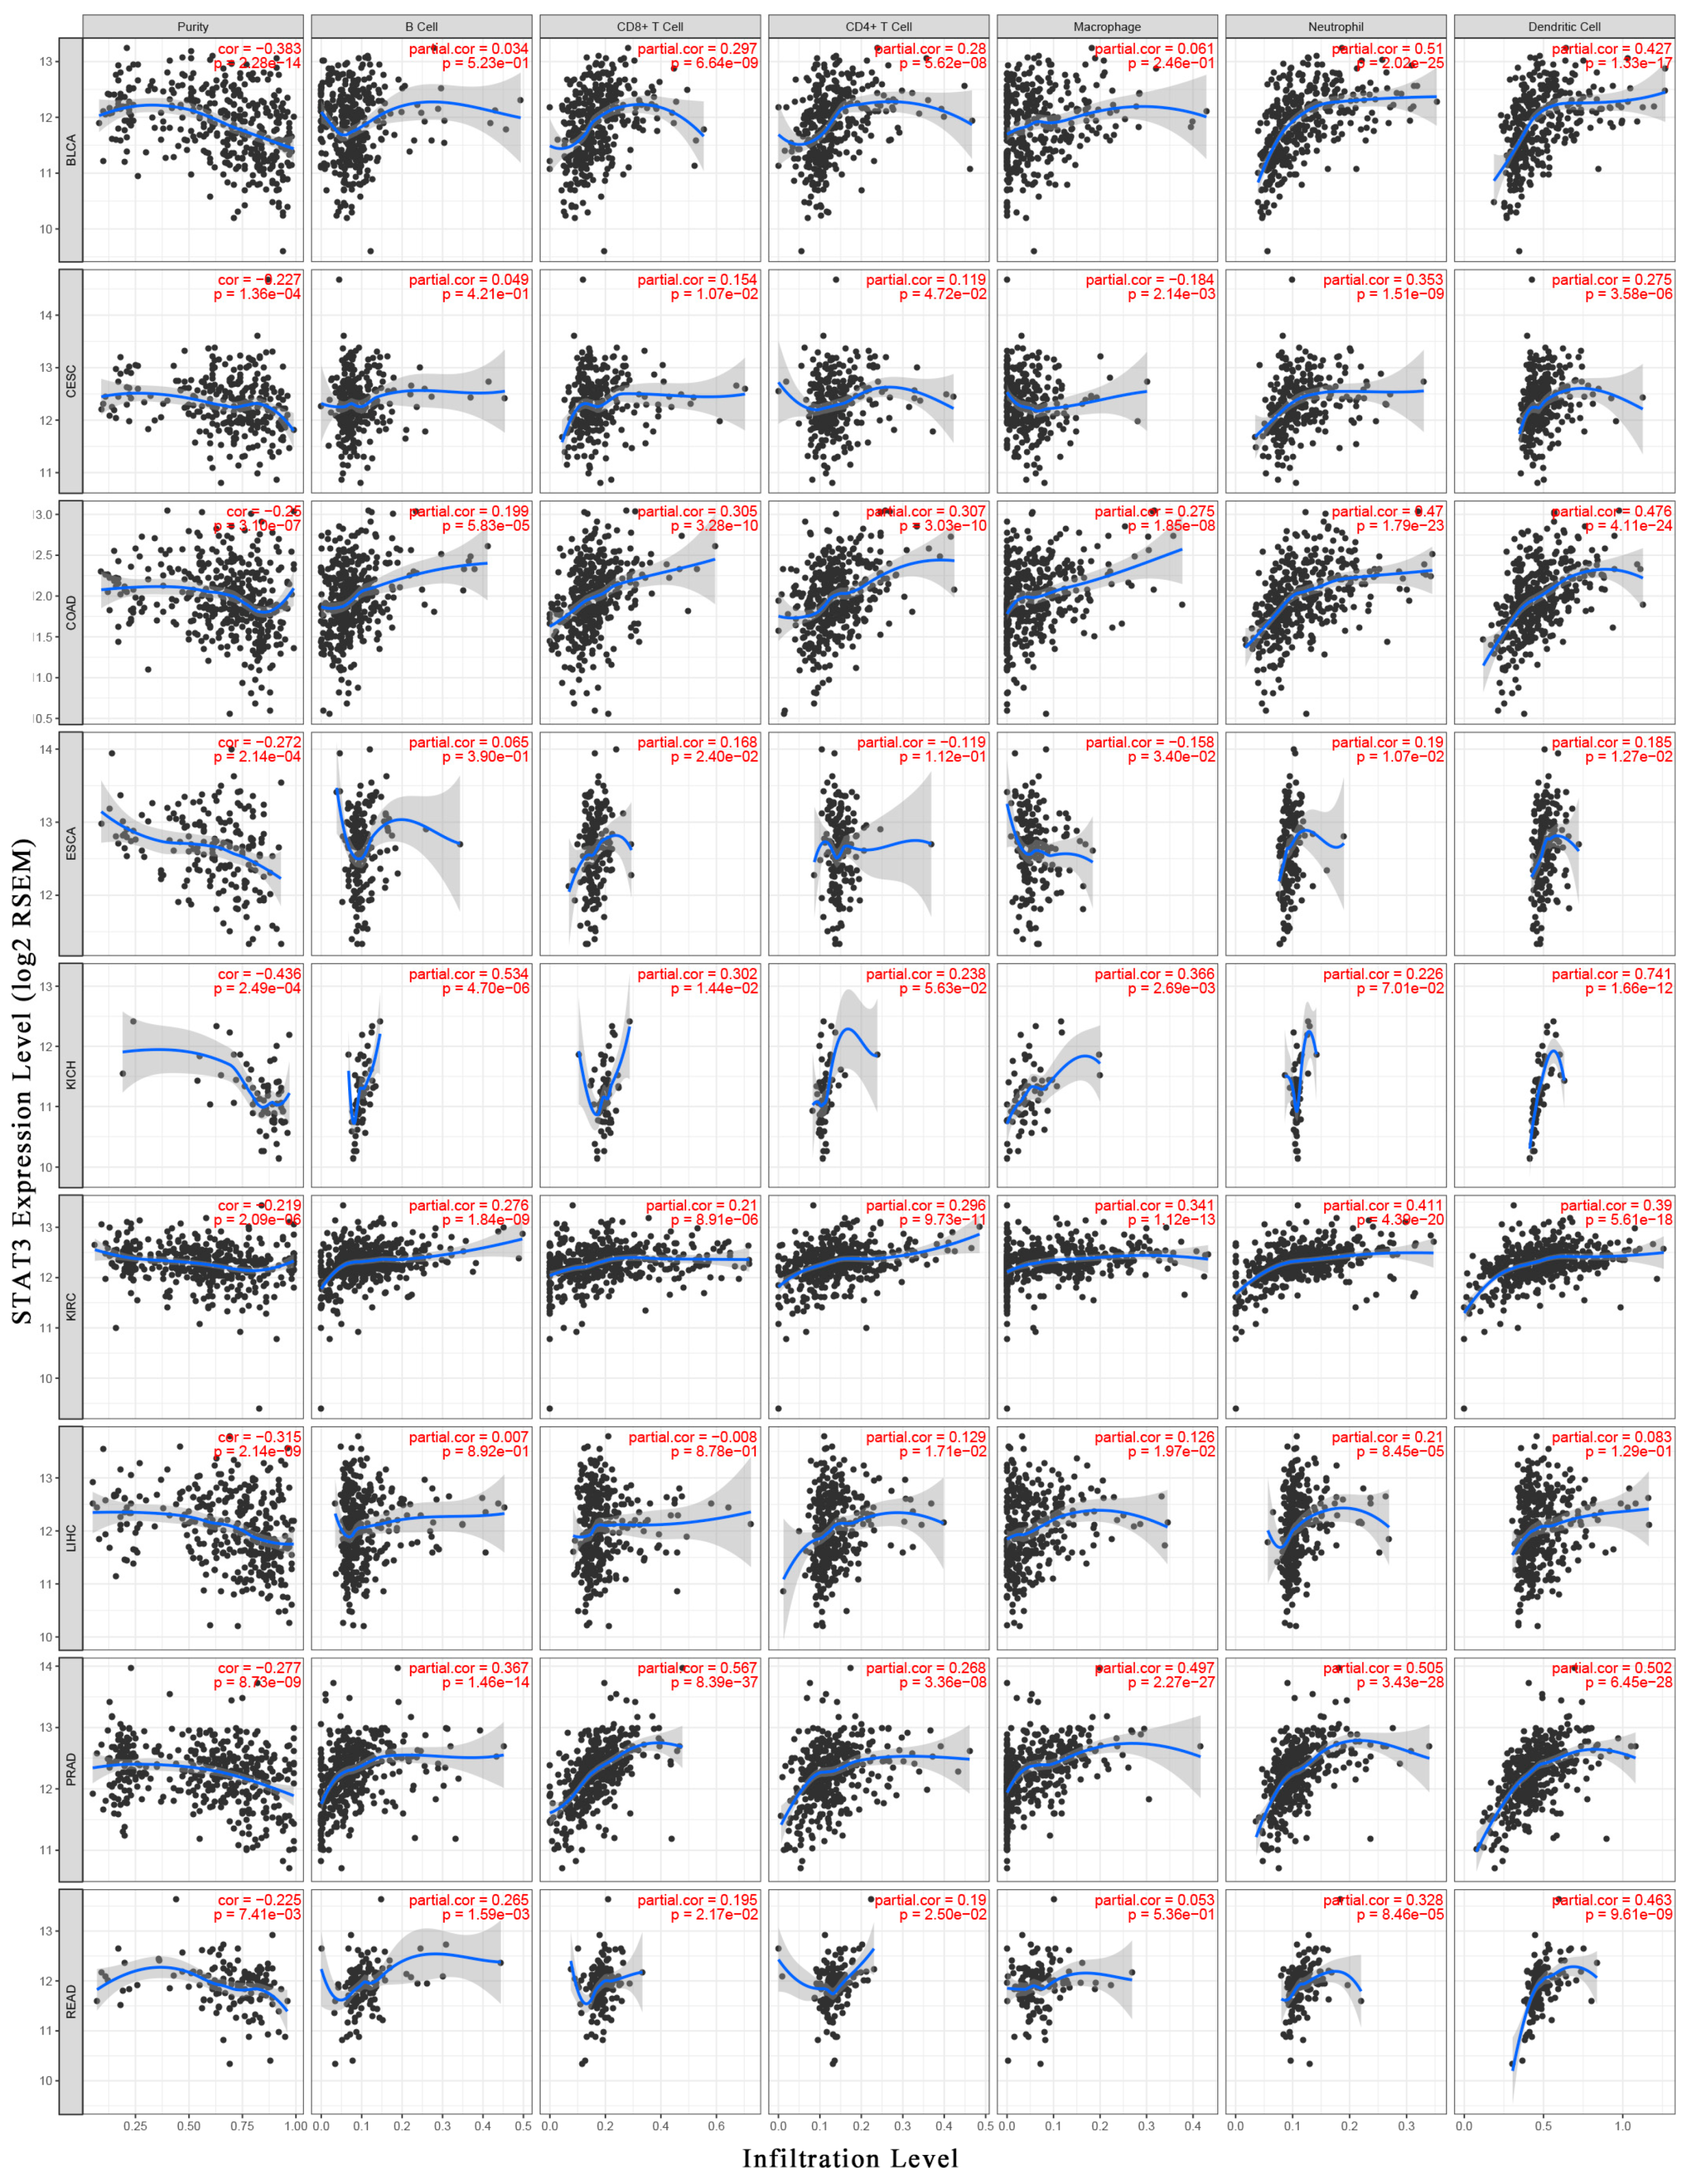
3.3. STAT3 Expression was Correlated with Immune Infiltration

To have a better understanding of STAT3 and the tumor immune microenvironment, we analyzed the association between STAT3 mRNA expression level and tumor purity using the TIMER database. Tumor purity means the percentage of tumor cells in the tumor tissue. Analysis of TIMER databases showed that STAT3 expression level was negatively related to tumor purity in nine cancer types significantly, including BLCA, cervical squamous cell carcinoma and endocervical adenocarcinoma (CESC), COAD, esophageal carcinoma (ESCA), KICH, KIRC, LIHC, PRAD, and rectum adenocarcinoma (READ). The results suggested that STAT3 expression level was inversely correlated with tumor purity, indicating that STAT3 was highly correlated with non-tumor cells, especially in BLCA (r = −0.383), KICH (r = −0.436), and LIHC (r = −0.315) (Figure 3).
Thereafter, the association between STAT3 expression level and abundance of TIICs was assessed. We observed that STAT3 expression had positive correlations with all six TIICs in KIRC and PRAD significantly. Interestingly, STAT3 was significantly correlated with infiltrating levels of B-cells in 4 cancer types (KICH, KIRC, PRAD, and READ), CD8+ T-cells in 5 cancer types (BLCA, COAD, KICH, KIRC, and PRAD), CD4+ T-cells in 4 cancer types (BLCA, COAD, KIRC, and PRAD), macrophage in 4 cancer types (COAD, KICH, KIRC, and PRAD), neutrophils in 7 cancer types (BLCA, CESC, COAD, KIRC, LIHC, PRAD, and READ), and DCs in 7 cancer types (BLCA, CESC, COAD, KICH, KIRC, PRAD, and READ). Additionally, the moderate correlations between STAT3 and neutrophils (r = 0.51), DCs (r = 0.427) were identified, respectively, in BLCA. Similarly, the moderate or strong correlations between STAT3 and infiltrating levels were shown, involving neutrophils (r = 0.47) and DC (r = 0.476) in COAD; B-cell (r = 0.534) and DC (r = 0.742) in KICH; neutrophils (r = 0.411) in KIRC; CD8+ T-cells (r = 0.567), macrophages (r = 0.497), neutrophils (r = 0.505) and DCs (r = 0.502) in PRAD; DCs (r = 0.463) in READ (Figure 3).
The results implied that STAT3 was associated with immune infiltration in BLCA, CESC, COAD, ESCA, KICH, KIRC, LIHC, PRAD, and READ. Although the correlation between STAT3 and abundance of TIICs was verified in different cancer types, STAT3 was particularly correlated with the infiltrating level of neutrophil and DC.

3.4. Correlation Analysis between STAT3 Expression and Immune Marker Genes

The correlation analysis between STAT3 and marker genes of certain immune cells was carried out by TIMER. The immune cells included CD8+ T-cells, monocytes, TAM, M1 macrophages, M2 macrophages, neutrophils, DCs, as well as various subsets of T-cells, to be specific, T-cells (general), T-helper 1 (Th1) cells, regulatory T (Tregs) cells, follicular helper T (Tfh) cells, and exhausted T-cells. Considering the correlation between STAT3 and tumor purity, STAT3 and abundance of TIICs, we focused on BLCA, KICH, and PRAD to study the correlation between STAT3 and immune cells. The results showed that STAT3 was positively correlated with most gene markers of immune cells in BLCA, KICH, and PRAD. Specifically, STAT3 showed significant correlation with CD+8 T-cell marker genes CD8A and CD8B; monocyte marker genes CD86 and CD115; TAM marker genes CCL2, CD68, and IL10; M1 macrophage marker genes inducible nitric oxide synthase (INOS), interferon regulator factor 5 (IRF5), and cytochrome c oxidase subunit II (COX2); M2 macrophage marker genes CD163, V-set and immunoglobulin domain containing 4 (VSIG4), and membrane-spanning 4-domains A4A (MS4A4A) (Table S1). The data also showed that the correlation between STAT3 and immune infiltration levels was higher in KICH than in BLCA and PRAD.
At the same time, TAM markers CD68 and IL10, M2 macrophage markers CD163 and VSIG4, were closely correlated with STAT3 expression (Figure 4). TAMs are involved in various mechanisms of tumor biology, including tumor immune escape [36]. Apart from that, STAT3 was also associated with neutrophils infiltration in BLCA, KICH, and PRAD. Neutrophils marker genes C-C motif chemokine receptor 7 (CCR7) and CD11b, were favorably linked to STAT3 in cancer, except for CCR7 showing a negative correlation with STAT3 in BLCA (Table S1). Consistently, STAT3 positively related to DC infiltration in cancer. The expression of DC marker genes, like major histocompatibility complex, class II, DP beta 1 (HLA-DPB1), major histocompatibility complex, class II, DQ beta 1 (HLA-DQB1), major histocompatibility complex, class II, DR alpha (HLA-DRA), major histocompatibility complex, class II, DP alpha 1 (HLA-DPA1), BDCA-1, BDCA-4, and CD11c were strongly correlated with STAT3 expression (Table S1). These results further exposed that STAT3 might correlate with macrophages and DCs.
In addition, we also revealed the significant positive correlation between STAT3 and marker genes of different subsets of T-cells, including T-cell (general) marker genes CD3E and CD2; Th1 marker genes, T-bet, signal transducer and activator of transcription 4 (STAT4), signal transducer and activator of transcription 1 (STAT1), and tumor necrosis factor alpha-like (TNF-α); Treg marker genes forkhead box P3 (FOXP3) and signal transducer and activator of transcription 5B (STAT5B); Tfh marker genes BCL6 and interleukin 21 (IL21); exhausted T-cell marker genes PD-1, cytotoxic T-lymphocyte associated protein 4 (CTLA4), and TIM-3 (Table S1). Furthermore, T-bet (TBX21) and STAT1, as crucial transcription factors regulating Th1, were positively correlated with STAT3 (Figure 4). FOXP3 and STAT5B, with vital roles in immune suppression, had significant positive correlations with STAT3 expression (Figure 4). As the potential targets for immunotherapy, PD-1 (PDCD1) and TIM-3 (HAVCR2) expression levels showed a strong relationship with STAT3 (Figure 4). These findings suggested that STAT3 was closely related to immune escape in the tumor microenvironment.

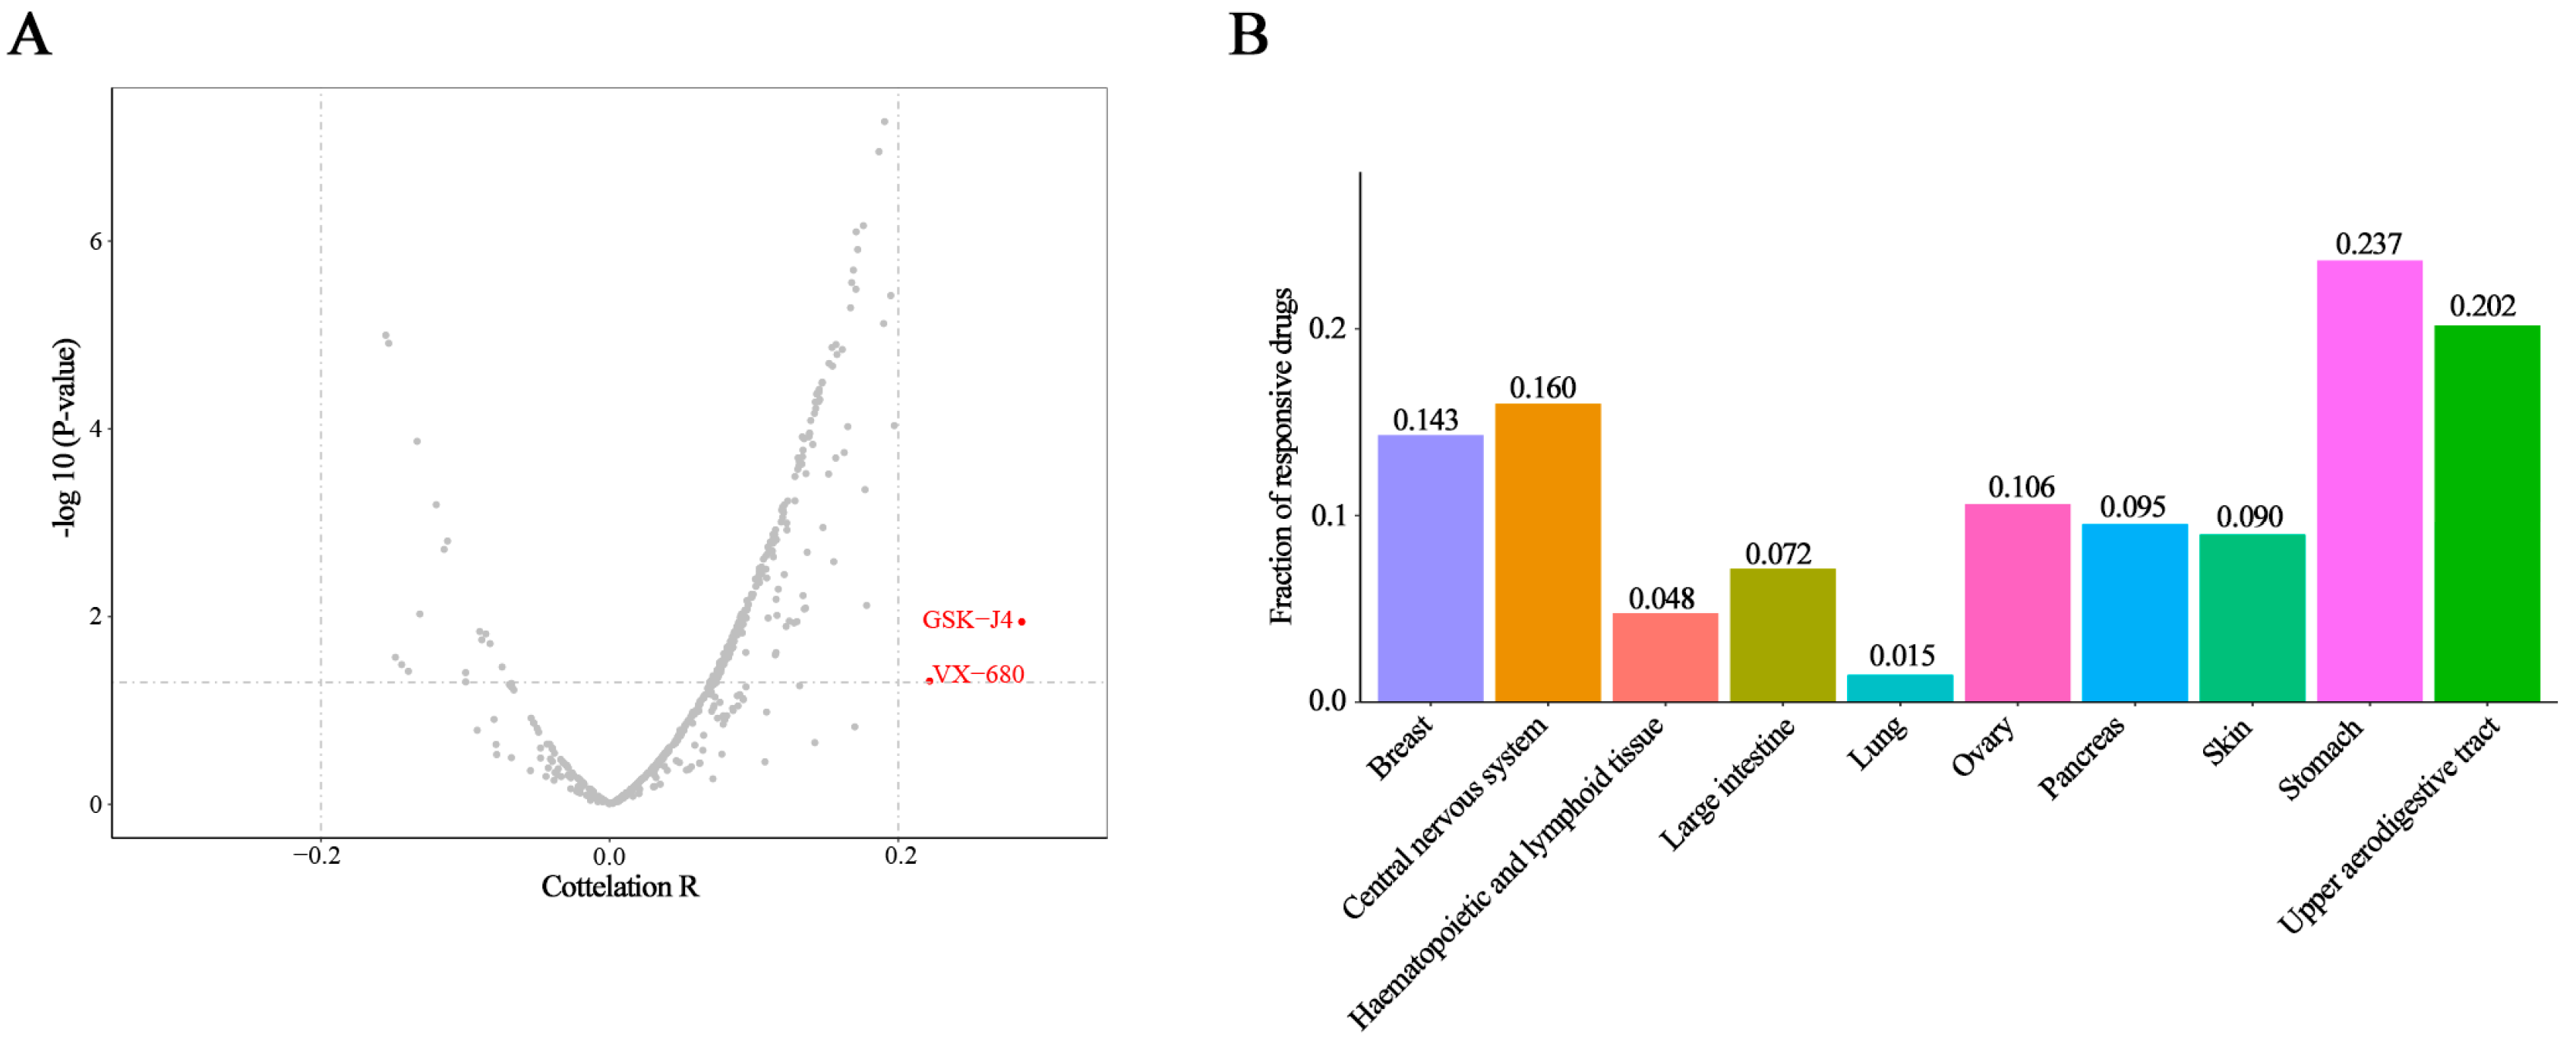
3.5. STAT3 Expression and Drug Response

A combination of immunotherapy and small molecule inhibitors was an effective choice and targeting STAT3 directly or indirectly was also the potential approach for cancer therapy. So, we evaluated the association between STAT3 expression and the response to 545 drugs in 823 cancer cell lines by CCLE and CTRP. Additionally, the results showed that only two drugs, VX-680 and GSK-J4, had a correlation coefficient greater than 0.2 (both were positively correlated, Figure 5A). The positive correlation means that higher expression of this gene was associated with resistance. A negative correlation suggests that higher expression of the gene is correlated with a better response (smaller response AUC value) [37]. VX-680 is the inhibitor of pan-aurora kinases, and GSK-J4 is a histone demethylase inhibitor. Furthermore, both VX-680 and GSK-J4 have shown the anticancer effect [38,39]. In order to analyze the results systematically, the cancer cell lines were divided into 10 types according to different primary sites in the CCLE database, containing breast, central nervous system, hematopoietic and lymphoid tissue, large intestine, lung, ovary, pancreas, skin, stomach, and upper aerodigestive tract. Interestingly, ratios of drugs associated with STAT3 expression were quite diverse among these cancer cell lines and highly primary-site-dependent (Figure 5B). More than 20% of drugs showing a correlation coefficient higher than 0.3 were collected in the stomach cancer cell lines, while only 1.5% of drugs exhibited an association with STAT3 expression in lung cancer (Figure 5B). The volcano plots showed that more than one compound displayed a correlation coefficient higher than 0.3 with STAT3 expression in the 10 cancer cell lines types, respectively (Figure S1). Except for lung cancer cell lines, there were more than 20 compounds with correlation coefficients greater than 0.3. Then, we summarized the top 10 compounds whose drug response were significantly related to STAT3 expression in 10 cancer cell line types separately (Table 1).
In breast cancer, abiraterone, targeting CYP17A1, was negatively correlated with STAT3 (r = −0.969) to the greatest extent compared with other compounds. In other words, STAT3 expression was correlated with sensitivity to abiraterone in breast cancer cell lines. Abiraterone not only was approved by the FDA for the treatment of prostate cancer but also displayed the potential benefit for breast cancer [40,41]. Additionally, the probe bafilomycin A1, the target of ATP6V0A1, showed the highest correlation coefficient (r = −0.999) in skin cancer. Bafilomycin A1 is a promising candidate drug targeting growth, apoptosis, and metastasis in cancer cell lines [42,43], and it can also reduce cell viability by inducing autophagy in melanoma [44]. The data showed that STAT3 expression was correlated with sensitivity to bafilomycin A1 in skin cancer cell lines, and STAT3 might play a role in autophagy in skin cancer. In upper aerodigestive tract cancer cell lines, JW-55, which was the probe targeting TNKS, had a positive correlation coefficient of 0.998. JW-55 was the selective Wnt/β-catenin signaling pathway inhibitor [45], and STAT3 was also approved to regulate Wnt/β-catenin signaling in the development of cancer [46]. The strong correlation between STAT3 and JW-55 was likely explained in this way. While JW-55 showed a negative correlation (−0.655) with STAT3 expression in large intestine cancer, the difference might be owing to the fact that STAT3 expression was varied among different cancer cell lines. Among these, we also found the drug cerulenin targeting FASN in stomach cancer was correlated with STAT3 positively (r = 0.555). As an inhibitor of fatty acid synthase, cerulenin could affect the proliferation and metastasis of cancer cells [47]. Hence, these results suggested that STAT3 might regulate lipid homeostasis in stomach cancer. Several compounds were targeting the PI3K/AKT pathway, such as rigosertib, MK-2206, AZD6482, TGX-221, NVP-BEZ235, and targeting the JAK/STAT pathway, like ruxolitinib and AZD1480, which were significantly correlated to STAT3 expression in cancer cell lines. Consistent with our data, STAT3 was involved in the PI3K signaling pathway in cancer [48].
To further investigate the potential mechanism of phytochemical approaches to cancer treatment, we summarized the correlation between transcriptional expression level of STAT3 and sensitivity to natural compounds in cancer cell lines by CCLE and CTRP databases (Table 2). We found that STAT3 expression was significantly correlated with natural product betulinic acid, phloretin, nakiterpiosin, and cucurbitacin I. Among them, betulinic acid, which had the negative correlation with STAT3 expression in the large intestine cancer, possessed an antitumor property in breast cancer [49,50].
Besides, some reports revealed that betulinic acid could regulate STAT3 in many cancer types [51,52]. In central nervous system cancer cell lines, compounds nakiterpiosin and cucurbitacin I had a positive correlation coefficient greater than 0.3 (higher expression of STAT3 related to resistance). Apart from these, the response of phloretin was associated with STAT3 expression in upper aerodigestive tract cancer. Besides, the anti-inflammatory and anticancer effects of phloretin have been evaluated in many studies [53]. In total, the results turned out that some natural compounds might regulate STAT3 in cancer.

4. Discussion

Bioinformatics has been rapidly applied to cancer research in recent years. Using some powerful bioinformatics tools like software packages and databases, profiles of gene expression in cancer can be analyzed. With the aid of some statistical methods, bioinformatics can provide a platform to discover the underlying molecular mechanisms in cancer biology and development [54]. Here, using the microarray database, we explored the mRNA expression of STAT3 and found that STAT3 was significantly downregulated in various cancer samples compared with normal samples. And the protein expression of STAT3 was significantly decreased in colorectal cancer and renal cancer compared with normal tissues. Although there are some studies showing that STAT3 may be a tumor suppressor [55,56], STAT3 has been identified as an oncogene contributing progression in cancer [57,58]. Actually, STAT3 pathway was constitutively activated in cancer, and only after activation via phosphorylation, STAT3 was translocated to the nucleus and act as the oncogenic-associated protein [59]. The expression level of p-STAT3 could reflect the activity in cancer progression better than total STAT3 protein expression. Besides, the maximum sample size of tumor patients was 12 in the HPA dataset, which made the protein expression of STAT3 in cancer less objective and needed further investigation and verification. Furthermore, our data showed that STAT3 expression was not related to the pathological stage except KIRC. Consistent with that, it has been reported that STAT3 is not associated with pathological stages in colorectal cancer [60].
Apart from the known role of STAT3 in promoting cancer cell proliferation, invasion, and angiogenesis, STAT3 also showed the crucial role in immunosuppression [61]. In this study, we demonstrated that STAT3 expression was closely correlated with immune infiltration in cancer. The tumor tissues are composed of tumor cells and non-tumor cells, and tumor purity is the proportion of tumor cells in the mixture. Apart from immune cells, stromal, endothelial, and epithelial cells are also components of solid tumor tissues [62]. Considering STAT3 was closely related to immune cells in BLCA, KICH, and PRAD, so that we chose the three cancer types to investigate the correlation between STAT3 expression and the marker genes of immune cells. We also detected the correlations between STAT3 and TAM markers, M2 macrophage markers. CD68 is a pan-macrophage marker that points to both M1- and M2-activated TAM, while CD163 only refers to M2 macrophage-related antigen [63]. STAT3 correlated with CD68 and CD163, meaning that STAT3 might correlate with M2 macrophage to regulate cancer development. Consistent with that, some studies previously reported that M2 macrophage secreted IL-8 via the STAT3/MALAT1 pathway to promote prostate tumorigenesis [64], and ERK/STAT3 axis could drive breast cancer progressions by stimulating M2 macrophage [65]. Besides, our results also revealed that STAT3 was also correlated with gene markers of Tregs. Tregs, which were enriched in the tumor microenvironment in a high degree, were well known for the roles in immune suppression in tumors [66]. Following that, impeding the expression of STAT3 by some small molecules attributed to decreasing the infiltration of Tregs the tumor microenvironment [67]. FOXP3, the lineage-specification factor, is essential for maintaining the suppressor function of Tregs. It can also act as a co-transcription factor of STAT3 in Tregs [68]. Furthermore, the data showed that STAT3 might induce T-cell exhaustion. TIM-3, a vital surface protein on exhausted T-cells [69], could mediate immune exhaustion in the tumor microenvironment. As a new immune checkpoint molecule, TIM-3 promotes tumorigenesis through the NF-κB/IL-6/STAT3 axis [70]. PD-1 is another immune checkpoint molecule, and cancer cells utilize PD-1/PD-L1 to evade T-cell-mediated tumor specific immunity in the tumor microenvironment [71]. Moreover, the direct link between STAT3 and PD-1 in tumor has been previously described [20,72]. Taken together, STAT3 might correlate with M2 macrophage, Tregs, and T-cell exhaustion, regulating immune suppression in the tumor microenvironment.
More and more studies have shown that combination of immunotherapy and small molecule inhibitors is more effective than immunotherapy alone. Apart from the role of STAT3 in immune suppression, this study also demonstrates the significant association between STAT3 expression and drug response. The data was interesting that the significant association between STAT3 expression and VX-680, GSK-J4 treatment response in 823 cell lines. VX-680 might mediate cell death by acting on P53/Bax/caspase-3 dependent pathway in cholangiocarcinoma cell [73]. Additionally, oxaliplatin-induced NOTCH signaling could be interrupted by GSK-J4 treatment in colorectal cancer [74], while there was no evidence showing that both VX-680 and GSK-J4 regulated STAT3 in the progression of tumors. Significantly, our study provided some clues for the mechanism research of the two drugs in antitumor therapy. Recently, many studies have shown that lipogenesis is a crucial characteristic in the tumor microenvironment. And targeting signaling cascades about lipid homeostasis is a promising way in cancer therapy [75]. Interestingly, we found that the expression of STAT3 was closely correlated with the response of fatty acid synthase inhibitor. Based on this, understanding STAT3 related mechanisms, like regulating lipogenesis, was essential to understand cancer initiation and progression. Over these years, natural compounds extracting from traditional Chinese herbs have been investigated as an advantageous approach to cancer therapy. Meanwhile, our team formerly found that natural compounds curcumin could play an important role in angiogenesis by regulating STAT3 [76]. In this current study, we also found betulinic acid responded to STAT3 expression in large intestine cancer. Consistent with our results, Dan Su et al. identified that betulinic acid showed potent therapeutic and antitumor effects through the NF-κB and STAT3 pathways in HT-29 colorectal cancer cell [77]. Additionally, betulinic acid could downregulate STAT3 activation through SHP-1 in myeloma cells [78]. Overall, the data revealed that betulinic acid regulated STAT3 in cancer, suggesting the potential role of betulinic acid as a chemopreventive compound targeting STAT3. Cucurbitacins contained twelve categories [79], and showed the anticancer effect by different mechanisms, including JAK/STAT3, MAPK, PI3K/AKT, and NF-κB signaling pathways [80]. Our results showed that cucurbitacin I had a positive correlation with STAT3 in the central nervous system, meaning that higher expression of STAT3 was correlated with worse response. However, cucurbitacin I had been proved as a potential inhibitor of STAT3 [81,82]. The converse might be explained by the tumor heterogeneity and the drug response was highly cancer-type-dependent. Overall, these data laid the foundation for the study that betulinic acid and cucurbitacin I might regulate STAT3 in cancer.
To be honest, there were some limitations in this study. First, the maximum sample size of cancer patients was 12 and normal was 3 in the HPA dataset, which made the protein expression of STAT3 in cancer less objective. Moreover, the sample size of KICH was relatively small and the correlation with immune infiltration in KICH was less reliable compared with BLCA and PRAD. Therefore, succeeding studies are still needed to address these problems. Although there were limitations in our study, some of the results in our study were pretty meaningful and could offer directions for future study. For instance, we comprehensively analyzed the association between STAT3 and TIICs and our results showed that the correlation between STAT3 and M2 macrophage, Tregs, and T-cell exhaustion was higher compared with other immune cell types. As we know, M2 macrophages, Tregs, and T-cell exhaustion play an important role in immune suppression. Based on the above findings, we made the conclusion that STAT3 was particularly correlated with immune suppression in the tumor microenvironment. Furthermore, we systematically investigated the association between STAT3 expression and drug response in various cancer cell lines. Interestingly, our results revealed that VX-680 and GSK-J4 showed a positive response to STAT3 in cancer. Besides, the response of FASN inhibitor was closely correlated with STAT3, which provided insight into STAT3 might regulate lipid homeostasis. In addition, our results also revealed that some natural compounds might mediate STAT3 in cancer.

5. Conclusions

In summary, our study suggests that STAT3 is related to immune cell infiltration and closely associated with immune suppression. Additionally, STAT3 expression is tightly correlated with specified inhibitors and natural compounds treatment response in cancer. Therefore, STAT3 may play an important role in immune infiltration and cancer clinical therapy.

Supplementary Materials

The following are available online at https://www.mdpi.com/2218-273X/10/6/834/s1, Figure S1: STAT3 expression and drug response correlation in 10 types of cancer cell lines, Table S1: Correlation analysis between STAT3 and gene markers of immune cells in TIMER.

Author Contributions

Methodology, W.C. and X.D.; software, W.C., X.D., and Y.C.; resources, Q.Z. and Y.Z.; writing—original draft preparation, W.C.; writing—review and editing, J.L. and F.T.; supervision, J.L. All authors have read and agreed to the published version of the manuscript.

Funding

This study was supported by grants from the Natural Science Foundation of China (No.81572972), the Supporting Plan of Scientific and Technological Innovation Team in Universities of Henan Province (No.20IRTSTHN029), the Science Foundation of the Henan Province of China (No.20B310016), and the Key scientific and technological research projects of Henan Provincial Department of Education (No.14A310007).

Conflicts of Interest

The authors declare no conflict of interest.

Abbreviations

AUCarea under the curve
BLCAbladder urothelial carcinoma
BRCAbreast invasive carcinoma
CCL5C-C motif chemokine ligand 5
CCLECancer Cell Line Encyclopedia
CCR7C-C motif chemokine receptor 7
CESCcervical squamous cell carcinoma and endocervical adenocarcinoma
CHOLcholangiocarcinoma
COADcolon adenocarcinoma
COX2cytochrome c oxidase subunit II
CTLA4cytotoxic T-lymphocyte associated protein 4
CTRPCancer Therapeutics Response Portal
CXCL10C-X-C motif chemokine ligand 10
DCdendritic cell
ESCAesophageal carcinoma
FOXP3forkhead box P3
HLA-DPA1major histocompatibility complex, class II, DP alpha 1
HLA-DPB1major histocompatibility complex, class II, DP beta 1
HLA-DQB1major histocompatibility complex, class II, DQ beta 1
HLA-DRAmajor histocompatibility complex, class II, DR alpha
HNSChead and neck squamous cell carcinoma
HPAHuman Protein Atlas
IFNγinterferon γ
IL-12interleukin 12
IL21interleukin 21
IL-6interleukin 6
INOSinducible nitric oxide synthase
IRF5interferon regulator factor 5
JAKJanus kinaseKICH, kidney chromophobe
KIRCkidney renal clear cell carcinoma
KIRPkidney renal papillary cell carcinoma
LIHCliver hepatocellular carcinoma
LUADlung adenocarcinoma
LUSClung squamous cell carcinoma
MS4A4Amembrane spanning 4-domains A4A
PD-1programmed cell death protein 1
PD-L1programmed cell death ligand 1
PRADprostate adenocarcinoma
READrectum adenocarcinoma
STAT1signal transducer and activator of transcription 1
STAT3Signal transducer and activator of transcription 3
STAT4signal transducer and activator of transcription 4
STAT5Bsignal transducer and activator of transcription 5B
TAMtumor-associated macrophage
TCGAThe Cancer Genome Atlas
Th1T-helper 1
TIICstumor-infiltrating immune cells
TIMERTumor Immune Estimation Resource
TNF-αtumor necrosis factor alpha-like
Tregfollicular helper T
VEGFvascular endothelial growth factor
VSIG4V-set and immunoglobulin domain containing 4

References

  1. Qin, J.J.; Yan, L.; Zhang, J.; Zhang, W.D. STAT3 as a potential therapeutic target in triple negative breast cancer: A systematic review. J. Exp. Clin. Cancer Res. Cr 2019, 38, 195. [Google Scholar] [CrossRef]
  2. He, W.; Wu, J.; Shi, J.; Huo, Y.M.; Dai, W.; Geng, J.; Lu, P.; Yang, M.W.; Fang, Y.; Wang, W.; et al. IL22RA1/STAT3 Signaling Promotes Stemness and Tumorigenicity in Pancreatic Cancer. Cancer Res 2018, 78, 3293–3305. [Google Scholar] [CrossRef] [PubMed] [Green Version]
  3. Lu, J.; Tang, Y.; Cheng, Y.; Zhang, G.; Yip, A.; Martinka, M.; Dong, Z.; Zhou, J.; Li, G. ING4 regulates JWA in angiogenesis and their prognostic value in melanoma patients. Br. J. Cancer 2013, 109, 2842–2852. [Google Scholar] [CrossRef] [PubMed] [Green Version]
  4. Johnson, D.E.; O’Keefe, R.A.; Grandis, J.R. Targeting the IL-6/JAK/STAT3 signalling axis in cancer. Nat. Rev. Clin. Oncol. 2018, 15, 234–248. [Google Scholar] [CrossRef] [PubMed]
  5. Wang, H.; Huo, X.; Yang, X.R.; He, J.; Cheng, L.; Wang, N.; Deng, X.; Jin, H.; Wang, N.; Wang, C.; et al. STAT3-mediated upregulation of lncRNA HOXD-AS1 as a ceRNA facilitates liver cancer metastasis by regulating SOX4. Mol. Cancer 2017, 16, 136. [Google Scholar] [CrossRef] [Green Version]
  6. Yang, Y.; Jin, G.; Liu, H.; Liu, K.; Zhao, J.; Chen, X.; Wang, D.; Bai, R.; Li, X.; Jang, Y.; et al. Metformin inhibits esophageal squamous cell carcinoma-induced angiogenesis by suppressing JAK/STAT3 signaling pathway. Oncotarget 2017, 8, 74673–74687. [Google Scholar] [CrossRef] [Green Version]
  7. Won, C.; Kim, B.H.; Yi, E.H.; Choi, K.J.; Kim, E.K.; Jeong, J.M.; Lee, J.H.; Jang, J.J.; Yoon, J.H.; Jeong, W.I.; et al. Signal transducer and activator of transcription 3-mediated CD133 up-regulation contributes to promotion of hepatocellular carcinoma. Hepatology 2015, 62, 1160–1173. [Google Scholar] [CrossRef] [Green Version]
  8. Yuan, Y.; Jiang, Y.C.; Sun, C.K.; Chen, Q.M. Role of the tumor microenvironment in tumor progression and the clinical applications (Review). Oncol. Rep. 2016, 35, 2499–2515. [Google Scholar] [CrossRef] [Green Version]
  9. Giraldo, N.A.; Sanchez-Salas, R.; Peske, J.D.; Vano, Y.; Becht, E.; Petitprez, F.; Validire, P.; Ingels, A.; Cathelineau, X.; Fridman, W.H.; et al. The clinical role of the TME in solid cancer. Br. J. Cancer 2019, 120, 45–53. [Google Scholar] [CrossRef]
  10. Hossain, D.M.; Pal, S.K.; Moreira, D.; Duttagupta, P.; Zhang, Q.; Won, H.; Jones, J.; D’Apuzzo, M.; Forman, S.; Kortylewski, M. TLR9-Targeted STAT3 Silencing Abrogates Immunosuppressive Activity of Myeloid-Derived Suppressor Cells from Prostate Cancer Patients. Clin. Cancer Res. 2015, 21, 3771–3782. [Google Scholar] [CrossRef] [Green Version]
  11. Huang, Q.; Zhong, Y.; Dong, H.; Zheng, Q.; Shi, S.; Zhu, K.; Qu, X.; Hu, W.; Zhang, X.; Wang, Y. Revisiting signal transducer and activator of transcription 3 (STAT3) as an anticancer target and its inhibitor discovery: Where are we and where should we go? Eur. J. Med. Chem. 2020, 187, 111922. [Google Scholar] [CrossRef]
  12. Yue, C.; Shen, S.; Deng, J.; Priceman, S.J.; Li, W.; Huang, A.; Yu, H. STAT3 in CD8+ T Cells Inhibits Their Tumor Accumulation by Downregulating CXCR3/CXCL10 Axis. Cancer Immunol. Res. 2015, 3, 864–870. [Google Scholar] [CrossRef] [Green Version]
  13. De Martino, M.; Tkach, M.; Bruni, S.; Rocha, D.; Mercogliano, M.F.; Cenciarini, M.E.; Chervo, M.F.; Proietti, C.J.; Dingli, F.; Loew, D.; et al. Blockade of Stat3 oncogene addiction induces cellular senescence and reveals a cell-nonautonomous activity suitable for cancer immunotherapy. Oncoimmunology 2020, 9, 1715767. [Google Scholar] [CrossRef] [Green Version]
  14. Constantino, J.; Gomes, C.; Falcao, A.; Neves, B.M.; Cruz, M.T. Dendritic cell-based immunotherapy: A basic review and recent advances. Immunol. Res. 2017, 65, 798–810. [Google Scholar] [CrossRef] [PubMed]
  15. Jin, G.; Zhao, J.; Yang, Y.I.; Liu, K.; Jiang, Y.; Zhang, X.; Zhang, Y.; Huang, Y.; Lu, J.; Dong, Z. JAK/STAT3 signaling pathway mediates endothelial-like differentiation of immature dendritic cells. Oncol. Lett. 2015, 10, 3471–3477. [Google Scholar] [CrossRef] [PubMed] [Green Version]
  16. Robert, C.; Long, G.V.; Brady, B.; Dutriaux, C.; Maio, M.; Mortier, L.; Hassel, J.C.; Rutkowski, P.; McNeil, C.; Kalinka-Warzocha, E.; et al. Nivolumab in previously untreated melanoma without BRAF mutation. N. Engl. J. Med. 2015, 372, 320–330. [Google Scholar] [CrossRef] [PubMed] [Green Version]
  17. Rosenberg, J.E.; Hoffman-Censits, J.; Powles, T.; van der Heijden, M.S.; Balar, A.V.; Necchi, A.; Dawson, N.; O’Donnell, P.H.; Balmanoukian, A.; Loriot, Y.; et al. Atezolizumab in patients with locally advanced and metastatic urothelial carcinoma who have progressed following treatment with platinum-based chemotherapy: A single-arm, multicentre, phase 2 trial. Lancet 2016, 387, 1909–1920. [Google Scholar] [CrossRef] [Green Version]
  18. Atsaves, V.; Tsesmetzis, N.; Chioureas, D.; Kis, L.; Leventaki, V.; Drakos, E.; Panaretakis, T.; Grander, D.; Medeiros, L.J.; Young, K.H.; et al. PD-L1 is commonly expressed and transcriptionally regulated by STAT3 and MYC in ALK-negative anaplastic large-cell lymphoma. Leukemia 2017, 31, 1633–1637. [Google Scholar] [CrossRef]
  19. Song, T.L.; Nairismagi, M.L.; Laurensia, Y.; Lim, J.Q.; Tan, J.; Li, Z.M.; Pang, W.L.; Kizhakeyil, A.; Wijaya, G.C.; Huang, D.C.; et al. Oncogenic activation of the STAT3 pathway drives PD-L1 expression in natural killer/T-cell lymphoma. Blood 2018, 132, 1146–1158. [Google Scholar] [CrossRef] [Green Version]
  20. Bu, L.L.; Yu, G.T.; Wu, L.; Mao, L.; Deng, W.W.; Liu, J.F.; Kulkarni, A.B.; Zhang, W.F.; Zhang, L.; Sun, Z.J. STAT3 Induces Immunosuppression by Upregulating PD-1/PD-L1 in HNSCC. J. Dent. Res. 2017, 96, 1027–1034. [Google Scholar] [CrossRef] [PubMed]
  21. Zerdes, I.; Wallerius, M.; Sifakis, E.G.; Wallmann, T.; Betts, S.; Bartish, M.; Tsesmetzis, N.; Tobin, N.P.; Coucoravas, C.; Bergh, J.; et al. STAT3 Activity Promotes Programmed-Death Ligand 1 Expression and Suppresses Immune Responses in Breast Cancer. Cancers (Basel) 2019, 11, 1479. [Google Scholar] [CrossRef] [PubMed] [Green Version]
  22. Laudisi, F.; Cherubini, F.; Monteleone, G.; Stolfi, C. STAT3 Interactors as Potential Therapeutic Targets for Cancer Treatment. Int. J. Mol. Sci. 2018, 19, 1787. [Google Scholar] [CrossRef] [Green Version]
  23. Guo, H.; Liu, J.; Ben, Q.; Qu, Y.; Li, M.; Wang, Y.; Chen, W.; Zhang, J. The aspirin-induced long non-coding RNA OLA1P2 blocks phosphorylated STAT3 homodimer formation. Genome Biol. 2016, 17, 24. [Google Scholar] [CrossRef] [Green Version]
  24. Furtek, S.L.; Backos, D.S.; Matheson, C.J.; Reigan, P. Strategies and Approaches of Targeting STAT3 for Cancer Treatment. Acs Chem. Biol. 2016, 11, 308–318. [Google Scholar] [CrossRef]
  25. Zhao, M.; Jiang, B.; Gao, F.H. Small molecule inhibitors of STAT3 for cancer therapy. Curr. Med. Chem. 2011, 18, 4012–4018. [Google Scholar] [CrossRef]
  26. Li, B.; Severson, E.; Pignon, J.C.; Zhao, H.; Li, T.; Novak, J.; Jiang, P.; Shen, H.; Aster, J.C.; Rodig, S.; et al. Comprehensive analyses of tumor immunity: Implications for cancer immunotherapy. Genome Biol. 2016, 17, 174. [Google Scholar] [CrossRef] [Green Version]
  27. Li, T.; Fan, J.; Wang, B.; Traugh, N.; Chen, Q.; Liu, J.S.; Li, B.; Liu, X.S. TIMER: A Web Server for Comprehensive Analysis of Tumor-Infiltrating Immune Cells. Cancer Res 2017, 77, e108–e110. [Google Scholar] [CrossRef] [Green Version]
  28. Liu, S.; Ding, G.; Zhou, Z.; Feng, C. beta-Catenin-driven adrenocortical carcinoma is characterized with immune exclusion. Oncotargets Ther. 2018, 11, 2029–2036. [Google Scholar] [CrossRef] [Green Version]
  29. Danaher, P.; Warren, S.; Dennis, L.; D’Amico, L.; White, A.; Disis, M.L.; Geller, M.A.; Odunsi, K.; Beechem, J.; Fling, S.P. Gene expression markers of Tumor Infiltrating Leukocytes. J. Immunother. Cancer 2017, 5, 18. [Google Scholar] [CrossRef] [Green Version]
  30. Gu, Y.; Li, X.; Bi, Y.; Zheng, Y.; Wang, J.; Li, X.; Huang, Z.; Chen, L.; Huang, Y.; Huang, Y. CCL14 is a prognostic biomarker and correlates with immune infiltrates in hepatocellular carcinoma. Aging 2020, 12, 784–807. [Google Scholar] [CrossRef]
  31. Chandrashekar, D.S.; Bashel, B.; Balasubramanya, S.A.H.; Creighton, C.J.; Ponce-Rodriguez, I.; Chakravarthi, B.; Varambally, S. UALCAN: A Portal for Facilitating Tumor Subgroup Gene Expression and Survival Analyses. Neoplasia 2017, 19, 649–658. [Google Scholar] [CrossRef]
  32. Uhlen, M.; Fagerberg, L.; Hallstrom, B.M.; Lindskog, C.; Oksvold, P.; Mardinoglu, A.; Sivertsson, A.; Kampf, C.; Sjostedt, E.; Asplund, A.; et al. Proteomics. Tissue-based map of the human proteome. Science 2015, 347, 1260419. [Google Scholar] [CrossRef]
  33. Zhou, H.; Yang, Z.; Yue, J.; Chen, Y.; Chen, T.; Mu, T.; Liu, H.; Bi, X. Identification of potential hub genes via bioinformatics analysis combined with experimental verification in colorectal cancer. Mol. Carcinog. 2020, 59, 425–438. [Google Scholar] [CrossRef]
  34. Seashore-Ludlow, B.; Rees, M.G.; Cheah, J.H.; Cokol, M.; Price, E.V.; Coletti, M.E.; Jones, V.; Bodycombe, N.E.; Soule, C.K.; Gould, J.; et al. Harnessing Connectivity in a Large-Scale Small-Molecule Sensitivity Dataset. Cancer Discov. 2015, 5, 1210–1223. [Google Scholar] [CrossRef] [Green Version]
  35. Rees, M.G.; Seashore-Ludlow, B.; Cheah, J.H.; Adams, D.J.; Price, E.V.; Gill, S.; Javaid, S.; Coletti, M.E.; Jones, V.L.; Bodycombe, N.E.; et al. Correlating chemical sensitivity and basal gene expression reveals mechanism of action. Nat. Chem. Biol. 2016, 12, 109–116. [Google Scholar] [CrossRef]
  36. Paolino, M.; Penninger, J.M. The Role of TAM Family Receptors in Immune Cell Function: Implications for Cancer Therapy. Cancers (Basel) 2016, 8, 97. [Google Scholar] [CrossRef] [Green Version]
  37. Yang, W.; Soares, J.; Greninger, P.; Edelman, E.J.; Lightfoot, H.; Forbes, S.; Bindal, N.; Beare, D.; Smith, J.A.; Thompson, I.R.; et al. Genomics of Drug Sensitivity in Cancer (GDSC): A resource for therapeutic biomarker discovery in cancer cells. Nucleic Acids Res. 2013, 41, D955–D961. [Google Scholar] [CrossRef] [Green Version]
  38. Pezzani, R.; Rubin, B.; Bertazza, L.; Redaelli, M.; Barollo, S.; Monticelli, H.; Baldini, E.; Mian, C.; Mucignat, C.; Scaroni, C.; et al. The aurora kinase inhibitor VX-680 shows anti-cancer effects in primary metastatic cells and the SW13 cell line. Investig. New Drugs 2016, 34, 531–540. [Google Scholar] [CrossRef]
  39. Hong, B.J.; Park, W.Y.; Kim, H.R.; Moon, J.W.; Lee, H.Y.; Park, J.H.; Kim, S.K.; Oh, Y.; Roe, J.S.; Kim, M.Y. Oncogenic KRAS Sensitizes Lung Adenocarcinoma to GSK-J4-Induced Metabolic and Oxidative Stress. Cancer Res 2019, 79, 5849–5859. [Google Scholar] [CrossRef] [Green Version]
  40. Gerratana, L.; Basile, D.; Buono, G.; De Placido, S.; Giuliano, M.; Minichillo, S.; Coinu, A.; Martorana, F.; De Santo, I.; Del Mastro, L.; et al. Androgen receptor in triple negative breast cancer: A potential target for the targetless subtype. Cancer Treat. Rev. 2018, 68, 102–110. [Google Scholar] [CrossRef]
  41. Gucalp, A.; Traina, T.A. Targeting the androgen receptor in triple-negative breast cancer. Curr. Probl. Cancer 2016, 40, 141–150. [Google Scholar] [CrossRef] [Green Version]
  42. Lu, X.; Chen, L.; Chen, Y.; Shao, Q.; Qin, W. Bafilomycin A1 inhibits the growth and metastatic potential of the BEL-7402 liver cancer and HO-8910 ovarian cancer cell lines and induces alterations in their microRNA expression. Exp. Ther. Med. 2015, 10, 1829–1834. [Google Scholar] [CrossRef] [Green Version]
  43. Yuan, N.; Song, L.; Zhang, S.; Lin, W.; Cao, Y.; Xu, F.; Fang, Y.; Wang, Z.; Zhang, H.; Li, X.; et al. Bafilomycin A1 targets both autophagy and apoptosis pathways in pediatric B-cell acute lymphoblastic leukemia. Haematologica 2015, 100, 345–356. [Google Scholar] [CrossRef] [Green Version]
  44. Liu, H.; He, Z.; Simon, H.U. Targeting autophagy as a potential therapeutic approach for melanoma therapy. Semin. Cancer Biol. 2013, 23, 352–360. [Google Scholar] [CrossRef] [Green Version]
  45. Waaler, J.; Machon, O.; Tumova, L.; Dinh, H.; Korinek, V.; Wilson, S.R.; Paulsen, J.E.; Pedersen, N.M.; Eide, T.J.; Machonova, O.; et al. A novel tankyrase inhibitor decreases canonical Wnt signaling in colon carcinoma cells and reduces tumor growth in conditional APC mutant mice. Cancer Res 2012, 72, 2822–2832. [Google Scholar] [CrossRef] [Green Version]
  46. Feng, F.; Chen, A.; Huang, J.; Xia, Q.; Chen, Y.; Jin, X. Long noncoding RNA SNHG16 contributes to the development of bladder cancer via regulating miR-98/STAT3/Wnt/beta-catenin pathway axis. J. Cell. Biochem. 2018, 119, 9408–9418. [Google Scholar] [CrossRef]
  47. Stoiber, K.; Naglo, O.; Pernpeintner, C.; Zhang, S.; Koeberle, A.; Ulrich, M.; Werz, O.; Muller, R.; Zahler, S.; Lohmuller, T.; et al. Targeting de novo lipogenesis as a novel approach in anti-cancer therapy. Br. J. Cancer 2018, 118, 43–51. [Google Scholar] [CrossRef] [Green Version]
  48. Vogt, P.K.; Hart, J.R. PI3K and STAT3: A new alliance. Cancer Discov. 2011, 1, 481–486. [Google Scholar] [CrossRef] [Green Version]
  49. Gao, Y.; Ma, Q.; Ma, Y.B.; Ding, L.; Xu, X.L.; Wei, D.F.; Wei, L.; Zhang, J.W. Betulinic acid induces apoptosis and ultrastructural changes in MDA-MB-231 breast cancer cells. Ultrastruct. Pathol. 2018, 42, 49–54. [Google Scholar] [CrossRef]
  50. Zheng, Y.; Liu, P.; Wang, N.; Wang, S.; Yang, B.; Li, M.; Chen, J.; Situ, H.; Xie, M.; Lin, Y.; et al. Betulinic Acid Suppresses Breast Cancer Metastasis by Targeting GRP78-Mediated Glycolysis and ER Stress Apoptotic Pathway. Oxidative Med. Cell. Longev. 2019, 2019, 8781690. [Google Scholar] [CrossRef]
  51. Shen, H.; Liu, L.; Yang, Y.; Xun, W.; Wei, K.; Zeng, G. Betulinic Acid Inhibits Cell Proliferation in Human Oral Squamous Cell Carcinoma via Modulating ROS-Regulated p53 Signaling. Oncol. Res. 2017, 25, 1141–1152. [Google Scholar] [CrossRef]
  52. Wu, J.; Yang, C.; Liu, J.; Chen, J.; Huang, C.; Wang, J.; Liang, Z.; Wen, L.; Yi, J.E.; Yuan, Z. Betulinic Acid Attenuates T-2-Toxin-Induced Testis Oxidative Damage Through Regulation of the JAK2/STAT3 Signaling Pathway in Mice. Biomolecules 2019, 9, 787. [Google Scholar] [CrossRef] [Green Version]
  53. Choi, B.Y. Biochemical Basis of Anti-Cancer-Effects of Phloretin-A Natural Dihydrochalcone. Molecules 2019, 24, 278. [Google Scholar] [CrossRef] [Green Version]
  54. Banwait, J.K.; Bastola, D.R. Contribution of bioinformatics prediction in microRNA-based cancer therapeutics. Adv. Drug Deliv. Rev. 2015, 81, 94–103. [Google Scholar] [CrossRef] [Green Version]
  55. Gordziel, C.; Bratsch, J.; Moriggl, R.; Knosel, T.; Friedrich, K. Both STAT1 and STAT3 are favourable prognostic determinants in colorectal carcinoma. Br. J. Cancer 2013, 109, 138–146. [Google Scholar] [CrossRef]
  56. Lee, J.; Kim, J.C.; Lee, S.E.; Quinley, C.; Kim, H.; Herdman, S.; Corr, M.; Raz, E. Signal transducer and activator of transcription 3 (STAT3) protein suppresses adenoma-to-carcinoma transition in Apcmin/+ mice via regulation of Snail-1 (SNAI) protein stability. J. Biol. Chem. 2012, 287, 18182–18189. [Google Scholar] [CrossRef] [Green Version]
  57. Ernst, S.; Muller-Newen, G. Nucleocytoplasmic Shuttling of STATs. A Target for Intervention? Cancers (Basel) 2019, 11, 1815. [Google Scholar] [CrossRef] [Green Version]
  58. Quick, L.; Young, R.; Henrich, I.C.; Wang, X.; Asmann, Y.W.; Oliveira, A.M.; Chou, M.M. Jak1-STAT3 Signals Are Essential Effectors of the USP6/TRE17 Oncogene in Tumorigenesis. Cancer Res 2016, 76, 5337–5347. [Google Scholar] [CrossRef] [Green Version]
  59. Don-Doncow, N.; Marginean, F.; Coleman, I.; Nelson, P.S.; Ehrnstrom, R.; Krzyzanowska, A.; Morrissey, C.; Hellsten, R.; Bjartell, A. Expression of STAT3 in Prostate Cancer Metastases. Eur. Urol. 2017, 71, 313–316. [Google Scholar] [CrossRef] [Green Version]
  60. Park, J.H.; van Wyk, H.; McMillan, D.C.; Quinn, J.; Clark, J.; Roxburgh, C.S.; Horgan, P.G.; Edwards, J. Signal Transduction and Activator of Transcription-3 (STAT3) in Patients with Colorectal Cancer: Associations with the Phenotypic Features of the Tumor and Host. Clin Cancer Res 2017, 23, 1698–1709. [Google Scholar] [CrossRef] [Green Version]
  61. Yu, H.; Lee, H.; Herrmann, A.; Buettner, R.; Jove, R. Revisiting STAT3 signalling in cancer: New and unexpected biological functions. Nat. Rev. Cancer 2014, 14, 736–746. [Google Scholar] [CrossRef]
  62. Aran, D.; Sirota, M.; Butte, A.J. Systematic pan-cancer analysis of tumour purity. Nat. Commun. 2015, 6, 8971. [Google Scholar] [CrossRef] [Green Version]
  63. Jeong, H.; Hwang, I.; Kang, S.H.; Shin, H.C.; Kwon, S.Y. Tumor-Associated Macrophages as Potential Prognostic Biomarkers of Invasive Breast Cancer. J. Breast Cancer 2019, 22, 38–51. [Google Scholar] [CrossRef]
  64. Zheng, T.; Ma, G.; Tang, M.; Li, Z.; Xu, R. IL-8 Secreted from M2 Macrophages Promoted Prostate Tumorigenesis via STAT3/MALAT1 Pathway. Int. J. Mol. Sci. 2018, 20, 98. [Google Scholar] [CrossRef] [Green Version]
  65. Mu, X.; Shi, W.; Xu, Y.; Xu, C.; Zhao, T.; Geng, B.; Yang, J.; Pan, J.; Hu, S.; Zhang, C.; et al. Tumor-derived lactate induces M2 macrophage polarization via the activation of the ERK/STAT3 signaling pathway in breast cancer. Cell Cycle 2018, 17, 428–438. [Google Scholar] [CrossRef]
  66. Josefowicz, S.Z.; Lu, L.F.; Rudensky, A.Y. Regulatory T cells: Mechanisms of differentiation and function. Annu. Rev. Immunol. 2012, 30, 531–564. [Google Scholar] [CrossRef]
  67. Pei, J.; Zhang, Y.; Luo, Q.; Zheng, W.; Li, W.; Zeng, X.; Li, Q.; Quan, J. STAT3 inhibition enhances CDN-induced STING signaling and antitumor immunity. Cancer Lett. 2019, 450, 110–122. [Google Scholar] [CrossRef]
  68. Hossain, D.M.; Panda, A.K.; Manna, A.; Mohanty, S.; Bhattacharjee, P.; Bhattacharyya, S.; Saha, T.; Chakraborty, S.; Kar, R.K.; Das, T.; et al. FoxP3 acts as a cotranscription factor with STAT3 in tumor-induced regulatory T cells. Immunity 2013, 39, 1057–1069. [Google Scholar] [CrossRef] [Green Version]
  69. Huang, Y.H.; Zhu, C.; Kondo, Y.; Anderson, A.C.; Gandhi, A.; Russell, A.; Dougan, S.K.; Petersen, B.S.; Melum, E.; Pertel, T.; et al. CEACAM1 regulates TIM-3-mediated tolerance and exhaustion. Nature 2015, 517, 386–390. [Google Scholar] [CrossRef] [Green Version]
  70. Zhang, H.; Song, Y.; Yang, H.; Liu, Z.; Gao, L.; Liang, X.; Ma, C. Tumor cell-intrinsic Tim-3 promotes liver cancer via NF-kappaB/IL-6/STAT3 axis. Oncogene 2018, 37, 2456–2468. [Google Scholar] [CrossRef]
  71. Chen, L.; Han, X. Anti-PD-1/PD-L1 therapy of human cancer: Past, present, and future. J. Clin. Investig. 2015, 125, 3384–3391. [Google Scholar] [CrossRef] [Green Version]
  72. Woods, D.M.; Ramakrishnan, R.; Laino, A.S.; Berglund, A.; Walton, K.; Betts, B.C.; Weber, J.S. Decreased Suppression and Increased Phosphorylated STAT3 in Regulatory T Cells are Associated with Benefit from Adjuvant PD-1 Blockade in Resected Metastatic Melanoma. Clin Cancer Res 2018, 24, 6236–6247. [Google Scholar] [CrossRef] [Green Version]
  73. Liu, J.; Qin, C.Y. VX-680 induces p53-mediated apoptosis in human cholangiocarcinoma cells. Anti Cancer Drugs 2018, 29, 1004–1010. [Google Scholar] [CrossRef]
  74. Wang, Q.; Chen, X.; Jiang, Y.; Liu, S.; Liu, H.; Sun, X.; Zhang, H.; Liu, Z.; Tao, Y.; Li, C.; et al. Elevating H3K27me3 level sensitizes colorectal cancer to oxaliplatin. J. Mol. Cell Biol. 2020, 12, 125–137. [Google Scholar] [CrossRef]
  75. Braig, S. Chemical genetics in tumor lipogenesis. Biotechnol. Adv. 2018, 36, 1724–1729. [Google Scholar] [CrossRef]
  76. Jin, G.; Yang, Y.; Liu, K.; Zhao, J.; Chen, X.; Liu, H.; Bai, R.; Li, X.; Jiang, Y.; Zhang, X.; et al. Combination curcumin and (-)-epigallocatechin-3-gallate inhibits colorectal carcinoma microenvironment-induced angiogenesis by JAK/STAT3/IL-8 pathway. Oncogenesis 2017, 6, e384. [Google Scholar] [CrossRef]
  77. Su, D.; Gao, Y.Q.; Dai, W.B.; Hu, Y.; Wu, Y.F.; Mei, Q.X. Helicteric Acid, Oleanic Acid, and Betulinic Acid, Three Triterpenes from Helicteres angustifolia L., Inhibit Proliferation and Induce Apoptosis in HT-29 Colorectal Cancer Cells via Suppressing NF-kappaB and STAT3 Signaling. Evid. Based Complement. Altern. Med. Ecam 2017, 2017, 5180707. [Google Scholar] [CrossRef]
  78. Pandey, M.K.; Sung, B.; Aggarwal, B.B. Betulinic acid suppresses STAT3 activation pathway through induction of protein tyrosine phosphatase SHP-1 in human multiple myeloma cells. Int. J. Cancer 2010, 127, 282–292. [Google Scholar] [CrossRef] [Green Version]
  79. Chen, J.C.; Chiu, M.H.; Nie, R.L.; Cordell, G.A.; Qiu, S.X. Cucurbitacins and cucurbitane glycosides: Structures and biological activities. Nat. Prod. Rep. 2005, 22, 386–399. [Google Scholar] [CrossRef]
  80. Liang, J.; Chen, D. Advances in research on the anticancer mechanism of the natural compound cucurbitacin from Cucurbitaceae plants: A review. Tradit Med Res 2019, 4, 68–81. [Google Scholar] [CrossRef]
  81. Ni, Y.; Wu, S.; Wang, X.; Zhu, G.; Chen, X.; Ding, Y.; Jiang, W. Cucurbitacin I induces pro-death autophagy in A549 cells via the ERK-mTOR-STAT3 signaling pathway. J. Cell. Biochem. 2018, 119, 6104–6112. [Google Scholar] [CrossRef]
  82. Guo, H.; Kuang, S.; Song, Q.L.; Liu, M.; Sun, X.X.; Yu, Q. Cucurbitacin I inhibits STAT3, but enhances STAT1 signaling in human cancer cells in vitro through disrupting actin filaments. Acta Pharmacol. Sin. 2018, 39, 425–437. [Google Scholar] [CrossRef] [PubMed] [Green Version]
Figure 1. The expression levels of signal transducer and activator of transcription 3 (STAT3) along with the pathological stage in cancer. (A) The mRNA expression levels of STAT3 in different cancer types were explored by TIMER. (B) The correlation between the expression of STAT3 and the pathological stage in bladder urothelial carcinoma (BLCA), colon adenocarcinoma (COAD), kidney chromophobe (KICH), kidney renal clear cell carcinoma (KIRC), lung adenocarcinoma (LUAD), and lung squamous cell carcinoma (LUSC) was explored by UALCAN database. The first layer asterisk above the error bar represents a comparison to the normal group, and the secondary layers asterisk above a line represents the comparison between corresponding groups that were covered by the line. * p < 0.05, ** p < 0.01, *** p < 0.001.
Biomolecules 10 00834 g001
Figure 2. The protein expression of STAT3 in normal and cancer tissues. (A) The protein expression of STAT3 in human normal tissues. (B) The percentage of patients with high and medium STAT3 protein expression levels in different cancer types. The blank bar represents low or not detected protein expression. (C) Immunohistochemistry images of STAT3 in colorectal cancer, renal cancer, lung cancer, prostate cancer, and normal tissues detected in the HPA database. (D) Statistical analysis of STAT3 immunohistochemical staining data in normal tissues (n = 3) and colorectal cancer (n = 12, p = 0.007), renal cancer (n = 11, p = 0.006), lung cancer (n = 12, p = NS), prostate cancer (n = 10, p = NS) tissues.
Biomolecules 10 00834 g002
Figure 3. Correlation analysis between STAT3 and immune infiltration level. The correlations between STAT3 and tumor purity, STAT3 and infiltration levels of six TIICs (B-cells, CD4+ T-cells, CD8+ T-cells, macrophages, neutrophils, and dendritic cells) were analyzed respectively by TIMER in BLCA, cervical squamous cell carcinoma and endocervical adenocarcinoma (CESC), COAD, esophageal carcinoma (ESCA), KICH, KIRC, liver hepatocellular carcinoma (LIHC), prostate adenocarcinoma (PRAD), and rectum adenocarcinoma (READ).
Biomolecules 10 00834 g003
Figure 4. The correlation between STAT3 and marker genes of immune cells. The scatter plots showed the correlation between the STAT3 expression level and the gene markers of TAM (CD86, IL10); M2 macrophages (CD163, VSIG4); Th1 (TBX21, STAT1); Treg (FOXP3, STAT5B); T-cell exhaustion (PDCD1, HAVCR2) expression levels in BLCA, KICH, and PRAD.
Biomolecules 10 00834 g004
Figure 5. STAT3 expression and drug response correlation. (A) The volcano plots showed the correlation coefficient (x-axis) and −log10 p-value (y-axis) between STAT3 expression and drug response in 823 cancer cell lines and 545 drugs. The red dots were the drugs with a correlation coefficient greater than 0.2 and a p-value less than 0.05. (B) The histogram showed the ratio of drugs with a correlation coefficient greater than 0.3 and a p-value less than 0.05 in 10 cancer cell line types.
Biomolecules 10 00834 g005
Table 1. The correlation between STAT3 expression and drug response (Top 10).
Primary SiteCompoundCorrelation rp-ValueStatusGene Symbol of Protein TargetTarget or Activity of Compound
Breast
abiraterone−0.9690.031FDACYP17A1inhibitor of 17 alpha-hydroxylase and C17, 20 lyase
bafilomycin A10.7620.046probeATP6V0A1inhibitor of the vacuolar-type H+-ATPase
BRD-K84807411−0.7170.006GE-active product of diversity-oriented synthesis
BEC−0.7050.007probeARG1; ARG2inhibitor of arginase I and II
BRD-K30019337−0.5950.032GE-active product of diversity-oriented synthesis
fulvestrant0.5900.043FDAESR1; GPER1antagonist of the estrogen receptor
MLN2238−0.5240.001clinicalPSMB5inhibitor of 20S proteasome at the chymotrypsin-like proteolytic (β−5) site
BRD-K42260513−0.5240.026probeEZH2inhibitor of enhancer of zeste polycomb repressive complex 2 subunit
SB-5253340.5230.001probeTGFBR1inhibitor of the transforming growth factor beta type 1 receptor
sildenafil0.4740.003FDAPDE5inhibitor of phosphodiesterase type 5
Central nervous system
docetaxel0.6540.006FDA inhibitor of microtubule depolymerization
myriocin−0.6120.012probeSPTLC1; SPTLC2; SPTLC3inhibitor of serine-palmitoyl-transferase
GSK4613640.6040.000clinicalPLK1inhibitor of polo-like kinase 1 (PLK1)
sitagliptin0.5910.016FDADPP4inhibitor of dipetidyl peptidase 4
AT133870.5640.006clinicalHSP90inhibitor of HSP90
vincristine0.5490.000FDA inhibitor of microtubule assembly
rigosertib0.5380.000clinicalPIK3; PLK1inhibitor of polo-like kinase 1; inhibitor of PI3K catalytic subunits α and β
triazolothiadiazine0.5290.000probePDE4A; PDE4B; PDE4Dinhibitor of phosphdiesterase 4A/B/D
BRD-K705115740.5220.000probePLK1inhibitor of polo-like kinase 1 (PLK1)
CHM-10.5220.000probe inhibitor of tubulin polymerization
Hematopoietic and lymphoid tissue
VX-6800.6180.024clinicalAURKA; AURKB; AURKCinhibitor of aurora kinases
staurosporine0.5050.002probe inhibitor of multiple kinases
YM-1550.4300.000clinicalBIRC5inhibitor of survivin expression
BRD-K796694180.3990.000probeMDM2; MDM4inhibitor of MDM4-p53 interaction
ruxolitinib−0.3890.000FDAJAK1; JAK2inhibitor of Janus kinases 1 and 2
ML239−0.3600.000probe inhibitor of breast cancer stem cell proliferation
MK-22060.3560.000clinicalAKT1inhibitor of AKT1
AZD64820.3510.000clinicalPIK3CB; PIK3CDinhibitor of PI3K catalytic subunits beta and delta
sitagliptin0.3490.043FDADPP4inhibitor of dipetidyl peptidase-4
AZD1480−0.3480.011clinicalJAK1; JAK2inhibitor of Janus kinases 1 and 2
Large intestine
JW-55−0.6550.006probeTNKSinhibitor of tankyrase
O-6-benzylguanine−0.5690.017clinicalMGMTinhibitor of O(6)-alkylguanine DNA alkyltransferases
ML210−0.4880.001probe selectively kills engineered cells expressing mutant HRAS
ML162−0.4460.002probe selectively kills engineered cells expressing mutant HRAS
PRL-3 inhibitor I−0.4370.003probePTP4A3inhibitor of phosphatase of regenerating liver-3 (PRL3)
imatinib−0.4320.003FDAABL1; BCR; KITinhibitor of BCR-ABL1 and c-KIT
1S,3R-RSL-3−0.4210.003probeGPX4synthetic lethal with HRAS in engineered cells; inhibitor of GPX4
betulinic acid−0.3960.008probe natural product; inhibitor of specificity protein 1 transcription factor in cells
KH-CB19−0.3910.024probeCLK1; CLK4inhibitor of CDC2-like kinases 1 and 4
palmostatin B−0.3860.026probeLYPLA1inhibitor of acyl-protein thioesterase 1
Lung
GSK-J40.6080.047probeKDM6A; KDM6Binhibitor of lysine-specific demethylases
BRD-K49290616−0.3760.011GE-active product of diversity-oriented synthesis
TGX-221−0.3250.000probePIK3CBinhibitor of PI3K catalytic subunit beta
BRD-K96431673−0.3020.046GE-active product of diversity-oriented synthesis
Ovary
istradefylline0.5860.028clinicalADORA2Aantagonist of the adenosine A2A receptor
BRD-K035361500.5070.001probeBAXactivator of BAX
LY-21832400.4480.005probeFAAHinhibitor of fatty acid amide hydrolase; inhibitor of anandamide uptake
fumonisin B1−0.4470.004probeCERS1; CERS2; CERS3; CERS4; CERS5inhibitor of ceramide synthase
manumycin A0.4370.006probeFNTA; FNTBinhibitor of RAS farnesyltransferase
ML3110.4310.006probeMCL1; Biminhibitor of the Mcl-1/Bim interaction
methotrexate0.4210.010FDADHFRinhibitor of dihydrofolate reductase
SCH-797970.4110.009FDADHFRinhibitor of dihydrofolate reductase
BRD-K949913780.3780.019probeF2Rantagonist of proteinase-activated receptor 1 (PAR1)
ibrutinib−0.3730.047clinicalBTKinhibitor of Bruton’s tyrosine kinase
Pancreas
CIL70−0.5000.034probe screening hit
RITA0.4010.011probeMDM2; TP53inhibitor of p53-MDM2 interaction
sotrastaurin0.4000.028clinicalPKCinhibitor of protein kinase C
NVP-BEZ2350.3860.032clinicalMTOR;PIK3CA; PIK3CB; PIK3CDinhibitor of PI3K and mTOR kinase activity
purmorphamine0.3840.016probeSMOactivator of smoothened receptor
dexamethasone0.3650.022FDANR3C1agonist of glucocorticoid receptor
doxorubicin−0.3630.023FDATOP2Ainhibitor of topoisomerase II
BRD88990.3580.0275probeSTK33inhibitor of serine/threonine kinasase STK33
cabozantinib−0.3550.0290FDAFLT3; KDR; MET; RETinhibitor of c-MET, VEGFR2/3, and RET
PF-7500.3540.0271probeFAAHinhibitor of fatty acid amide hydrolase
Skin
bafilomycin A1−0.9990.023probeATP6V0A1inhibitor of the vacuolar-type H+-ATPase
BRD-K093443090.6620.01probe screening hit
tigecycline−0.5150.029FDA analog of tetracycline
sotrastaurin0.4750.001clinicalPKCinhibitor of protein kinase C
HBX-41108−0.4320.003probeUSP7inhibitor of the deubiquitinase activity of USP7
itraconazole−0.4140.003FDA anti-fungal agent; inhibitor of hedgehog signaling pathway
1S,3R-RSL-3−0.4090.002probeGPX4synthetic lethal with HRAS in engineered cells; inhibitor of GPX4
bleomycin A2−0.4060.005FDA inducer of DNA damage
indisulam−0.3760.008clinicalCA9inhibitor of carbonic anhydrase isoform IX
ML162−0.3710.007probe selectively kills engineered cells expressing mutant HRAS
Stomach
KH-CB190.5670.014probeCLK1; CLK4inhibitor of CDC2-like kinases 1 and 4
cerulenin0.5550.001probeFASN; HMGCS1inhibitor of fatty acid synthase; inhibitor of HMG-CoA synthase
obatoclax0.5540.001clinicalBCL2; BCL2L1; MCL1inhibitor of MCL1, BCL2, and BCL-xL
fingolimod0.5510.001FDAS1PR1inhibitor of sphingosine 1-phosphate receptor
quizartinib0.5390.002clinicalFLT3inhibtor of VEGFR3
ouabain0.5380.001probeATP1A1; ATP1A2; ATP1A3; ATP1B1cardiac glycoside; inhibitor of the Na+/K+-ATPase
B020.5110.003probeRAD51inhibitor of RAD51
darinaparsin−0.5000.029clinical inducer of ROS; inhibitor of microtubule assembly
vorapaxar0.4920.004clinicalF2Rantagonist of proteinase-activated receptor 1 (PAR1)
cyclophosphamide0.4730.047FDA DNA alkylator
Upper aerodigestive tract
JW-550.9980.007probeTNKSinhibitor of tankyrase
BRD-K29086754−0.7350.043GE-active product of diversity-oriented synthesis
nutlin-30.7120.015clinicalMDM2inhibitor of p53-MDM2 interaction
BRD-K49290616−0.6990.000GE-active product of diversity-oriented synthesis
BRD-K48334597−0.6820.017GE-active product of diversity-oriented synthesis
CIL55A0.6780.021probe screening hit
BRD-K34485477−0.6180.008GE-active product of diversity-oriented synthesis
NSC483000.5910.043probeTASP1inhibitor of threonine endopeptidase taspase 1
linifanib0.5890.001clinicalFLT1; FLT3; KDRinhibitor of VEGFRs
tubastatin A−0.5480.001probeHDAC6inhibitor of tubulin deacetylase activity of HDAC6
Table 2. The correlation between STAT3 expression and sensitivity to natural compounds.
Primary SiteCompoundCorrelation rp-ValueStatusGene Symbol of Protein TargetTarget or Activity of Compound
Central nervous system
nakiterpiosin0.3810.013probe natural product; inhibitor of microtubule assembly
cucurbitacin I0.3380.031probe natural product; modulator of NFKB1 and STAT3 signaling
Large intestine
betulinic acid−0.3960.008probe natural product; inhibitor of specificity protein 1 transcription factor in cells
Upper aerodigestive tract
phloretin0.4250.022probeSLC5A1natural product; inhibitor of glucose uptake

