Article

Protective Role of Sphingomyelin in Eye Lens Cell Membrane Model against Oxidative Stress

1
Institute of Biochemistry, University of Greifswald, Felix-Hausdorff-Str. 4, 17489 Greifswald, Germany
2
Leibniz-Institute for Plasma Science and Technology, ZIK Plasmatis, Felix-Hausdorff-Str. 2, 17489 Greifswald, Germany
3
Institute of Bioanalytical Chemistry, Faculty of Chemistry and Mineralogy, Universität Leipzig, Deutscher Platz 5, 04103 Leipzig, Germany
4
Center for Biotechnology and Biomedicine, University of Leipzig, Deutscher Platz 5, 04103 Leipzig, Germany
5
Institute of Physics, University of Greifswald, Felix-Hausdorff-Str. 6, 17489 Greifswald, Germany
*
Authors to whom correspondence should be addressed.
Biomolecules 2021, 11(2), 276; https://doi.org/10.3390/biom11020276
Submission received: 27 January 2021 / Revised: 9 February 2021 / Accepted: 11 February 2021 / Published: 13 February 2021
(This article belongs to the Section Chemical Biology)

Abstract

:
In the eye lens cell membrane, the lipid composition changes during the aging process: the proportion of sphingomyelins (SM) increases, that of phosphatidylcholines decreases. To investigate the protective role of the SMs in the lens cell membrane against oxidative damage, analytical techniques such as electrochemistry, high-resolution mass spectrometry (HR-MS), and atomic force microscopy (AFM) were applied. Supported lipid bilayers (SLB) were prepared to mimic the lens cell membrane with different fractions of PLPC/SM (PLPC: 1-palmitoyl-2-linoleoyl-sn-glycero-3-phosphocholine). The SLBs were treated with cold physical plasma. A protective effect of 30% and 44% in the presence of 25%, and 75% SM in the bilayer was observed, respectively. PLPC and SM oxidation products were determined via HR-MS for SLBs after plasma treatment. The yield of fragments gradually decreased as the SM ratio increased. Topographic images obtained by AFM of PLPC-bilayers showed SLB degradation and pore formation after plasma treatment, no degradation was observed in PLPC/SM bilayers. The results of all techniques confirm the protective role of SM in the membrane against oxidative damage and support the idea that the SM content in lens cell membrane is increased during aging in the absence of effective antioxidant systems to protect the eye from oxidative damage and to prolong lens transparency.

Graphical Abstract

1. Introduction

The oxidation of cellular components such as lipids, DNA and proteins occurs when the level of reactive species is higher than the level of antioxidants in the cells and eventually leads to the loss of cell function [1]. Aging is a process characterized by the gradual loss of tissue and organ functions over time [2]. The age-related loss of function has been connected to the accumulation of damage induced by reactive species. In addition, oxidative stress is involved in several age-related diseases such as neurodegenerative diseases, cancer, cardiovascular diseases and cataract [3,4,5]. Sphingomyelin (SM) represents ~85% of all sphingolipids in humans and it is a structural component of cellular membranes that constitutes 10–20 mol% of total plasma membrane lipids [6,7]. However, higher concentrations of SM are found in nerve tissue, red blood cells and eye lenses [8]. The physicochemical properties of many biological membranes, including those of the human lens, change during aging [9,10], and it has been shown that the hydrocarbon chains of human lens lipids become increasingly more ordered (i.e., fewer gauche kinks and reduced lipid molecular area). The increase in membrane order correlates with an increase of the sphingomyelin fraction and a decrease in phosphatidylcholine [11,12]. There is ample evidence that the ability of the human lens to resist oxidative attack actually decreases with age because total glutathione levels drop and the important enzyme glutathione reductase becomes less stable [13,14]. The increase of oxidation-resistant SM in lens cell membranes suggest a subsequent adaptation aiming to keep the lens clear for a relatively long time and protect the eye from various oxidative stress associated diseases such as cataracts [15]. The cataract is the most common cause of blindness worldwide. It forms due to various noxae such as ultraviolet radiation, nutritional deficiencies, and aging [16]. Reactive oxygen species (ROS) including the hydroxyl radicals (OH), superoxide anion (O2), and H2O2 can contribute to cataract formation. Among these, hydroxyl radicals play an important role in this cascade [17]. Biological membranes are stable but dynamic barriers that play an important role in ROS compartmentalization and related signaling events [18]. Their complexity regarding chemical composition and functionality puts a challenge on the investigation of its role.
To simplify the system, biomimetic membranes such as lipid vesicles [19,20,21,22], supported lipid bilayers (SLB) [23,24,25,26], and freestanding lipid bilayers [27] have been developed [28,29,30]. Of those, SLBs as a lipid bilayer on solid substrate are compatible to various surface-sensitive techniques such as electrochemistry, atomic force microscopy (AFM) and ellipsometry [31,32,33]. Therefore, they provide a powerful platform to study the membrane properties and interaction of reactive species with lipid bilayer [34,35,36]. Various methods have been developed for generating reactive species, such as Fenton reaction [37,38], photolysis [39,40] and cold physical plasma (CPP) [41,42]. CPP as ionized gas with temperature close to human body temperature can be produced by different sources such as plasma jets or dielectric barrier discharges [42,43], and beneficial effects have been shown in several medical applications, including wound healing [44,45], cancer treatment [46,47,48,49] and dental care [50]. In addition to its application in medicine, CPP is a promising experimental source for the production of a variety of reactive oxygen (ROS, e.g., OH, O2, 1O2, H2O2, O, O3) and nitrogen species (RNS, e.g., NO, NO2, ONOO) [51]. The type and amount of reactive species generated by CPP is controlled by various parameters such as composition and flow rate of the feed gas, dissipated power, and electrode geometry [52,53]. Furthermore, the chemical composition of the reactive species generated by the CPP depends on the distance of the plasma source from the target and the type of target [43,54]. Various methods have been developed to study the interaction of reactive species with lipid mono- and bilayers such as infrared reflection absorption spectroscopy (IRRAS) [55], atomic force microscopy [56,57], electrochemistry [58,59,60], and mass spectrometry [61,62,63]. Scholz et al. introduced an electrochemical assay to quantify the oxidative damage of self-assembled monolayers (SAM) on gold electrodes [58]. The membrane properties can also be investigated by electrochemical techniques on a self-assembled lipid monolayer at a hanging mercury drop electrode (HMDE) [64,65]. Moreover, there are several complementary techniques to study the effect of ROS on membrane. Recently, a protocol combining electrochemistry and mass spectrometry has been proposed to monitor the interaction of reactive species with supported POPC bilayers and the protective role of lipophilic antioxidants [66]. While, electrochemical measurements provided a fast information on the residual functionality of the SLB, subsequent high-resolution mass spectroscopy (HR-MS) measurements revealed covalent changes to the molecular structure of the lipids.
In the current study, this approach was applied to shed light on the role of SM in eye lens cell membranes against oxidative damage. AFM complemented the approach, allowing the correlation of functional, chemical, and structural changes. It shows how degradation of amphiphilic molecules alters lipid self-assembly within a membrane, provides a topographic image of the supported lipid bilayer (SLB), and information on oxidative damage in PLPC/SM membranes. Several studies have reported that the amount of sphingolipids in the cell membrane of the mature mammalian eye ranges from 60% to 80% [67,68,69,70]. It was also mentioned that in cataract lens membrane, the ratio of sphingolipids is over 80% [68,71]. Therefore, in the model of the mature lens membrane, 75% sphingomyelin was chosen as the sphingolipid fraction and 25% PLPC represent phosphocholine lipids. The sphingolipid content in the eye lens membrane at birth has been reported to be approximately 30% [71]. Therefore, for the young eye lens cell membrane model 25% sphingomyelin and 75% PLPC was used. 1-palmitoyl-2-linoleoyl-sn-glycero-3-phosphocholine (PLPC (16:0/18:2)) and n-oleoyl-d-erythro sphingosylphosphorylcholine (SM (d18:1/18:1)) were selected because such phospholipids with unsaturated alkyl chains have been reported in mammalian eye lens membrane [72,73] and they are preferred targets of lipid peroxidation during oxidative stress [74]. For this purpose, three solid supported PLPC bilayers with different SM fractions were prepared to mimic the lens cell membranes of the eye during the aging process. Furthermore, a cold physical plasma jet (kINPen®) was used to form a mixture of biologically relevant reactive species. We could show that a higher fraction of SM resulted in a decrease in lipid oxidation products during CPP treatment; and the SLB was more stable and did not show pores.

2. Materials and Methods

2.1. Materials

1-palmitoyl-2-linoleoyl-sn-glycero-3-phosphocholine (PLPC) and n-oleoyl-d-erythro sphingosylphosphorylcholine (SM (d18:1/18:1)) were obtained from Avanti Polar Lipids (Alabaster, AL, USA). Methyl-tert-buthylether (MTBE) and chloroform were purchased from Sigma Aldrich (Taufkirchen, Germany). Potassium ferrocyanide (K4[Fe(CN)6]), disodium hydrogen phosphate (Na2HPO4), and sodium dihydrogen phosphate (NaH2PO4) were obtained from Merck (Darmstadt, Germany). Sodium sulfate was purchased from VWR (Darmstadt, Germany). UPLC-grade methanol, acetonitrile, formic acid, and isopropanol were obtained from Biosolve BV (Valkenswaard, Netherlands). Hydrogen peroxide (30%) and 32% ammonia solutions are from Carl Roth (Karlsruhe, Germany). 50 mM buffer solution of (Na2HPO4/NaH2PO4) (pH = 7.4) was used in the experiments. All chemicals employed were used without further purification. In all solutions and experiments ultrapure water was used (resistivity: 18.2 MΩ.cm, conductivity: 0.055 μS/cm) prepared by Thermo Scientific GenPure pro water purification system (Niederelbert, Germany).

2.2. Plasma Source and Treatment Procedure

A kINPen® (neoplas, Greifswald, Germany) as a CPP source and argon as feed gas (3 standard litres per minute) were used for production of reactive oxygen and nitrogen species [53]. For electrochemistry and mass spectrometry, 10 mL of ultrapure water and for AFM experiments 1.5 mL of ultrapure water covering a solid supported lipid bilayer were treated with CPP. The thickness of the water layer above the supported lipid bilayer was set to 1.8 cm. The distance between plasma nozzle and water/air interface was 9 mm.

2.3. Liposome Solution Preparation and Characterization

The desired amounts of PLPC, PLPC:SM (3:1 molar ratio) and PLPC:SM (1:3 molar ratio) were dissolved in chloroform. The lipid films were prepared by evaporation of solvent under constant nitrogen stream. Then the sample was placed in a desiccator for 45 min to remove the rest of solvent from the lipid film. The samples were suspended in 50 mM phosphate buffer (pH 7.4), and liposomes were prepared by sonication (tip sonicator from Hielscher Ultrasonics GmbH, Teltow, Germany) for 45 min in ice. Afterwards, the liposome solutions were centrifuged for 10 min at 14,000 rpm to remove titanium debris produced during the sonication procedure. The size distribution of the obtained SUVs was measured by dynamic light scattering (Zetasizer Nano-ZS (Malvern Instruments), Herrenberg, Germany). The final lipid concentration in the liposome solutions was 0.5 mg·mL−1 [75].

2.4. Preparation of Flat Gold Surfaces

The surface of a polycrystalline gold electrode (Ø 2 mm; Metrohm, Filderstadt, Germany) was cleaned by mechanical polishing with Al2O3 powder (Buehler, Esslingen, Germany); grain sizes 300 and 50 nm), and electrochemical cleaning by cyclic voltammetry (CV) from 0 to 1.5 V in 0.1 M H2SO4 at 0.1 V s−1 for about 40 cycles. Moreover, by additional 10 cycles in 0.1 M H2SO4 from 0.75 to 0.2 V at 0.1 V·s−1 the gold oxides were removed from the surface of the electrode [66,76].

2.5. Fabrication of Solid Supported Lipid Bilayers

Lipid bilayers on gold surface were formed by potential assisted vesicle fusion [75]. Briefly, the liposome solution was added to the electrochemical cell. Then, liposomes rupture was induced by cyclic voltammetry with slow potential scans (5 mV·s−1) between 0.4 and −0.8 V vs. Ag/AgCl for at least 4 h. After lipid bilayer formation on gold surface, the rest of liposomes was replaced by ultra-pure water for plasma treatment experiments [59,75].

2.6. Electrochemical Measurements

Cyclic and differential pulse voltammetric measurements were performed in 10 mM solution of K4[Fe(CN)6] in 50 mM phosphate buffer (pH 7.4). A potential range from −0.3 V to +0.7 V vs. Ag/AgCl and a scan rate of 50 mV·s−1 was applied (Autolab PGSTAT 20 and Eco Chemie IME 303, Metrohm AG, Filderstadt, Germany) [59]. The modified gold electrode, a platinum electrode and an Ag/AgCl (3 M KCl) electrode were used as working electrode, counter electrode, and reference, respectively. Data were recorded with NOVA 2.0 software (Metrohm AG, Filderstadt, Germany). Each lipid bilayer preparation and electrochemical experiment was repeated at least three times (n = 3). Data analysis was performed with OriginPro 2019 (OriginLab Cooperation, Northampton, MA, USA).

2.7. Lipid Bilayer Extraction

PLPC, PLPC:SM (3:1 molar ratio) and PLPC:SM (1:3 molar ratio) lipid bilayers were collected from the surface of the electrode after addition of 2 mL MTBE. After shaking the solution for 15 min, aqueous (water) and organic (MTBE) phases appeared and the MTBE phase was separated. Then, MTBE was removed under constant nitrogen stream, and the obtained lipid film was kept at −80 °C. Prior to liquid chromatography and mass spectrometry, the dried lipids were dissolved in isopropanol (final concentration was 100 nM).

2.8. Liquid Chromatography-Tandem Mass Spectrometry Analysis

To perform the chromatographic separation a Vanquish Focused+ UHPLC (Thermo Fisher Scientific, Bremen, Germany) system equipped with Accucore C18 column (150 mm × 2.1 mm; 2.6 µm; Thermo Fisher Scientific, Bremen, Germany) was employed. The column temperature was at 50 °C and the flow rate was 300 µL/min. Eluent A was acetonitrile:water (50:50, v/v), and eluent B was isopropanol:acetonitrile:water (85:10:5, v/v), both containing 0.1% formic acid and ammonium formate (5 mmol/L). The elution gradient was: 0–20 min ramp from 10% to 86% B, 20–22 min ramp to 86% to 95% B, 22−26 min 95% B, and the column was then re-equilibrated at 10% B for 8 min. LC was coupled on-line to Q Exactive Plus Hybrid Quadrupole-Orbitrap Mass Spectrometer (Thermo Fisher Scientific, Bremen, Germany) operated in positive ion mode. The S-lens radio frequency (RF) level was set to 35%. Capillary temperature was set to 300 °C, and the aux gas heater temperature was 370° C. Sheath, aux and sweep gas flow rates were set to 40, 10 and 1 arbitrary units, respectively. Data-dependent acquisition (DDA) settings: the full-scan mode (scan range mass to charge ratio (m/z) 400 to 1200) was acquired at a resolution of 140,000 (at m/z 200). Automatic gain control target was set to 3 E6 and maximum injection time was 100 ms. The MS/MS spectra were acquired at a resolution of 17,500 (at m/z 200) for top 15 most intense ions in each MS survey scan. Selected precursors were subjected higher-energy collisional dissociation (HCD) using stepped normalized collision energy (15, 20, 30), isolation width of 1.2 Da, automatic gain control target of 1 E5, maximum injection time of 60 ms, and selection intensity threshold of 3.3 E3. All spectra were acquired in profile mode. Data were analysed using Xcalibur (Thermo Fisher Scientific; version 4.0) and quantification was performed with Lipostar (Molecular Discovery; version 1.0.7). The graphs were prepared by GraphPad Prism 7 and the chemical structures of PLPC and SM were drawn by MarvinSketch© software (version 18.8.0).

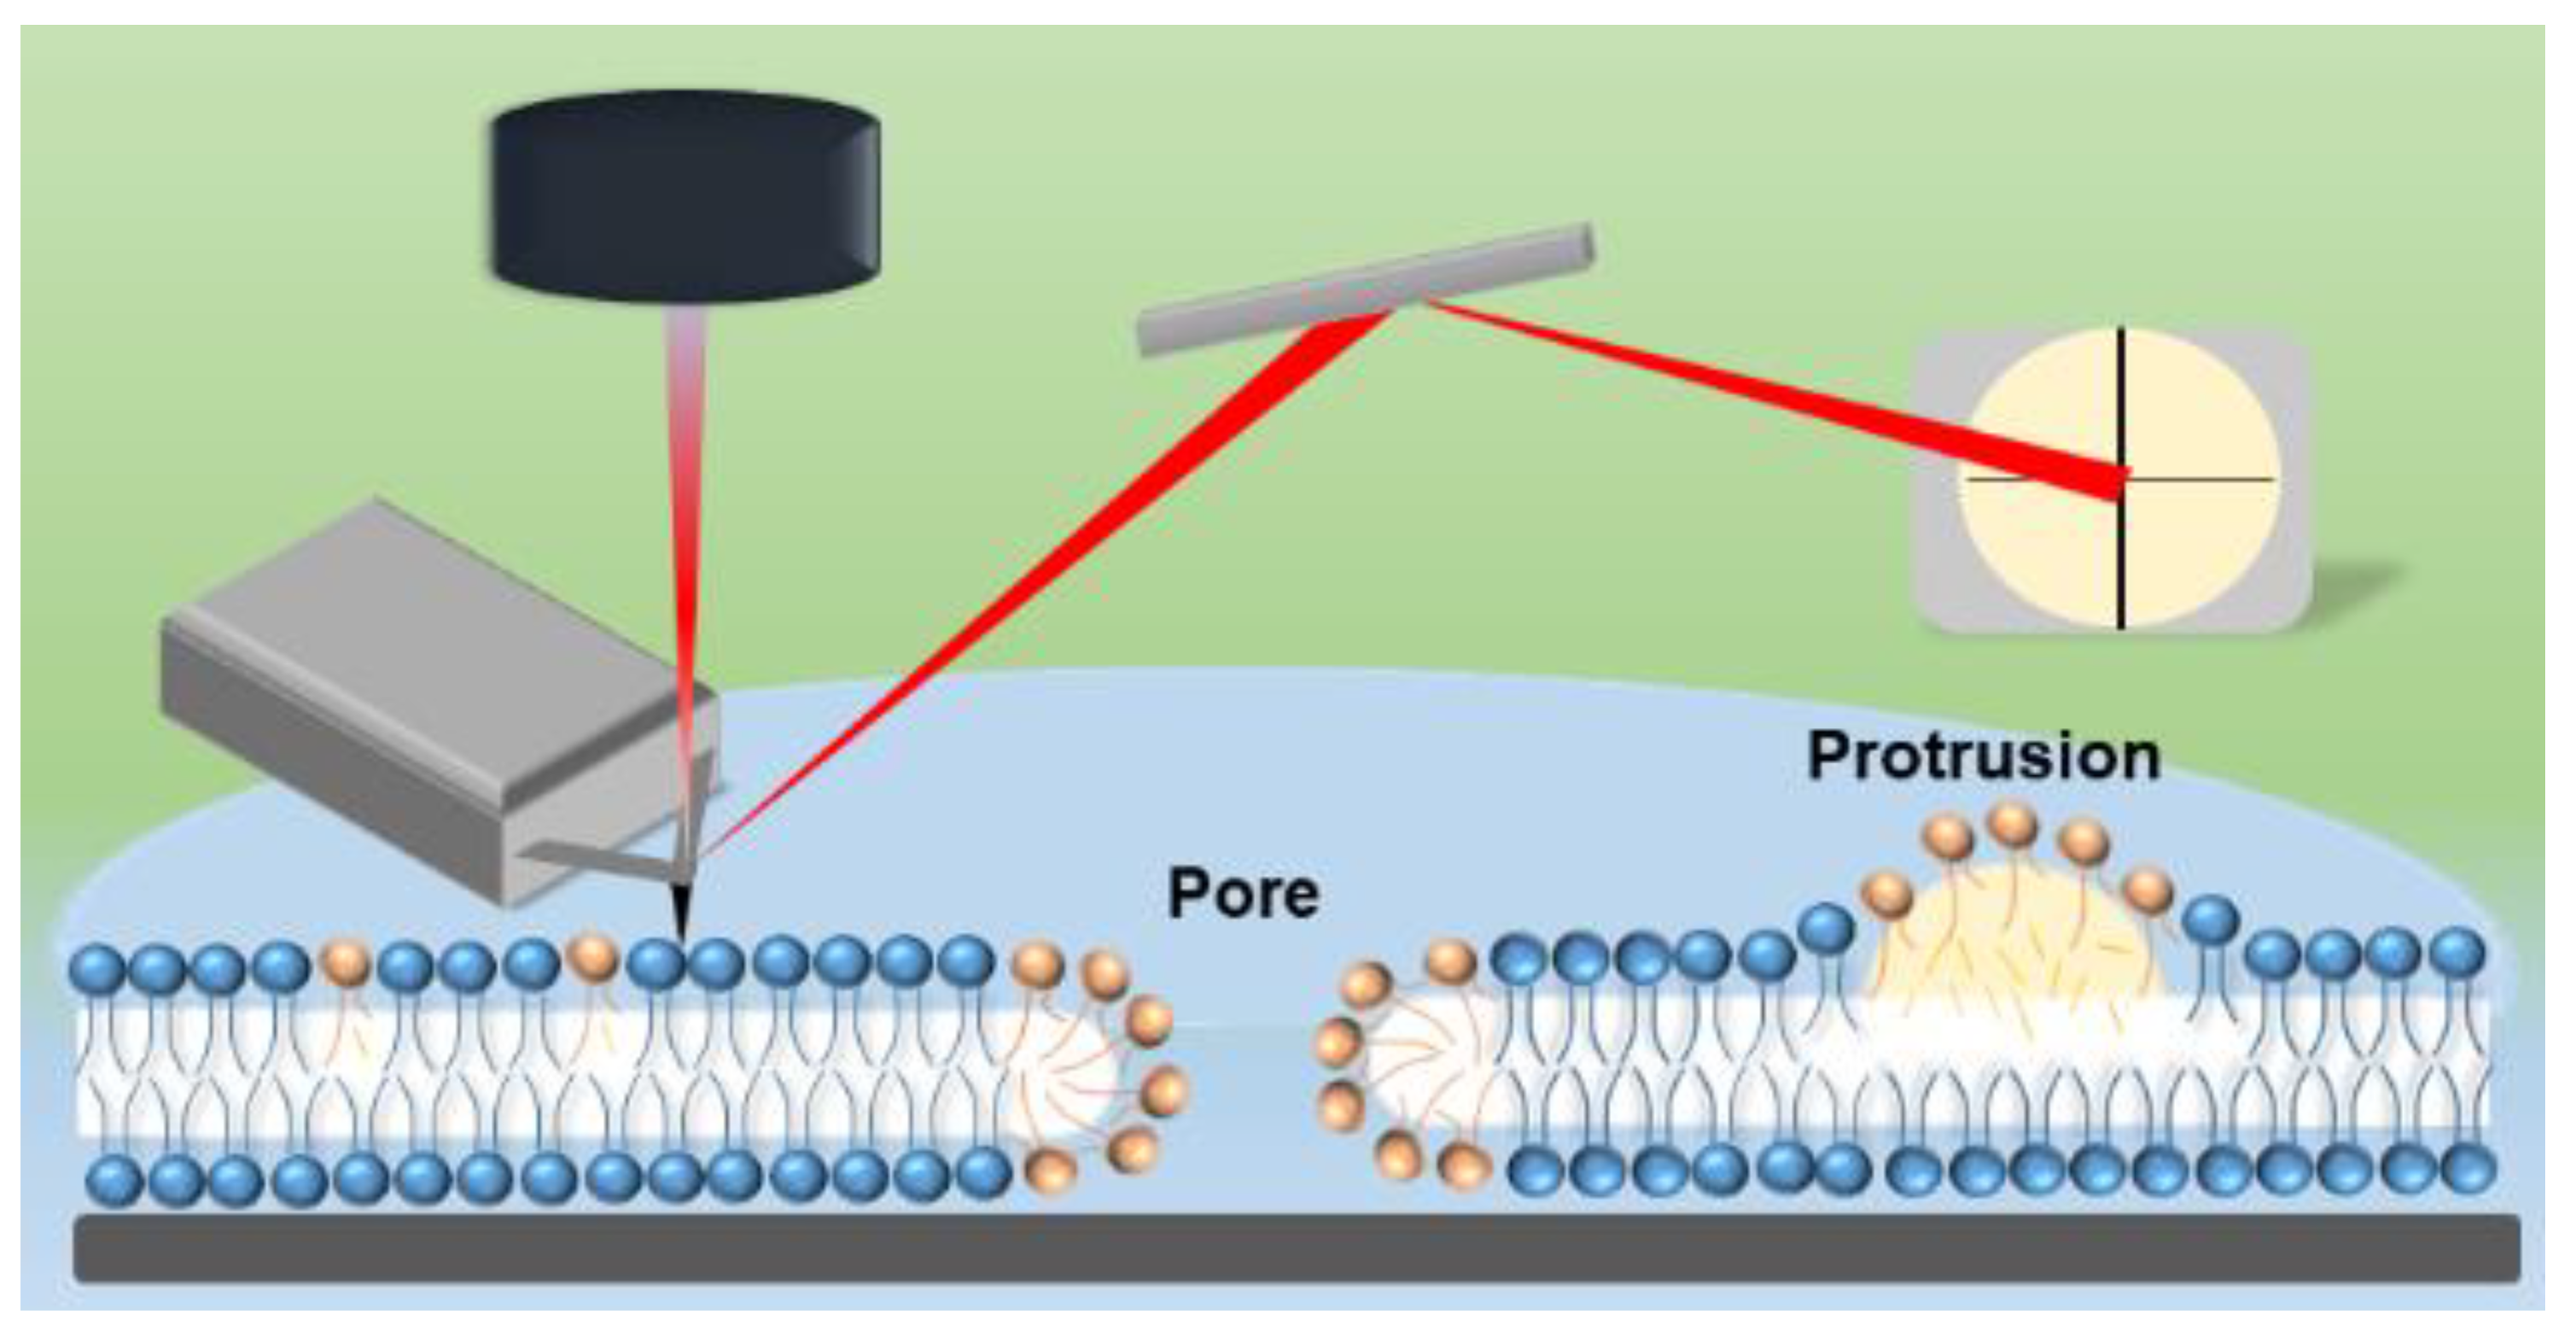
2.9. Atomic Force Microscopy (AFM) Imaging and Analysis

Single side polished silica (100) wafers (Silicon Materials, Kaufering, Germany) were used as a support of lipid bilayer for AFM studies. The RCA-1 cleaning protocol was used for cleaning of silica substrate. Briefly, silica wafers were immersed in a mixture of 30% hydrogen peroxide, 32% ammonia solution and ultrapure water in a ratio of 1:1:5, and heated to 75 °C for 15 min. Then, the silicon wafers were washed several times with ultrapure water [77,78]. The lipid bilayer on silicon substrate was prepared by incubation of 0.5 mg/mL of liposome solution with substrate for 45 min, afterwards the remaining liposomes were removed by rinsing with buffer solution. The AFM imaging of samples in buffer solution was performed in a Bioscope Resolve by FESP-V2 cantilevers (Bruker, Raunheim, Germany) in tapping mode. Surfaces of 5 µm × 5 µm were measured from three different locations of each lipid bilayer. The Nanoscope analysis software version 1.9 was used to process the images.

3. Results and Discussion

3.1. Role of SM in Size and Stability of Liposomes

Liposomes were prepared by sonication and their sizes were determined by dynamic light scattering (DLS) confirming the formation of small unilamellar vesicles (SUV) with an average radius of 76.3 ± 1.2 nm, 75.8 ± 0.7 nm and 96.1 ± 1.2 nm for PLPC, PLPC:SM (3:1) and PLPC:SM (1:3), respectively (Table 1). The results indicated that at a lower fraction of SM, the size of liposomes is almost similar to PLPC but there is an increase in radius of liposomes with 75% SM. Since similar sonication energy (60-Hz repetition frequency and a duty cycle of ~50%) was used for all liposomes, it seems this energy is not enough to make smaller size of SM-rich liposomes (PLPC:SM (1:3)) due to increase in number of hydrogen bonds between the head groups within the lipid bilayer [79]. A higher sonication energy was avoided to minimize the oxidation of lipids during liposome preparation.
The stability of liposomes was studied by potential assisted vesicle fusion [80]. The formation of a lipid bilayer on the gold surface was monitored by cyclic voltammetry (CV) based on oxidation and reduction peaks of ferrocyanide/ferricyanide as a redox probe. In this one-electron redox reaction, the ferrocyanide ion [Fe(CN)6]4− is a reductant and the ferricyanide ion [Fe(CN)6]3− is an oxidant [81]. The chemical equation for this reaction is as follows:
[ Fe ( CN ) 6 ] 4   [ Fe ( CN ) 6 ] 3   +   e .
The oxidation/reduction current of the redox probe reflects non-covered areas of the electrode and the resulting electron transfer between this area and the redox probe. When the electrode surface is completely covered with lipid bilayer, no electrons can be exchanged between the gold electrode and the redox probe, i.e., the oxidation/reduction of the redox probe is blocked. The results (Figure 1) indicate a complete coverage of the gold electrode with PLPC bilayer. The rupture of PLPC liposomes is consistent with the almost complete disappearance of the oxidation and reduction peaks of the redox probe. However, for PLPC/SM lipid bilayers the peak current was increased compared to PLPC lipid bilayers confirming the higher stability of PLPC/SM liposomes, which led to a lower coverage of the electrode surface. The role of SM lipids in increasing the mechanical stability of liposomes [79] is also confirmed by the electrochemistry results.

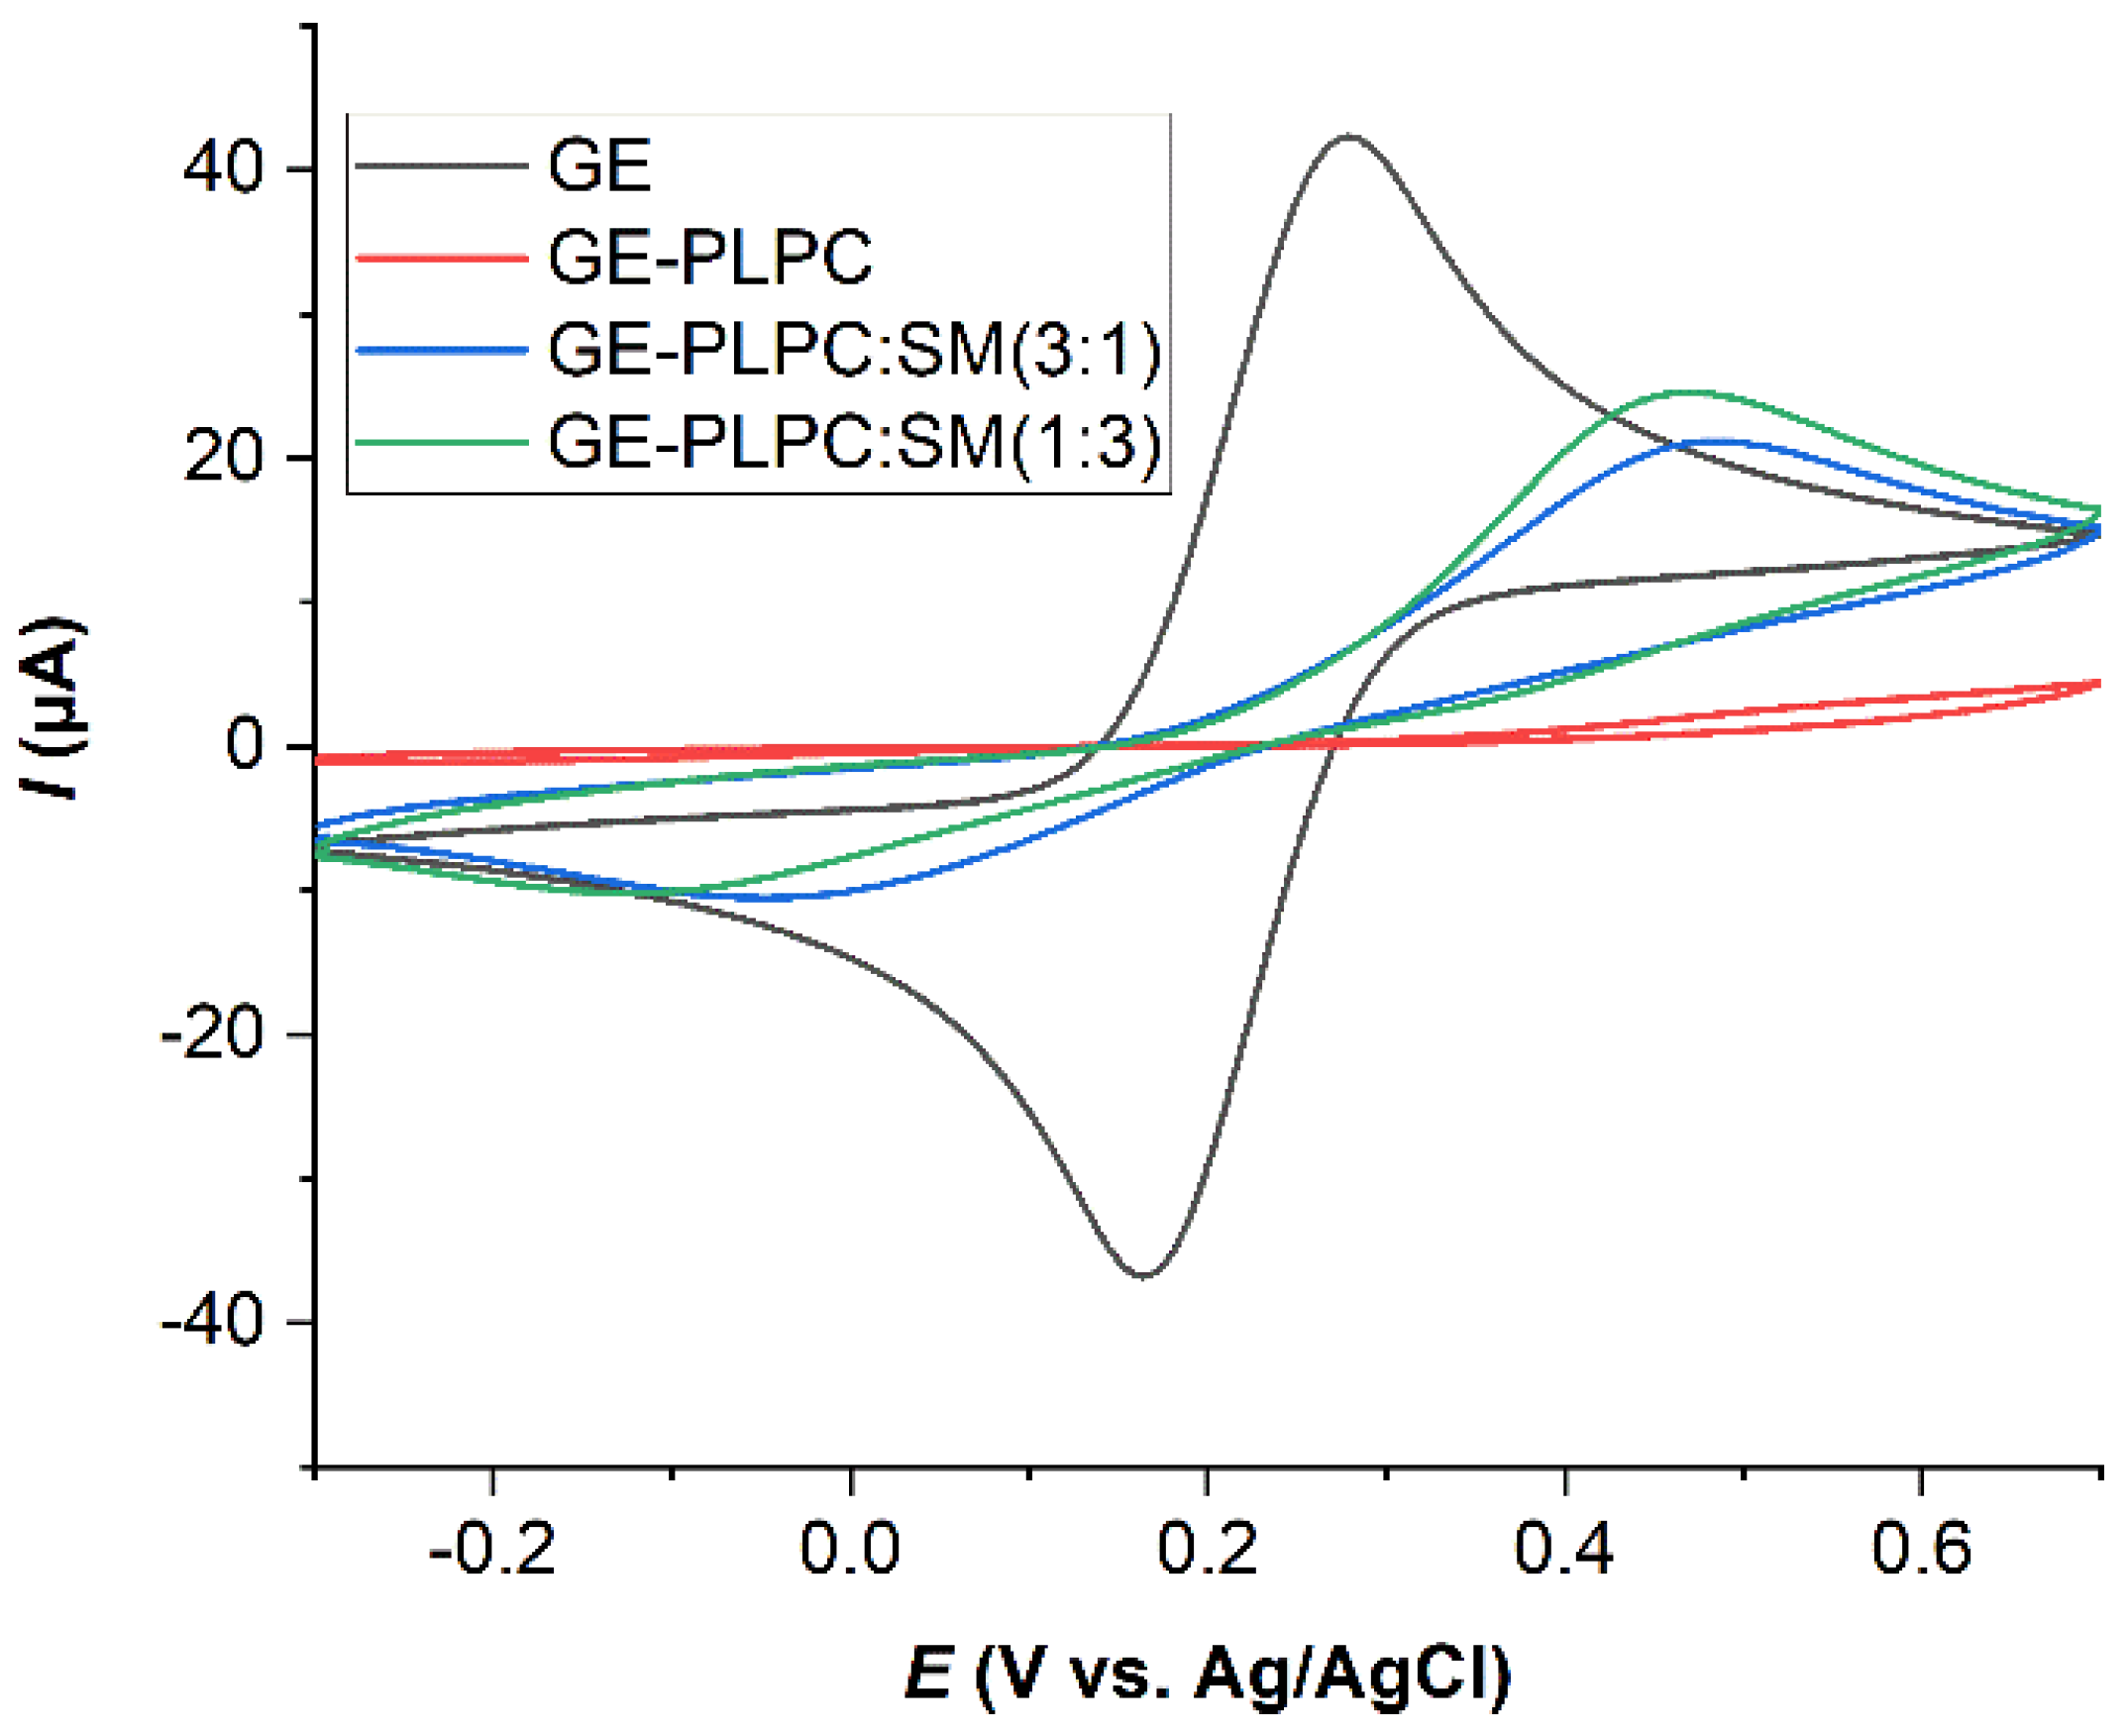
3.2. Effect of ROS on Model Eye Lens Cell Membrane in Presence and Absence of SM: Electrochemistry

Differential pulse voltammetry (DPV) was used to monitor the protective role of SM against oxidative stress in SLBs inspired by the eye lens cell membrane (Figure S1). Supported PLPC lipid bilayers with different fraction of SM were treated for 30 min by reactive species generated by CPP. The normalized recovery of oxidation peak current of redox system after treatment of PLPC-lipid bilayers with different fraction of SM was calculated with the following equation:
A = (ItIcov)/Ig.
where It (µA) and Icov (µA) are the peak currents of redox probe after and before plasma treatment of lipid bilayers, and Ig (µA) is the peak current of redox probe at the bare gold electrode.
The highest normalized recovery of peak current (Figure 2) of redox system (APLPC) was recorded for plasma treated PLPC lipid bilayer. The high peak current indicated that the molecules of the redox probe are capable of migrating and diffusing through the lipid bilayer and reaching the gold electrode. This indicates substantial damage of the lipid bilayer and possible pore formation. In contrast, the PLPC/SM-lipid bilayers show a decrease in normalized recovery peak current of redox system (APLPC:SM), indicating that SM molecules protect lipid bilayers during oxidative stress. The protection in presence of SM could be due to structural interaction of SM and PLPC molecules. Since there is an amide and hydroxyl group in the head groups of SM for accepting and donating hydrogen, hydrogen bonding between PLPC and SM lipids in membrane occurs. Such attractive force reduces the penetration of reactive species into the membrane and decreases the oxidation damage in the alkyl chains [71,82].
The protective effect of SM in model membranes was calculated by using the following (Equation (3)):
% Protective effect = [(APLPCAPLPC:SM)/APLPC] × 100.
where APLPC and APLPC:SM are the normalized recovery peak currents of redox system obtained after plasma treatment of lipid bilayer in absence and presence of SM, respectively. The electrochemical results indicated a protective effect of 30% and 42% in presence of 25% and 75% SM in lipid bilayer, respectively. These observations indicate the ability of the SM to protect lipid bilayer during oxidative stress.

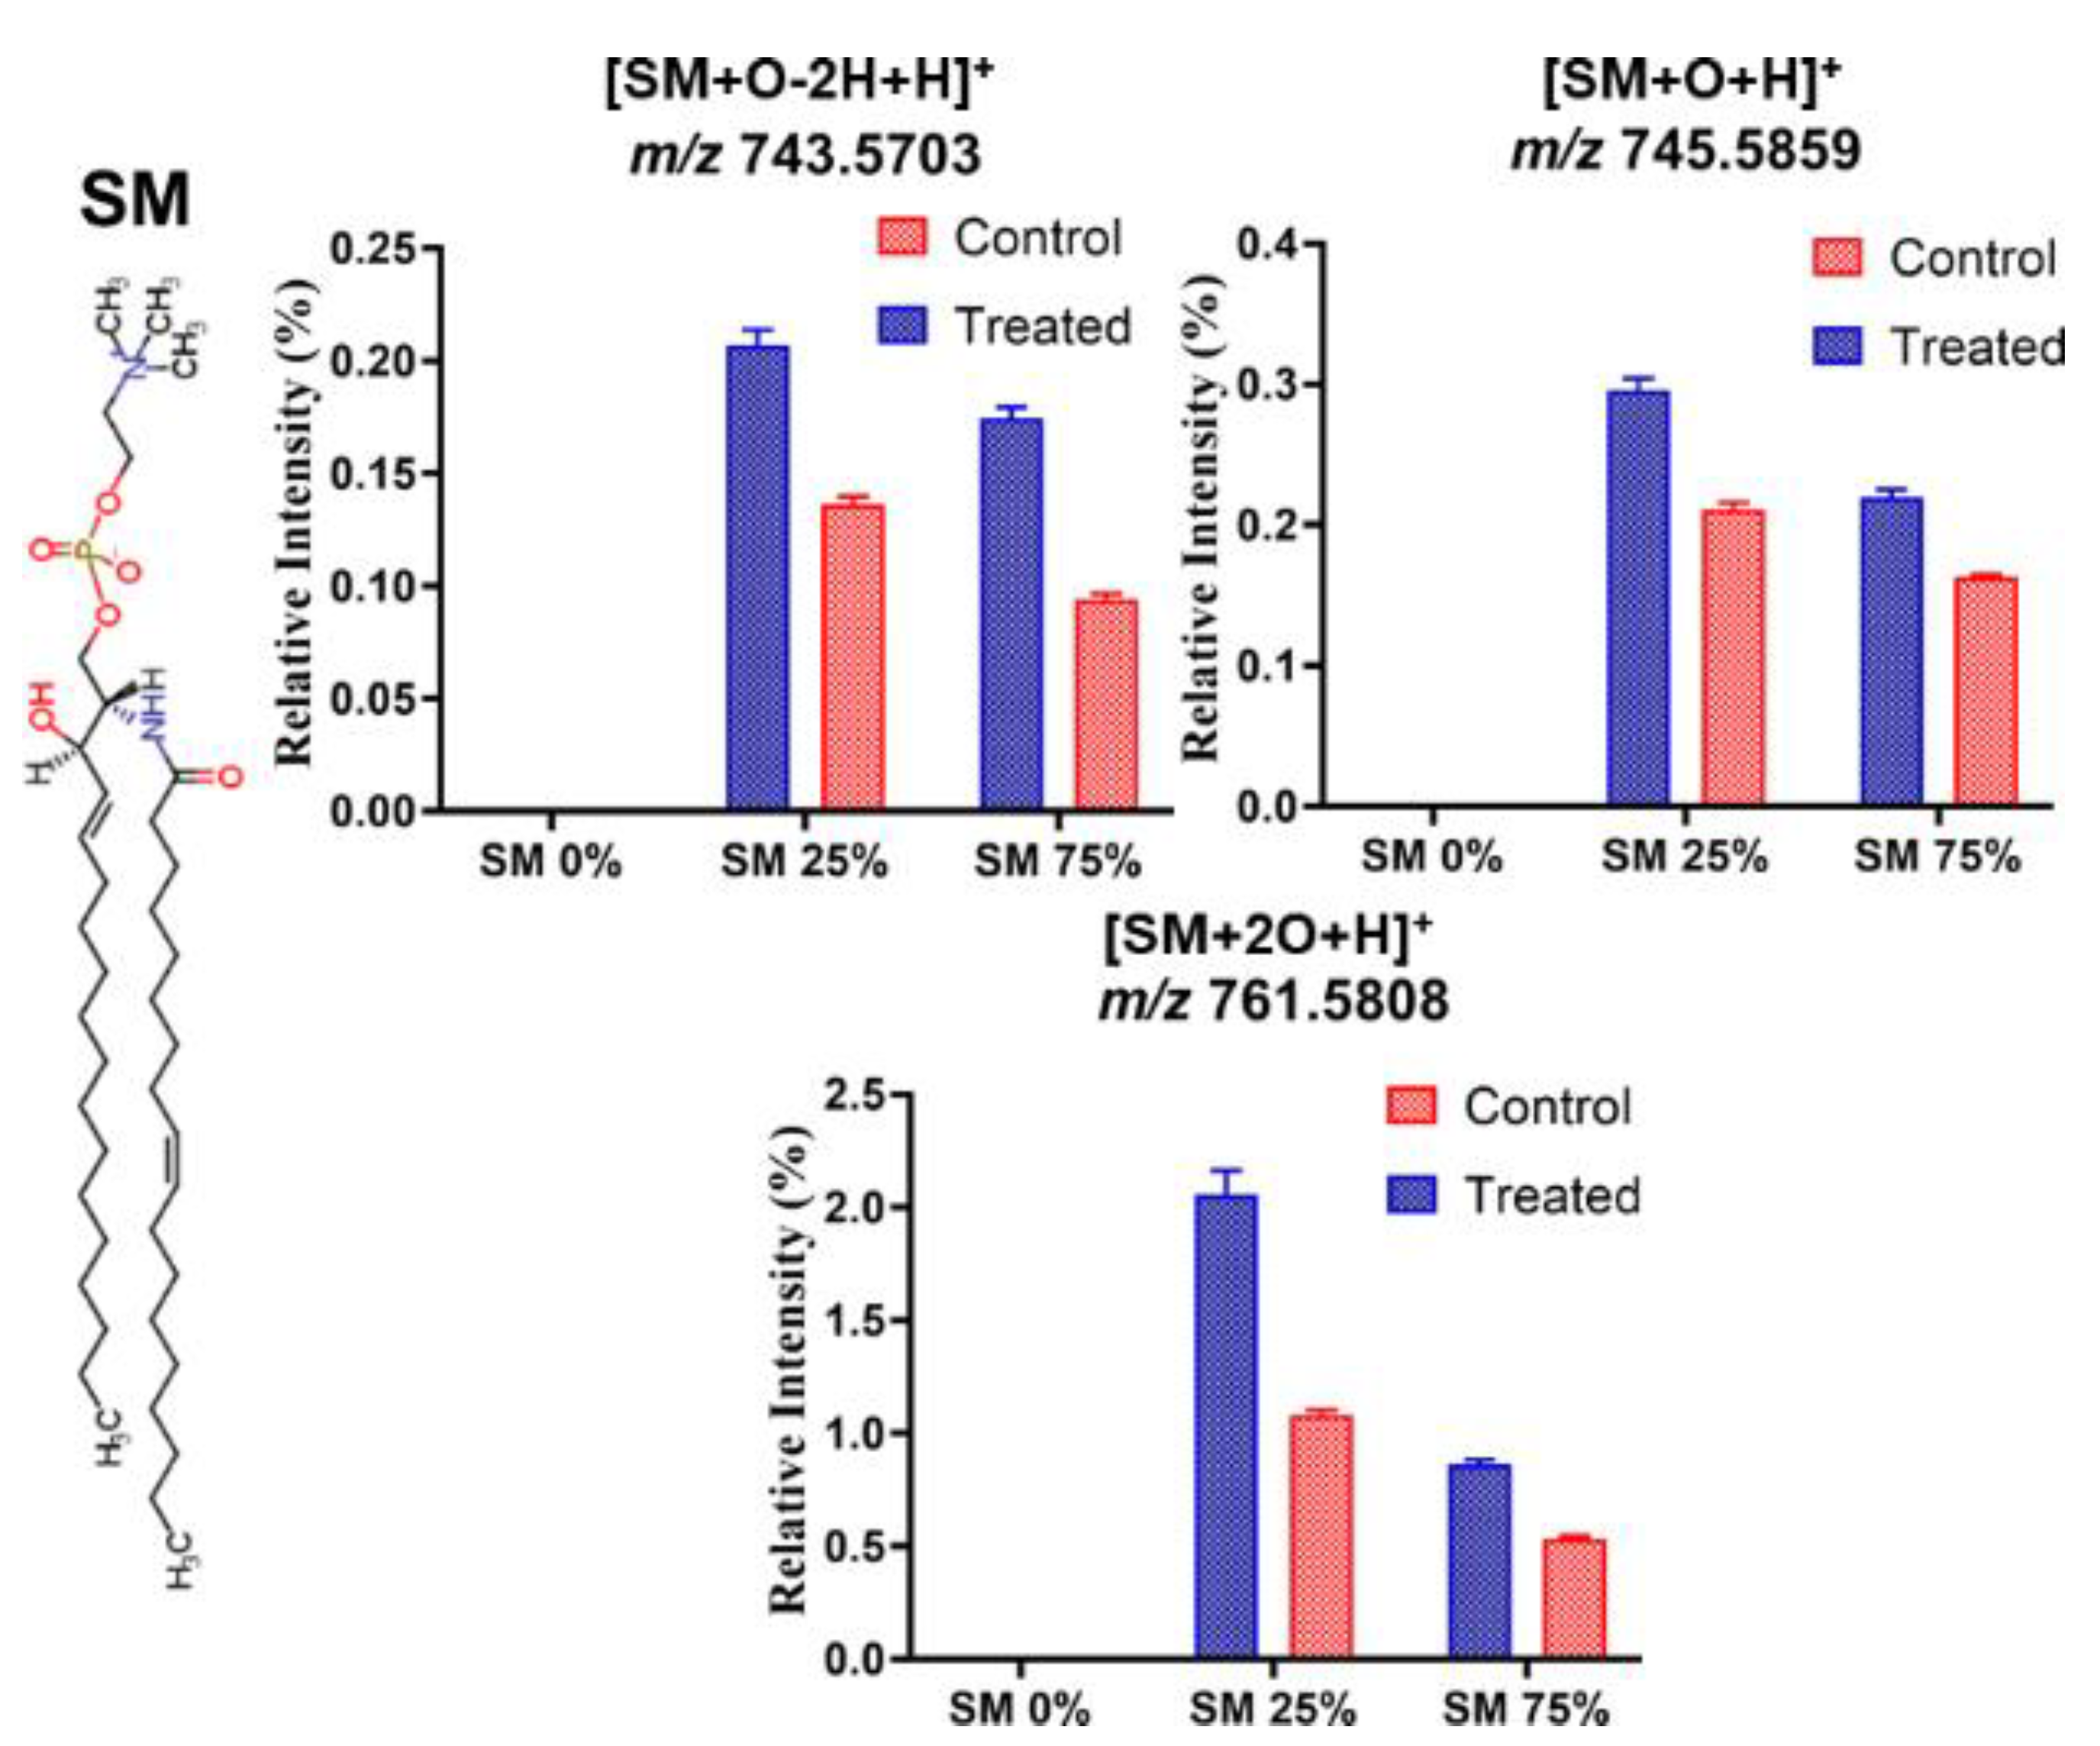
3.3. Effect of ROS on Model Eye Lens Cell Membrane in Presence and Absence of SM: HR-Mass Spectrometry

While electrochemistry was used to measure the oxidative damage over the entire lipid membrane, subsequent high-resolution mass spectroscopy experiments revealed changes at the molecular level due to the impact of ROS. A significant increase in the occurrence of oxidation products was observed for PLPC and SM as identified by tandem mass spectrometry. Predominantly, various PLPC peroxidation products were detected (Table 2). Among those, the signals at m/z, 496.3403, and 650.4396 in positive mode were attributed to formation of 1-palmitoyl-2-hydroxy-sn-glycero-3-phosphocholine (LysoPC 16:0, “LysoPC”) and 1-palmitoyl-2-(9′-oxo-nonanoyl)-sn-glycero-3-phosphocholine (PoxnoPC 16:0_9:0 <oxo>, “PoxnoPC”), respectively. PoxnoPC as a PLPC derived aldehyde was the most abundant peroxidation product after CPP treatment. The number of lipid fragments observed (Figure 3) illustrate that the formation of PLPC oxidation products correlates inversely with the fraction of SM in the lipid bilayer and the relative abundance of PLPC oxidation products decreased with increasing fraction of SM in lipid bilayer. The protective effect of SM in PLPC bilayers also reduced the auto-oxidation of the control samples. However, the oxidation products differed from the plasma-treated ones due to the different oxidation process by ambient oxygen.
In addition, the effect of ROS on SM molecules in PLPC/SM lipid bilayers was studied (Figure 4). The peaks at m/z, 743.5703, 745.5859, and 761.5808 in positive mode were attributed to addition of keto (SM + O − 2H), hydroxyl (SM + O), and hydroperoxyl (SM + 2O) groups to SM molecules after plasma treatments of PLPC/SM SLBs. No significant difference in lipid aldehyde formation from SM lipids was observed before and after plasma treatments of PLPC/SM lipid bilayers. The relative abundance of SM-derived oxidation products is much lower than found for PLPC. This shows the protective role of SM not only for PLPC but also for SM molecules in lipid bilayers. The suggested mechanism is the formation of a hydrogen bonding network in the head group region of the membrane in presence of SM molecules, thus limiting the access of reactive species to the alkyl chains within the lipid bilayer. In addition, the double bond in SM is in trans configuration, and with an α-positioned electron-drawing hydroxyl group less reactive as the aliphatic double bond(s) in fatty acid chains like in the PLPC [74].
To quantify the damage of the lipids on a molecular level, we defined total oxidation as the sum of lipid peroxidation product (LPP) peak areas relative to the respective peak area of non-oxidized parent lipid of the same sample. Total oxidation versus bilayer composition shows the relationship between lipid peroxidation products (LPP) formation rates and SM ratio in supported lipid bilayers (Figure 5). The highest total oxidation was observed in SLB formed from PLPC only. The total oxidation of PLPC (Figure 5a) decreased monotonously with increasing SM content of the bilayer (78%, 55%, and 42%, respectively). The protective effect of SM for PLPC was calculated with Equation (4).
% Protective effect = [(TPLPCTPLPC:SM)/TPLPC] × 100
where TPLPC and TPLPC:SM are the total oxidation of PLPC, and PLPC with different SM fraction, respectively.
The protective effect increased with SM fraction (29% and 46% for lipid bilayers with 25% and 75% SM, respectively). The total oxidation of SM was lower than that of PLPC. This was expected from the low relative intensity of the LPPs derived from SM molecules (Figure 4). The dependence of the protective effect on SM fraction in PLPC bilayers is in agreement with electrochemical results (30% and 42% for lipid bilayers with 25 and 75% SM, respectively). Electron paramagnetic resonance (EPR) studies on similar set up in our previous work indicated that the hydroxyl radical, superoxide anion and hydrogen peroxide are the main reactive species produced in aqueous phase during plasma treatment [66]. Interestingly, these reactive species play a significant role in cataract formation in eye [17]. Several reports indicated that hydrogen peroxide does not generate a direct oxidative damage in lipid bilayer [66,83]. Therefore, short-lived reactive species play the dominant role in PLPC oxidation. Furthermore, Coliva et al. showed a similar protection effect of SM, especially concerning the dependence of LPP formation rates on molar fraction of SM in liposomes [59]. Borchman and Yappert reported a linear relationship between sphingolipids content and hydrocarbon chain conformational order. When the trans-rotamers in the alkyl chains of the lipids increase, the lipid bilayers may be more closely packed leading to an increased van der Waals attraction. In contrast, in a disordered lipid bilayer the percentage of gauche-rotamers increases [71].

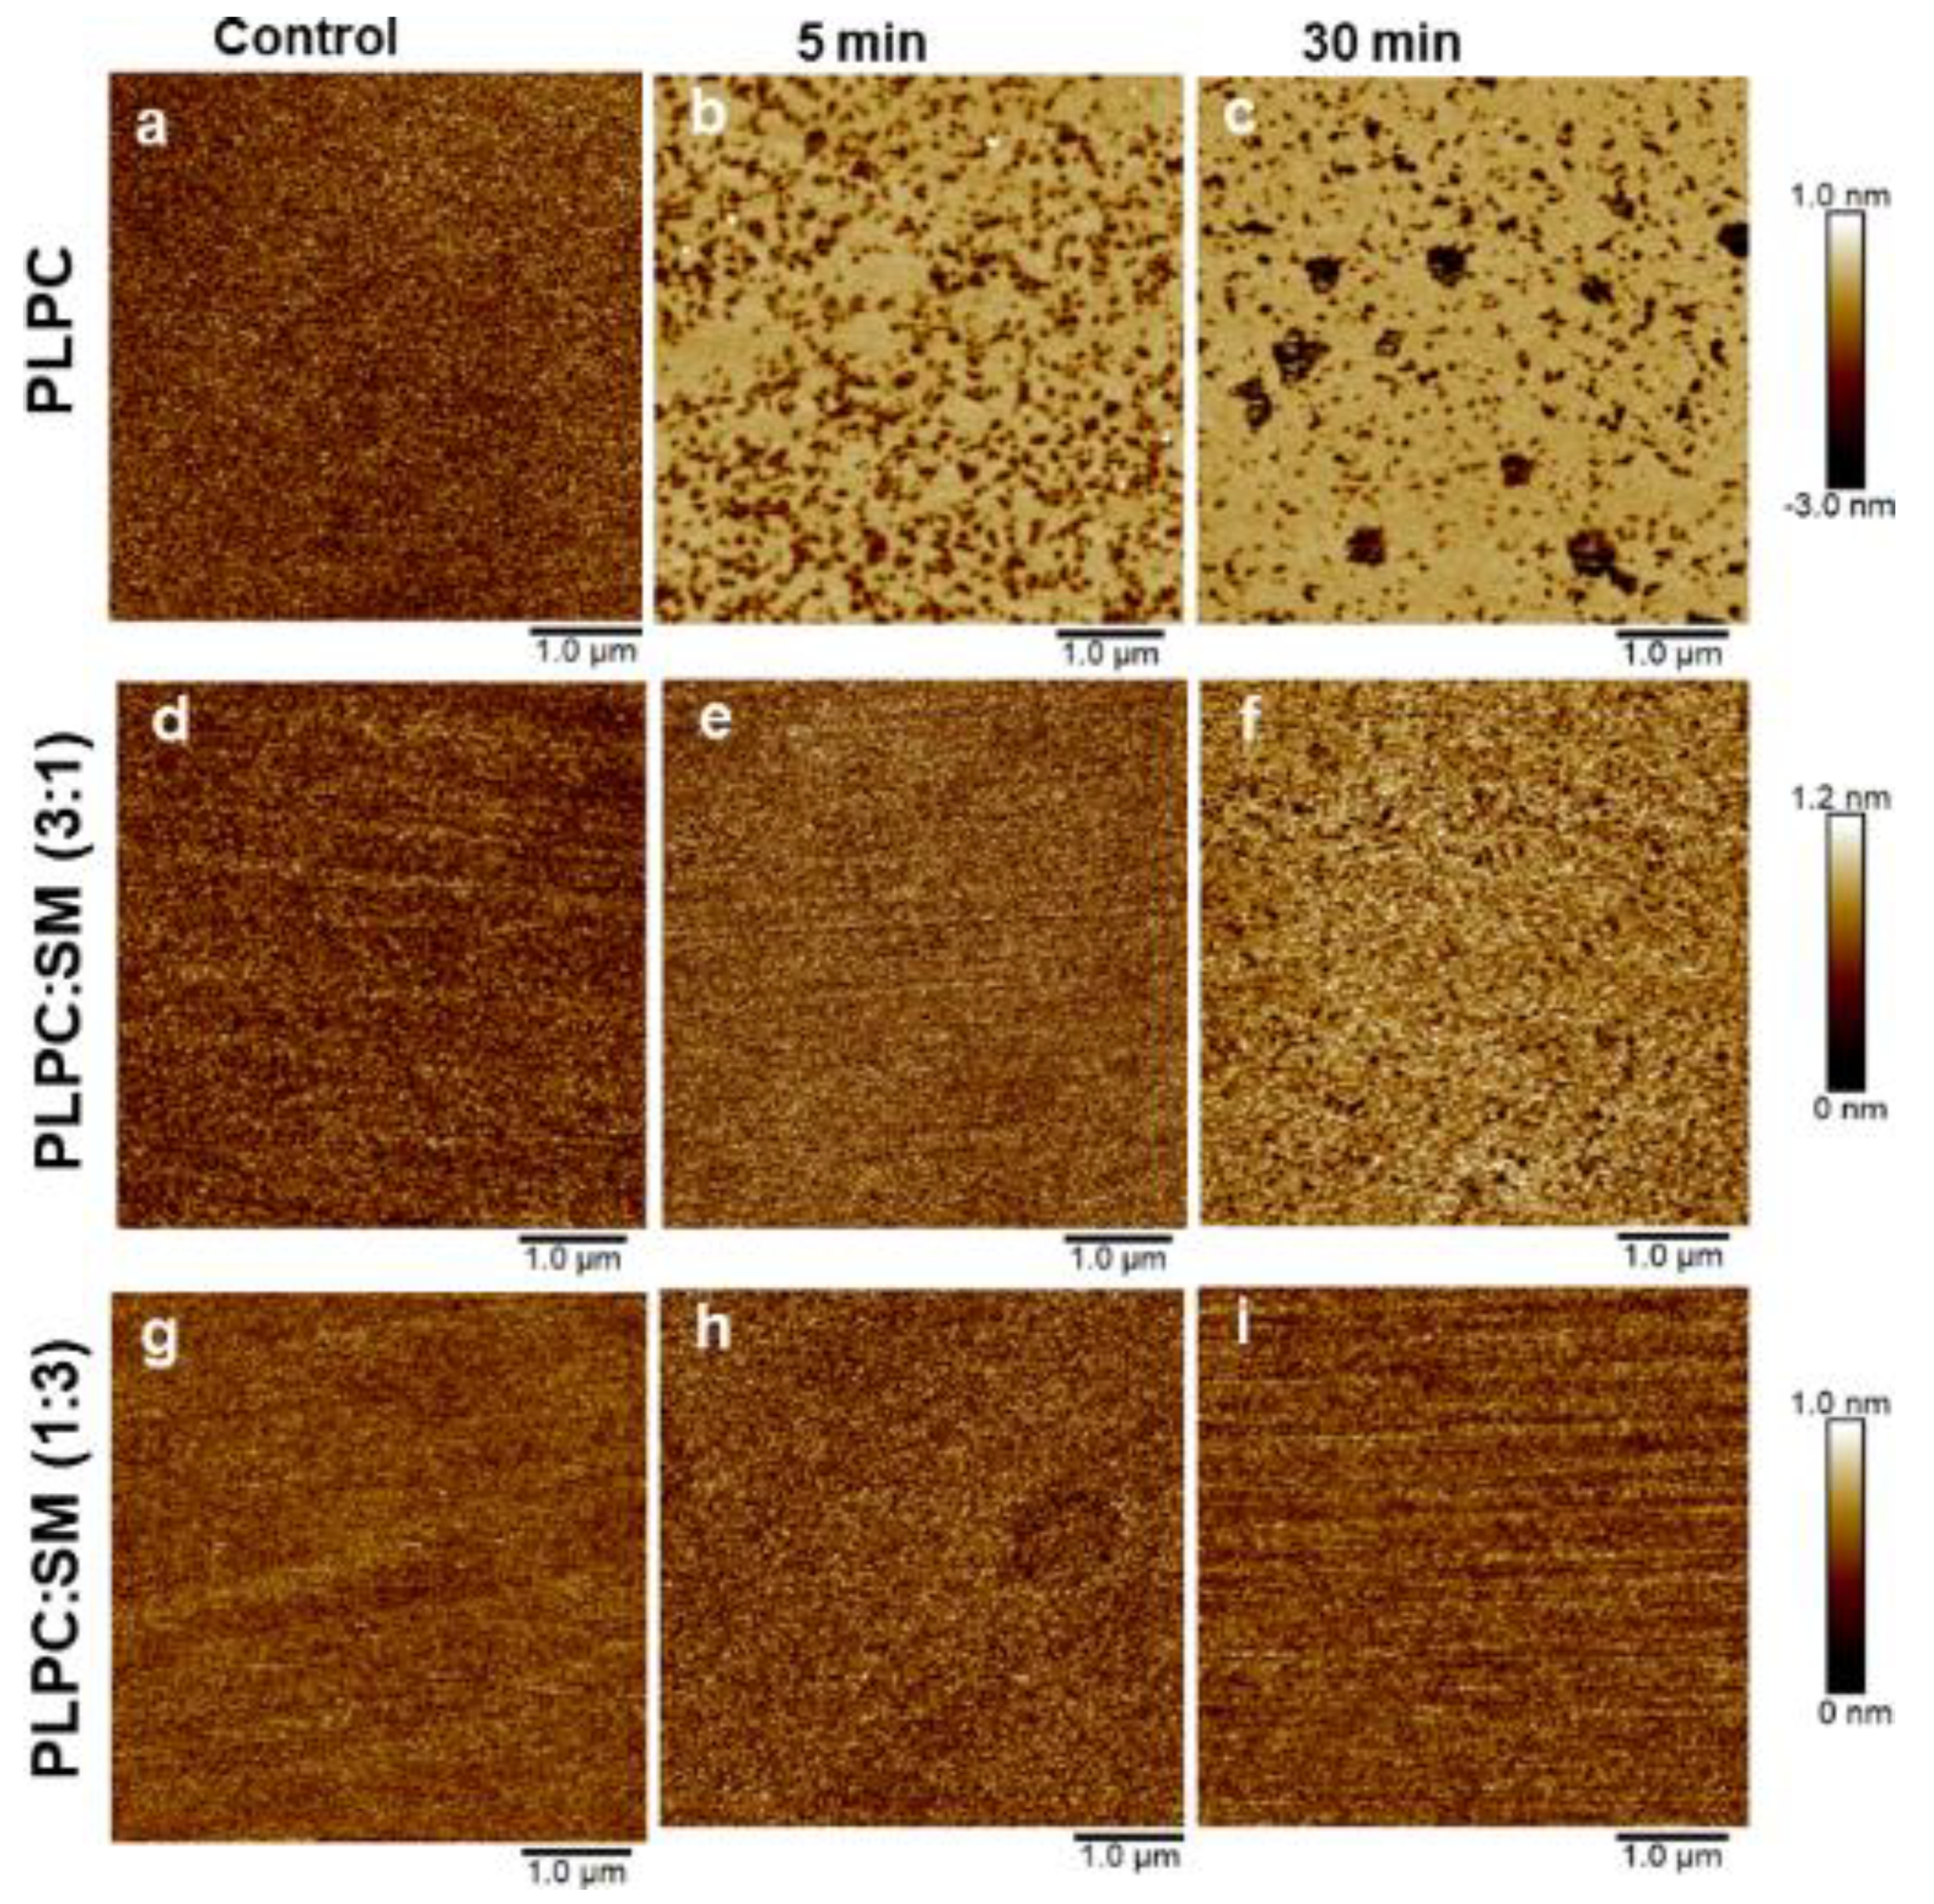
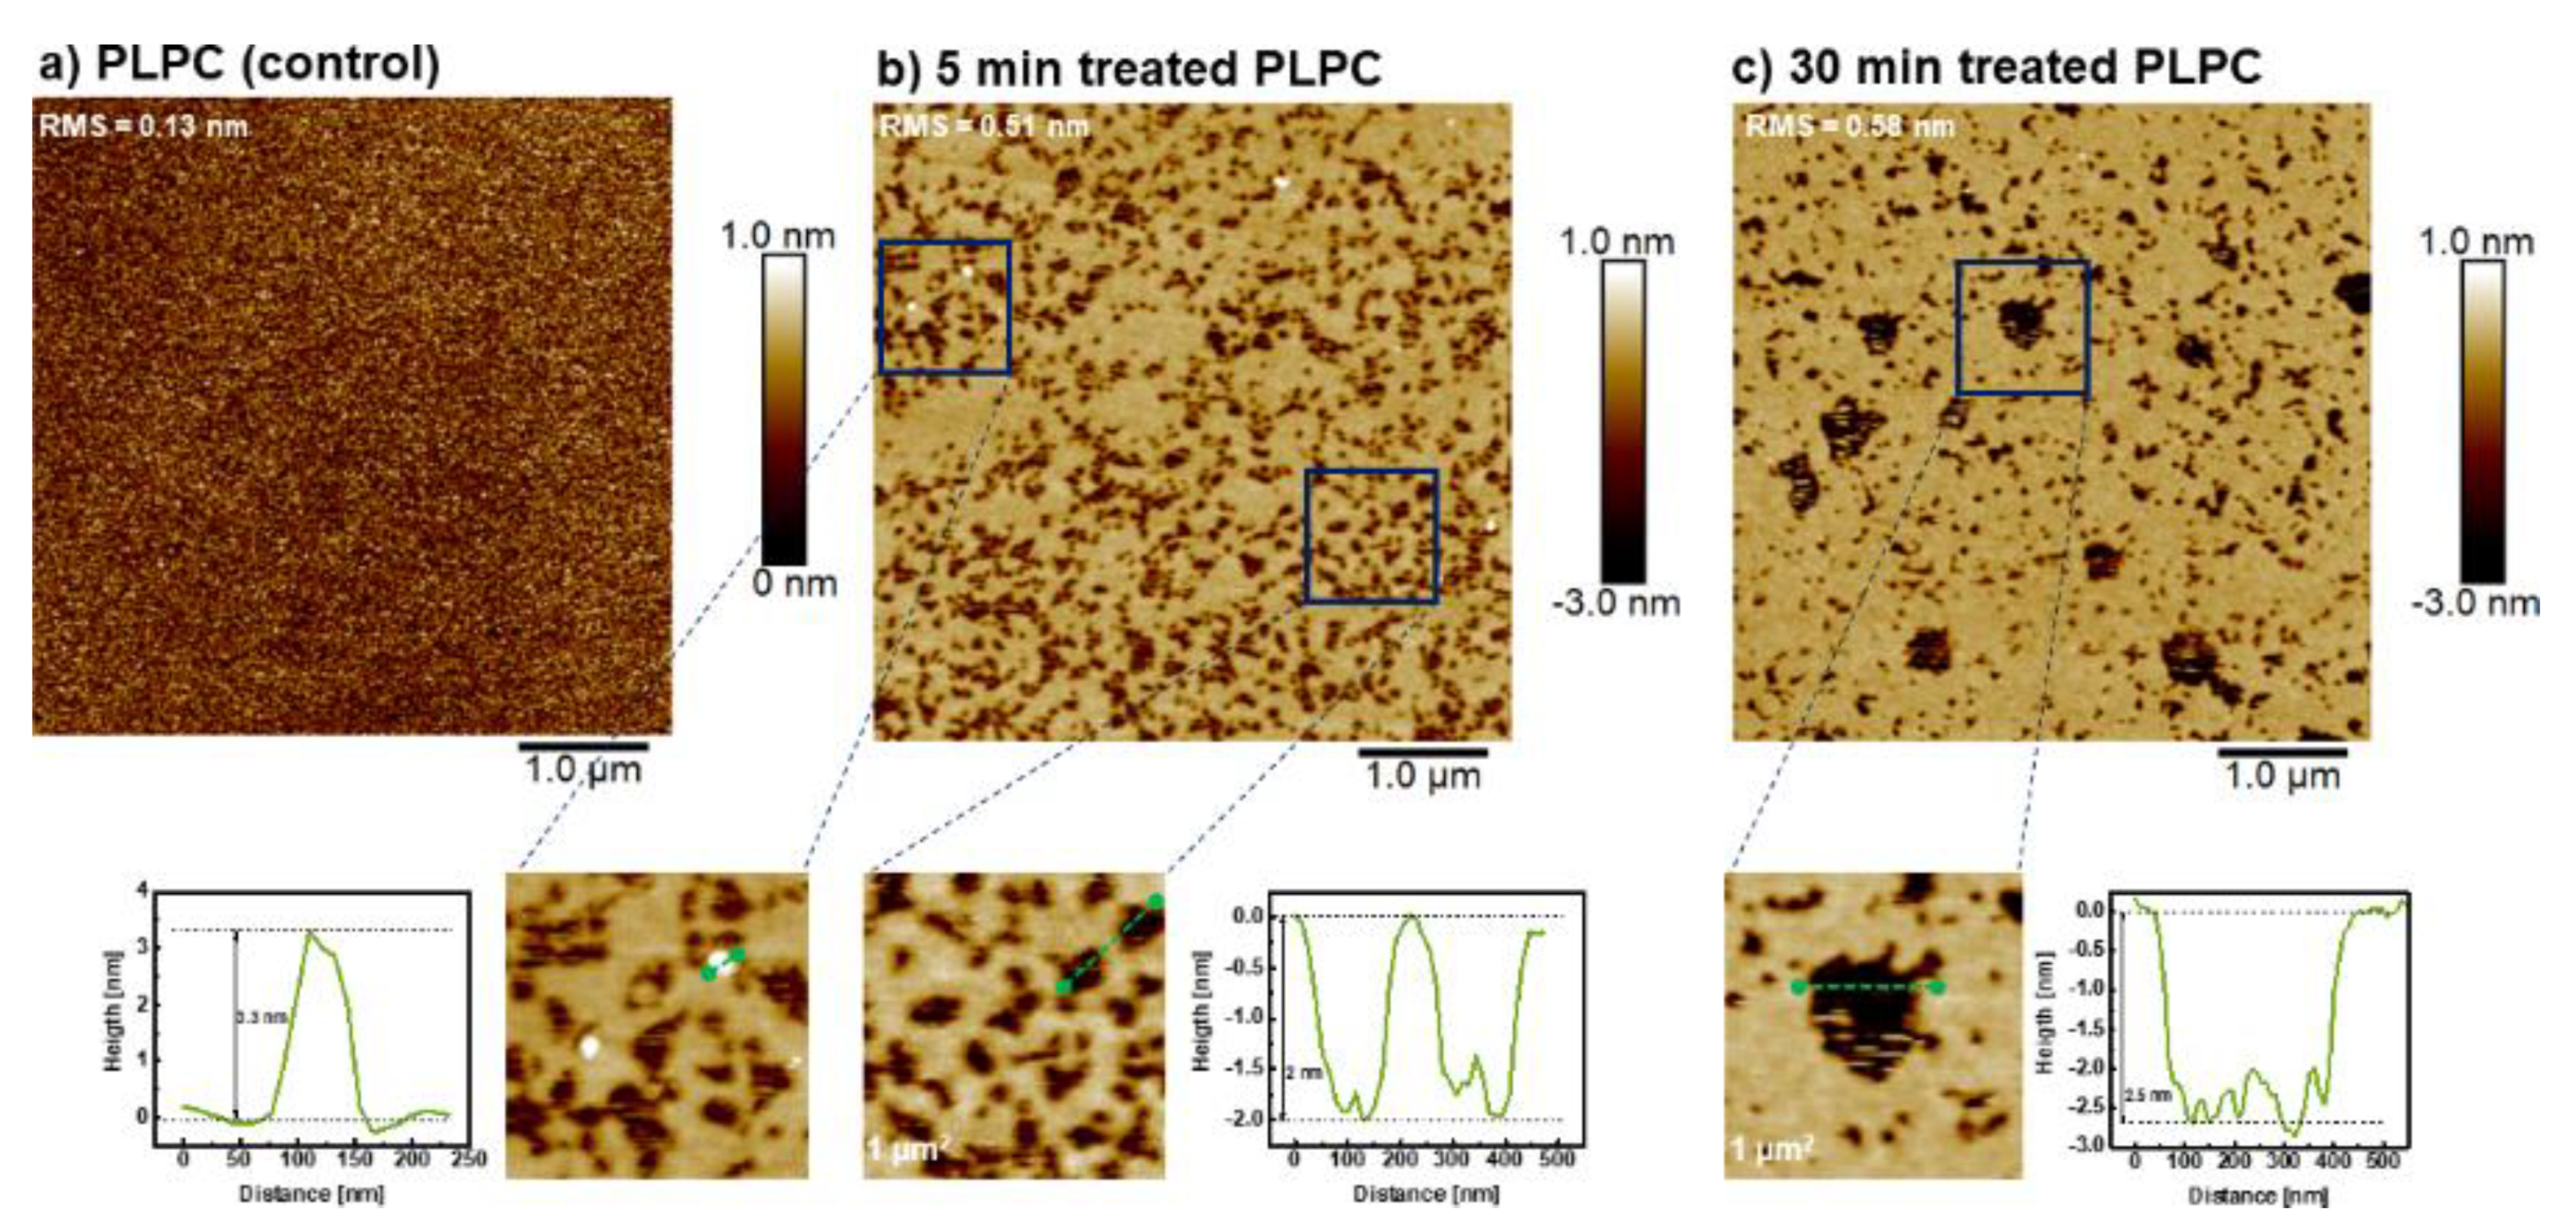
3.4. Effect of ROS on Model Eye Lens Cell Membrane in Presence and Absence of SM: Atomic Force Microscopy

Mass spectrometry results showed that PLPC was substantially more oxidized by plasma-derived ROS than SM. By imaging the supported lipid membrane with AFM, corresponding changes in the membranes physical structure were searched. The topographic images of substrate (Figure S2) and supported lipid bilayers with different fraction of SM before and after plasma treatments were recorded (Figure 6a–i) in 50 mM phosphate buffer solution. Here, a silicon substrate was used because the dimensions of the gold electrode were not suitable for the AFM. Topographic images of lipid bilayers before plasma treatment (control) confirmed the homogeneous coverage of silicon substrate by the model lipid bilayers (Figure 6a,d,g). The change of substrate can affect the morphology of the inner leaflet of the lipid bilayer and the amount of water between the substrate and the lipid bilayer. However, since both the silicon and polycrystalline gold are hydrophilic surfaces, and in addition, the plasma treatments were performed from above and the first interaction site of the reactive species is the outer leaflet of the lipid bilayer, it is assumed that the change of substrates has no significant effect on the protective role of SM in this study. For PLPC bilayers pore formation and bilayer degradation were observed after 5 min, which got more pronounced after 30 min (Figure 6b,c). However, if the bilayer consisted of 25% SM and 75% PLPC in 25% of investigated area of SLB, partial bilayer degradation was observed after 30 min of plasma treatment of PLPC/SM bilayers (Figure 6f). Importantly, no change was observed in topographic images of SLBs with 75% SM even after 30 min (Figure 6g–i).
The roughness (rms) of PLPC lipid bilayer was 0.13, 0.51 and 0.58 nm before and after 5 and 30 min plasma treatments, respectively. CPP derived reactive species yielded to the formation of an inhomogeneous surface (Figure 7b,c). Interestingly, pores were observed. The pores grew (Figure 7b,c) with longer treatment time, and both diameter and depth increased. In addition, several white patches were observed at the surface of lipid bilayer, indicating protrusion formation with the height of 3.3 nm in PLPC lipid bilayer. Qualitatively, protrusions were more often observed after short-time treatments, similar to experiments reported by Tero et al. [56]. The mechanism of formation and positive curvature of protrusion can be explained by accumulation of fatty aldehydes released from lipids in hydrophobic core of membrane during attack of reactive species, such as OH and O2 to lipid bilayer and formation of truncated-chain lipid (Figure 8). The formed protrusion can be considered as a precursor for pore formation during long-term treatments [56,57]. Notably, no significant pore formation and lipid degradation was observed in PLPC/SM (3:1) bilayers after 5 min treatment. Only slight lipid degradation with pore diameter of less than 100 nm was observed in 25% of investigated area of lipid bilayer (Figure S3). After 30 min treatment, the surface roughness was somewhat increased to 0.17 nm. PLPC/SM (1:3) supported lipid bilayers remained unchanged even after 30 min plasma treatment. To confirm the presence of a bilayer at the surface of the silicon and to exclude confusion due to similar roughness of lipid bilayer and substrate, rupture and pore formation in the SLB were induced by exposure to air and subsequently monitored (Figure S4). The AFM images complement and confirm the protective effect of SM in PLPC bilayers observed with electrochemistry and mass spectroscopy. Pore formation occurs when a high amount of lipid aldehydes such as PoxnoPC is produced during the oxidation of the lipid bilayer, which was only achieved during treatment of the PLPC lipid bilayer without SM as demonstrated by mass spectrometry (cf. Figure 3 and Figure 5) [84]. The absence of membrane degradation and pore formation in the presence of SM within the PLPC bilayer during the AFM studies is attributed to the fact that less oxidation occurred. The effects of CPP treatment of PLPC bilayers observed with AFM (pores and increased roughness) explain the increased peak current observed with electrochemistry.

4. Conclusions

In the present study, the protective role of a higher fraction of SM in a model eye lens cell membrane against oxidative stress was studied on a macroscopic (by electrochemistry), molecular (by HR-mass spectrometry), and on nm (by AFM) level. PLPC bilayers with three different fractions of SM were investigated. CPP-derived reactive species were used to mimic the main reactive species in the eye such as OH, O2, and H2O2, especially during cataract formation. The results provide some insights into the mechanism of oxidative damage in human eye lens cell membrane and show the protective role of SM. The suggested molecular mechanism is consistent with literature (increasing the membrane cohesion due to hydrogen bonding of SM head groups with other lipid head groups) [71]. The dependence of membrane protection on SM fraction is consistent with the idea about the molecular mechanisms which the aging eye uses to keep lens transparency and to protect the eye against penetration of reactive species and oxidative stress. Note that the aging eye lacks a strong antioxidative system. Furthermore, the results indicate that a high amount of lipid aldehydes in a model membrane is necessary for pore formation. However, it should be considered that increasing the conformational order of hydrocarbon chains may have negative effects on membrane ion channels and the function of membrane proteins. The role of SM in the function of transmembrane proteins and ion channels in model human eye lens will be the subject of our future investigations.

Supplementary Materials

The following are available online at https://www.mdpi.com/2218-273X/11/2/276/s1, Figure S1: Differential pulse voltammograms of 10 mM K4[Fe(CN)6] in 50 mM phosphate buffer at bare gold electrode (GE) and before and after 30 min plasma treatments of PLPC lipid bilayers with different fractions of SM; Figure S2: AFM image (5.0 × 5.0 μm2) of silicon substrate after RCA cleaning; Figure S3: AFM images of supported PLPC:SM (3:1) bilayers after 30 min plasma treatment. Bottom row: The images are magnifications of the indicated areas. Histograms along the black lines demonstrate the depth of the pores. Experimental conditions as in Figure 6; Figure S4: Fig. S4. AFM images of supported PLPC:SM (1:3) bilayers after exposure to air. Bottom row: The images are magnifications of the indicated areas. Histograms along the green line demonstrate the depth of the pores. Experi-mental conditions as in Figure 6.

Author Contributions

M.R., H.K., M.F. and K.W. conceived and designed the experiments. M.R. performed electrochemical experiments. M.R., M.F. and G.C. and K.W. designed and performed mass spectrometry experiments (sample preparation and LC/MS/MS analysis). M.R., A.A. and C.A.H. performed and analyzed the AFM experiments. M.R. wrote the first draft of the manuscript and all authors were involved in reviewing and editing of the manuscript. All authors have read and agreed to the published version of the manuscript.

Funding

This work was funded by the Deutsche Forschungsgemeinschaft (DFG, German Research Foundation) 231396381/GRK1947 for M.R., H.K. and C.A.H. The EU (H2020 project MASSTRPLAN 675132 to M.F.) and the German Federal Ministry of Education and Research (BMBF) (03Z22DN12 to K.W.; 03Z22CI1 to C.A.H. and others; within the framework of the e:Med research and funding concept for SysMedOS project to M.F.) are gratefully acknowledged.

Institutional Review Board Statement

Not applicable.

Informed Consent Statement

Not applicable.

Data Availability Statement

Data will be available on request.

Acknowledgments

The authors are grateful to the technical assistance of Seyedali Memari (Leibniz-Institute for Plasma Science and Technology). The authors thank Mihaela Delcea and Sanjai Karanth (University of Greifswald) for providing the Zetasizer instrument. M.F. and G.C. thank Ralf Hoffmann (Institute of Bioanalytical Chemistry, University of Leipzig) for providing access to his laboratory.

Conflicts of Interest

The authors declare no competing interests.

References

  1. Babizhayev, M.A.; Yegorov, Y.E. Reactive oxygen species and the aging eye: Specific role of metabolically active mitochondria in maintaining lens function and in the initiation of the oxidation-induced maturity onset cataract—A novel platform of mitochondria-targeted antioxidants with broad therapeutic potential for redox regulation and detoxification of oxidants in eye diseases. Am. J. Ther. 2016, 23, e98–e117. [Google Scholar] [CrossRef]
  2. Flatt, T. A new definition of aging? Front. Genet. 2012, 3, 148. [Google Scholar] [CrossRef] [Green Version]
  3. Liguori, I.; Russo, G.; Curcio, F.; Bulli, G.; Aran, L.; Della-Morte, D.; Gargiulo, G.; Testa, G.; Cacciatore, F.; Bonaduce, D.; et al. Oxidative stress, aging, and diseases. Clin. Interv. Aging 2018, 13, 757–772. [Google Scholar] [CrossRef] [Green Version]
  4. Beckman, K.B.; Ames, B.N. The free radical theory of aging matures. Physiol. Rev. 1998, 78, 547–581. [Google Scholar] [CrossRef] [Green Version]
  5. Truscott, R.J. Age-related nuclear cataract-oxidation is the key. Exp. Eye Res. 2005, 80, 709–725. [Google Scholar] [CrossRef]
  6. D’Avanzo, N. Lipid regulation of sodium channels. Curr. Top. Membr. 2016, 78, 353–407. [Google Scholar] [CrossRef]
  7. Liu, K.; Han, D.N.; Huang, S.H.; Fang, D.J. Enzyme-modified microelectrodes for electrochemical detection of sphingomyelin in the plasma membranes of single cells. Electrochem. Commun. 2020, 112. [Google Scholar] [CrossRef]
  8. Talbott, C.M.; Vorobyov, I.; Borchman, D.; Taylor, K.G.; DuPre, D.B.; Yappert, M.C. Conformational studies of sphingolipids by NMR spectroscopy. II. Sphingomyelin. Biochim. Biophys. Acta BBA Biomembranes. 2000, 1467, 326–337. [Google Scholar] [CrossRef] [Green Version]
  9. Borchman, D.; Byrdwell, W.C.; Yappert, M.C. Regional and age-dependent differences in the phospholipid composition of human lens membranes. Invest. Ophthalmol. Vis. Sci. 1994, 35, 3938–3942. [Google Scholar] [PubMed]
  10. Perry, R.H.; Borchman, D.; Byrdwell, W.C. Changes in the phospholipid composition of the human lens with age and cataract formation. Invest. Ophthalmol. Vis. Sci. 2003, 44, U534. [Google Scholar]
  11. Borchman, D.; Yappert, M.C. Age-related lipid oxidation in human lenses. Invest. Ophthalmol. Vis. Sci. 1998, 39, 1053–1058. [Google Scholar]
  12. Borchman, D.; Foulks, G.N.; Yappert, M.C.; Milliner, S.E. Changes in human meibum lipid composition with age using nuclear magnetic resonance spectroscopy. Invest. Ophthalmol. Vis. Sci. 2012, 53, 475–482. [Google Scholar] [CrossRef] [PubMed]
  13. Cavallotti, C.; Cerulli, L. Age-Related Changes of the Human Eye; Humana Press: Totowa, NJ, USA, 2008; p. 410. [Google Scholar]
  14. Perluigi, M.; Di Domenico, F.; Giorgi, A.; Schinina, M.E.; Coccia, R.; Cini, C.; Bellia, F.; Cambria, M.T.; Cornelius, C.; Butterfield, D.A.; et al. Redox proteomics in aging rat brain: Involvement of mitochondrial reduced glutathione status and mitochondrial protein oxidation in the aging process. J. Neurosci. Res. 2010, 88, 3498–3507. [Google Scholar] [CrossRef] [PubMed]
  15. Borchman, D.; Yappert, M.C.; Afzal, M. Lens lipids and maximum lifespan. Exp. Eye Res. 2004, 79, 761–768. [Google Scholar] [CrossRef]
  16. Shichi, H. Cataract formation and prevention. Expert Opin. Investig. Drugs 2004, 13, 691–701. [Google Scholar] [CrossRef]
  17. Berthoud, V.M.; Beyer, E.C. Oxidative stress, lens gap junctions, and cataracts. Antioxid. Redox Signal. 2009, 11, 339–353. [Google Scholar] [CrossRef] [PubMed] [Green Version]
  18. Shen, Y.X.; Saboe, P.O.; Sines, I.T.; Erbakan, M.; Kumar, M. Biomimetic membranes: A review. J. Membr. Sci. 2014, 454, 359–381. [Google Scholar] [CrossRef]
  19. Kornberg, R.D.; McConnell, H.M. Inside-outside transitions of phospholipids in vesicle membranes. Biochemistry 1971, 10, 1111–1120. [Google Scholar] [CrossRef]
  20. Hamai, C.; Yang, T.; Kataoka, S.; Cremer, P.S.; Musser, S.M. Effect of average phospholipid curvature on supported bilayer formation on glass by vesicle fusion. Biophys. J. 2006, 90, 1241–1248. [Google Scholar] [CrossRef] [Green Version]
  21. Pautot, S.; Frisken, B.J.; Weitz, D.A. Engineering asymmetric vesicles. Proc. Natl. Acad. Sci. USA 2003, 100, 10718–10721. [Google Scholar] [CrossRef] [Green Version]
  22. Dimova, R.; Marques, C. The Giant Vesicle Book; CRC Press, Taylor & Francis Group: Boca Raton, FL, USA, 2019. [Google Scholar]
  23. Lipkowski, J. Building biomimetic membrane at a gold electrode surface. Phys. Chem. Chem. Phys. 2010, 12, 13874–13887. [Google Scholar] [CrossRef] [PubMed]
  24. Sackmann, E. Supported membranes: Scientific and practical applications. Science 1996, 271, 43–48. [Google Scholar] [CrossRef]
  25. Groves, J.T.; Ulman, N.; Boxer, S.G. Micropatterning fluid lipid bilayers on solid supports. Science 1997, 275, 651–653. [Google Scholar] [CrossRef]
  26. Mueller, P.; Rudin, D.O.; Tien, H.T.; Wescott, W.C. Reconstitution of cell membrane structure in vitro and its transformation into an excitable system. Nature 1962, 194, 979–980. [Google Scholar] [CrossRef]
  27. Jeong, D.W.; Jang, H.; Choi, S.Q.; Choi, M.C. Enhanced stability of freestanding lipid bilayer and its stability criteria. Sci. Rep. 2016, 6, 38158. [Google Scholar] [CrossRef] [Green Version]
  28. Simons, K.; Vaz, W.L. Model systems, lipid rafts, and cell membranes. Annu. Rev. Biophys. Biomol. Struct. 2004, 33, 269–295. [Google Scholar] [CrossRef]
  29. Bloom, M.; Evans, E.; Mouritsen, O.G. Physical-properties of the fluid lipid-bilayer component of cell-membranes—A perspective. Q. Rev. Biophys. 1991, 24, 293–397. [Google Scholar] [CrossRef] [PubMed]
  30. Kurniawan, J.; De Souza, J.F.V.; Dang, A.T.; Liu, G.Y.; Kuhl, T.L. Preparation and characterization of solid-supported lipid bilayers formed by langmuir-blodgett deposition: A tutorial. Langmuir 2018, 34, 15622–15639. [Google Scholar] [CrossRef] [Green Version]
  31. Mingeot-Leclercq, M.P.; Deleu, M.; Brasseur, R.; Dufrene, Y.F. Atomic force microscopy of supported lipid bilayers. Nat. Protoc. 2008, 3, 1654–1659. [Google Scholar] [CrossRef] [PubMed]
  32. Cho, N.J.; Frank, C.W.; Kasemo, B.; Hook, F. Quartz crystal microbalance with dissipation monitoring of supported lipid bilayers on various substrates. Nat. Protoc. 2010, 5, 1096–1106. [Google Scholar] [CrossRef] [PubMed]
  33. Lee, T.H.; Hirst, D.J.; Kulkarni, K.; Del Borgo, M.P.; Aguilar, M.I. Exploring molecular-biomembrane interactions with surface plasmon resonance and dual polarization interferometry technology: Expanding the spotlight onto biomembrane structure. Chem. Rev. 2018, 118, 5392–5487. [Google Scholar] [CrossRef] [PubMed]
  34. Ferhan, A.R.; Yoon, B.K.; Park, S.; Sut, T.N.; Chin, H.; Park, J.H.; Jackman, J.A.; Cho, N.J. Solvent-assisted preparation of supported lipid bilayers. Nat. Protoc. 2019, 14, 2091–2118. [Google Scholar] [CrossRef] [PubMed]
  35. Richter, R.P.; Berat, R.; Brisson, A.R. Formation of solid-supported lipid bilayers: An integrated view. Langmuir 2006, 22, 3497–3505. [Google Scholar] [CrossRef]
  36. Chan, Y.H.M.; Boxer, S.G. Model membrane systems and their applications. Curr. Opin. Chem. Biol. 2007, 11, 581–587. [Google Scholar] [CrossRef] [PubMed] [Green Version]
  37. Lloyd, R.V.; Hanna, P.M.; Mason, R.P. The origin of the hydroxyl radical oxygen in the Fenton reaction. Free Radic. Bio. Med. 1997, 22, 885–888. [Google Scholar] [CrossRef]
  38. Miller, C.J.; Rose, A.L.; Waite, T.D. Importance of iron complexation for fenton-mediated hydroxyl radical production at circumneutral pH. Front. Mar. Sci. 2016, 3. [Google Scholar] [CrossRef]
  39. Attri, P.; Kim, Y.H.; Park, D.H.; Park, J.H.; Hong, Y.J.; Uhm, H.S.; Kim, K.N.; Fridman, A.; Choi, E.H. Generation mechanism of hydroxyl radical species and its lifetime prediction during the plasma-initiated ultraviolet (UV) photolysis. Sci. Rep. 2015, 5, 9332. [Google Scholar] [CrossRef]
  40. Nakamura, K.; Shirato, M.; Tenkumo, T.; Kanno, T.; Westerlund, A.; Ortengren, U.; Sasaki, K.; Niwano, Y. Hydroxyl radicals generated by hydrogen peroxide photolysis recondition biofilm-contaminated titanium surfaces for subsequent osteoblastic cell proliferation. Sci. Rep. 2019, 9, 4688. [Google Scholar] [CrossRef] [PubMed]
  41. Laroussi, M.; Fridman, A. Plasma medicine. Plasma Process. Polym. 2008, 5, 501. [Google Scholar] [CrossRef]
  42. Weltmann, K.D.; von Woedtke, T. Plasma medicine-current state of research and medical application. Plasma Phys. Control Fusion. 2017, 59, 014031. [Google Scholar] [CrossRef]
  43. Nasri, Z.; Bruno, G.; Bekeschus, S.; Weltmann, K.-D.; von Woedtke, T.; Wende, K. Development of an electrochemical sensor for in-situ monitoring of reactive species produced by cold physical plasma. Sens. Actuators B Chem. 2021, 326. [Google Scholar] [CrossRef]
  44. Bernhardt, T.; Semmler, M.L.; Schafer, M.; Bekeschus, S.; Emmert, S.; Boeckmann, L. Plasma medicine: Applications of cold atmospheric pressure plasma in dermatology. Oxid. Med. Cell Longev. 2019, 2019, 3873928. [Google Scholar] [CrossRef] [Green Version]
  45. Assadian, O.; Ousey, K.J.; Daeschlein, G.; Kramer, A.; Parker, C.; Tanner, J.; Leaper, D.J. Effects and safety of atmospheric low-temperature plasma on bacterial reduction in chronic wounds and wound size reduction: A systematic review and meta-analysis. Int. Wound J. 2019, 16, 103–111. [Google Scholar] [CrossRef] [Green Version]
  46. Dai, X.; Bazaka, K.; Richard, D.J.; Thompson, E.R.W.; Ostrikov, K.K. The emerging role of gas plasma in oncotherapy. Trends Biotechnol. 2018, 36, 1183–1198. [Google Scholar] [CrossRef]
  47. Dubuc, A.; Monsarrat, P.; Virard, F.; Merbahi, N.; Sarrette, J.-P.; Laurencin-Dalicieux, S.; Cousty, S. Use of cold-atmospheric plasma in oncology: A concise systematic review. Ther. Adv. Med. Oncol. 2018, 10, 1758835918786475. [Google Scholar] [CrossRef]
  48. Keidar, M. A prospectus on innovations in the plasma treatment of cancer. Phys. Plasmas 2018, 25, 083504. [Google Scholar] [CrossRef]
  49. Semmler, M.L.; Bekeschus, S.; Schafer, M.; Bernhardt, T.; Fischer, T.; Witzke, K.; Seebauer, C.; Rebl, H.; Grambow, E.; Vollmar, B.; et al. Molecular mechanisms of the efficacy of cold atmospheric pressure plasma (CAP) in cancer treatment. Cancers 2020, 12. [Google Scholar] [CrossRef] [Green Version]
  50. Kim, G.C.; Lee, H.W.; Byun, J.H.; Chung, J.; Jeon, Y.C.; Lee, J.K. Dental applications of low-temperature nonthermal plasmas. Plasma Process. Polym. 2013, 10, 199–206. [Google Scholar] [CrossRef]
  51. Privat-Maldonado, A.; Schmidt, A.; Lin, A.; Weltmann, K.D.; Wende, K.; Bogaerts, A.; Bekeschus, S. ROS from physical plasmas: Redox chemistry for biomedical therapy. Oxid. Med. Cell Longev. 2019, 2019, 9062098. [Google Scholar] [CrossRef] [Green Version]
  52. Busco, G.; Fasani, F.; Dozias, S.; Ridou, L.; Douat, C.; Pouvesle, J.; Robert, E.; Grillon, C. Changes in oxygen level upon cold plasma treatments: Consequences for RONS production. IEEE Trans. Radiat. Plasma Med. Sci. 2018, 2, 147–152. [Google Scholar] [CrossRef]
  53. Reuter, S.; von Woedtke, T.; Weltmann, K.D. The kINPen—A review on physics and chemistry of the atmospheric pressure plasma jet and its applications. J. Phys. D Appl. Phys. 2018, 51. [Google Scholar] [CrossRef] [Green Version]
  54. Breden, D.; Raja, L.L. Computational study of the interaction of cold atmospheric helium plasma jets with surfaces. Plasma Sources Sci. Technol. 2014, 23. [Google Scholar] [CrossRef] [Green Version]
  55. Groning, A.; Ahrens, H.; Ortmann, T.; Lawrenz, F.; Brezesinski, G.; Scholz, F.; Helm, C.A. Molecular mechanisms of phosphatidylcholine monolayer solidification due to hydroxyl radicals. Soft Matter 2011, 7, 6467–6476. [Google Scholar] [CrossRef] [Green Version]
  56. Tero, R.; Yamashita, R.; Hashizume, H.; Suda, Y.; Takikawa, H.; Hori, M.; Ito, M. Nanopore formation process in artificial cell membrane induced by plasma-generated reactive oxygen species. Arch. Biochem. Biophys. 2016, 605, 26–33. [Google Scholar] [CrossRef] [Green Version]
  57. Tero, R.; Suda, Y.; Kato, R.; Tanoue, H.; Takikawa, H. Plasma irradiation of artificial cell membrane system at solid-liquid interface. Appl. Phys. Express 2014, 7, 077001. [Google Scholar] [CrossRef]
  58. Scholz, F.; de Lopez Lara Gonzalez, G.; de Machado Carvalho, L.; Hilgemann, M.; Brainina, K.Z.; Kahlert, H.; Jack, R.S.; Minh, D.T. Indirect electrochemical sensing of radicals and radical scavengers in biological matrices. Angew. Chem. Int. Ed. Engl. 2007, 46, 8079–8081. [Google Scholar] [CrossRef] [PubMed]
  59. Ravandeh, M.; Thal, D.; Kahlert, H.; Wende, K.; Lalk, M. Self-assembled mono- and bilayers on gold electrodes to assess antioxidants—a comparative study. J. Solid State Electrochem. 2020. [Google Scholar] [CrossRef]
  60. Barroso, M.F.; Luna, M.A.; Moyano, F.; Delerue-Matos, C.; Correa, N.M.; Molina, P.G. Study of lipid peroxidation and ascorbic acid protective role in large unilamellar vesicles from a new electrochemical performance. Bioelectrochemistry 2018, 120, 120–126. [Google Scholar] [CrossRef] [Green Version]
  61. Coliva, G.; Lange, M.; Colombo, S.; Chervet, J.-P.; Domingues, M.R.; Fedorova, M. Sphingomyelins prevent propagation of lipid peroxidation—LC-MS/MS evaluation of inhibition mechanisms. Molecules 2020, 25, 1925. [Google Scholar] [CrossRef] [Green Version]
  62. Yusupov, M.; Wende, K.; Kupsch, S.; Neyts, E.C.; Reuter, S.; Bogaerts, A. Effect of head group and lipid tail oxidation in the cell membrane revealed through integrated simulations and experiments. Sci. Rep. 2017, 7, 5761. [Google Scholar] [CrossRef]
  63. Reis, A.; Domingues, P.; Ferrer-Correia, A.J.; Domingues, M.R. Tandem mass spectrometry of intact oxidation products of diacylphosphatidylcholines: Evidence for the occurrence of the oxidation of the phosphocholine head and differentiation of isomers. J. Mass Spectrom. 2004, 39, 1513–1522. [Google Scholar] [CrossRef] [PubMed]
  64. Hermes, M.; Scholz, F.; Hardtner, C.; Walther, R.; Schild, L.; Wolke, C.; Lendeckel, U. Electrochemical signals of mitochondria: A new probe of their membrane properties. Angew. Chem. Int. Ed. Engl. 2011, 50, 6872–6875. [Google Scholar] [CrossRef] [PubMed]
  65. Dharmaraj, K.; Roman Silva, J.I.; Kahlert, H.; Lendeckel, U.; Scholz, F. The acid-base and redox properties of menaquinone MK-4, MK-7, and MK-9 (vitamin K2) in DMPC monolayers on mercury. Eur. Biophys. J. 2020, 49, 279–288. [Google Scholar] [CrossRef]
  66. Ravandeh, M.; Kahlert, H.; Jablonowski, H.; Lackmann, J.W.; Striesow, J.; Agmo Hernandez, V.; Wende, K. A combination of electrochemistry and mass spectrometry to monitor the interaction of reactive species with supported lipid bilayers. Sci. Rep. 2020, 10, 18683. [Google Scholar] [CrossRef] [PubMed]
  67. Widomska, J.; Subczynski, W.K.; Mainali, L.; Raguz, M. Cholesterol bilayer domains in the eye lens health: A review. Cell Biochem. Biophys. 2017, 75, 387–398. [Google Scholar] [CrossRef] [PubMed]
  68. Huang, L.; Grami, V.; Marrero, Y.; Tang, D.; Yappert, M.C.; Rasi, V.; Borchman, D. Human lens phospholipid changes with age and cataract. Invest. Ophthalmol. Vis. Sci. 2005, 46, 1682–1689. [Google Scholar] [CrossRef]
  69. Yappert, M.C.; Rujoi, M.; Borchman, D.; Vorobyov, I.; Estrada, R. Glycero-versus sphingo-phospholipids: Correlations with human and non-human mammalian lens growth. Exp. Eye Res. 2003, 76, 725–734. [Google Scholar] [CrossRef]
  70. Deeley, J.M.; Hankin, J.A.; Friedrich, M.G.; Murphy, R.C.; Truscott, R.J.; Mitchell, T.W.; Blanksby, S.J. Sphingolipid distribution changes with age in the human lens. J. Lipid Res. 2010, 51, 2753–2760. [Google Scholar] [CrossRef] [Green Version]
  71. Borchman, D.; Yappert, M.C. Lipids and the ocular lens. J. Lipid Res. 2010, 51, 2473–2488. [Google Scholar] [CrossRef] [Green Version]
  72. Byrdwell, W.C.; Borchman, D. Liquid chromatography/mass-spectrometric characterization of sphingomyelin and dihydrosphingomyelin of human lens membranes. Ophthalmic Res. 1997, 29, 191–206. [Google Scholar] [CrossRef] [PubMed]
  73. Deeley, J.M.; Mitchell, T.W.; Wei, X.; Korth, J.; Nealon, J.R.; Blanksby, S.J.; Truscott, R.J. Human lens lipids differ markedly from those of commonly used experimental animals. Biochim. Biophys. Acta 2008, 1781, 288–298. [Google Scholar] [CrossRef] [PubMed] [Green Version]
  74. Kagan, V.E. Lipid Peroxidation in Biomembranes; CRC Press: Boca Raton, FL, USA, 2018. [Google Scholar]
  75. Martensson, C.; Agmo Hernandez, V. Ubiquinone-10 in gold-immobilized lipid membrane structures acts as a sensor for acetylcholine and other tetraalkylammonium cations. Bioelectrochemistry 2012, 88, 171–180. [Google Scholar] [CrossRef] [PubMed] [Green Version]
  76. Thal, D.; Kahlert, H.; Chinnaya, J.; Ahrens, P.; Hasse, U. Impact of gold-1-decanethiol-SAM formation and removal cycles on the surface properties of polycrystalline gold and SAM quality. J. Solid State Electrochem. 2018, 22, 1149–1154. [Google Scholar] [CrossRef]
  77. Sill, A.; Nestler, P.; Azinfar, A.; Helm, C.A. Tailorable polyanion diffusion coefficient in LbL films: The role of polycation molecular weight and polymer conformation. Macromolecules 2019, 52, 9045–9052. [Google Scholar] [CrossRef]
  78. Kern, W. The evolution of silicon-wafer cleaning technology. J. Electrochem. Soc. 1990, 137, 1887–1892. [Google Scholar] [CrossRef]
  79. Chiu, S.W.; Vasudevan, S.; Jakobsson, E.; Mashl, R.J.; Scott, H.L. Structure of sphingomyelin bilayers: A simulation study. Biophys. J. 2003, 85, 3624–3635. [Google Scholar] [CrossRef] [Green Version]
  80. Burgess, I.; Li, M.; Horswell, S.L.; Szymanski, G.; Lipkowski, J.; Majewski, J.; Satija, S. Electric field-driven transformations of a supported model biological membrane—An electrochemical and neutron reflectivity study. Biophys. J. 2004, 86, 1763–1776. [Google Scholar] [CrossRef] [Green Version]
  81. Bard, A.J.; Inzelt, G.R.; Scholz, F. Electrochemical Dictionary, 2nd ed.; Springer: Berlin/Heidelberg, Germany, 2012; p. 991. [Google Scholar]
  82. Oborina, E.M.; Yappert, M.C. Effect of sphingomyelin versus dipalmitoylphosphatidylcholine on the extent of lipid oxidation. Chem. Phys. Lipids 2003, 123, 223–232. [Google Scholar] [CrossRef]
  83. Hammer, M.U.; Forbrig, E.; Kupsch, S.; Weltmann, K.-D.; Reuter, S. Influence of plasma treatment on the structure and function of lipids. Plasma Med. 2013, 3, 97–114. [Google Scholar] [CrossRef]
  84. Van der Paal, J.; Neyts, E.C.; Verlackt, C.C.W.; Bogaerts, A. Effect of lipid peroxidation on membrane permeability of cancer and normal cells subjected to oxidative stress. Chem. Sci. 2016, 7, 489–498. [Google Scholar] [CrossRef] [Green Version]
Figure 1. Cyclic voltammograms (CVs) of 10 mM K4[Fe(CN)6] in 50 mM phosphate buffer solution (scan rate 50 mV · s−1) for bare gold electrode (GE, black curve) and after formation of PLPC (PLPC, red curve), PLPC:SM (3:1, blue curve), and PLPC:SM (1:3, green curve) lipid bilayers, respectively.
Biomolecules 11 00276 g001
Figure 2. Normalized recovery peak currents of ferrocyanide/ferricyanide redox system determined by differential pulse voltammetry of lipid bilayers on gold electrodes before (Icov) and after 30 min plasma treatment (It) (n = 3). Varied is the SM fraction in PLPC bilayers. Each system is normalized with respect to the peak current of the redox system for the bare gold electrode Ig.
Biomolecules 11 00276 g002
Figure 3. The relative intensity for different PLPC oxidation products obtained from lipid bilayers with different SM fraction after 30 min plasma treatment (Treated) and after auto-oxidation (Control) (n = 3). Data were obtained by HR-mass spectroscopy. The relative intensity of each lipid peroxidation product (LPP) is calculated as the peak area of LPP divided by the peak area of unmodified PLPC in the same sample. Note that the different graphs have different scaling of the y-axis. 1-Palmitoyl-2-hydroxy-sn-glycero-3-phosphocholine and 1-palmitoyl-2-(9′-oxo-nonanoyl)-sn-glycero-3-phosphocholine were presented as LysoPC and PoxnoPC, respectively.
Biomolecules 11 00276 g003
Figure 4. The relative intensity for different SM oxidation products obtained from lipid bilayers with different SM fraction after 30 min plasma treatments (Treated) and after auto oxidation (Control) (n = 3). Relative intensity of each lipid peroxidation product (LPP) is calculated as the peak area of LPP divided by the peak area of unmodified SM in the same sample. Note that the different graphs have different scaling of the y-axis.
Biomolecules 11 00276 g004
Figure 5. Total oxidation of PLPC (a) and SM (b) after 30 min plasma treatment of lipid bilayers with different SM fraction (indicated “Treated”) and without treatment (indicated “Control”) (n = 3). Total oxidation is defined as the sum of lipid peroxidation product (LPP) peak areas quantified in each sample relative to the peak area of non-oxidized parent lipid. Note that the different graphs have different scaling of the y-axis.
Biomolecules 11 00276 g005
Figure 6. AFM images (5.0 × 5.0 µm2) of supported PLPC bilayers with different SM fractions before (left) and after plasma treatment for different duration (centre 5 min; right 30 min). Measurements were performed in 50 mM phosphate buffer solution at room temperature. Note the different height scale; the assignment of the height scales is (a, d, e, g, h, i: 0 to 1 nm), (b, c: −3 to 1 nm) and (f: 0 to 1.2 nm).
Biomolecules 11 00276 g006
Figure 7. AFM images of supported PLPC bilayers before (a), after 5 min; and (b) after 30 min; (c) plasma treatment. Bottom row: The images are magnifications of the indicated areas. Histograms along the green lines show the height of the protrusions (left), and the increasing depth of the pores with increasing treatment time. Experimental conditions as in Figure 6.
Biomolecules 11 00276 g007
Figure 8. Schematic of the experimental AFM setup and supported PLPC bilayers after plasma treatment. Shown are both a pore and a protrusion. Brown color indicates fragmented or oxidized PLPC molecules, blue color the native state.
Biomolecules 11 00276 g008
Table 1. Radius of PLPC liposomes with different SM molar fraction determined by DLS.
LiposomesMean Radius (nm)Standard Deviation (nm)
100 mol% PLPC76.31.2
75% mol% PLPC + 25% mol% SM75.80.7
25% mol% PLPC + 75% mol% SM96.11.2
Table 2. PLPC peroxidation products after 30 min plasma treatments of lipid bilayers, observed by HR-MS.
PLPC Peroxidation Productm/z (Positive Mode)
[LysoPC + H]+496.3403
[PoxnoPC + H]+650.4396
[PLPC + O − 2H + H]+772.5492
[PLPC + O + H]+774.5648
[PLPC + 2O − 4H + H]+786.5285
[PLPC + 2O − 2H + H]+788.5441
[PLPC + 2O − 2H + H]+790.5598
[PLPC + 2O − 2H + H]+804.5390
[PLPC + 3O + H]+806.5547
Publisher’s Note: MDPI stays neutral with regard to jurisdictional claims in published maps and institutional affiliations.

